Proceeding Paper

Fourier Transform Infrared Spectroscopy-Based Detection of Amoxicillin and Ampicillin for Advancing Antibiotic Monitoring with Optical Techniques †

by
Vinicius Pereira Anjos
1,2,*,
Maria Renata Valente Brandão Freire
1,
Raffaele Stasi
1,2,
Daniela Fátima Teixeira Silva
1 and
Denise Maria Zezell
1,2
1
Center for Lasers and Applications, Nuclear and Energy Research Institute, São Paulo 05508-000, Brazil
2
Nuclear and Energy Research Institute, University of São Paulo, São Paulo 05508-220, Brazil
*
Author to whom correspondence should be addressed.
Presented at the 4th International Electronic Conference on Antibiotics, 21–23 May 2025; Available online: https://sciforum.net/event/ECA2025.
Med. Sci. Forum 2025, 35(1), 7; https://doi.org/10.3390/msf2025035007
Published: 21 August 2025
(This article belongs to the Proceedings of The 4th International Electronic Conference on Antibiotics)

Abstract

Introduction: Amoxicillin and Ampicillin are among the most widely used antibiotics for treating bacterial infections. While traditional drug monitoring methods often face challenges relative to accuracy and analysis speed, optical-based techniques offer a promising alternative. Fourier Transform Infrared Spectroscopy (FTIR), a well-established tool, is particularly suited for this purpose. As their molecular structures and characteristic infrared absorption features are very similar, they could be difficult to differentiate using FTIR spectroscopy. Hence, chemometric analysis is important to overcome this challenge. This study introduces a novel approach to the standard methods of antibiotic detection and monitoring, leveraging the capabilities of vibrational spectroscopy and helping in antimicrobial stewardship. Attenuated Total Reflection (ATR)–FTIR is carried out with chemometric tools to investigate Amoxicillin and Ampicillin over different degradation processes. Principal Component Analysis (PCA) was used in the fingerprint region to detect differences between the studied antibiotics. Additionally, absorbance intensity in the fingerprint region was monitored to assess the degradation of each antibiotic over time. To achieve this, the area under the curve was calculated and subjected to inferential statistical tests for both intragroup (the degradation of the same antibiotic) and intergroup (degradation within the same time interval, comparing the two antibiotics) comparisons. All analyses were performed in OriginLab and using Python in the Google Colab and Orange environments. For the calculations of the limit of detection (LoD), the method based on the calibration curve was used. Through the experiments, it was possible to identify the fingerprints of each antibiotic and statistically separate them, despite both belonging to the same class of antibiotics, where the spectral peaks appear in the same region. For degradation, all tests were conducted with a significance level of α = 5%. In this investigation, our results show several quantification characteristics with a detection limit of 96.76 mM for Ampicillin and 66.01 mM for Amoxicillin using the peak intensity. This research demonstrates that FTIR spectroscopy is effective for antibiotic detection and has the potential to be further developed into a monitoring protocol.

1. Introduction

Poor-quality medicines represent a serious threat to global public health. The widespread presence of substandard antibiotic (ATB) drugs in low- and middle-income countries, combined with the rising number of defined daily doses, is an alarming issue [1,2]. The quality of drugs has always been a concern of the World Health Organization (WHO). Any health service is evidently affected without guaranteeing that these products meet the required quality, safety, and effectiveness standards [3,4].
The excessive use of ATBs is also reported in the occurrence of increased antimicrobial resistance. In this context, antimicrobial stewardship programs were created to promote the appropriate use of ATBs, optimize treatment outcomes, reduce adverse effects, and limit the development and spread of resistant bacteria [5,6]. ATB monitoring ensures the appropriate use of these pharmaceuticals, helping to prevent resistance and improve patient outcomes [7,8].
The application of Fourier Transform Infrared Spectroscopy (FTIR) stands out as an approach to ATB monitoring based on the interaction of light with the molecule. This spectroscopy can enable the effective identification of the ATB in clinical samples [9,10]. The absorption of infrared light, resulting from elevating the vibrational energy level to a higher level, provides detailed information about the molecular structure and interactions between molecules [11,12]. In order to assess antibiotic efficacy and identify resistance, clinical and pharmaceutical laboratories frequently use modern antibiotic quality control and monitoring techniques, such as broth microdilution, automated phenotypic systems, and antimicrobial susceptibility testing by disk diffusion [13,14]. However, these assays have limitations that affect their performance and applicability. Conventional methods such as chromatography and bioassays require complex sample preparation and longer processing times compared to FTIR, which is a non-destructive technique with minimal sample preparation and provides results within minutes. Although FTIR generally has higher detection limits than other techniques, the use of chemometric methods allows for the enhancement of its analytical performance [15], and this combination fills important gaps in the current antibiotic monitoring strategies by providing an effective supplementary technique that connects chemical stability evaluation and biological activity testing [16,17].
This study evaluated the potential of ATR-FTIR spectroscopy combined with chemometric tools to distinguish structurally similar beta-lactam antibiotics, monitored over acidic, thermal, and hydrolytic degradation over time, and established quantitative calibration models for ATB monitoring. The overarching goal is to contribute to more efficient optical-based ATB quality control and degradation assessment methods, giving support to antimicrobial stewardship.

2. Materials and Methods

2.1. Sample Preparation

Powder samples of Amoxicillin (AMX) at 365.38 g/mol (Multilab Indústria e Comércio de Produtos Farmacêuticos LTDA/EMS Pharma, Hortolândia, SP, Brazil) and Ampicillin (AMP) at 349.41 g/mol (API form, Sigma-Aldrich, St. Louis, MO, USA) were subjected to different degradation processes and separated into 50 samples for each group: thermal, acidic, aqueous, and a control group with no degradation. The molecular structures of AMX and AMP are illustrated in Figure 1.
For degradation under acidic conditions, approximately 1 mL of the ATB solution (286.97 mg/mL in DMSO) was added to 1 mL of 0.1 M HCl solution. The sample was stirred for 1 h at room temperature (RT, 25 °C). The final concentration of the solution was 191.31 mg/mL for both ATBs [18]. For thermal degradation at a temperature below their melting points to prevent direct melting and focus on chemical degradation, approximately 20 mg of each ATB was placed in a controlled-temperature oven and heated at 150 °C for 2 h. For degradation in water, a portion of AMX was submerged in pure water and evaluated over 10 days.

2.2. FTIR Spectra Acquisition and Exploration

The powdered sample of the ATB was deposited on the diamond crystal of the equipment (Thermo Scientific’s Nicolet FTIR Spectrometer, model 6700, Waltham, MA, USA) equipped with an ATR diamond crystal and MCT detector, operating in Attenuated Total Reflection (ATR)–absorbance mode, with a resolution of 4 cm−1, ranging 4000–400 cm−1, 64 scans per measurement, and 100 scans for the water degradation group to ensure a good signal-to-noise ratio.
For pre-processing analysis, the spectra were cut to the fingerprint region (2000–400 cm−1) and corrected by the baseline; then, the spectra’s noise removal was performed by applying smoothing using the Savitzky–Golay convolution method with an 11-point window and a 2nd-order polynomial. The spectra were normalized using min–max normalization.
Later, for data exploration, chemometrics techniques were applied using the area under the curve for qualitative and quantitative assessments and degradation patterns in pharmaceutical compounds by integrating the spectral area of key vibrational bands: amide I, amide II, amide III, the carbonate bending region, and the entire fingerprint. ANOVA tests and Principal Component Analysis (PCA) were conducted to determine statistically significant differences between groups with a significance level of α = 5%.
An amount of 0.4 g of each ATB was diluted in pure water in different concentrations. The resulting spectra were analyzed to find molarity-shifting relationships associated with each one’s vibration modes. The limit of detection (LoD) was calculated using the calibration curve analysis [19], using Equation (1):
L o D = 3.3 σ S
where σ is the standard deviation of the response, and S is the slope of the calibration curve.
All analyses were performed in OriginLab (v. 2024b), Jamovi (v. 2.3.28), and Python (v. 3.11.1) in the Google Colab and Orange Data Mining (v. 3.38.1) environment.

3. Results and Discussion

A comparison was made with the literature to identify AMP and AMX vibrations, and Table 1 shows the peak attribution at the IR spectrum region for each antibiotic.
The graphs presented in Figure 2 correspond to the ATR-FTIR spectra of AMX (a) and AMP (b) subjected to thermal and acidic conditions, and we compared the results to the non-degraded control group.
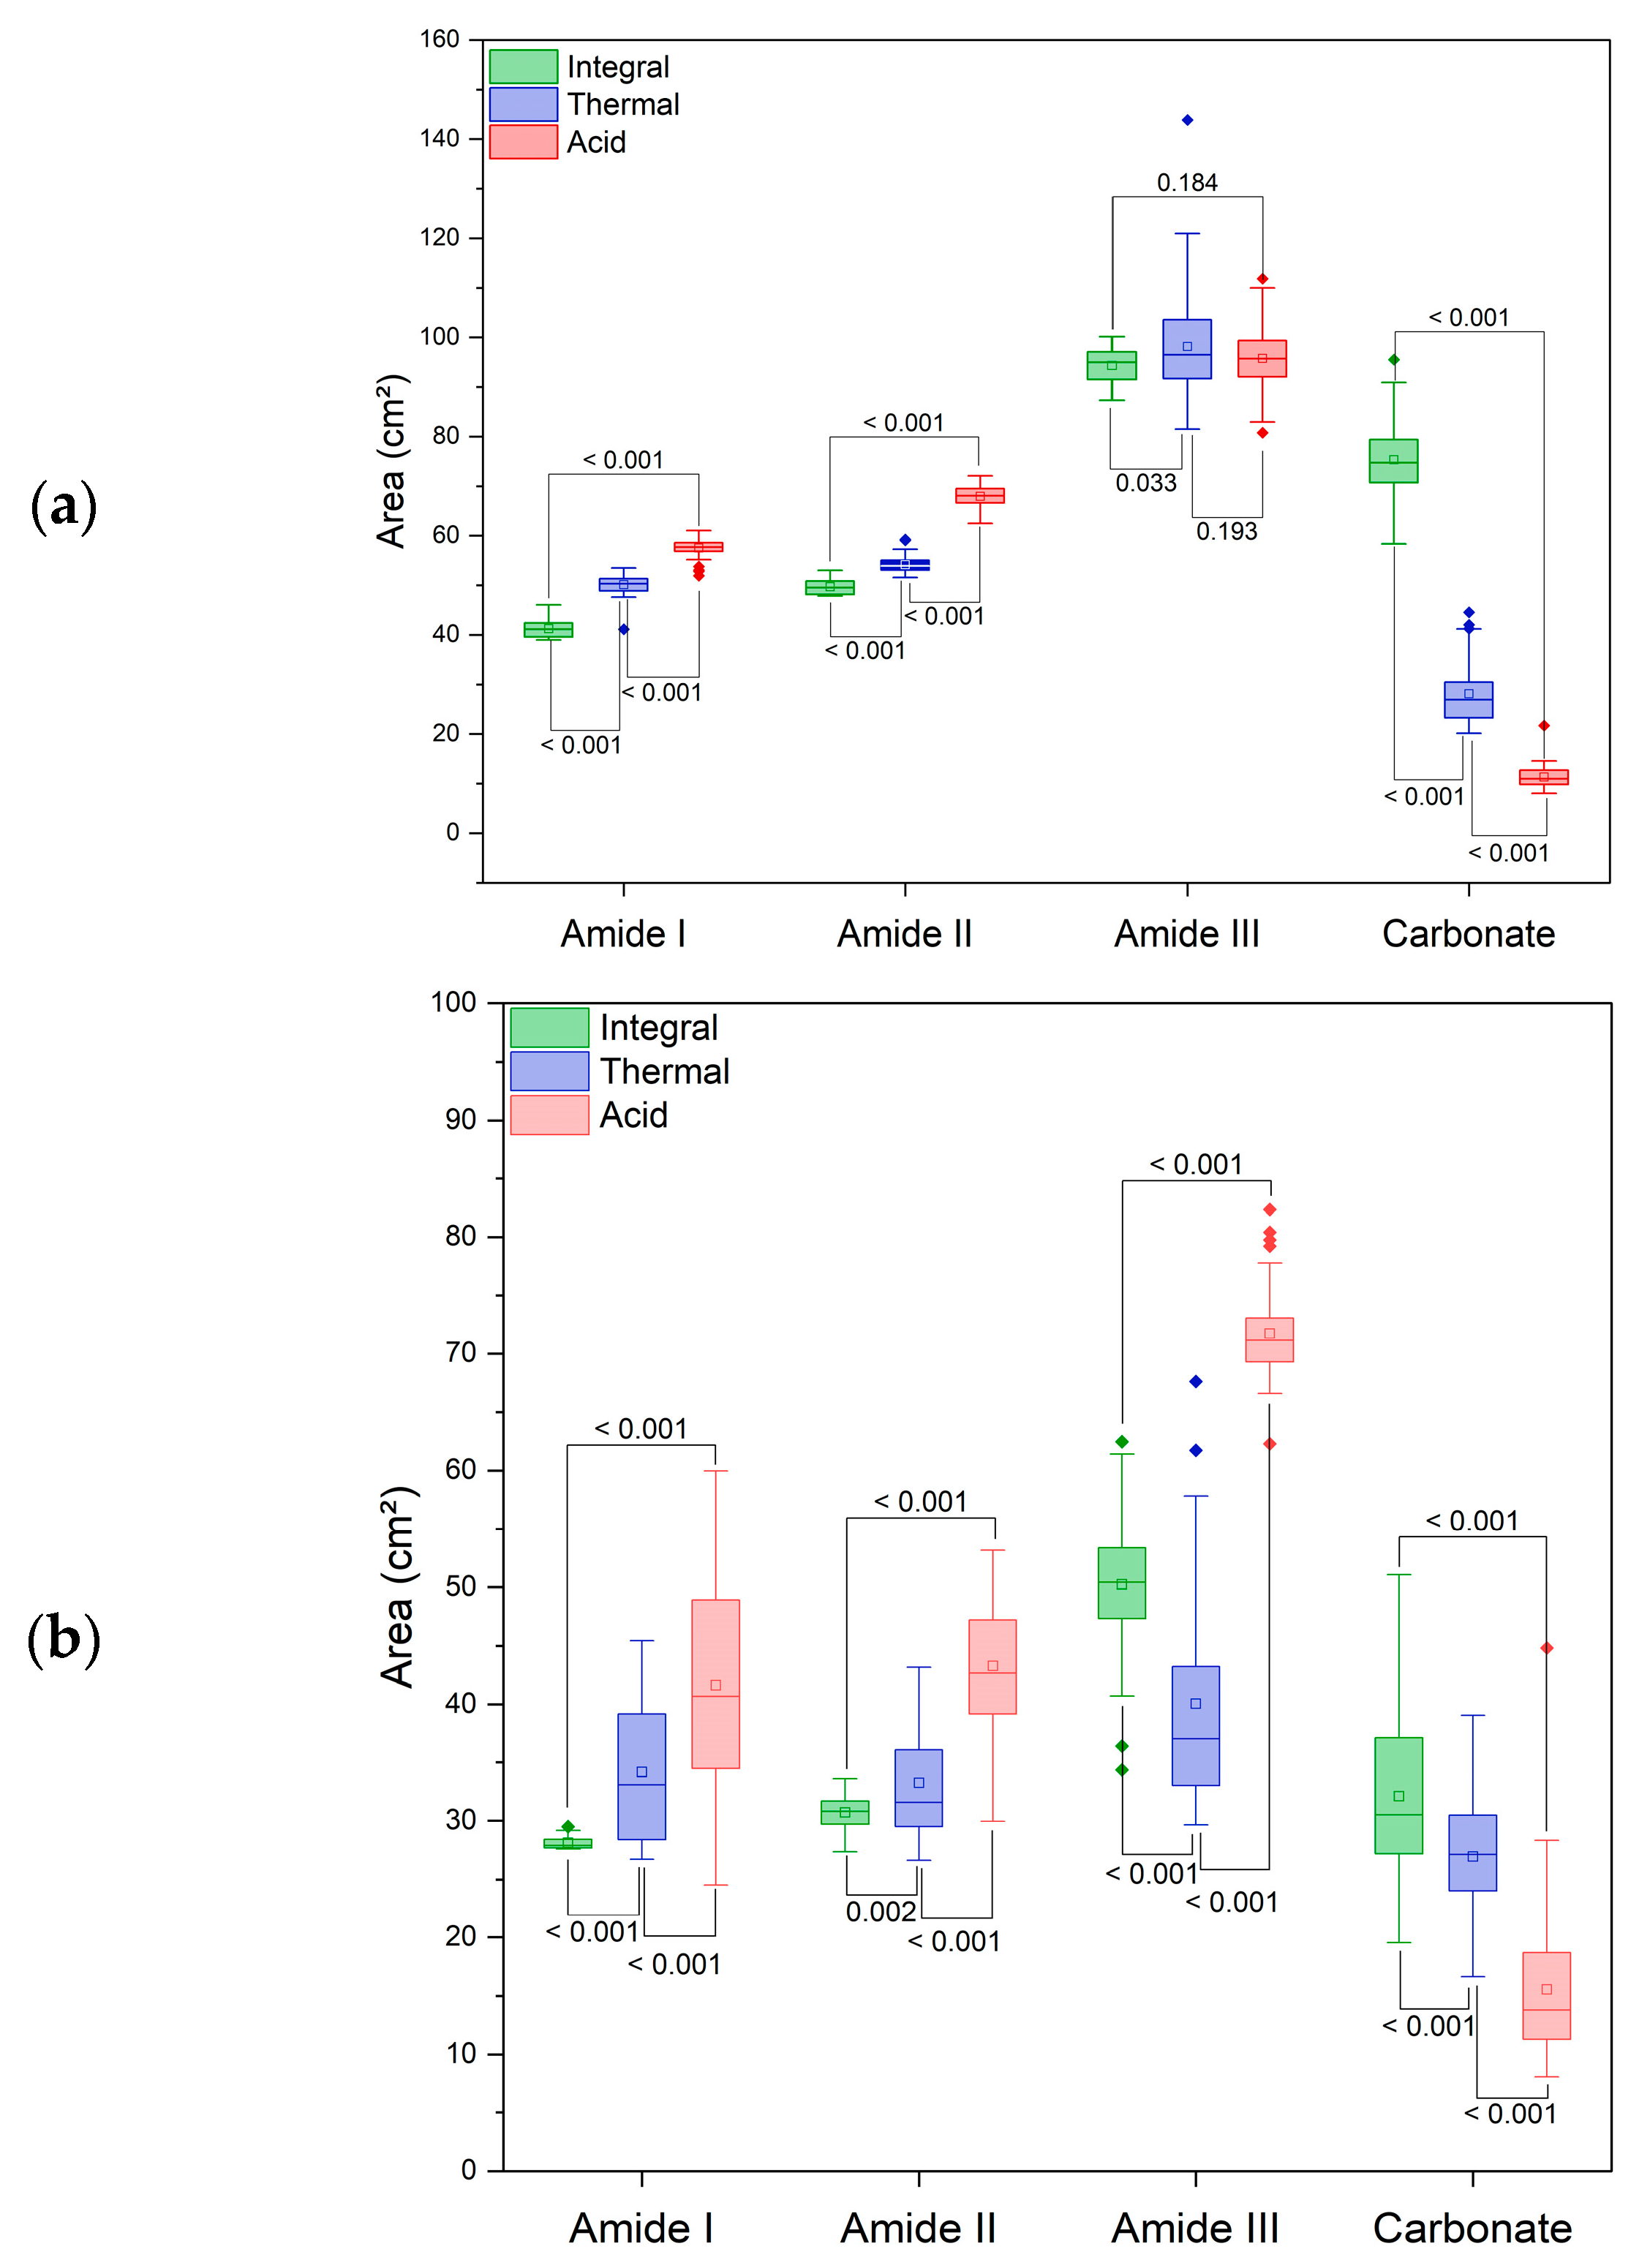
As expected, both ATBs exhibit characteristic absorption peaks reflecting their structure. These well-defined spectra for the non-degraded group serve as a reference for monitoring changes caused by degradation. The thermal and acidic group spectra reveal the broadening or shifting of peaks consistent with molecular breakdown. This result is confirmed by the integrated area for each key vibrational band, shown in Figure 3a for AMX and Figure 3b for AMP.
The PCA score plot of the fingerprint provides a clear visual confirmation of the spectral differences among degradation conditions. Samples cluster into well-separated groups along principal components 1 and 4, as shown in Figure 4, indicating that FTIR is capable of capturing subtle structural variations in AMX samples.
For AMP, the PCA score plot reveals a similar trend, as shown in Figure 5. However, it is worth noting that the thermal degradation group shows partial overlap with the control group. This suggests that, under the thermal conditions applied in this study, the molecular alterations induced in AMP may not have been sufficient to generate a distinct spectral signature from the samples. To address this limitation, further work could apply supervised multivariate methods, which may enhance sensitivity to minor but systematic variations not captured by PCA alone.
The clear separation of integral, thermal-degraded, and acidic-degraded AMX and AMP samples into distinct clusters in the PCA score plot demonstrates that each degradation condition induces unique molecular alterations detectable by ATR-FTIR spectroscopy in the fingerprint region. This differentiation confirms the capability of ATR-FTIR combined with chemometric tools to discriminate between different degradation pathways of AMX and AMP accurately. Such a distinction validates the method’s sensitivity to subtle structural changes. It highlights its potential as a powerful technique for comprehensively characterizing and monitoring antibiotic stability under various stress conditions.
The comparative analysis in Figure 6 shows the degradation profile for both AMX and AMP. Although both ATBs show vulnerability to heat and acid, the extent and nature of the degradation differ. These differences are captured quantitatively through integrated fingerprint areas and provide insight into how formulation or storage might affect each compound.
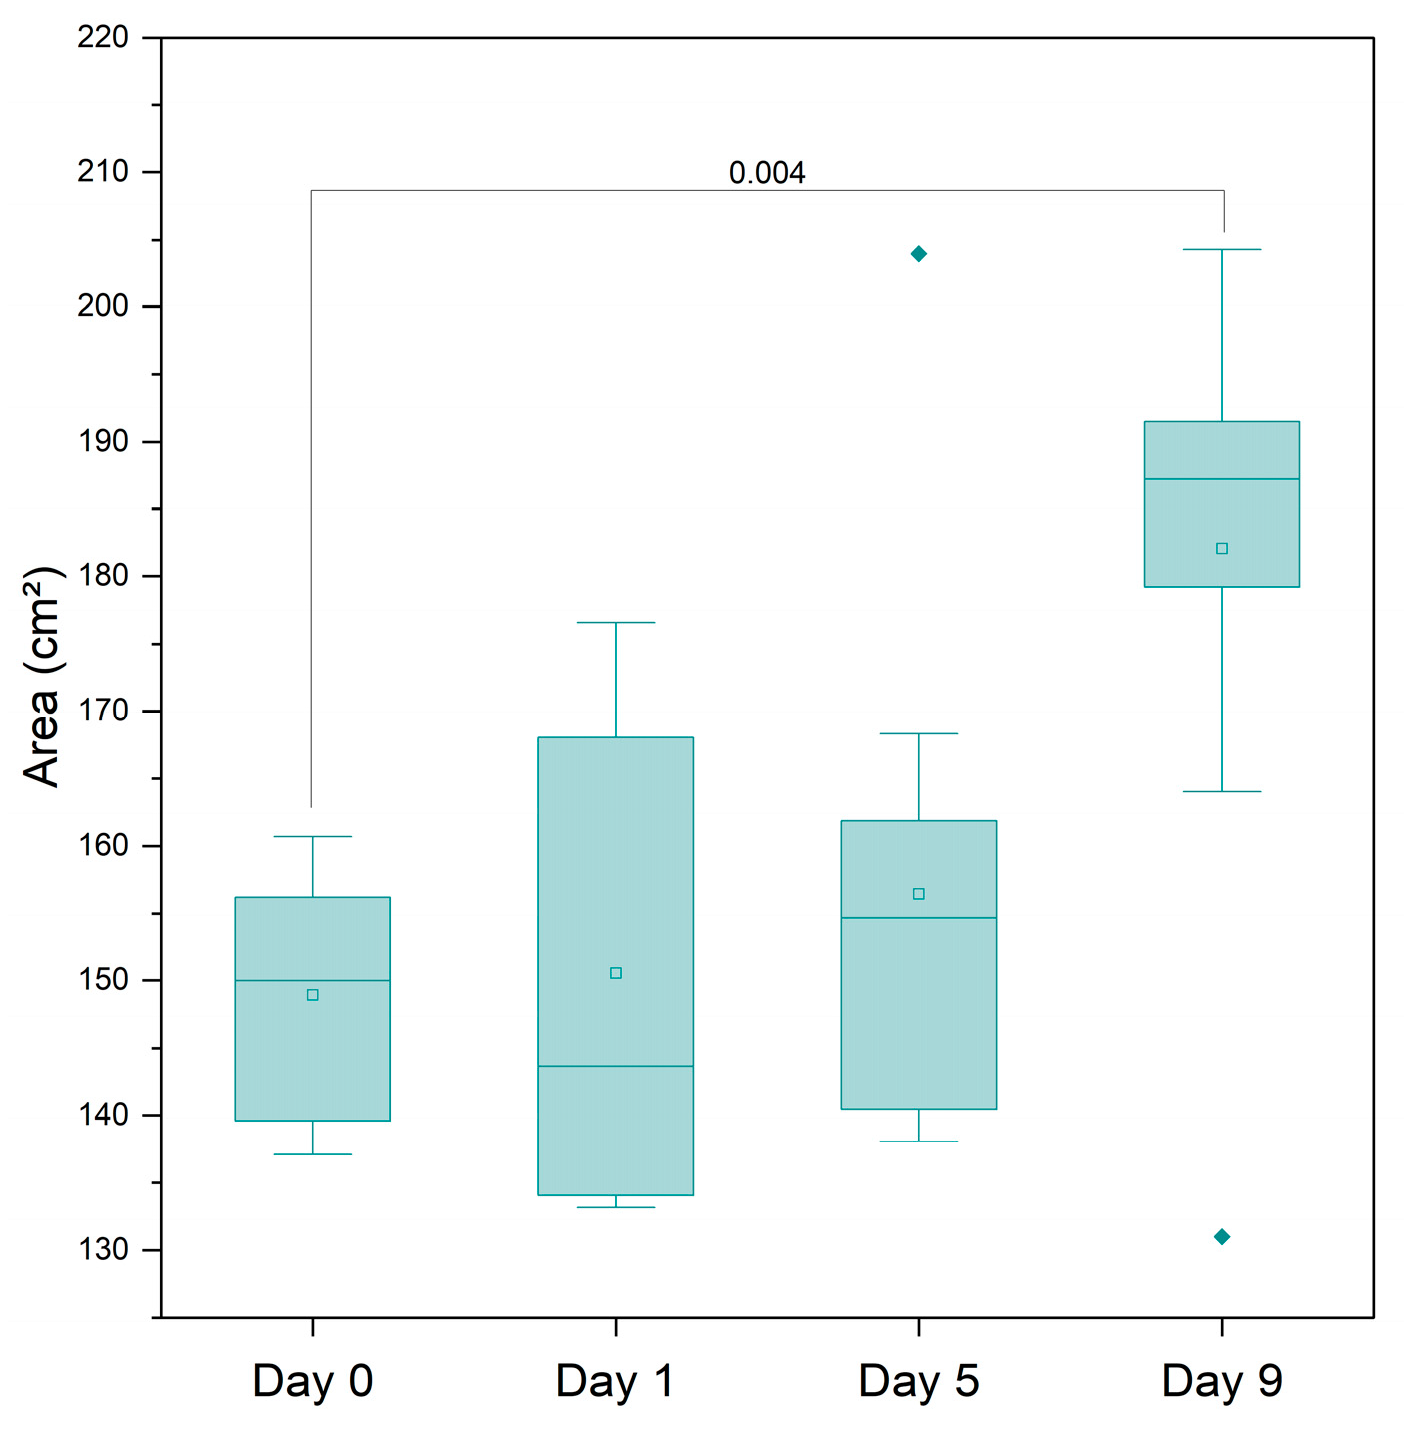
How AMX degrades when exposed to water over several days is displayed in Figure 7. This time-dependent experiment shows a progressive modification in the relative area of fingerprint peaks, suggesting hydrolysis as a structural disruption.
The results of the AMP and AMX molarity tests are displayed in Figure 8. The change in the absorbance intensity of the ATB bands was used to interfere with AMX Figure 8a and AMP Figure 8b concentrations.
The band with wavenumber 1313 cm−1 has linear correlations between AMX concentration and the peak intensity. A similar approach was applied to AMP, using the 1398 cm−1 peak, as shown in Figure 9.
Using the curve fitting tool (the least squares method), the relationship between molarity and AMX concentration was determined by Equation (2), where P is the peak intensity, and C is the molarity in mM. The analysis presented an LoD of 66.01 mM.
P C = 0.028 + C 6.05 10 5
The concentration and peak ratio relationship for AMP was determined by Equation (3) and presented an LoD of 96.76 mM.
P C = 0.007 + C 2.64 10 5
The LoD was slightly higher for AMP. This discrepancy may be related to differences in molecular structure or specific absorption coefficients, but both remain in the same order of magnitude. These results allow the determination of the concentration of the ATB in the measurement.

4. Conclusions

In conclusion, this study demonstrates that ATR-FTIR spectroscopy, particularly when paired with chemometric tools, is a robust and versatile method for monitoring antibiotic integrity. The technique provides both qualitative and quantitative insights, with high sensitivity to structural degradation. The ability to distinguish spectrally between intact antibiotics and their degradation products, as well as to differentiate between antibiotics themselves despite their structural similarity, was clearly evidenced. In addition, the methodology allowed us to monitor the hydrolytic degradation of AMX over time and to establish calibration curves for the quantification of both antibiotics in aqueous solution, determining detection limits in the millimolar order.
Although the experiments were conducted under controlled conditions with samples in simple matrices, clinical or environmental applications may require greater sensitivity at low concentrations. In the future, the tests will be validated in real-world applications involving biological or environmental samples. Detection limits will also be optimized with the application of nanostructures, improving the signal-to-noise ratio and increasing signal acquisition. Finally, the protocol will be expanded to include other antibiotics of interest. The methodology presented here holds significant potential to be developed and implemented in routine protocols for quality control in the pharmaceutical industry, as well as in clinical settings for the therapeutic monitoring of drugs or evaluation of the stability of formulations, thus contributing to the assurance of the safety and efficacy of antibiotics and to antimicrobial stewardship efforts.

Author Contributions

Conceptualization, V.P.A. and D.M.Z.; methodology, V.P.A., M.R.V.B.F., R.S., D.F.T.S. and D.M.Z.; validation, V.P.A., M.R.V.B.F., D.F.T.S. and D.M.Z.; formal analysis, V.P.A., R.S., D.F.T.S. and D.M.Z.; investigation, V.P.A., M.R.V.B.F., R.S., D.F.T.S. and D.M.Z.; resources, D.M.Z.; data curation, V.P.A. and M.R.V.B.F.; writing—original draft preparation, V.P.A., M.R.V.B.F., R.S. and D.F.T.S.; writing—review and editing, V.P.A., M.R.V.B.F., D.F.T.S. and D.M.Z.; visualization, V.P.A., D.F.T.S. and D.M.Z.; supervision, D.M.Z.; project administration, D.M.Z.; funding acquisition, D.M.Z. All authors have read and agreed to the published version of the manuscript.

Funding

This research was funded by CNPq (INCT-INTERAS 406761/2022-1; Sisfoton 440228/2021-2; PQ: 314517/2021-9); FAPESP (2020/07065-4, 2025/03135-1); and CAPES-finance code 001.

Institutional Review Board Statement

Not applicable.

Informed Consent Statement

Not applicable.

Data Availability Statement

Data are contained within the article.

Acknowledgments

We thank Conselho Nacional de Desenvolvimento Científico e Tecnológico (CNPq), Fundação Coordenação de Aperfeiçoamento de Pessoal de Nível Superior (CAPES), and Fundação de Amparo à Pesquisa do Estado de São Paulo (FAPESP).

Conflicts of Interest

The authors declare no conflicts of interest.

Abbreviations

The following abbreviations are used in this manuscript:
ATBAntibiotic
ATRAttenuated Total Reflection
FTIRFourier Transform Infrared Spectroscopy
PCAPrincipal Component Analysis
LoDLimit of Detection
AMXAmoxicillin
AMPAmpicillin

References

  1. Chiumia, F.K.; Sinjani Muula, A.; Chimimba, F.; Nyirongo, H.M.; Kampira, E.; Khuluza, F. Substandard Antibiotics and Their Clinical Outcomes among Hospitalized Patients in Southern Malawi: A Pilot Study. Front. Pharmacol. 2025, 16, 1535501. [Google Scholar] [CrossRef] [PubMed]
  2. ‘t Hoen, E.F.M.; Hogerzeil, H.V.; Quick, J.D.; Sillo, H.B. A Quiet Revolution in Global Public Health: The World Health Organization’s Prequalification of Medicines Programme. J. Public Health Pol. 2014, 35, 137–161. [Google Scholar] [CrossRef] [PubMed]
  3. Medicines|WHO—Prequalification of Medical Products (IVDs, Medicines, Vaccines and Immunization Devices, Vector Control). Available online: https://extranet.who.int/prequal/medicines (accessed on 29 May 2025).
  4. World Health Organization. Quality Assurance of Pharmaceuticals: A Compendium of Guidelines and Related Materials: Vol. 2: Good Manufacturing Practices and Inspection. In Good Manufacturing Practices and Inspection; World Health Organization: Geneva, Switzerland, 2007. [Google Scholar]
  5. Dyar, O.J.; Huttner, B.; Schouten, J.; Pulcini, C. What Is Antimicrobial Stewardship? Clin. Microbiol. Infect. 2017, 23, 793–798. [Google Scholar] [CrossRef] [PubMed]
  6. Charani, E.; Holmes, A. Antibiotic Stewardship—Twenty Years in the Making. Antibiotics 2019, 8, 7. [Google Scholar] [CrossRef] [PubMed]
  7. CDC Core Elements of Hospital Antibiotic Stewardship Programs. Available online: https://www.cdc.gov/antibiotic-use/hcp/core-elements/hospital.html (accessed on 29 May 2025).
  8. Conte, D.; Palmeiro, J.K.; Bavaroski, A.A.; Rodrigues, L.S.; Cardozo, D.; Tomaz, A.P.; Camargo, J.O.; Dalla-Costa, L.M. Antimicrobial Resistance in Aeromonas Species Isolated from Aquatic Environments in Brazil. J. Appl. Microbiol. 2021, 131, 169–181. [Google Scholar] [CrossRef] [PubMed]
  9. Maranni, A.C. Identificação de Bactérias Utilizando Espectroscopia Raman ou FTIR e Análise Multivariada: Uma Revisão Sistemática; UFMS: Pioneiros, Brazil, 2023. [Google Scholar]
  10. Cielecka-Piontek, J.; Paczkowska, M.; Lewandowska, K.; Barszcz, B.; Zalewski, P.; Garbacki, P. Solid-State Stability Study of Meropenem—Solutions Based on Spectrophotometric Analysis. Chem. Cent. J. 2013, 7, 98. [Google Scholar] [CrossRef] [PubMed]
  11. Ataka, K.; Heberle, J. Biochemical Applications of Surface-Enhanced Infrared Absorption Spectroscopy. Anal. Bioanal. Chem. 2007, 388, 47–54. [Google Scholar] [CrossRef] [PubMed]
  12. Fanelli, S.; Zimmermann, A.; Totóli, E.G.; Salgado, H.R.N. FTIR Spectrophotometry as a Green Tool for Quantitative Analysis of Drugs: Practical Application to Amoxicillin. J. Chem. 2018, 2018, 3920810. [Google Scholar] [CrossRef]
  13. Hassall, J.; Coxon, C.; Patel, V.C.; Goldenberg, S.D.; Sergaki, C. Limitations of Current Techniques in Clinical Antimicrobial Resistance Diagnosis: Examples and Future Prospects. Npj Antimicrob. Resist. 2024, 2, 16. [Google Scholar] [CrossRef] [PubMed]
  14. Liu, C.; Li, B.; Liu, M.; Mao, S. Demand, Status, and Prospect of Antibiotics Detection in the Environment. Sens. Actuators B Chem. 2022, 369, 132383. [Google Scholar] [CrossRef]
  15. Ribeiro da Cunha, B.; Fonseca, L.P.; Calado, C.R.C. Metabolic Fingerprinting with Fourier-Transform Infrared (FTIR) Spectroscopy: Towards a High-Throughput Screening Assay for Antibiotic Discovery and Mechanism-of-Action Elucidation. Metabolites 2020, 10, 145. [Google Scholar] [CrossRef] [PubMed]
  16. Verma, K.; Akhtar, M.; Anchliya, A. Combination of FTIR Spectroscopy and Chemometric Method on Quantitative Approach—A Review. Austin J. Anal. Pharm. Chem. 2021, 8, 1128. [Google Scholar]
  17. Eid, S.M.; Soliman, S.S.; Elghobashy, M.R.; Abdalla, O.M. ATR-FTIR Coupled with Chemometrics for Quantification of Vildagliptin and Metformin in Pharmaceutical Combinations Having Diverged Concentration Ranges. Vib. Spectrosc. 2020, 106, 102995. [Google Scholar] [CrossRef]
  18. Nägele, E.; Moritz, R. Structure Elucidation of Degradation Products of the Antibiotic Amoxicillin with Ion Trap MSn and Accurate Mass Determination by ESI TOF. J. Am. Soc. Mass Spectrom. 2005, 16, 1670–1676. [Google Scholar] [CrossRef] [PubMed]
  19. Currie, L.A. Nomenclature in Evaluation of Analytical Methods Including Detection and Quantification Capabilities (IUPAC Recommendations 1995). Pure Appl. Chem. 1995, 67, 1699–1723. [Google Scholar] [CrossRef]
  20. Baraldi, C.; Tinti, A.; Ottani, S.; Gamberini, M.C. Characterization of Polymorphic Ampicillin Forms. J. Pharm. Biomed. Anal. 2014, 100, 329–340. [Google Scholar] [CrossRef] [PubMed]
  21. Bebu, A.; Szabó, L.; Leopold, N.; Berindean, C.; David, L. IR, Raman, SERS and DFT Study of Amoxicillin. J. Mol. Struct. 2011, 993, 52–56. [Google Scholar] [CrossRef]
  22. Müller, A.L.H.; Flores, É.M.M.; Müller, E.I.; Silva, F.E.B.; Ferrão, M.F. Attenuated Total Reflectance with Fourier Transform Infrared Spectroscopy (ATR/FTIR) and Different PLS Algorithms for Simultaneous Determination of Clavulanic Acid and Amoxicillin in Powder Pharmaceutical Formulation. J. Braz. Chem. Soc. 2011, 22, 1903–1912. [Google Scholar] [CrossRef]
  23. Nairi, V.; Medda, L.; Monduzzi, M.; Salis, A. Adsorption and Release of Ampicillin Antibiotic from Ordered Mesoporous Silica. J. Colloid Interface Sci. 2017, 497, 217–225. [Google Scholar] [CrossRef] [PubMed]
Figure 1. Chemical structure of (a) AMX and (b) AMP.
Msf 35 00007 g001
Figure 2. FTIR spectra of (a) AMX and (b) AMP under integral, thermal, and acidic degradation conditions.
Msf 35 00007 g002
Figure 3. Integrated peak areas of key vibrational bands for (a) AMX and (b) AMP under different degradation conditions.
Msf 35 00007 g003
Figure 4. PCA score plot of AMX samples based on FTIR spectra in fingerprint region.
Msf 35 00007 g004
Figure 5. PCA score plot of AMP samples based on FTIR spectra in fingerprint region.
Msf 35 00007 g005
Figure 6. Comparison of integrated FTIR fingerprint region areas for AMX and AMP under degradation conditions.
Msf 35 00007 g006
Figure 7. Degradation of AMX in water over time: relative peak area variation in FTIR fingerprint region.
Msf 35 00007 g007
Figure 8. Peak intensity variation for (a) AMX and (b) AMP at different concentrations.
Msf 35 00007 g008aMsf 35 00007 g008b
Figure 9. Peak intensity and molarity relationship for AMX and AMP.
Msf 35 00007 g009
Table 1. AMP and AMX band assignment.
AMPAMX
Experimental Wavenumbers (cm−1)Theoretical
Wavenumbers (cm−1)
AssignmentExperimental Wavenumbers (cm−1)Theoretical
Wavenumbers (cm−1)
Assignment
17761760–1700C=O
carboxylate ion
17741793C8O14 + C3H + O13H
16891680–1630C=O
amides
16851709N10H + C15O17 + C16H
16001650–1550COO
carboxylate ion
16161610C=C benzene ring + N19H
1600; 15041600–1450C=C
aromatic ring
15741585C=C benzene ring + CH benzene ring + O25H
14171400COO
carboxylate ion
13961398CH3
1298; 10841350–1000C–N12821278N1C3 + N10H + N19H2 + CH + O13H
According to [20,21,22,23].
Disclaimer/Publisher’s Note: The statements, opinions and data contained in all publications are solely those of the individual author(s) and contributor(s) and not of MDPI and/or the editor(s). MDPI and/or the editor(s) disclaim responsibility for any injury to people or property resulting from any ideas, methods, instructions or products referred to in the content.