Proceeding Paper

The Cytotoxicity of Phorbol 12- Myristate 13-Acetate and Lipopolysaccharide on THP-1 Cells and an Optimized Differentiation Protocol †

1
Bioscience Research Institute, Technological University of the Shannon, Midlands Midwest, N37HD68 Athlone, Ireland
2
Department of Pharmaceutical Sciences and Biotechnology, Technological University of the Shannon, Midlands Midwest, N37HD68 Athlone, Ireland
*
Author to whom correspondence should be addressed.
Presented at the Biosystems in Toxicology and Pharmacology—Current challenges, 8–9 September 2022. Available online: https://bitap.sciforum.net/.
Med. Sci. Forum 2022, 11(1), 5; https://doi.org/10.3390/BiTaP-12785
Published: 2 July 2022
(This article belongs to the Proceedings of Biosystems in Toxicology and Pharmacology—Current Challenges)

Abstract

:
In order to evaluate the immunomodulatory potential of novel monofloral Irish honeys, THP-1 monocyte-derived macrophages provided a suitable cell-based model. THP-1 cells can be differentiated to macrophages using phorbol-12-myristate-13-acetate (PMA). Differentiated cells are then challenged with lipopolysaccharide (LPS) to stimulate the inflammatory cascade. Few studies on the cytotoxic concentrations of these two compounds on THP-1 cells have been published. Therefore, the viability of treated THP-1 cells was initially evaluated using Trypan Blue dye exclusion (for PMA), the resazurin assay (for LPS), and propidium iodide (PI) staining (for both). The literature suggests that concentrations ranging from 100 ng/mL down to 5 ng/mL PMA are sufficient for THP-1 differentiation. Consequently, further elucidation of the differentiation potential of this sub-cytotoxic PMA concentration range was also evaluated using flow cytometric detection of the macrophage-specific CD14 cell surface marker.

1. Introduction

THP-1 cells are monocytic leukaemia cells isolated from a 1-year-old male [1]. These cells have been used to test the immunomodulatory effects of a range of different compounds, including natural compounds and bioactive foods, such as mushroom extracts [2], wild ginger extracts [3], egg yolk antibodies [4], olive extracts [5], buckwheat [6], and honey [7]. Differentiation agents, such as phorbal-12-myristate-13-acetat (PMA), 1,25-dihydroxyvitamin D3 (VD3), and granulocyte macrophage colony-stimulating factor (GM-CSF), have been used with varying concentrations, exposure times, and rest periods to differentiate THP-1 monocytes to the macrophage M0 phenotype [8,9,10]. These can then be polarized to M1 and M2 macrophage subsets with similar gene expression levels as human monocyte-derived macrophages [11].
While a PMA concentration of ~100 ng/mL [10] is frequently cited in studies, it is difficult to source cytotoxic data for PMA on THP-1 cells in the literature. Choosing the correct cytotoxicity assay is also an important consideration. Some cytotoxicity assays, such as the resazurin, MTT, or neutral red uptake assays, require an untreated cell control to compare the treated samples to in order to then calculate the percentage viability. When PMA is added to THP-1 cells, it differentiates this monocytic cell type to macrophages that have different metabolic functions [12,13] and endocytosis rates [14] (important for the neutral red uptake assay [15]). These differentiated cells do not proliferate [16] either, unlike the untreated control; consequently, a direct comparison of treated THP-1 cells to the untreated control cannot be made.
Once the cytotoxicity of PMA has been determined, the potential to use lower PMA concentrations to mitigate masking of gene expression should be considered. Park et al. [17] and Lund et al. [18] reported differentiation of THP-1 monocytes based on adherence, changes in cellular morphology, and/or CD14 cell surface marker expression, using ~10× lower concentrations than commonly cited in the literature. A review of the literature on THP-1 cells by Chanput et al. [10] also highlighted the need to assess cell adherence, cellular morphology, changes in proliferation, surface markers, such as CD14, and phagocytosis capacity to ensure the majority of the population is differentiated, although no published value has been found to identify sufficiently differentiated populations of THP-1 cells.
These studies suggest that treating THP-1 cells with PMA at lower concentrations (5-15 ng/mL) for 48 h, including a 24 h rest period, is sufficient for successful differentiation without masking gene expression levels for subsequent test reagents. The question of whether a longer exposure time (72 h) makes a difference to the CD14 expression level for lower concentrations of 5 ng/mL and 15 ng/mL PMA versus 100 ng/mL has not been investigated. Hence, it is important to further elucidate if this shorter PMA exposure period (48 h versus 72 h) is sufficient at lower PMA concentrations (i.e., 5 ng/mL and 15 ng/mL) to elicit expression of the differentiation-specific CD14 cell-surface marker as well as changes in morphology and adherence.
When THP-1 cells are used for immunomodulatory studies, bacterial lipopolysaccharide (LPS) is often employed to stimulate the inflammatory cascade. LPS can polarize differentiated THP-1 cells after treatment with PMA [12,19]. However, few studies have reported cytotoxicity data on the effects of LPS alone on differentiated THP-1 cells. Studies by Liu et al., 2018 [20] and Huo et al., 2020 [21] reported that a concentration of 10 µg/mL LPS resulted in over 30% cell death. Extremely low seeding densities of differentiated THP-1 cells (1 × 10⁵ cells/mL) were used for the MTT [20] and CCK-8 [21] cytotoxicity assays in these studies. The current study used the resazurin assay to assess cytotoxicity and found that cell seeding optimization is imperative for the cell type showing higher seeding densities were required (3.33 × 10⁵ cells/mL–7.5 × 105 cells/mL).

2. Materials and Methods

2.1. Materials

RPMI 1640 media, L-glutamine, penicillin-streptomycin, Trypan Blue solution, resazurin sodium salt, phosphate buffered saline (without CaCl2 and MgCl2), PMA (P8138), and LPS (L4391) were purchased from Sigma-Aldrich (Merck Life Science Ltd., Dublin, Ireland). Foetal bovine serum was purchased from Thermo Fisher Scientific (Dublin, Ireland). Propidium iodide (PI) and CD14 Antibody, anti-human, FITC, REAfinity, Clone REA599, were purchased from Miltenyi Biotec (Miltenyi Biotec, Surrey, UK).

2.2. Culture of THP-1 Cells

THP-1 cells (ECACC 88081201) used were between passages 4 and 15. Cells were cultured in RPMI 1640 medium supplemented with 10% foetal bovine serum, 1% l-glutamine, and 1% penicillin-streptomycin in a humidified incubator at 37 °C in 5% CO2. For each experiment, cells were seeded 18 h before addition of PMA to allow cell recovery.

2.3. PMA Cytotoxicity of Monocytic THP-1 Cells

PMA cytotoxicity was assessed using the Trypan Blue dye exclusion assay. THP-1 cells were seeded in 6-well plates at 1 × 10⁶ cells/mL and exposed to 1000 ng/mL, 500 ng/mL, 100 ng/mL, or 50 ng/mL PMA for 72 h followed by a 24 h rest period in PMA-free media. All experiments included untreated control cells, and cell counts were performed in triplicate for six independent experiments.

2.4. Differentiation of THP-1 Cells

THP-1 cells were differentiated with 100 ng/mL, 15 ng/mL, or 5 ng/mL PMA for 48 or 72 h prior to flow cytometry CD14 cell surface marker analysis. Following confirmation of CD14 expression with flow cytometry analysis, cells were treated with 15 ng/mL PMA for 72 h followed by a 24-h rest period in PMA-free media, which is referenced as the optimized protocol in the following methods. When PMA media was changed, it was first centrifuged, and the cell pellet was resuspended in fresh media and returned to the well, as a small number of cells remain suspended after differentiation, regardless of exposure time or concentration.

2.5. Flow Cytometry Analysis of THP-1 Cell Differentiation

Flow cytometry analysis was performed using a MacsQuant Analyzer 10. THP-1 cells were differentiated (100 ng/mL, 15 ng/mL, 5 ng/mL PMA) in 6-well tissue culture plates at a cell density of 1 × 10⁶ cells/mL for 48 or 72 h followed by a 24-h rest period in PMA-free media. When PMA media was changed, it was first centrifuged, and the cell pellet was resuspended in fresh media and returned to the well. Untreated cells were included as a comparative control. Cells were washed with PBS, adherent cells were scraped, and cells washed again and incubated with Miltenyi Biotec CD14 Reafinity CD14 Antibody, anti-human, FITC, REAfinity, Clone REA599, for 10 min at 4 °C as per the manufacturer’s protocol. This Reafinity antibody did not require separate Fc blocking. Following incubation, samples were washed in PBS and resuspended, and >50,000 events were recorded. Analysis was carried out with three independent experiments.

2.6. LPS Cytotoxicity of Differentiated THP-1 Cells

2.6.1. Resazurin Assay

LPS cytotoxicity and the influence of cell seeding densities were evaluated by the resazurin assay. THP-1 cells were seeded and differentiated as per the optimized PMA protocol with the following seeding densities: 5 × 10⁴ cells/well (96-well plates) and 1.5 × 10⁵ cells/well (48-well plates). After the 24 h rest period, LPS was added to wells at concentrations of 10 µg/mL, 1 µg/mL, 0.1 µg/mL, and 0.01 µg/mL and the plates incubated for 24 h before the addition of resazurin to a final concentration of 44 µM for a further 3 h at 37 °C. Relative fluorescence units were measured at an excitation of 528 nm and emission of 590 nm using the Agilent Gen 5 Biotek reader.

2.6.2. PI Staining Assay

LPS cytotoxicity was assessed with PI staining using the MacsQuant Analyzer 10. A cell density of 1 × 10⁶ cells/mL was seeded in a 6-well tissue culture plate, incubated overnight (18 h), and treated as per the optimized PMA protocol. Following the 24 h rest period, cells were treated with LPS at concentrations of 10 µg/mL, 1 µg/mL, 0.1 µg/mL, and 0.01 µg/mL for 24 h. Cells were then washed with PBS, adherent cells were scraped, and the cells were resuspended in PBS for flow cytometry analysis. PI stain was used and >50,000 events were recorded. All data were analysed using FlowJo software (version 10.8.1).

2.7. Statistical Analysis

All experiments included a minimum of three technical replicates and three independent experiments. Data are reported as the mean ± standard deviation unless otherwise stated in figures. Statistical analysis included repeated measures ANOVA, one-way ANOVA followed by Dunnett’s post hoc test, and two-way ANOVA followed by Tukey’s post hoc tests. Significance was defined as p < 0.05. Statistical testing was performed using R studio (version 10.8.1).

3. Results and Discussion

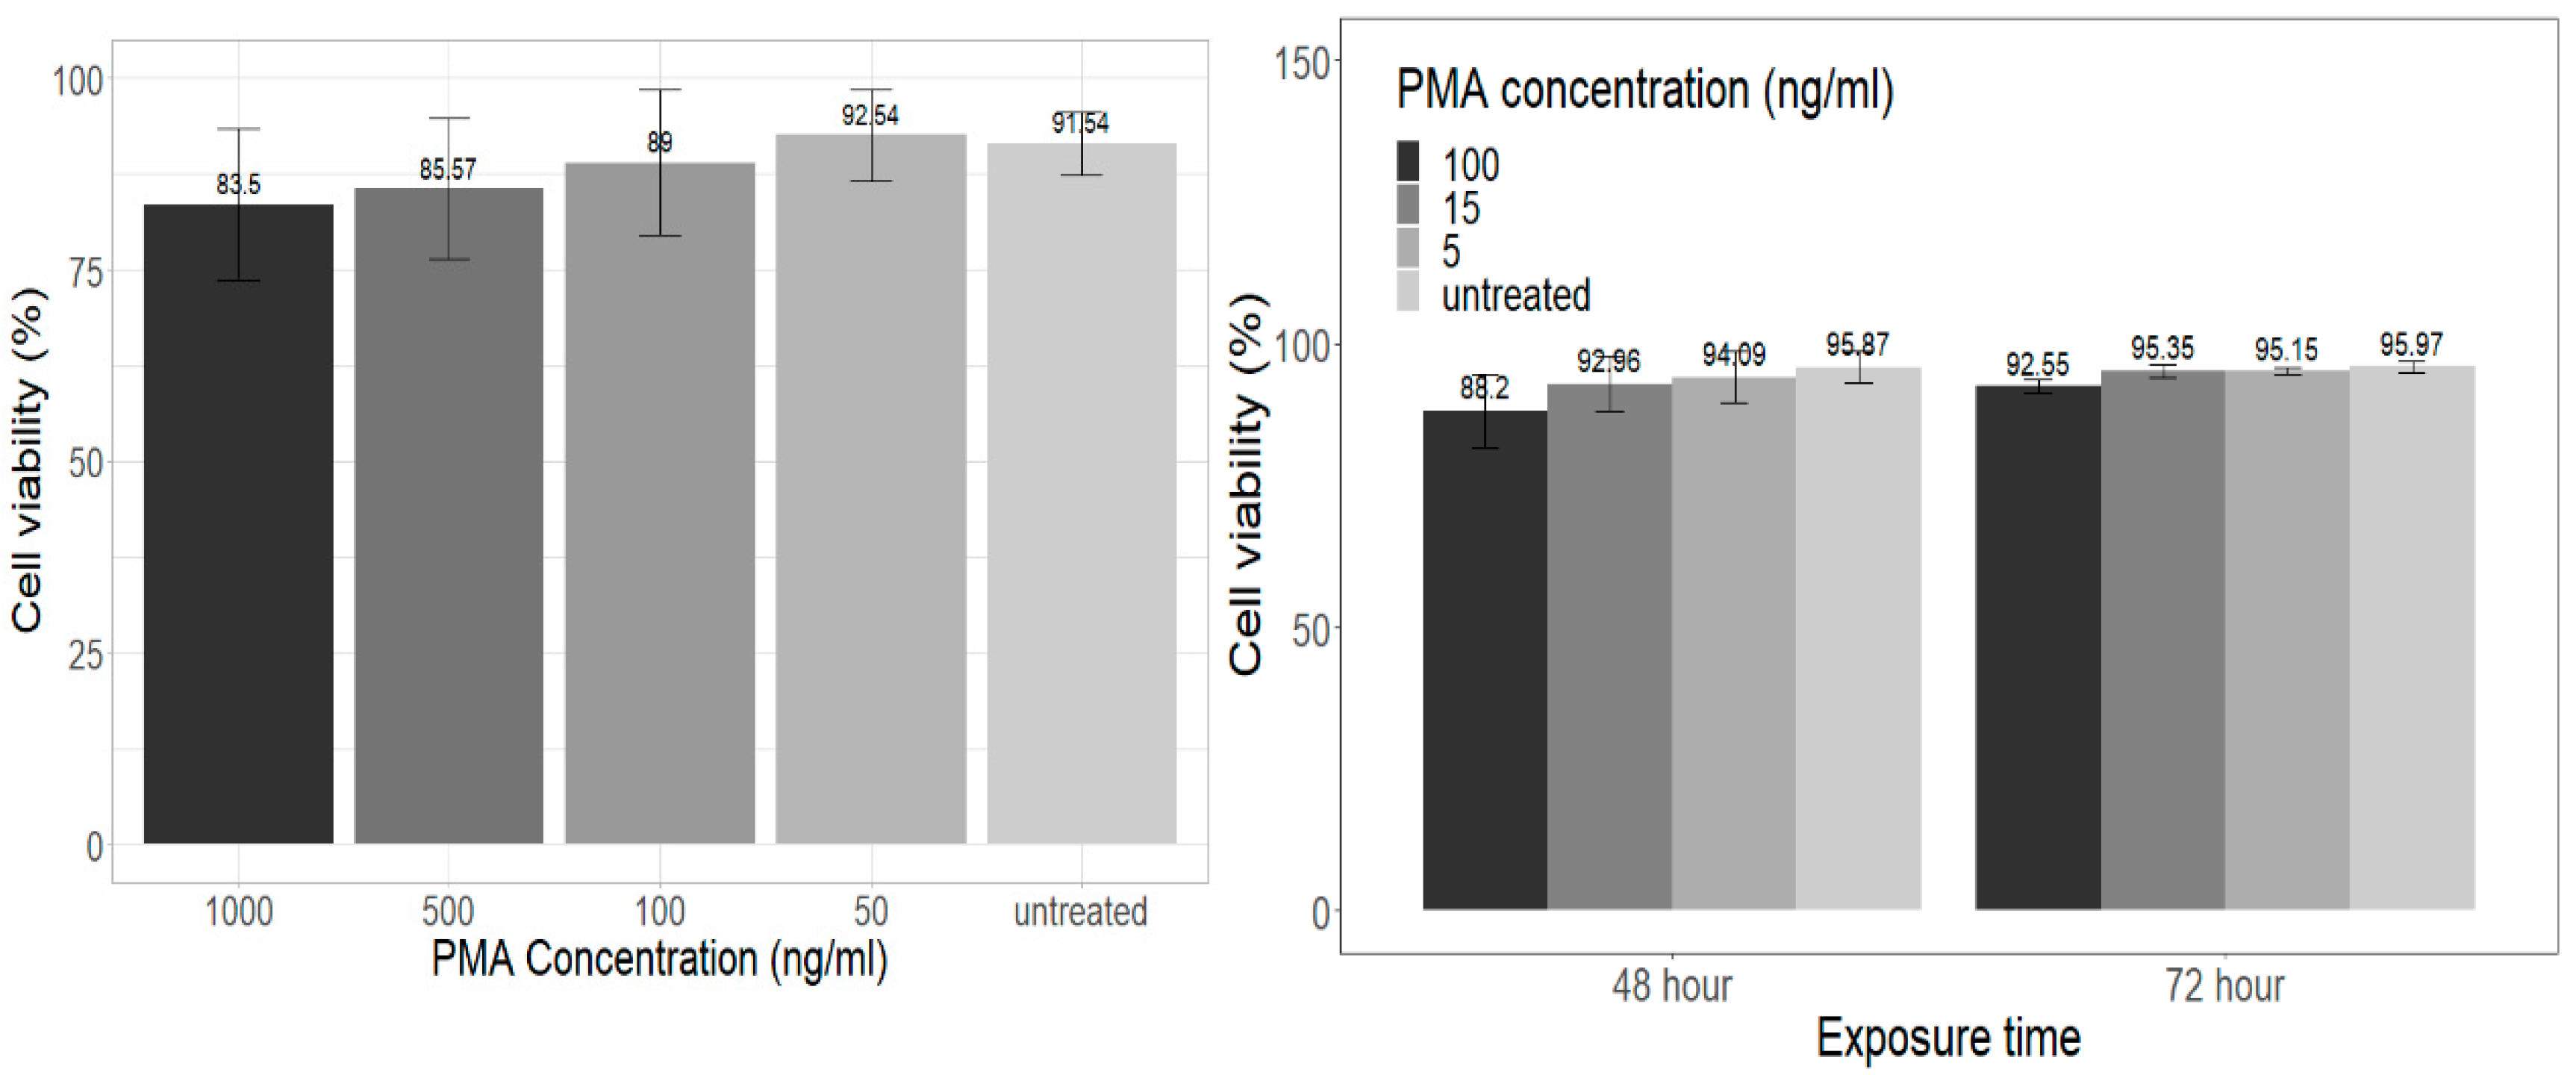
3.1. PMA Cytotoxicity

In the Trypan Blue dye exclusion assay, the highest PMA concentration tested (1000 ng/mL for 72 h) resulted in 83.5% THP-1 cell viability (Figure 1 Left).
Interestingly, cell viability at 100 ng/mL PMA was in accordance with flow cytometry PI staining results, where 100 ng/mL PMA-treated THP-1 cells at 72 h resulted in ~92.55% cell viability (Figure 1 Right). Cells were seeded in 6-well plates at a minimum density of 1 × 10⁶ cells/mL for both assays. These results cannot be fully compared to the literature as studies detailing PMA cytotoxicity on THP-1 cells could not be identified. However Lund et al. [18], briefly mentions a cell viability of 93% for THP-1 cells treated with PMA from concentrations of 5 ng/mL to 125 ng/mL for 48 h using the Trypan Blue exclusion dye assay and a viability stain during flow cytometry analysis.

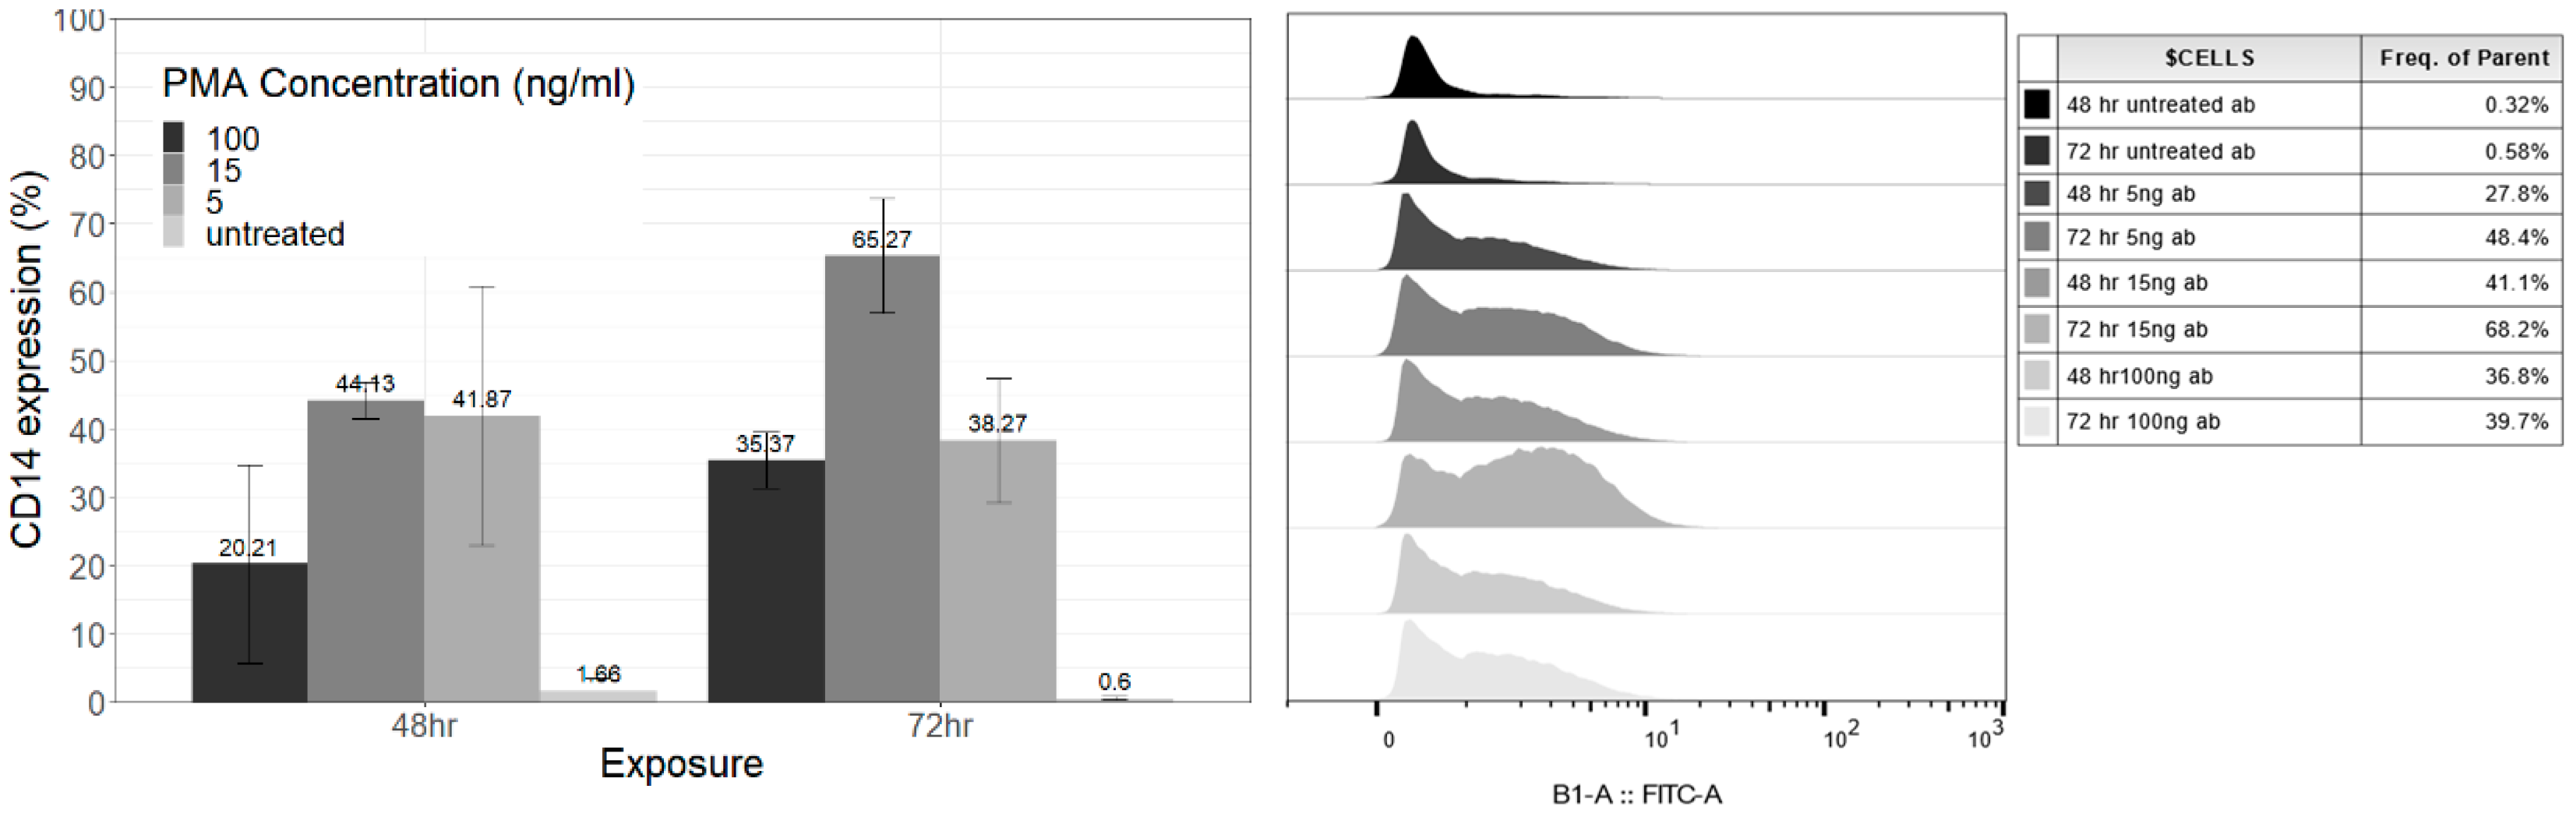
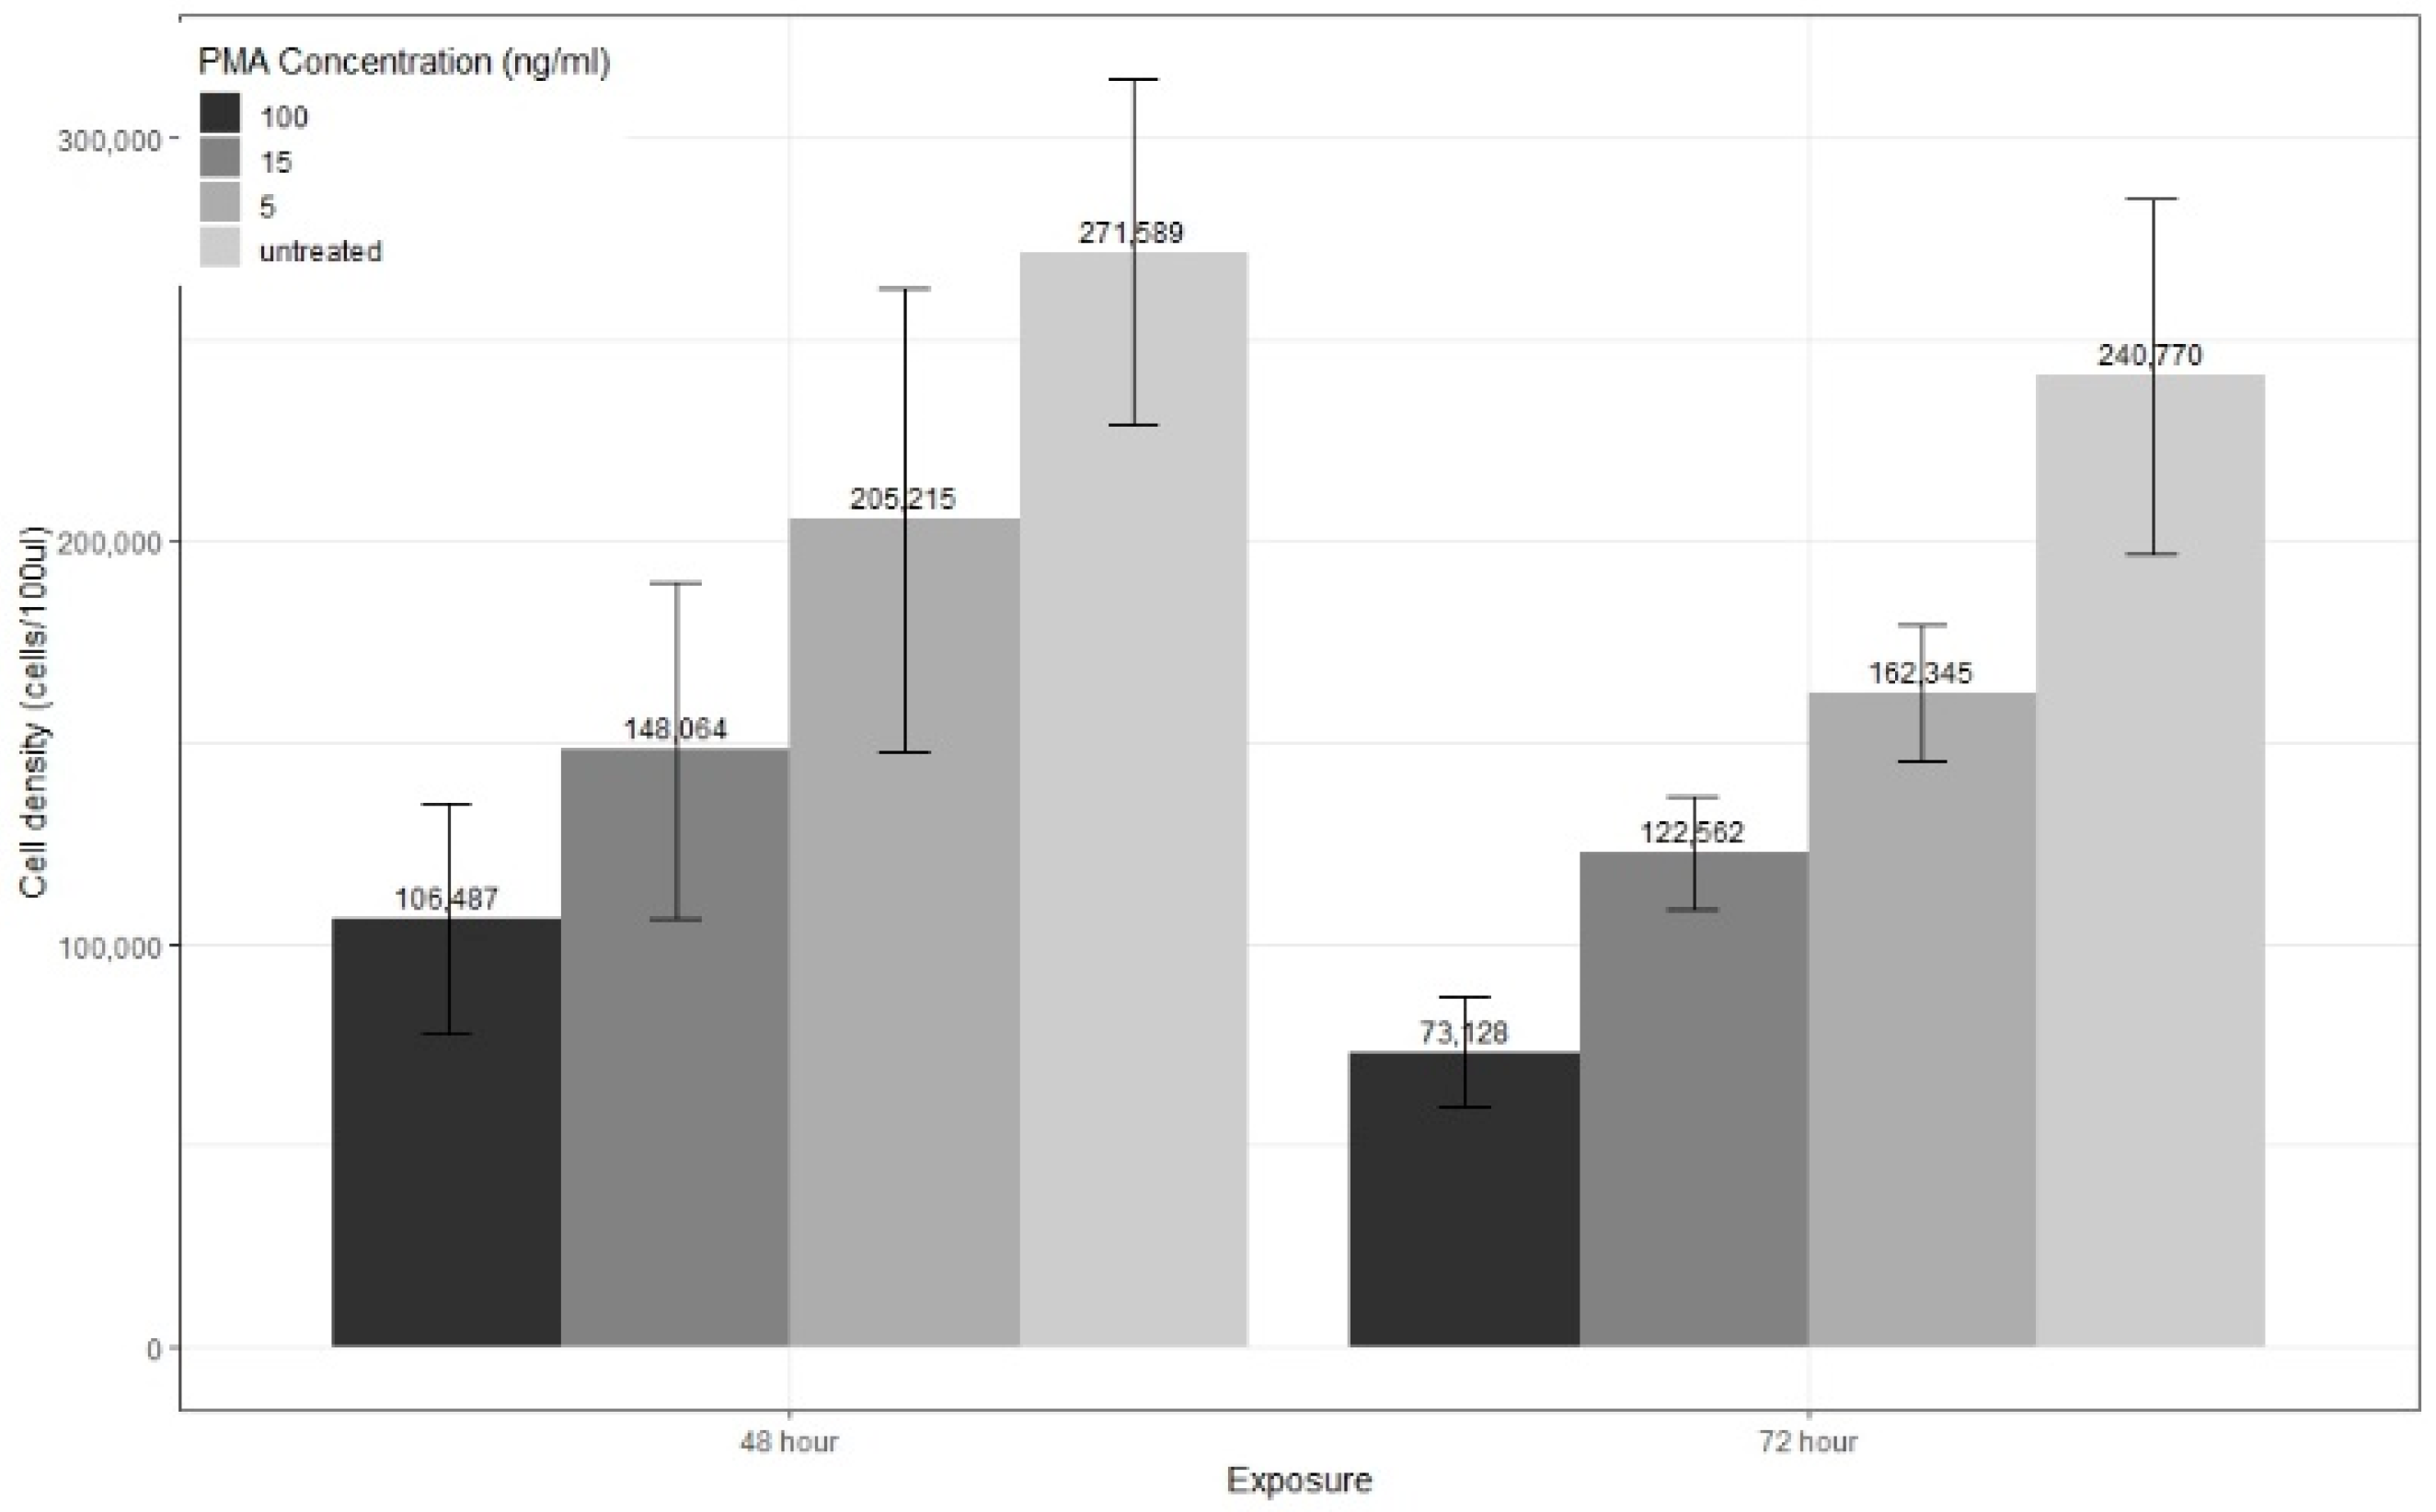
3.2. PMA Differentiation Protocol and CD14 Cell Surface Marker Expression

3.2.1. Exposure Time

Chanput et al., [10] highlight that, for THP-1 differentiation to occur, PMA exposure should range from 24 to 72 h at 100 ng/mL. Park et al. [17] and Lund et al. [18] tested lower concentrations of PMA over a 48 h exposure. Both studies recommended lower PMA concentrations based on percentage adherence and cell morphology, as well as CD14 expression in the Park et al. study. Lund et al., [18] used a 48 h exposure period based on findings by Schwende et al. [22], who found TNF-α protein expression peaked after LPS exposure with THP-1 cells exposed to PMA for 48 h. However, it was not stated in the study whether there was a statistically significant difference in TNF-α levels for 48 h exposure versus 72 h exposure. CD14, a cell surface protein involved in the LPS receptor complex [23], is used as a marker of macrophage differentiation [24,25]. Assessing CD14 levels after 48 and 72 h exposure was thus carried out to compare the difference between concentrations of PMA at each exposure time and between concentrations within each exposure time (Figure 2).
There was no statistically significant difference in CD14 levels over the exposure time or between exposures with respect to concentration. Overall cells exposed to 15 ng/mL of PMA for 72 h (65.27% ± 8.3) had the highest CD14 expression, followed by cells exposed to 15 ng/mL for 48 h (44.1% ± 2.63) (Figure 2 Left).

3.2.2. Concentration

The highest CD14 levels expressed were observed for 15 ng/mL PMA-exposed cells at 48 and 72 h. Interestingly, cells treated with 5 ng/mL PMA had higher CD14 levels than 100 ng/mL for 48 h and 72 h exposures (Figure 2). Furthermore, CD14 levels in cells exposed to 5 ng/mL of PMA were similar to those of cells treated with 15 ng/mL exposed for 48 h. Cells treated with 15 ng/mL or 5 ng/mL of PMA for 48 h were significantly different to untreated cells (Table 1). The CD14 levels for 15 ng/mL PMA were also statistically significant compared to 100 ng/mL and 5 ng/mL when exposed for 72 h (Table 1). Based on these findings, the much lower PMA concentrations at either 48 or 72 h exposure resulting in higher CD14 levels would thus be suitable THP-1 differentiation protocols. However, when assessing the differentiation potential of a protocol, the proliferation ability, or absence of proliferation [10,16], can also be considered. In this study, it was found that THP-1 cells treated with 5 ng/mL PMA for 48 and 72 h showed continued proliferation (Figure 3).
Based on qualitative observations (not shown) during experiments for all three concentrations of PMA tested, some cells remained in suspension, whereas adherence is the trademark of macrophage differentiation [18]. Moreover, the number of cells in suspension appeared to increase in a dose-dependent manner. Despite the fact that high CD14 levels were observed for 5 ng/mL PMA-treated cells, the continued proliferation and the high number of observed suspension cells would suggest a differentiation protocol using 5 ng/mL PMA for 48 or 72 h exposure may not suitably differentiate THP-1 cells. Previous studies have assessed PMA differentiation protocols based on percentage adherence and loss of proliferation but without CD14 expression levels. Lund et al. [18] assessed percentage adherence when THP-1 cells were differentiated with 5 ng/mL of PMA for 48 h with varying rest periods. They found that adherence remained at 80% or higher but decreased as the rest period increased. They did not assess proliferation after differentiation or CD14 levels. Park et al. [17] looked at percentage adherence and found 5 ng/mL PMA for 48 h resulted in over 80% adherence. They also assessed CD14 mRNA levels and found that 2.5 ng/mL and 5 ng/mL treated cells had levels greater than cells treated with 100 ng/mL PMA. They did not assess proliferation after differentiation.
The high percentage adherence for both studies for cells differentiated with 5 ng/mL versus the higher number of suspension cells observed in this study could be explained by the calculation method used to determine the percentage. As outlined by Lund et al., non-adherent cells were counted, then the number was subtracted from the original seeding density and divided by this seeding density. If, as found in this study, THP-1 cells treated with 5 ng/mL PMA still proliferate, then subtracting the number of non-adherent cells from the seeding density may give an inaccurate number, as there are more cells present than at initial seeding. It can also be seen in Figure 3 that differentiated cells, such as the 100 ng/mL and 15 ng/mL exposed cells, have lower cell densities then initially seeded. This may be due to a combination of halted proliferation and a natural decline due to cell death. Cells treated with 5 ng/mL PMA can be seen to have higher cell densities overall. Thus, any adherence percentage calculations based on initial seeding density may give misleading results. The 15 ng/mL PMA concentration for 72 h exposure is more suitable, with a higher CD14 expression, lack of proliferation, and subjectively greater adherence.

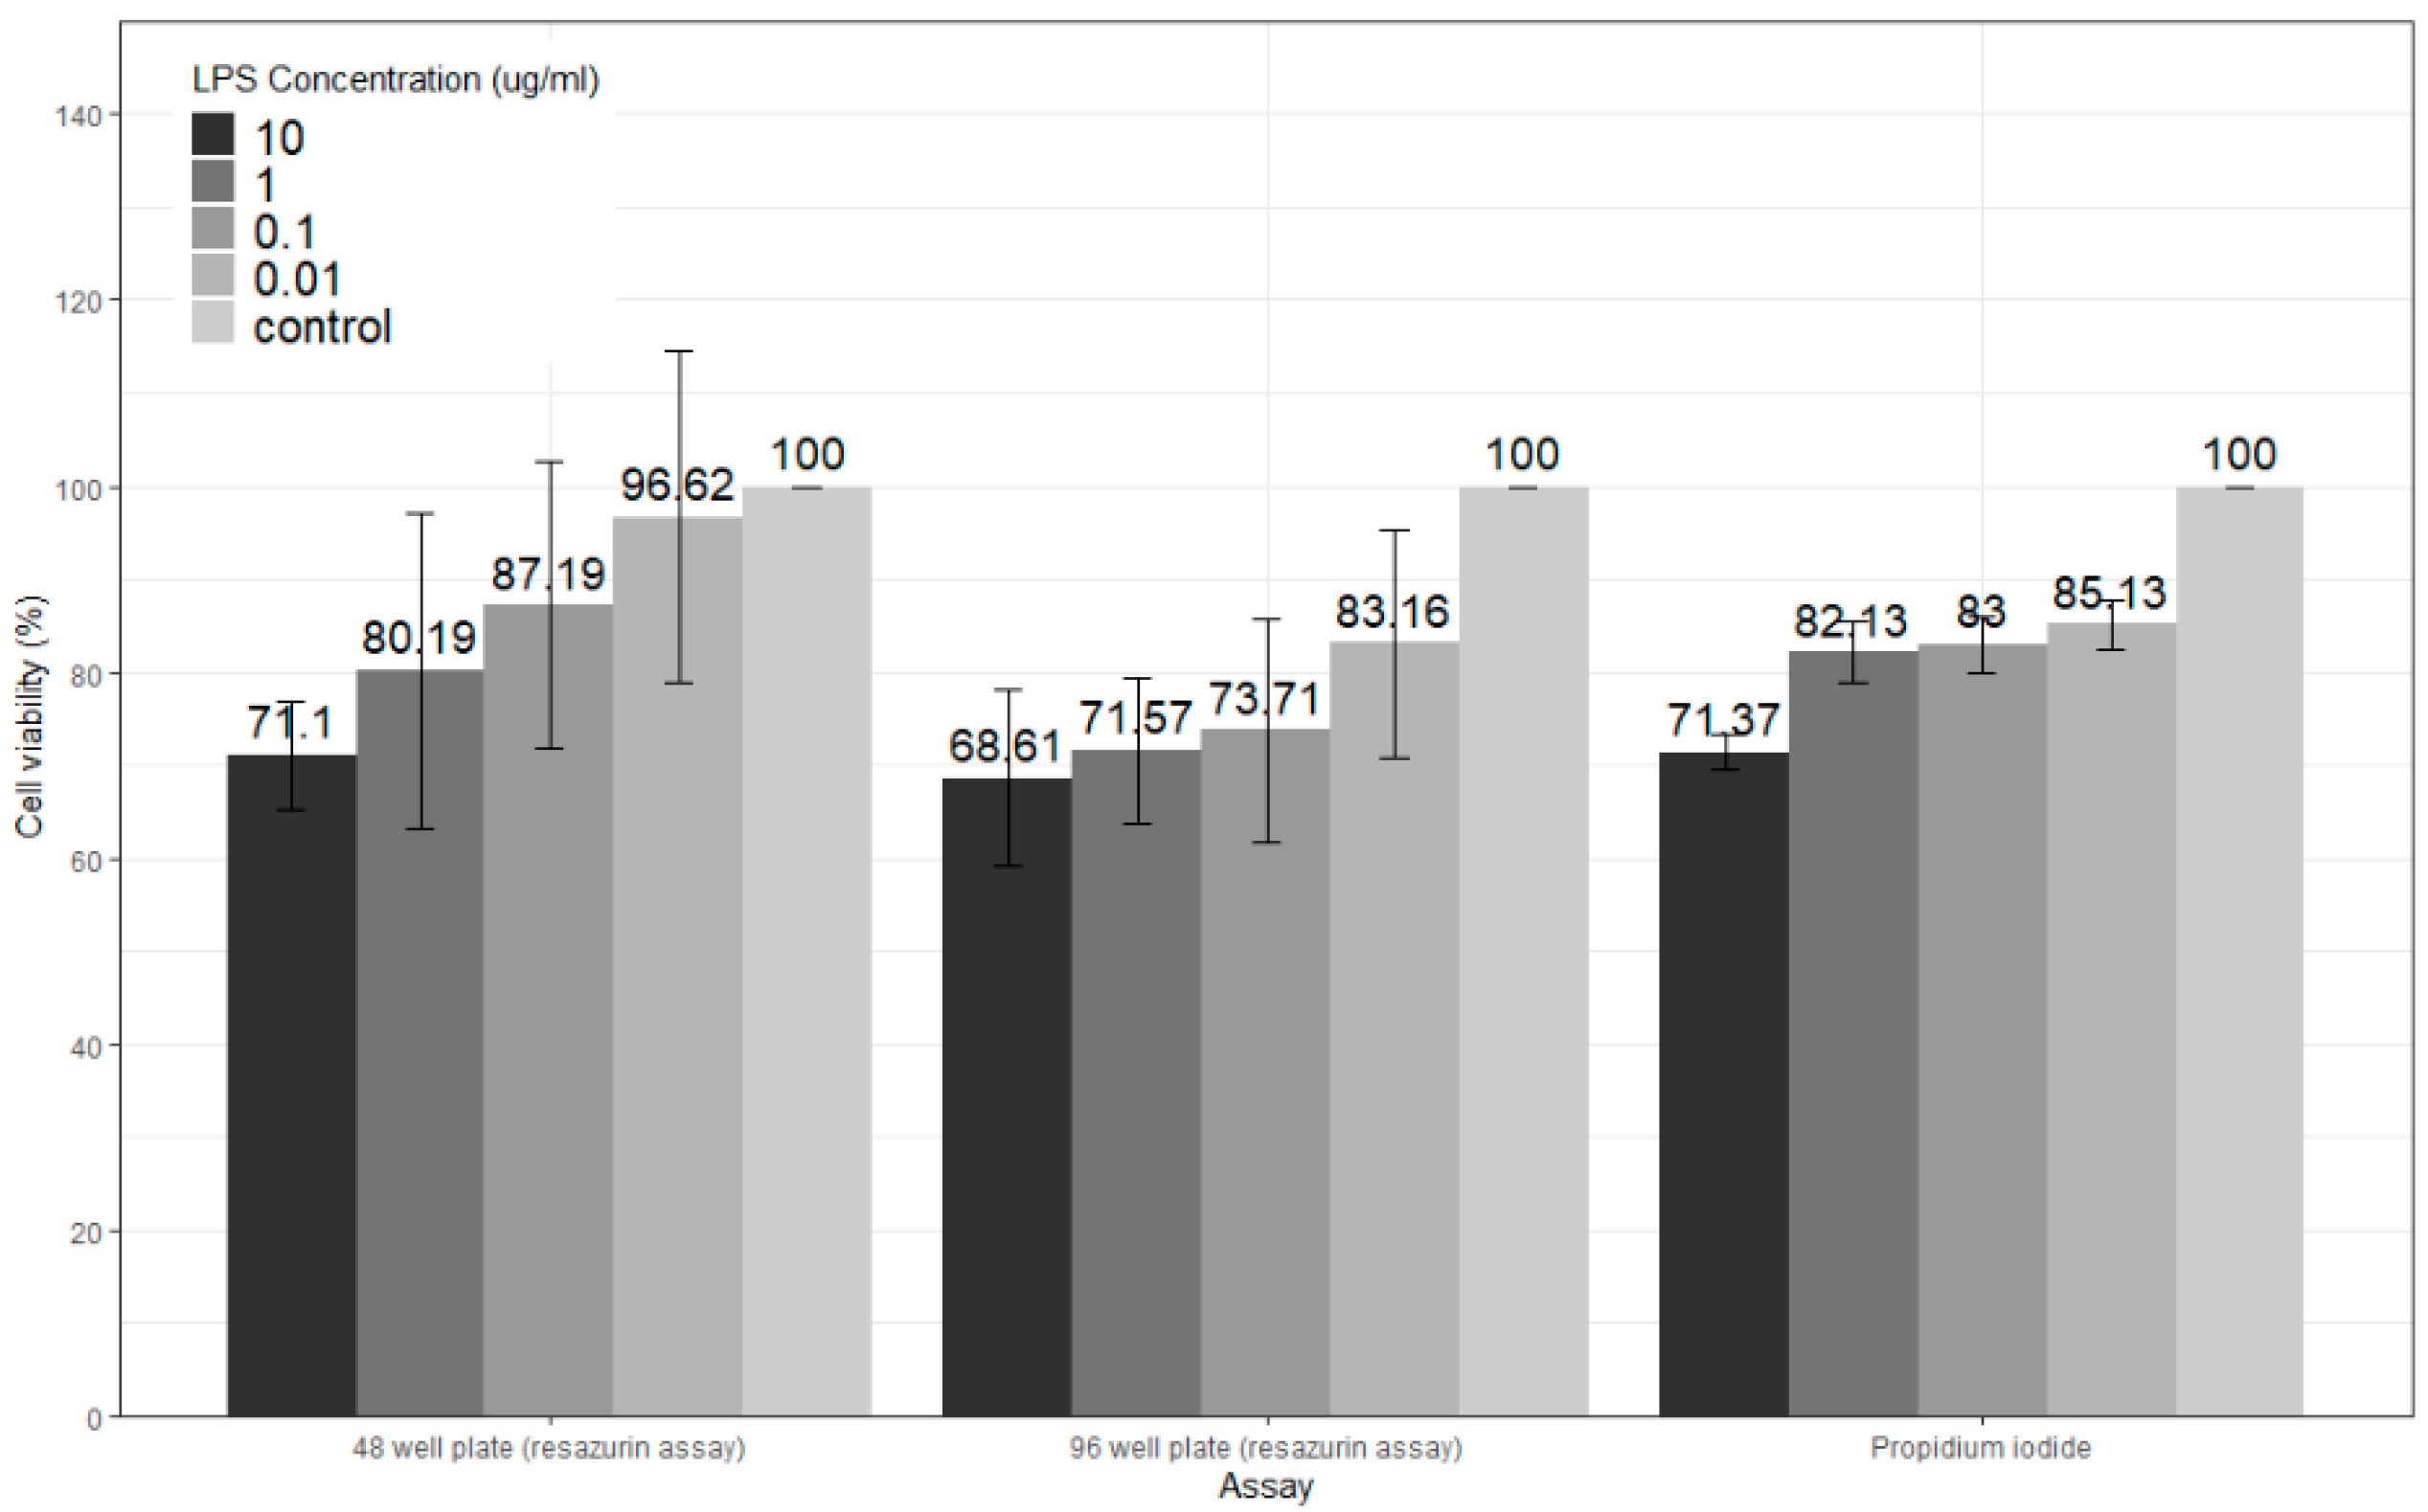
3.3. LPS Cytotoxicity

Using the optimized PMA protocol (15 ng/mL for 72 h), LPS cytotoxicity on differentiated THP-1 cells was determined. Both the resazurin assay and flow cytometric analysis following PI staining reported ~70% cell viability following exposure of PMA-differentiated THP-1 cells to the highest dose of 10 µg/mL of LPS for 24 h (Figure 4). Liu et al. [20] reported less than ~70% viability using the MTT assay following exposure of cells for a similar time (24 h) to the same dose of LPS (10 µg/mL), while Huo et al. [21] found that 5 µg/mL LPS resulted in less than ~75% viability using the CCK-8 assay, with 25 µg/mL LPS resulting in less than 60% viability for 24 h exposure. Initial experiments with the resazurin assay showed cell viability of over 100% for 10 µg/mL LPS (24 h) (data not shown). Further work on cell seeding optimization improved the resazurin assay for PMA-differentiated THP-1 cells, showing a dose-dependent decrease in cell viability when using much higher seeding densities (1 × 10⁵ cells/mL versus 3.33 × 10⁵ cells/mL with 96-well plates) (data not shown). Extremely low seeding densities of differentiated THP-1 cells (1 × 10⁵ cells/mL) were used for the MTT [20] and CCK-8 [21] cytotoxicity assays by Liu et al. and Huo et al., respectively. The current study assessed higher seeding densities of 3.33 × 10⁵ cells/mL–7.5 × 105 cells/mL for the resazurin assay, in addition to PI staining, to confirm the findings from the resazurin assay and found 10 µg/mL LPS resulted in ~30% cell death (Figure 4).
Forty-eight-well plates were compared to ninety-six-well plates to assess whether large surface areas and higher seeding densities may also affect the cytotoxic effect of LPS. Based on statistical analysis, there were no significant differences between 48-well plates and 96-well plates. The much higher seeding density used for the PI staining (1 × 10⁶ cells/mL) in a 6-well plate did not show any statistically significant differences to the resazurin assay findings (Figure 4).

4. Conclusions

Following the results and observations from this study, it may be concluded that exposing THP-1 cells to 15 ng/mL PMA for 72 h is sufficient for differentiation, based on higher CD14 levels compared to 100 ng/mL with an absence in proliferation, subjective analysis of changes in morphology and greater adherence, and higher cell viability at 15 ng/mL for 72 h exposure. Further work to investigate these findings at the molecular level is recommended The highest concentration of LPS (10 µg/mL) resulted in over 70% cell viability. Comparisons were carried out on results between 48 and 96 well plates and PI staining to identify any differences dependent on cell seeding or surface area. No significant differences were found. All findings were in agreement, but the work highlighted the importance of seeding optimization for these assays. Future work may assess cytotoxicity at shorter timepoints as used in molecular work and at higher concentrations to identify the LD50. The findings from this research shows the importance of multi-endpoint analysis and optimizing assays to establish a fully optimized protocol, which is essential to ensure the results obtained from in-vitro immunomodulatory investigations are reliable.

Author Contributions

Conceptualization, E.B.; methodology, E.B.; software, E.B.; data curation, E.B.; writing—original draft preparation, E.B.; writing—review and editing, E.B., S.K. and S.D.; supervision, S.K. and S.D.; project administration, S.K.; funding acquisition, S.K. and S.D. All authors have read and agreed to the published version of the manuscript.

Funding

This research was funded by the AIT Presidential Seed Fund 2020 (now known as Technological University of the Shannon: Midlands Midwest) and the HEA [Higher Education Authority] and DFHERIS [The Department of Further and Higher Education, Research, Innovation and Science] for the TUS HEA COVID Support (Funding number PDS2020).

Institutional Review Board Statement

Not applicable.

Informed Consent Statement

Not applicable.

Data Availability Statement

The data presented in this study are available on request from the corresponding author until such time as the data can be uploaded to an open science repository. They will then be linked to the corresponding author’s ORCID. The data are not currently publicly available due to limited access.

Conflicts of Interest

The authors declare no conflict of interest.

References

  1. Tsuchiya, S.; Yamabe, M.; Yamaguchi, Y.; Kobayashi, Y.; Konno, T.; Tada, K. Establishment and characterization of a human acute monocytic leukemia cell line (THP-1). Int. J. Cancer 1980, 26, 171–176. [Google Scholar] [CrossRef] [PubMed]
  2. van de Velde, J.; Wilbers, R.H.P.; Westerhof, L.B.; van Raaij, D.R.; Stavrakaki, I.; Sonnenberg, A.S.M.; Bakker, J.; Schots, A. Assessing the immunomodulatory potential of high-molecular-weight extracts from mushrooms; an assay based on THP-1 macrophages. J. Sci. Food Agric. 2015, 95, 344–350. [Google Scholar] [CrossRef] [PubMed]
  3. Kim, M.-J.; Yun, J.-M. Molecular mechanism of the protective effect of zerumbone on lipopolysaccharide-induced inflammation of THP-1 cell-derived macrophages. J. Med. Food 2019, 22, 62–73. [Google Scholar] [CrossRef]
  4. Zhou, X.; Ma, S. Anti-lipopolysaccharide egg yolk antibodies enhance the phagocytosis of mammalian phagocytes. Biol. Open 2018, 7, bio032821. [Google Scholar] [CrossRef] [PubMed]
  5. Bermúdez-Oria, A.; Rodríguez-Gutiérrez, G.; Alaiz, M.; Vioque, J.; Girón-Calle, J.; Fernández-Bolaños, J. Pectin-rich extracts from olives inhibit proliferation of Caco-2 and THP-1 cells. Food Funct. 2019, 10, 4844–4853. [Google Scholar] [CrossRef]
  6. Wu, S.-C.; Lee, B.-H. Buckwheat polysaccharide exerts antiproliferative effects in THP-1 human leukemia cells by inducing differentiation. J. Med. Food 2011, 14, 26–33. [Google Scholar] [CrossRef]
  7. Elamine, Y.; Lyoussi, B.; Miguel, M.G.; Anjos, O.; Estevinho, L.; Alaiz, M.; Girón-Calle, J.; Martín, J.; Vioque, J. Physicochemical characteristics and antiproliferative and antioxidant activities of Moroccan Zantaz honey rich in methyl syringate. Food Chem. 2021, 339, 128098. [Google Scholar] [CrossRef]
  8. Sharif, O.; Bolshakov, V.N.; Raines, S.; Newham, P.; Perkins, N.D. Transcriptional profiling of the LPS induced NF-κB response in macrophages. BMC Immunol. 2007, 8, 1–17. [Google Scholar] [CrossRef]
  9. Daigneault, M.; Preston, J.A.; Marriott, H.M.; Whyte, M.K.B.B.; Dockrell, D.H. The identification of markers of macrophage differentiation in PMA-stimulated THP-1 cells and monocyte-derived macrophages. PLoS ONE 2010, 5, e8668. [Google Scholar] [CrossRef]
  10. Chanput, W.; Mes, J.J.; Wichers, H.J. THP-1 cell line: An in vitro cell model for immune modulation approach. Int. Immunopharmacol. 2014, 23, 37–45. [Google Scholar] [CrossRef]
  11. Baxter, E.W.; Graham, A.E.; Re, N.A.; Carr, I.M.; Robinson, J.I.; Mackie, S.L.; Morgan, A.W. Standardized protocols for differentiation of THP-1 cells to macrophages with distinct M(IFNγ+LPS), M(IL-4) and M(IL-10) phenotypes. J. Immunol. Methods 2020, 478, 112721. [Google Scholar] [CrossRef] [PubMed]
  12. Italiani, P.; Boraschi, D. From monocytes to M1/M2 macrophages: Phenotypical vs. functional differentiation. Front. Immunol. 2014, 5, 514. [Google Scholar] [CrossRef] [PubMed]
  13. Liu, Y.; Xu, R.; Gu, H.; Zhang, E.; Qu, J.; Cao, W.; Huang, X.; Yan, H.; He, J.; Cai, Z. Metabolic reprogramming in macrophage responses. Biomark. Res. 2021, 9, 1–17. [Google Scholar] [CrossRef] [PubMed]
  14. van den Broek, P.J.; Hiemstra, P.S.; Bril-Bazuin, C. Uptake of antibiotics by monocytes and macrophages. In Mononuclear Phagocytes, 1st ed.; Furth, R., Ed.; Springer: Dordrecht, The Netherlands, 1992; pp. 550–553. [Google Scholar] [CrossRef]
  15. Repetto, G.; del Peso, A.; Zurita, J.L. Neutral red uptake assay for the estimation of cell viability/cytotoxicity. Nat. Protoc. 2008, 3, 1125–1131. [Google Scholar] [CrossRef] [PubMed]
  16. Spano, A.; Barni, S.; Sciola, L. PMA withdrawal in PMA-treated monocytic THP-1 cells and subsequent retinoic acid stimulation, modulate induction of apoptosis and appearance of dendritic cells. Cell Prolif. 2013, 46, 328–347. [Google Scholar] [CrossRef] [PubMed]
  17. Park, E.K.; Jung, H.S.; Yang, H.I.; Yoo, M.C.; Kim, C.; Kim, K.S. Optimized THP-1 differentiation is required for the detection of responses to weak stimuli. Inflamm. Res. 2007, 56, 45–50. [Google Scholar] [CrossRef]
  18. Lund, M.E.; To, J.; O’Brien, B.A.; Donnelly, S. The choice of phorbol 12-myristate 13-acetate differentiation protocol influences the response of THP-1 macrophages to a pro-inflammatory stimulus. J. Immunol. Methods 2016, 430, 64–70. [Google Scholar] [CrossRef]
  19. Chanput, W.; Mes, J.; Vreeburg, R.A.M.; Savelkoul, H.F.J.; Wichers, H.J. Transcription profiles of LPS-stimulated THP-1 monocytes and macrophages: A tool to study inflammation modulating effects of food-derived compounds. Food Funct. 2010, 1, 254–261. [Google Scholar] [CrossRef]
  20. Liu, X.; Yin, S.; Chen, Y.; Wu, Y.; Zheng, W.; Dong, H.; Bai, Y.; Qin, Y.; Li, J.; Feng, S.; et al. LPS-induced proinflammatory cytokine expression in human airway epithelial cells and macrophages via NF-κB, STAT3 or AP-1 activation. Mol. Med. Rep. 2018, 17, 5484–5491. [Google Scholar] [CrossRef]
  21. Huo, J.; Wu, J.; Zhao, M.; Sun, W.; Sun, J.; Li, H.; Huang, M. Immunomodulatory activity of a novel polysaccharide extracted from Huangshui on THP-1 cells through NO production and increased IL-6 and TNF-α expression. Food Chem. 2020, 330. [Google Scholar] [CrossRef]
  22. Schwende, H.; Fitzke, E.; Ambs, P.; Dieter, P. Differences in the state of differentiation of THP-1 cells induced by phorbol ester and 1,25-dihydroxyvitamin D3. J. Leukoc. Biol. 1996, 59, 555–561. [Google Scholar] [CrossRef] [PubMed]
  23. Dobrovolskaia, M.A.; Vogel, S.N. Toll receptors, CD14, and macrophage activation and deactivation by LPS. Microbes Infect. 2002, 4, 903–914. [Google Scholar] [CrossRef]
  24. da Silva, T.A.; Zorzetto-Fernandes, A.L.V.; Cecílio, N.T.; Sardinha-Silva, A.; Fernandes, F.F.; Roque-Barreira, M.C. CD14 is critical for TLR2-mediated M1 macrophage activation triggered by N-glycan recognition. Sci. Rep. 2017, 7. [Google Scholar] [CrossRef]
  25. Naeim, F.; Rao, P.N.; Song, S.X.; Phan, R.T. Principles of Immunophenotyping. In Atlas of Hematopathology, 2nd ed.; Academic Press: London, UK, 2018; pp. 29–56. [Google Scholar] [CrossRef]
Figure 1. (Right) Effects of PMA on THP-1 cells viability with Trypan Blue exclusion assay. Data shown as the mean ± SD from six independent experiments compared with one-way ANOVA and Dunnett’s post hoc test. (Left) PI stain analysis of PMA differentiated THP-1 cells, where data were subtracted from 100 to identify cell viability and allow for comparison to other cytotoxicity assay results. Data shown as mean ± SD from three independent experiments compared with repeated measures ANOVA.
Msf 11 00005 g001
Figure 2. (Left) Bar chart detailing CD14 expression levels (%) for PMA concentrations (ng/mL) grouped by exposure (hours). Data expressed as mean ± SD for three independent experiments compared with repeated measures ANOVA. (Right) Stacked histogram of fluorescence representing CD14 cell surface marker antibody levels from PMA-treated THP-1 cells for 48-h and 72 h exposures, 100 ng/mL −5 ng/mL, and untreated cells.
Msf 11 00005 g002
Figure 3. Cell density per 100 µL of THP-1 cells treated with PMA grouped by exposure time. Cell seeding density was 1.5 × 10⁵ cells/100 µL. Data expressed as means ± SD of three independent experiments and compared with repeated measures ANOVA. Data gathered from flow cytometry analysis of CD14 expression.
Msf 11 00005 g003
Figure 4. Effects of LPS on PMA-differentiated THP-1 cells’ viability between two cytotoxicity assays: one with two different plate types (resazurin assay) and one with PI staining where data were subtracted from 100 to identify cell viability and allow for comparison to other cytotoxicity assay results. Data shown as the mean ± SD from three independent experiments. Data compared with two-way ANOVA and Tukey’s post hoc.
Msf 11 00005 g004
Table 1. Difference in CD14 expression between concentrations given exposure, including p-values and significance of three independent experiments. Data comparisons based on means with repeated measures ANOVA.
Concentrations (ng/mL)ExposureDifference (CD14 %)p-ValueSignificance (* = p < 0.05)
100—1548 h−23.920.1474
100—5−21.650.2020
100—untreated18.550.3049
15—52.270.9953
15—untreated42.470.0109*
5—untreated40.200.0148*
100—1572 h−29.900.0022*
100—5−2.900.9449
100—untreated34.770.0008*
15—527.000.0042*
15—untreated64.670.0000**
5—untreated37.670.0005*
Publisher’s Note: MDPI stays neutral with regard to jurisdictional claims in published maps and institutional affiliations.

