Article

Investigation of Grid-Tied Photovoltaic Power Plant on Medium-Voltage Feeder: Palestine Polytechnic University Case Study

1
College of Engineering and Technology, Palestine Polytechnic University (PPU), Hebron P726, Palestine
2
Environmental Engineering and Applied Computer Science, Renewable Energies and Decentralized Energy Supply, Ostwestfalen-Lippe Technical University/Standort Höxter, An der Wilhelmshöhe 44, 37671 Höxter, Germany
*
Author to whom correspondence should be addressed.
Submission received: 7 November 2024 / Revised: 6 January 2025 / Accepted: 8 January 2025 / Published: 16 January 2025

Abstract

:
The conventional unidirectional power flow model of centralized energy grids is being revolutionized by integrating renewable energy sources, particularly photovoltaic (PV) systems, to meet the escalating demand for electricity while ensuring sustainability. However, this integration challenges the efficiency and performance of power systems and impacts various parameters, including power quality, voltage profile, power factor, power loss, and load flow. This paper investigates the effects and performance of a grid-tied PV system integrated into the conventional power system, focusing on the Palestine Polytechnic University (PPU) 230 kWp PV plant as a real-world case study. Simulations conducted using ETAP software revealed that integrating the PV system resulted in a slight increase in the voltage level at the main bus of the PPU feeder, with an increase of 0.03% at the medium-voltage level. Additionally, the voltage level at the Point of Common Coupling (PCC) increased by 0.51% with a PV penetration level of only 14.7%, which remains within the acceptable range according to IEEE 1547 standards. These findings underscore the minimal impact of the PV system on the voltage profile and highlight the system’s ability to maintain power quality and efficiency even with the addition of renewable energy sources. The daily load profiles were studied with and without the PV system, providing a comprehensive analysis of its effects on the grid.

1. Introduction

The world is shifting away from traditional methods of generating electricity and toward renewable energy due to concerns about pollution from burning fuels [1,2]. Distributed generation (DG) can be defined as an electric power generation system connected either to distributed networks or on the customer side of the network. DG from solar and wind systems is becoming quite important everywhere, especially in Palestine [3,4,5,6]. Distribution networks have been constructed to enable bidirectional power flow due because of the use of DG in the network [7,8]. However, this arrangement has obstacles, such as sudden increases in voltage along feeders, which can impact any distribution network, particularly when solar power output varies quickly due to passing clouds [7,8]. The use of on-grid PV systems significantly affects the performance of the distribution network performance [9].
PV plants fall into three categories: small, with less than 10 kW; medium, with 10 kW to 500 kW; and large, with more than 500 kW. While smaller plants connect to local distribution networks, larger plants integrate with the distribution network (DN) [10]. Forson et al. [11] investigated the impact of a PV plant installed on rooftops in various sizes and load scenarios. The study examined how PV systems affected the voltage profile and power losses in a typical low-voltage (LV) network. The findings demonstrated that the PV systems regulated the voltage profile within the network standard and significantly reduced power losses. Al-Shetwi et al. [12] developed a simulation model to examine the power quality requirements of a grid-connected PV plant. They analyzed and evaluated the effects of voltage sag, voltage flicker, harmonics, voltage imbalance, and frequency variation on the network. Colmenar-Santos et al. [13] presented a review paper on the technical challenges of grid-connected PV systems. The study highlighted the need for key technical recommendations and future regulatory parameters for the future development of and investment in PV grid-connected systems. Panigrahi et al. [14] discussed control strategies and grid synchronization methods for small-scale PV systems in distribution networks. Kharrazi et al. [15] presented a review study on uncertain variable representation and stochastic assessment techniques for power system quality analysis in low-voltage distribution networks. Morey et al. [16] reviewed the solar PV configurations, control strategies, and ancillary services. They categorize grid-connected systems into DC-side and AC-side control and discuss their features, challenges, and advanced techniques. Their article compares the control techniques, focusing on power quality, stability, and reliability. It also compares industrial inverters, power ratings, voltage ratings, configurations, and advanced functions. Zadehbagheri et al. [17] numerically examined the influence of PV systems on the LV and MV distribution networks. The presented model can provide suitable allocation for the PV systems within the network. Furthermore, the load flow of the distribution network with the PV systems was studied and analyzed. Maghami et al. [18] presented two numerical methods to study the influence of PV penetration on a typical medium-voltage distribution network in Malaysia. The methods were static and dynamic analyses, utilizing the Digsilent Power Factory software. It was found that the voltage profile was improved with the increase in PV penetration levels. Furthermore, the voltage profiles of the network remained within the acceptable voltage limits. Kisuule et al. [19] studied the effect of the PV penetrations on the LV networks under different loading conditions. The results indicated that the voltage base reliability indices were improved significantly along with the increase in the PV penetration levels.
There are difficulties in integrating DG systems, including grid instability, stress on transformers, and fluctuations in voltage, which ultimately decrease power quality [4]. Although DG power is typically used to supply local electricity demand, additional power may occasionally be sold directly to the utility. However, DG systems can be powered by renewable sources such as wind, solar, hydro, or geothermal systems, which are more commonly employed, or by non-renewable sources like petrol or oil engines [20]. In electrical systems, distributed generation (DG) is a flexible, effective source that reduces peak loads, enhances power quality, and minimizes network losses. At high penetration levels, site-specific requirements and initial large investments in renewable energy systems may affect grid stability and power quality [4,21]. Most inverters used in grid-tied photovoltaic systems are designed to operate in a quiet utility interactive mode, which requires the existence of the grid [22].
In Palestine, there is a growing acceptance of solar systems due to high demand and occasional shortages during peak hours. This change is being driven by beneficial municipal regulations and the grid-wide strategic placement of PV plants near to consumers. Large-scale implementation, however, necessitates the establishment of specific controls to track and assess the effects on grid stability and reliability. This paper presents a model of a real 11 kV feeder case study integrated with a PV plant, considering all necessary limitations for modeling, analysis, and simulation. This study emphasizes the PPU medium-voltage 11 kV feeder, which is integrated with Palestine Polytechnic University’s PV grid-tied power plant. The modeling of the feeder was conducted using Electrical Transient Analyzer Program (ETAP 16) software. The voltage and power profiles of buses on the grid were analyzed. The PPU PV plant was then integrated with the grid to study the impact of adding PV generation on power quality parameters, including voltage profile, active power, reactive power, apparent power, power factor, and power losses.

2. Impact of DG on Grids and PV Grid Integration Standards

The impact of DG remains insignificant when DG penetration rates are low [23]. However, at larger scales, DG exacerbates grid issues such as harmonics, voltage fluctuations, and frequency instability. These technical challenges comprise factors such as power level control, power factor management, and the ability to operate independently in islanding mode. Solutions to mitigate these challenges are discussed in [24]. High penetrations of PV can affect network voltage through voltage increases and fluctuations, especially when adjacent to lightly loaded feeders. Furthermore, the voltage profile performance can be affected by the continuous variation in PV system output in the distribution network. The voltage issue in distribution systems resulting from PV integration is primarily characterized by voltage rise, with network voltage imbalance being a concern in certain cases [24,25,26]. Inverters operating at unity power factor maximize the economic feasibility of PV plants by meeting the most active power demands and reducing reliance on utility [26]. Distributed generators supply electrical power locally, decreasing grid consumption and reducing current in grid lines. This installation aims to minimize power losses and bring generation closer to loads; however, challenges arise with reverse power flow [4,27,28,29]. At high penetration levels, a PV system provides most of the active power demand, decreasing grid dependence while maintaining a similar reactive power demand, resulting in a lower power factor [30]. The standard power flow should include considerations of voltage, active and reactive power, and power factor. With increased DG penetration, voltage deviations can occur in distribution grids due to changes in power flow. Voltage control using reactive power is often limited in these grids due to low X/R ratios which are approximately near to 1. One proposed solution involves adding a controllable inductance to the feeder [31]. PV penetration has significantly increased in Germany, Spain, and France, affecting the standard voltage levels as outlined in Table 1 [32,33,34]. The main output of a PV power plant is active power, maintained at a unity power factor during rated production. The power factor range should preferably cover 0.95 lagging to 0.95 leading power factor when operating at full capacity. Automatic voltage regulation is critical for maintaining voltage within a narrow range of +/−5% around the desired set point.

3. Case Study

The voltage level in the Hebron Electrical Power Distribution System (HEPDS) varies from 161 kV in the transmission line to 33 kV supplied to seven substations, with a voltage level of 11 kV, as shown in Figure 1. Figure 2 illustrates the single-line diagram of the PPU feeder, which is a feeder at station number 7. Station seven contains two power transformers, each rated at 33/11 kV and 10 MVA, and a service transformer rated at 400 kVA.
The first transformer delivers energy to the PPU feeder and Zallum feeder, while the second transformer feeds the Al-Saheb feeder and Akasheh feeder. This article aims to study the PPU feeder. The HEPDS is monitored by a supervisory control and data acquisition (SCADA) system, ensuring that each station and feeder records voltage, current, power, and power factor for every hour of the day. Figure 3 displays the daily load profile of the PPU feeder, whereas Figure 4 shows the PPU distribution transformer profile. These figures indicate the concentration of loads during the community’s official working hours.
A 230 kW PV system with 11 inverters, each rated at 21 kW, is installed on the Palestinian Polytechnic University (PPU) buildings. The PPU load is connected to the secondary side of an 11/0.4 kV, 1000 kVA distribution transformer, and the PPU campus is located 2900 m from station 7 at the end of the 11 kV PPU feeder. In Hebron, the average daily solar radiation ranges from 2.7 to 8.2 kWh/m2.day. As shown in Figure 5, the monitoring system’s observations of all of the PPU PV plant’s inverters were used to create the average daily profile of PV production. It can be seen that the maximum power that can be generated is about 200 kW at solar noon.

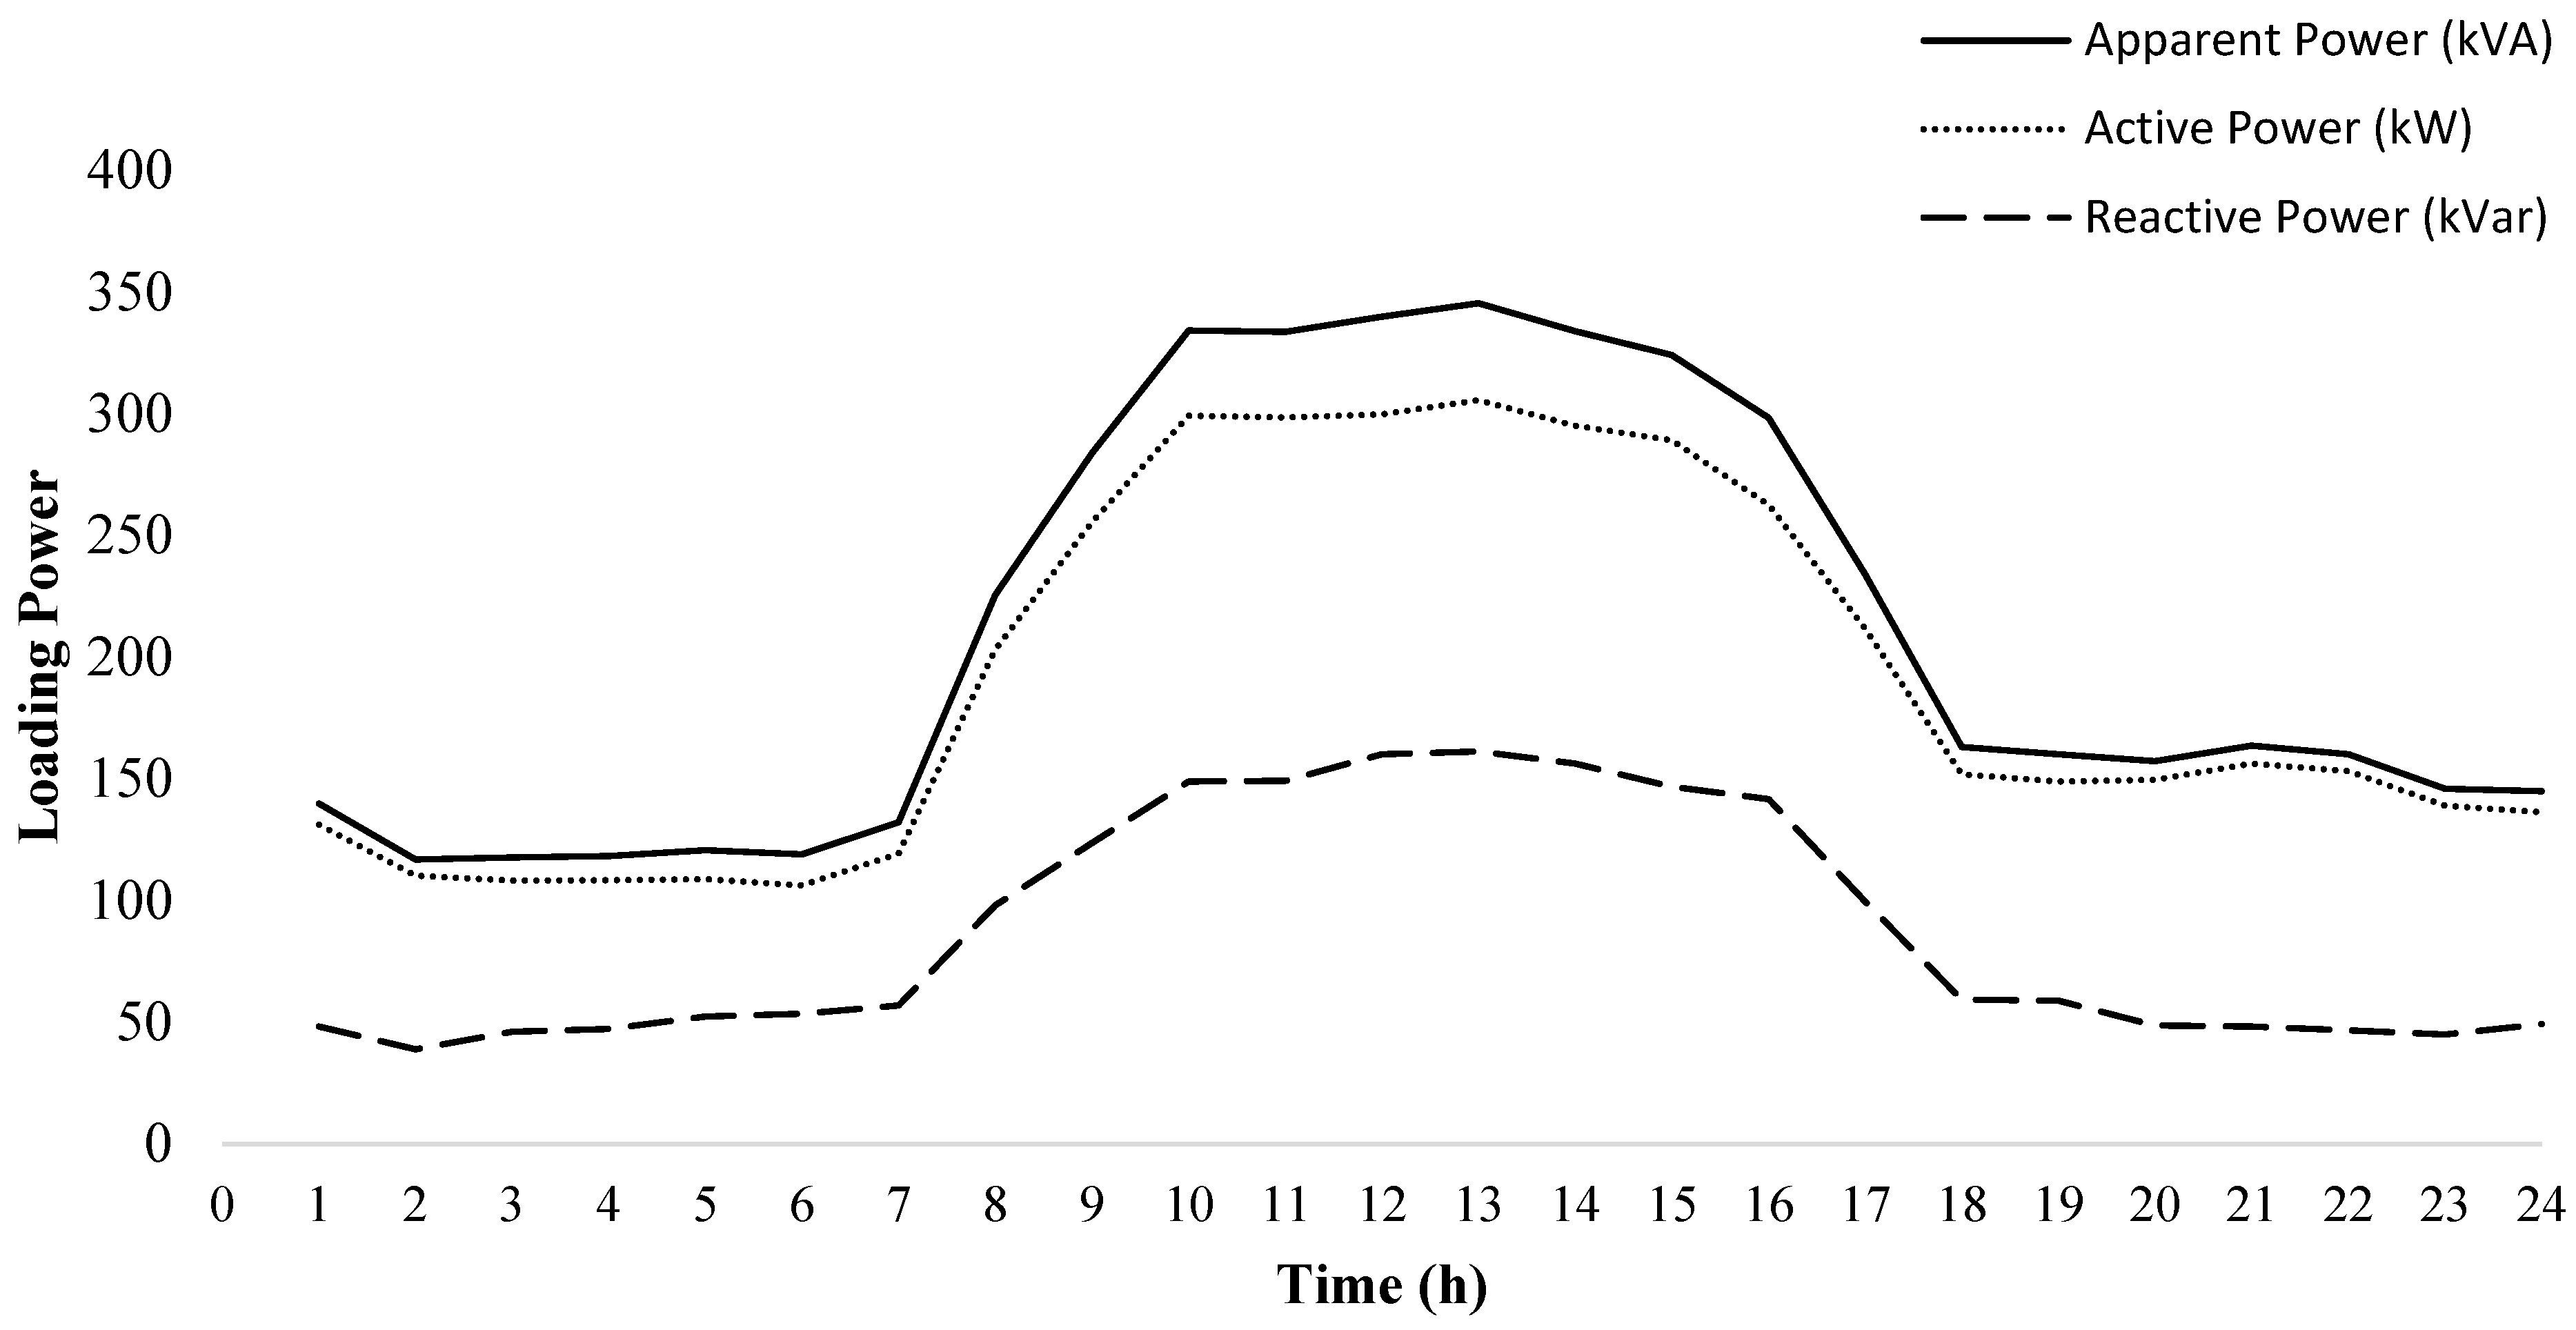
4. Results and Discussions

Figure 6 shows the PPU feeder network diagram. Using ETAP 16.0.0 software, the modeling and simulation of this feeder were investigated. To develop an accurate model of the PPU grid, all the electrical and physical characteristics and parameters of the feeder network, including the height of the towers, the distance between transmission lines, the feeder’s resistance and reactance values, and the ratings of the transformer and generator, were gathered and coded. In fact, the grid’s operation may be negatively impacted by the integration of PV systems with high penetration levels in a number of scenarios. Among these significant effects are voltage unbalance, voltage rise, and reverse power flow. The conditions both before and after the installation of the 230 kWp PV power plants were simulated using load-flow analysis conducted under steady-state conditions. However, the PPU PV system is connected to a low-voltage bus close to the load, indicating that the energy produced by the PV system can either be used directly by the load or injected into the MV feeder. The operation and performance of the electrical grid are directly affected by the connection of distributed generation (DG), with the network’s voltage profile, power, and power factor all changing as a result.
At the PPU feeder’s main bus, a voltage profile was created. Following the installation of the PV system, the medium-voltage level at the main bus showed a slight increase in voltage of 0.03%. This minor increase is explained by the PV plant’s low power contribution to the main feeder bus, as illustrated by the voltage drop curve in Figure 7; the worst-case voltage drop in the PPU feeder is approximately 2.2%. Real power drawn from the grid decreased when the PV system was connected to the feeder, and the power factor deteriorated. The apparent power and power factor at the feeder’s main bus are illustrated in Figure 8 and Figure 9, respectively. The maximum apparent power is approximately 5.2 kVA at a power factor of 0.87. The active power loss along the PPU feeder with and without the PV system is shown in Figure 10. It was indicated that connecting the PV system to the grid significantly reduced the real power losses. For example, the losses dropped by 50% at noon. This is because the PV plant provides the active power that the clients require, lowering the demand for active power from the network.
The distribution grid’s voltage may be affected by integrated distributed generation, especially at the feeder’s Point of Common Coupling (PCC). However, the calculation of the voltage profile at the LV bus exhibited an obvious increase in voltage following the integration of the PV plant. With a PV penetration level of only 14.7% of the feeder, the voltage level at the PCC bus increased by 0.51% while still meeting IEEE 1547 standards [36]. The voltage profile of the PCC at the distribution transformer’s low-voltage side bus is illustrated in Figure 11. This figure illustrates how the PV source increases the voltage level, particularly under heavy loads.
It is evident that the peak load and energy consumption of the PPU profiles are highest at noon, which aligns well with the PV plant. To optimize the amount of active power produced, the inverters also function best at a unity power factor. Consequently, there were fewer overall losses in the distribution transformer, which improved system efficiency. As a result of PV generation, Figure 12 illustrates how the gradual integration of the PV plant into the distribution feeder reduced grid-side active power usage during sunlight hours. This decline similarly affected the power factor and apparent power. Nonetheless, since PV inverters operated at a unity power factor, the amount of reactive power needed on the grid remained constant.
When a PV system is operating, the power factor drops while the PV inverters function at unity power factor. Furthermore, high-penetration PV systems reduce the necessity for active electricity from the grid by supplying the majority of the active power utilized by consumers. However, the requirement for reactive power need does not change, leading to a lowered power factor as determined at the PCC. Interestingly, as Figure 13 illustrates, the effect of the PPU-PV plant on the LV side of the PPU distribution transformer is more pronounced than on the MV bus. The power factor at the LV side of the transformer reaches 53% during the PV system’s peak generation, while it remains below 82% at the MV side.
The extreme cases of distributed generation operating at the PPU feeder, both with and without PV power plant integration, are discussed in this section. Two scenarios, maximum load with minimum generation and minimum load with maximum generation, were investigated. The voltage bus profile of the PPU feeder is shown in Figure 14 for the maximum load demand of the PV power plant and the minimum generation production. The impact of integrating the PV plant and PPU feeder in the scenario of lowest loading and maximum production is shown in Figure 15. It is evident that, at the load buses, the voltage profile was somewhat elevated. In both scenarios, the voltage was observed to be greater than 0.95 pu, which is acceptable according to the IEEE 1547 standard [36].

5. Conclusions

The production of solar energy generally reduces grid losses by minimizing main feeder use. However, the integrity, stability, and reliability of the grid may be compromised by the widespread use of renewable resources without specialized oversight. In this study, voltage levels at the main bus of the PPU feeder were compared with and without PV systems. It was found that when the PV system was connected to the grid, the voltage level increased slightly. Moreover, with only 14.7% PV penetration, voltage increased by 0.45% at the load bus PCC. The power factor at the PCC dropped during peak generating periods, especially on the low-voltage side of distribution transformers, where there was a 29% decrease compared to the medium-voltage side. This demonstrates how important it is to manage the PF accurately during high solar penetration. Additionally, at peak generation, the feeder’s efficiency improved dramatically, reducing reactive losses by 23% and real power losses by 49%. This study recommends making efforts to mitigate the negative effects of PV systems, including power line losses and voltage fluctuations at residential load buses.

Author Contributions

Conceptualization, M.M.; methodology, N.I.; software, H.A.; validation, H.A.; formal analysis, M.M.; investigation, N.I.; data curation, N.I.; writing—original draft, M.M.; writing—review and editing, S.A.; visualization, H.A.; supervision, S.A. All authors have read and agreed to the published version of the manuscript.

Funding

This research received no external funding.

Institutional Review Board Statement

Not applicable.

Informed Consent Statement

Not applicable.

Data Availability Statement

Data are contained within the article.

Conflicts of Interest

The authors declare no conflicts of interest.

References

  1. Al-Shetwi, A.Q. Sustainable development of renewable energy integrated power sector: Trends, environmental impacts, and recent challenges. Sci. Total Environ. 2022, 822, 153645. [Google Scholar] [CrossRef] [PubMed]
  2. Malik, K.; Capareda, S.C.; Kamboj, B.R.; Malik, S.; Singh, K.; Arya, S.; Bishnoi, D.K. Biofuels Production: A Review on Sustainable Alternatives to Traditional Fuels and Energy Sources. Fuels 2024, 5, 157–175. [Google Scholar] [CrossRef]
  3. Juaidi, A.; Montoya, F.G.; Ibrik, I.H.; Manzano-Agugliaro, F. An overview of renewable energy potential in Palestine. Renew. Sustain. Energy Rev. 2016, 65, 943–960. [Google Scholar] [CrossRef]
  4. Iqteit, N.A.; Basa Arsoy, A.; Çakir, B. A time-varying load-based analytical approach for DG optimization in the distribution network. Int. Trans. Electr. Energy Syst. 2019, 29, e2783. [Google Scholar] [CrossRef]
  5. Al-Maghalseh, M.M. The Impacts of Distribution Generators Size and Location on Power Efficiency and Voltage Profile in Radial LV Networks. Adv. Sci. Technol. Eng. Syst. J. 2018, 3, 276–283. [Google Scholar] [CrossRef]
  6. Al-Maghalseh, M.M.; Abutemeha, A.K.; Iyadiyyeh, M. Modeling a hybrid system for electrical generation and wastewater treatment using photovoltaic and fuel cells. Desalination Water Treat. 2017, 100, 250–257. [Google Scholar] [CrossRef]
  7. Tonkoski, R.; Turcotte, D.; El-Fouly, T.H. Impact of high PV penetration on voltage profiles in residential neighborhoods. IEEE Trans. Sustain. Energy 2012, 3, 518–527. [Google Scholar] [CrossRef]
  8. Alzeer, A.A.; Iqteit, N. DG Optimization in distribution network Using LRSF and FA: Case Studies. In Proceedings of the 2023 3rd International Conference on Advance Computing and Innovative Technologies in Engineering (ICACITE), Greater Noida, India, 12–13 May 2023; pp. 1927–1931. [Google Scholar]
  9. Anugrah, P.; Pratama, R.W.; Sholekan, M.; Fikriyadi, Z.A. Evaluating Performance and Grid Impacts of On-Grid Rooftop PV System: Case Study of A Mosque. In IOP Conference Series: Earth and Environmental Science; IOP Publishing: Bristol, UK, 2024; Volume 1344, p. 012012. [Google Scholar]
  10. Tobnaghi, D.M.; Vafaei, R. The impacts of grid-connected photovoltaic system on distribution networks—A review. ARPN J. Eng. Appl. Sci. 2016, 11, 3564–3570. [Google Scholar]
  11. Peprah, F.; Gyamfi, S.; Amo-Boateng, M.; Effah-Donyina, E. Impact assessment of grid tied rooftop PV systems on LV distribution network. Sci. Afr. 2022, 16, e01172. [Google Scholar] [CrossRef]
  12. Al-Shetwi, A.Q.; Hannan, M.; Jern, K.P.; Alkahtani, A.A.; Pg Abas, A. Power quality assessment of grid-connected PV system in compliance with the recent integration requirements. Electronics 2020, 9, 366. [Google Scholar] [CrossRef]
  13. Colmenar-Santos, A.; Linares-Mena, A.R.; Molina-Ibáñez, E.L.; Rosales-Asensio, E.; Borge-Diez, D. Technical challenges for the optimum penetration of grid-connected photovoltaic systems: Spain as a case study. Renew. Energy 2020, 145, 2296–2305. [Google Scholar] [CrossRef]
  14. Panigrahi, R.; Mishra, S.K.; Srivastava, S.C.; Srivastava, A.K.; Schulz, N.N. Grid integration of small-scale photovoltaic systems in secondary distribution network—A review. IEEE Trans. Ind. Appl. 2020, 56, 3178–3195. [Google Scholar] [CrossRef]
  15. Kharrazi, A.; Sreeram, V.; Mishra, Y. Assessment techniques of the impact of grid-tied rooftop photovoltaic generation on the power quality of low voltage distribution network-A review. Renew. Sustain. Energy Rev. 2020, 120, 109643. [Google Scholar] [CrossRef]
  16. Morey, M.; Gupta, N.; Garg, M.M.; Kumar, A. A comprehensive review of grid-connected solar photovoltaic system: Architecture, control, and ancillary services. Renew. Energy Focus 2023, 45, 307–330. [Google Scholar] [CrossRef]
  17. Zadehbagheri, M.; Kiani, M.J. A new method for online evaluation of the effects of PV panels and comparison with MVDI in electrical power distribution networks. Renew. Energy Focus 2023, 44, 106–123. [Google Scholar] [CrossRef]
  18. Maghami, M.R.; Pasupuleti, J.; Ling, C.M. Impact of photovoltaic penetration on medium voltage distribution network. Sustainability 2023, 15, 5613. [Google Scholar] [CrossRef]
  19. Kisuule, M.; Ndawula, M.B.; Gu, C.; Hernando-Gil, I. PV Hosting Capacity in LV Networks by Combining Customer Voltage Sensitivity and Reliability Analysis. Energies 2023, 16, 5893. [Google Scholar] [CrossRef]
  20. Obi, M.; Bass, R. Trends and challenges of grid-connected photovoltaic systems—A review. Renew. Sustain. Energy Rev. 2016, 58, 1082–1094. [Google Scholar] [CrossRef]
  21. Karimi, M.; Mokhlis, H.; Naidu, K.; Uddin, S.; Bakar, A.A. Photovoltaic penetration issues and impacts in distribution network–A review. Renew. Sustain. Energy Rev. 2016, 53, 594–605. [Google Scholar] [CrossRef]
  22. Darie, S. Guidelines for large photovoltaic system integration. In Proceedings of the PES T&D IEEE, Orlando, FL, USA, 7–10 May 2012; pp. 1–6. [Google Scholar]
  23. Jayasekara, N.; Masoum, M.A.; Wolfs, P.J. Optimal operation of distributed energy storage systems to improve distribution network load and generation hosting capability. IEEE Trans. Sustain. Energy 2015, 7, 250–261. [Google Scholar] [CrossRef]
  24. Conti, S.; Raiti, S.; Tina, G.; Vagliasindi, U. Study of the impact of PV generation on voltage profile in LV distribution networks. In Proceedings of the 2001 IEEE Porto Power Tech Proceedings (Cat. No. 01EX502), Porto, Portugal, 10–13 September 2001; Volume 4, p. 6. [Google Scholar]
  25. Albarracín Sánchez, R.; Amarís Duarte, H.E. Power Quality in distribution power networks with photovoltaic energy sources 2009. In Proceedings of the International Conference on Environment and Electrical Engineering, Shenyang, China, 5–9 July 2009. [Google Scholar]
  26. Demirok, E.; Sera, D.; Teodorescu, R.; Rodriguez, P.; Borup, U. Clustered PV inverters in LV networks: An overview of impacts and comparison of voltage control strategies. In Proceedings of the 2009 IEEE Electrical Power & Energy Conference (EPEC), Montreal, QC, Canada, 22–23 October 2009; pp. 1–6. [Google Scholar]
  27. Borges, C.L.; Falcao, D.M. Optimal distributed generation allocation for reliability, losses, and voltage improvement. Int. J. Electr. Power Energy Syst. 2006, 28, 413–420. [Google Scholar] [CrossRef]
  28. Hasibuan, A.; Masri, S.; Othman, W. Effect of distributed generation installation on power loss using genetic algorithm method. In Proceedings of the IOP Conference Series: Materials Science and Engineering, Melbourne, Australia, 15–16 September 2018; Volume 308, p. 012034. [Google Scholar]
  29. Kim, T.; Kim, J. A method for determining the introduction limit of distributed generation system in distribution system. In Proceedings of the 2001 Power Engineering Society Summer Meeting. Conference Proceedings (Cat. No. 01CH37262), Vancouver, BC, Canada, 15–19 July 2001; Volume 1, pp. 456–461. [Google Scholar]
  30. González, P.; Romero-Cadaval, E.; González, E.; Guerrero, M.A. Impact of grid connected photovoltaic system in the power quality of a distribution network. In Proceedings of the Technological Innovation for Sustainability: Second IFIP WG 5.5/SOCOLNET Doctoral Conference on Computing, Electrical and Industrial Systems, DoCEIS 2011, Costa de Caparica, Portugal, 21–23 February 2011; pp. 466–473. [Google Scholar]
  31. Tonso, M.; Moren, J.; De Haan, S.W.; Ferreira, J. Variable inductor for voltage control in distribution networks. In Proceedings of the 2005 European Conference on Power Electronics and Applications, Dresden, Germany, 11–14 September 2005; p. 10. [Google Scholar]
  32. Crăciun, B.I.; Kerekes, T.; Sera, D.; Teodorescu, R. Overview of recent grid codes for PV power integration. In Proceedings of the 2012 13th International Conference on Optimization of Electrical and Electronic Equipment (OPTIM), Brasov, Romania, 24–26 May 2012; pp. 959–965. [Google Scholar]
  33. Abbad, J.R. Electricity market participation of wind farms: The success story of the Spanish pragmatism. Energy Policy 2010, 38, 3174–3179. [Google Scholar] [CrossRef]
  34. Fediaevsky, A.; Benet, J.J.; Boschiroli, M.L.; Riviere, J.; Hars, J. La tuberculose bovine en France en 2011, poursuite de la reduction du nombre de foyers. ANSES Bull Epidemiol. 2011, 54, 4–12. [Google Scholar]
  35. Alqadi, H. Investigate the Influence of the Penetration Level of PV Distributed Generation and Energy Storage Integration on the Medium Voltage Distribution Network. Master’s Thesis, Palestine Polytechnic University, Hebron, Palestine, 2019. [Google Scholar]
  36. IEEE Std 1547-2018; IEEE Standard for Interconnection and Interoperability of Distributed Energy Resources with Associated Electric Power Systems Interfaces (Revision of IEEE Std 1547-2003). IEEE: New York, NY, USA, 2018.
Figure 1. The single-line diagram of the 33 kV line of HEPDS [35].
Solar 05 00001 g001
Figure 2. Single-line diagram of the PPU feeder [35].
Solar 05 00001 g002
Figure 3. PPU feeder daily load profile.
Solar 05 00001 g003
Figure 4. The PPU distribution transformer profile.
Solar 05 00001 g004
Figure 5. PV system average daily generation.
Solar 05 00001 g005
Figure 6. PPU load and PV system configuration [35].
Solar 05 00001 g006
Figure 7. Voltage drop per hour at the main bus of the PPU feeder.
Solar 05 00001 g007
Figure 8. Main bus apparent power with and without the PV system.
Solar 05 00001 g008
Figure 9. Main bus power factor with and without the PV system.
Solar 05 00001 g009
Figure 10. PPU feeder power loss in kW.
Solar 05 00001 g010
Figure 11. The voltage profile with and without PV at the distribution transformer PCC LV side.
Solar 05 00001 g011
Figure 12. PCC grid-side active power consumption.
Solar 05 00001 g012
Figure 13. The power factor at PCC on the PPU distribution transformer.
Solar 05 00001 g013
Figure 14. Voltage profile for the PPU bus at maximum load and minimum generation of PV.
Solar 05 00001 g014
Figure 15. Voltage profile for the PPU bus at minimum load and maximum generation of PV.
Solar 05 00001 g015
Table 1. Voltage standard range.
Supply Voltage Variation
GermanySpainFrance
0.9 Vn ≤ V ≤ 1.1 Vn0.85 Vn ≤ V ≤ 1.1 Vn0.9 Vn ≤ V ≤ 1.1 Vn
Disclaimer/Publisher’s Note: The statements, opinions and data contained in all publications are solely those of the individual author(s) and contributor(s) and not of MDPI and/or the editor(s). MDPI and/or the editor(s) disclaim responsibility for any injury to people or property resulting from any ideas, methods, instructions or products referred to in the content.

