Article

Ecological Status Should Be Considered When Evaluating and Mitigating the Effects of River Connectivity Losses in European Rivers

1
Forest Research Centre, School of Agriculture, University of Lisbon, 1349-017 Lisbon, Portugal
2
Associate Laboratory TERRA School of Agriculture, University of Lisbon, 1349-017 Lisbon, Portugal
*
Author to whom correspondence should be addressed.
Hydrobiology 2025, 4(3), 18; https://doi.org/10.3390/hydrobiology4030018
Submission received: 26 March 2025 / Revised: 11 June 2025 / Accepted: 13 June 2025 / Published: 1 July 2025

Abstract

The deterioration of European freshwater ecosystems, driven by habitat fragmentation and connectivity loss, seriously threatens biodiversity and ecosystem integrity. While restoration efforts often focus on reconnecting river networks, ecological assessments tend to overlook the broader concept of connectivity. This study highlights the need to incorporate ecological quality into connectivity assessments, ensuring more effective restoration that is aligned with European Union (EU) conservation policies. Using the dendritic connectivity index for potamodromous (DCIp) species, we analysed seven connectivity scenarios, integrating natural and artificial barriers to assess both structural connectivity and quality-weighted connectivity. These scenarios included: (1) structural connectivity considering only natural barriers (S_NB) and (2) all barriers (S_AB); (3) quality-weighted connectivity considering natural barriers (W_NB), and (4) all barriers (W_AB); three enhanced scenarios considering all barriers with (5) improved quality (W_AB_IQ), (6) improved probability of connectivity (W_AB_IC), and (7) improved quality and probability of connectivity (W_AB_IQC). Connectivity values varied across scenarios, with the natural baseline (S_NB) showing the highest connectivity values (mean = 0.98). When the natural baseline was weighted by the GES probability (W_NB), connectivity values dropped considerably (mean = 0.30). Incorporating all barriers (W_AB) further reduced the connectivity values (mean = 0.26). The improved scenario W_AB_IQC showed notable connectivity improvements (mean = 0.40). This study underscores the importance of integrating ecological quality into river connectivity assessments. It demonstrates that restoring habitat quality alongside connectivity restoration can substantially enhance river ecosystems. Prioritising restoration in high-quality areas maximises ecological and social benefits, supports sustainable river management, improves connectivity, and promotes biodiversity conservation.

1. Introduction

In recent decades, the degradation of natural systems across Europe has intensified, leading to profound impacts on biodiversity and ecosystem integrity [1,2]. Despite ongoing conservation efforts, habitat fragmentation and the loss of connectivity continue to affect fish populations while increasing the vulnerability of river ecosystems and communities [2,3,4,5,6,7,8,9]. A major driver of these challenges is the proliferation of artificial barriers, which disrupt the longitudinal connectivity [2,10,11]. Severing connectivity leads to the disruption of river networks’ structural and functional attributes, which are crucial for maintaining healthy aquatic ecosystems [12,13,14]. These impacts further hinder the achievement of the ‘good’ ecological status (GES) required by the Water Framework Directive (WFD) [15]. Nonetheless, increasing water demands and flow alteration for (and because of) human activities continue to lead to connectivity losses on river networks.
The longitudinal dimension of river connectivity is particularly vital for freshwater fish fauna, ensuring the required movements for feeding and reproduction [16,17,18]. The loss of longitudinal connectivity is recognised as a major threat to freshwater fish communities worldwide [19,20,21,22], and the WFD demands that member states identify and mitigate barriers, such as dams and weirs, which impede natural river connectivity [15,23]. Removing or modifying these barriers helps restore natural flow regimes, enhance habitat connectivity and support the recovery of aquatic species. The European Green Deal is an ambitious initiative by the European Union (EU) to make Europe the first climate-neutral continent by 2050 [24]. A key component of the Green Deal is the EU Biodiversity Strategy for 2030, which aims to reverse biodiversity loss and restore ecosystems, including the reconnection of 25,000 km of European river networks [25]. Despite being considered a valuable goal, the WWF recently suggested that a target of 50,000 km would be more appropriate and achievable [26]. The Nature Restoration Law also establishes restoration targets for degraded ecosystems, ensuring that EU member states adopt concrete measures to recover biodiversity on a larger scale [27].
Under the WFD, EU Member States are required to regularly assess and report the ecological status of their surface water bodies to ensure compliance with the directive’s objectives for sustainable water management. In their most recent assessments, less than 40% of monitored freshwater bodies meet the GES standard required by the WFD [28]. The ecological status assessment is based on biological quality elements, supported by physicochemical and hydromorphological quality elements [15]. These indicators collectively reflect the ecosystem’s condition in response to various human-induced pressures [15]. This holistic perspective ensures that measures to improve connectivity align with overall environmental objectives. Nonetheless, a knowledge gap persists regarding connectivity and ecological status interaction. Firstly, it is often difficult to find quality indicators reflecting a loss of connectivity, as most of them generally reflect more local conditions and have difficulty dealing with broader and larger scales of pressures [29,30]. Secondly, the values of the hydromorphological quality elements should be taken into account only when assigning water bodies to the high ecological status class and the maximum ecological potential class, and in that case, the hydromorphological elements are required to have “conditions consistent with the achievement of the values specified for the biological quality elements” [31]. Given the difficulty of achieving high or good ecological status for the biological quality elements and physicochemical indicators, the condition of the hydromorphological quality elements is rarely used to influence the final classification of ecological status/potential. As a result, most ecological quality classifications do not consider the level of connectivity of the waterbody. This occurs even though several EU directives and laws, in parallel, explicitly promote the improvement of river connectivity [15,24].
Traditional structural connectivity approaches, based on spatial graph concepts, tend to weigh nodes (river segments between confluences) by their length since they assume that longer segments have more habitat available for species. However, connecting river fragments with poor ecological quality is potentially useless, meaning that the quality of the fragment should be accounted for. It could be more useful to improve connectivity between network fragments with high ecological quality than between low-ecological-quality fragments, even if those fragments contain more river network length. In this study, we demonstrate that ecological quality should be accounted for in river network connectivity planning for improvement. In this analysis, we use the probability of achieving the GES (sensu WFD), i.e., a proxy for ecological quality, as a node-weighing variable [32]. This graph-based approach allows both the habitat quality and the size of the fragment to be accounted for. This work aims to demonstrate how river network connectivity quantification can be applied integratively to support the achievement of several EU directives and laws, emphasising the importance of critically assessing connectivity. We hypothesise that when connectivity restoration is coupled with ecological quality, the overall ecological benefits are amplified. In this case, the synergistic effect of simultaneous improvements in both connectivity and ecological quality is expected to produce more substantial and sustainable outcomes for river ecosystems.

2. Materials and Methods

2.1. Study Area

Our study area covers the European river basins within the European Union member states and the former member state, the United Kingdom. Additionally, it covers the areas where WFD data were implemented and Vigiak data maps were produced (Norway and Switzerland) [32]. Furthermore, only river basins reaching a Strahler order number greater than 2 were included. This results in 2188 sea outlet river basins, 680,577 river segments, 1227 natural barriers, 7851 dams, and 13,819 river segments being affected by reservoirs (Figure 1). The basins selected for analysis cover an area of 4,390,013.3 km2 (94.7% of the total study area), while the excluded basins amount to 13,201, occupying 244,076.7 km2.

2.2. Data Sources

2.2.1. River Network

To create our river network, we used the Catchment Characterisation and Modelling—River and Catchment database v2.1 (CCM2), a geographical database developed by the European Commission’s Joint Research Centre [33]. This database encompasses the European continent and the Atlantic islands, Iceland, Cyprus, and Turkey. It features a hierarchical structure of river segments and catchments, organised according to Strahler stream order. CCM2 allows us to integrate ecological status and barrier data, enabling the subsequent calculation of connectivity values.

2.2.2. Ecological Status

The WFD advocates the systematic assessment and enhancement of the ecological status of inland water bodies across its member states. Despite significant progress over the years, achieving a uniform continental overview of the ecological status of EU freshwater environments remains challenging. This is due to various issues, such as methodological discrepancies, reporting inconsistencies, classification differences, and regional variations in monitoring practices and outcomes [32]. To address these challenges, we opted to use the dataset created by Vigiak and colleagues as a proxy for ecological status [32]. This dataset provides a European-wide map expressing the probability of failing to achieve the GES at the CCM2 resolution (river segment between confluences) at the EU extent. This dataset was created based on the second reporting round of River Basin Management Plans of the WFD (conditions in 2010–2015), encompassing European member states and other European countries according to Article 13 of the WFD [15,32].
The probability of failing to achieve the GES was reversed for the intended analysis, i.e., it was converted into the probability of achieving the GES. Additionally, since this dataset only accounts for the EU member states, some segments within some river basins lack data. Therefore, only basins with more than 50% data coverage were included in the analysis. For the segments within basins that had more than 50% coverage and lacked values (for the probability of achieving a good ecological status), the mean value of the basin was assigned.

2.2.3. Barrier Data

To assess river connectivity, information on barriers across Europe was needed. Natural barrier information was sourced from the European Waterfalls website [34] and was supplemented by the World Waterfall Database [35]. Additional waterfall sites were manually added using aerial images [36]. The geographic positions of these natural barriers were automatically assigned to the appropriate CCM2 basin and the nearest river segment, followed by visual verification and adjustments.
Artificial barrier data were obtained from ‘Deliverable D3.1: Screening maps: Europe-wide maps of the needs and potentials to restore floodplains, rivers, and wetlands with various restoration measures’ [37]. The dataset incorporates information from multiple sources, including the AMBER Barrier Atlas [38] for barriers in European rivers over 5 m in height, the Georeferenced Global Dams and Reservoirs (GeoDAR v1.1) [39], with 23,680 global dam locations, and the Global Georeferenced Database of Dams (GOODD v1) [40], which includes 2760 digitized European dam locations. To refine the data, duplicates were removed using buffer distances of between 250 m and 3000 m, followed by manual verification. The final dataset was consolidated, and the dam locations were mapped and verified against river segments and catchment areas.
GeoDAR data was also used to estimate the reservoir area created by each large dam. To evaluate the impact of these reservoirs, data on CCM2 river segments intersecting with the impoundment areas were converted into points to determine which segments were affected beyond the dam location. Lastly, we identified GeoDAR reservoir areas without corresponding dam points in the dataset. Upon visual verification of a large dam, new barrier locations were manually added where applicable.

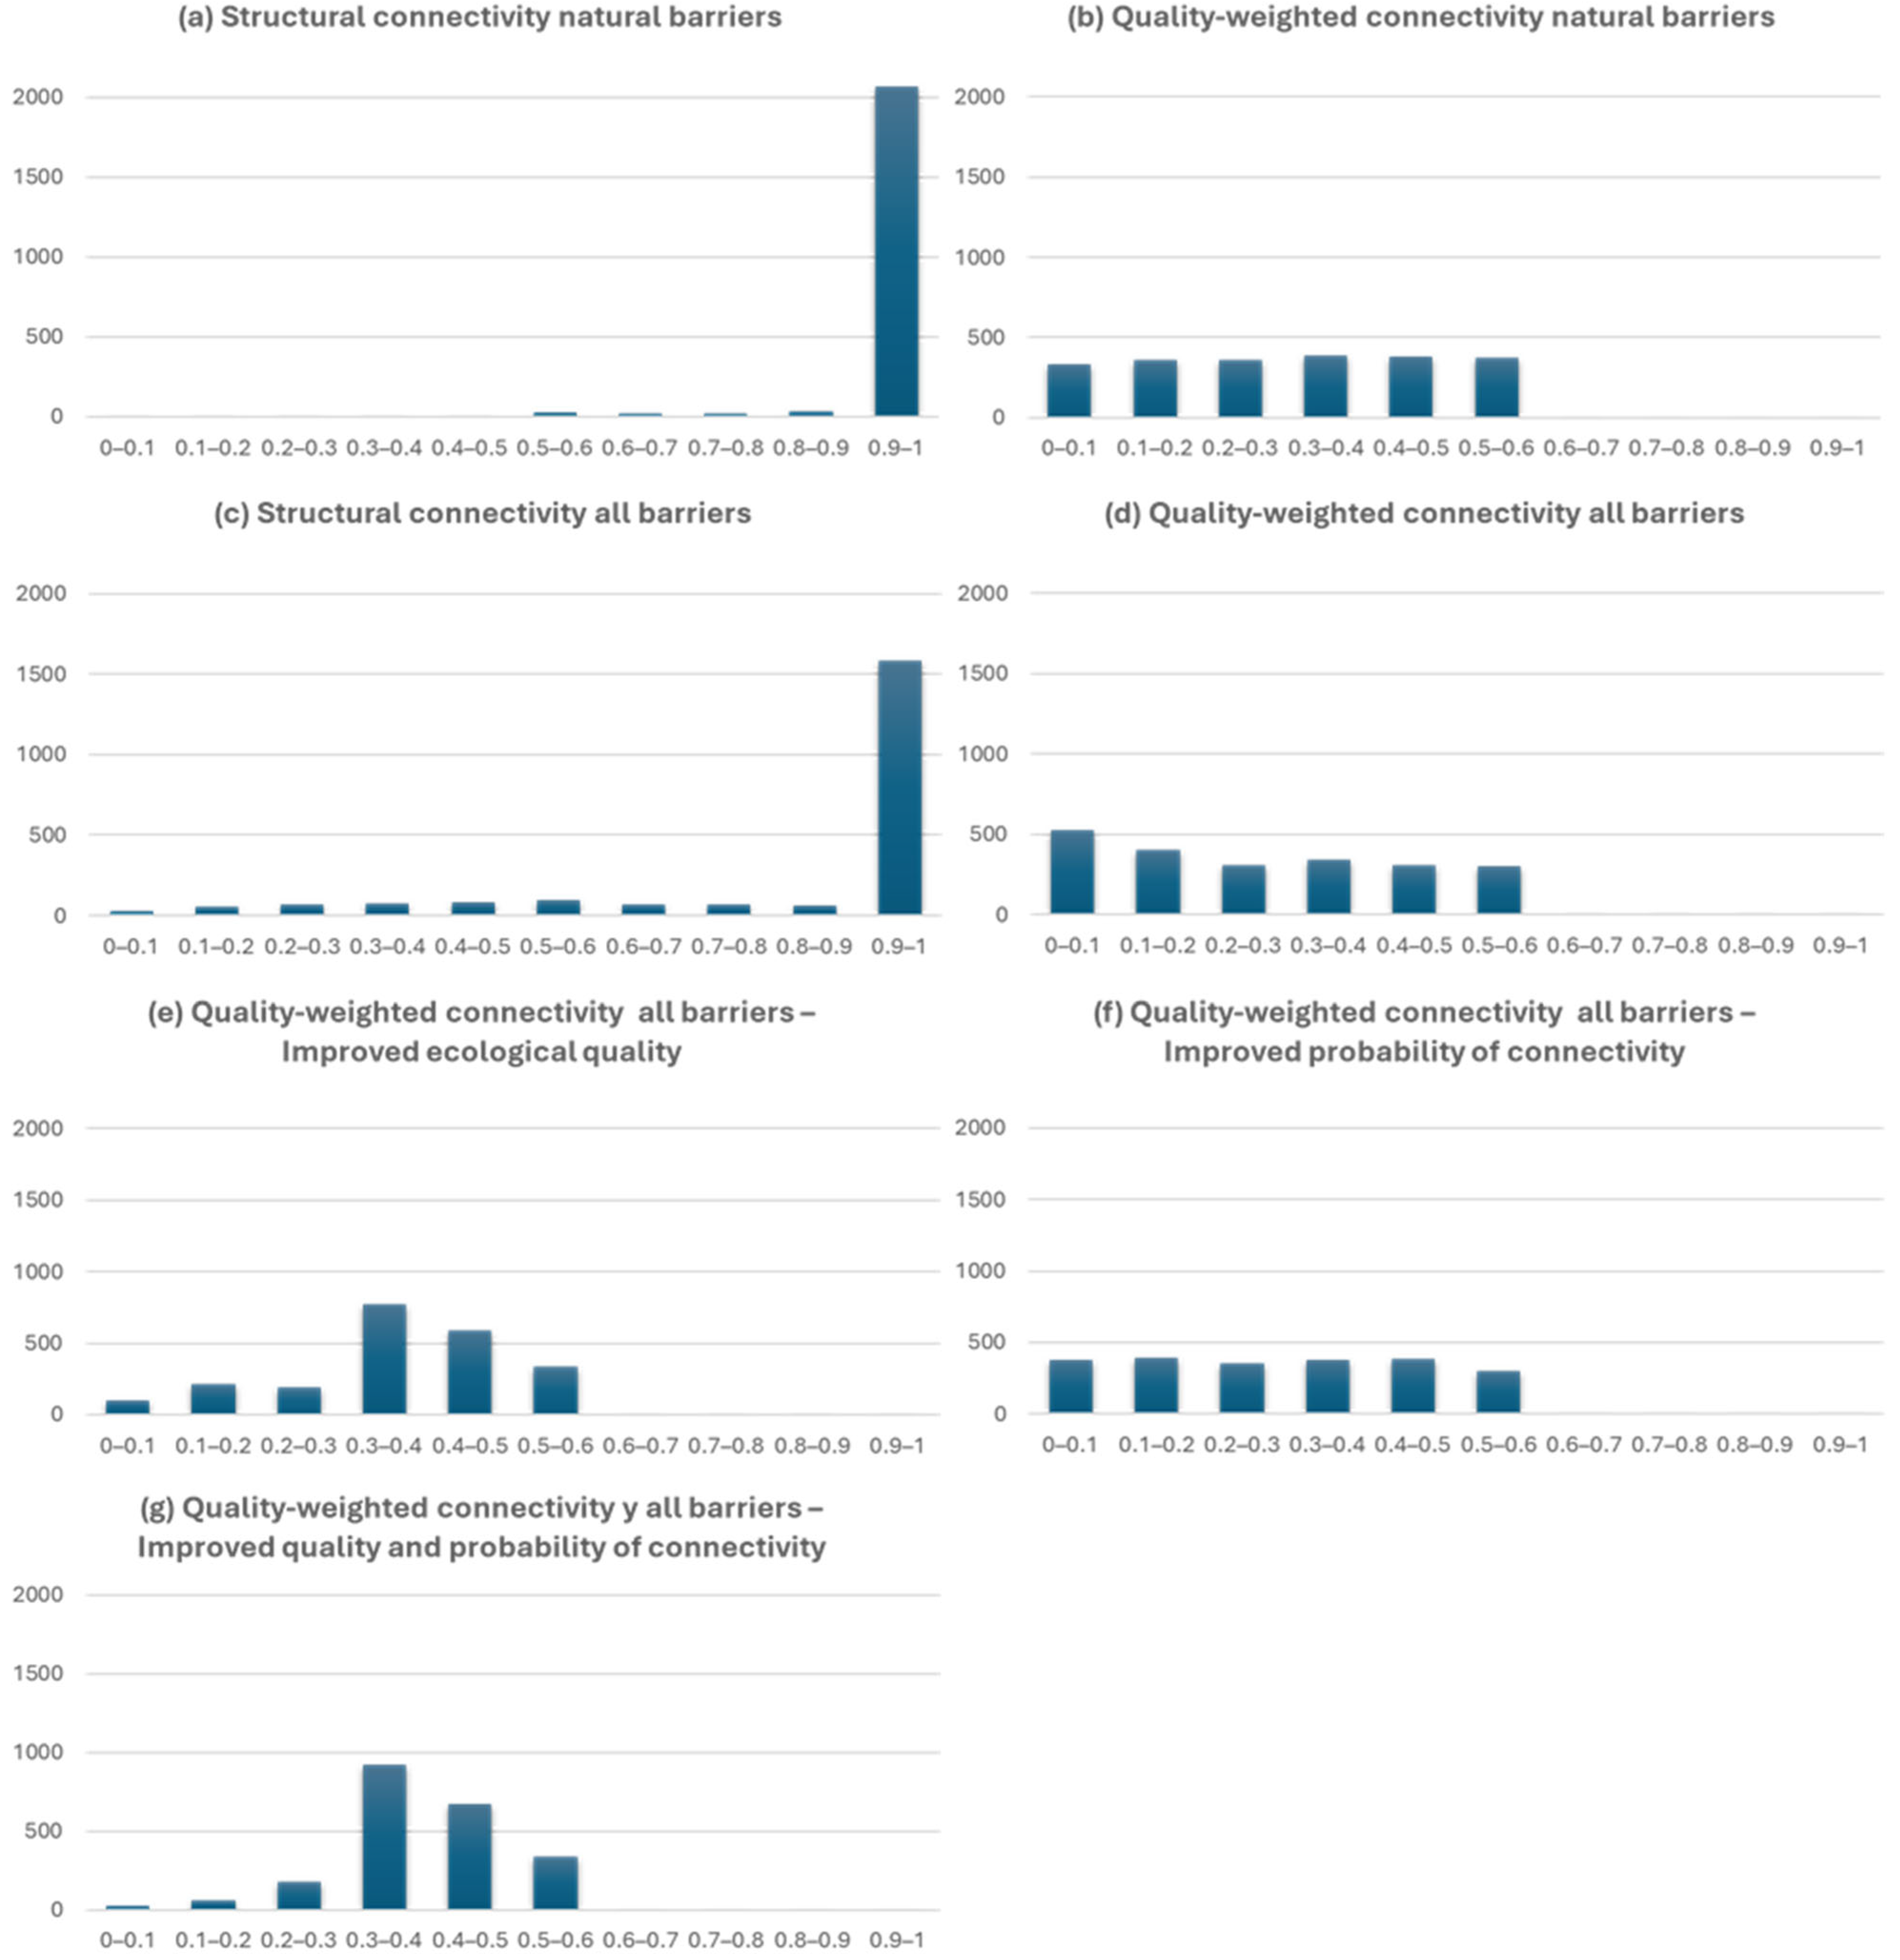
2.3. Connectivity Calculations

To perform the river connectivity calculations, we used the dendritic connectivity index (DCI) (Equations (1) and (2)) [41]. DCI is a habitat-weighted structural index based on spatial graph theory, which typically weights nodes (river segments between confluences) according to their length. This index effectively quantifies the cumulative impacts of multiple barriers on river connectivity across spatial scales. Such indices are commonly used to inform basin-wide management and restoration plans [41,42,43]. The DCI has two variants, namely, the DCI for potamodromous species, the DCIp, and the DCI for diadromous species, the DCId. Due to diadromous species-specific characteristics, downstream barriers may prevent their movement upstream. Since we aimed to calculate connectivity at the basin level, we focused exclusively on potamodromous species (DCIp), which migrate solely within freshwater.
D C I p = i = 1 n j = 1 n c i j l i L l j L
Equation (1) calculates the dendritic connectivity index for potamodromous species—the DCIp. n is the number of fragments (number of segments with at least 1 barrier + 1), cij is the multiplied permeability of all dams between fragments i and j, li is the cumulative river length of fragment i, lj is the cumulative river length of fragment j, and L is the total length of the river basin.
Using the barrier datasets along with the GES data allowed us to create 4 scenarios where barriers were always considered non-negotiable for the DCIp calculation:
(1)
S_NB, a scenario considering only natural barriers and segment river length;
(2)
W_NB, a scenario considering only natural barriers and segment river length, weighted by its probability of achieving GES;
(3)
S_AB, a scenario considering all the barriers that are present (natural and artificial barriers and reservoirs) and segment river length;
(4)
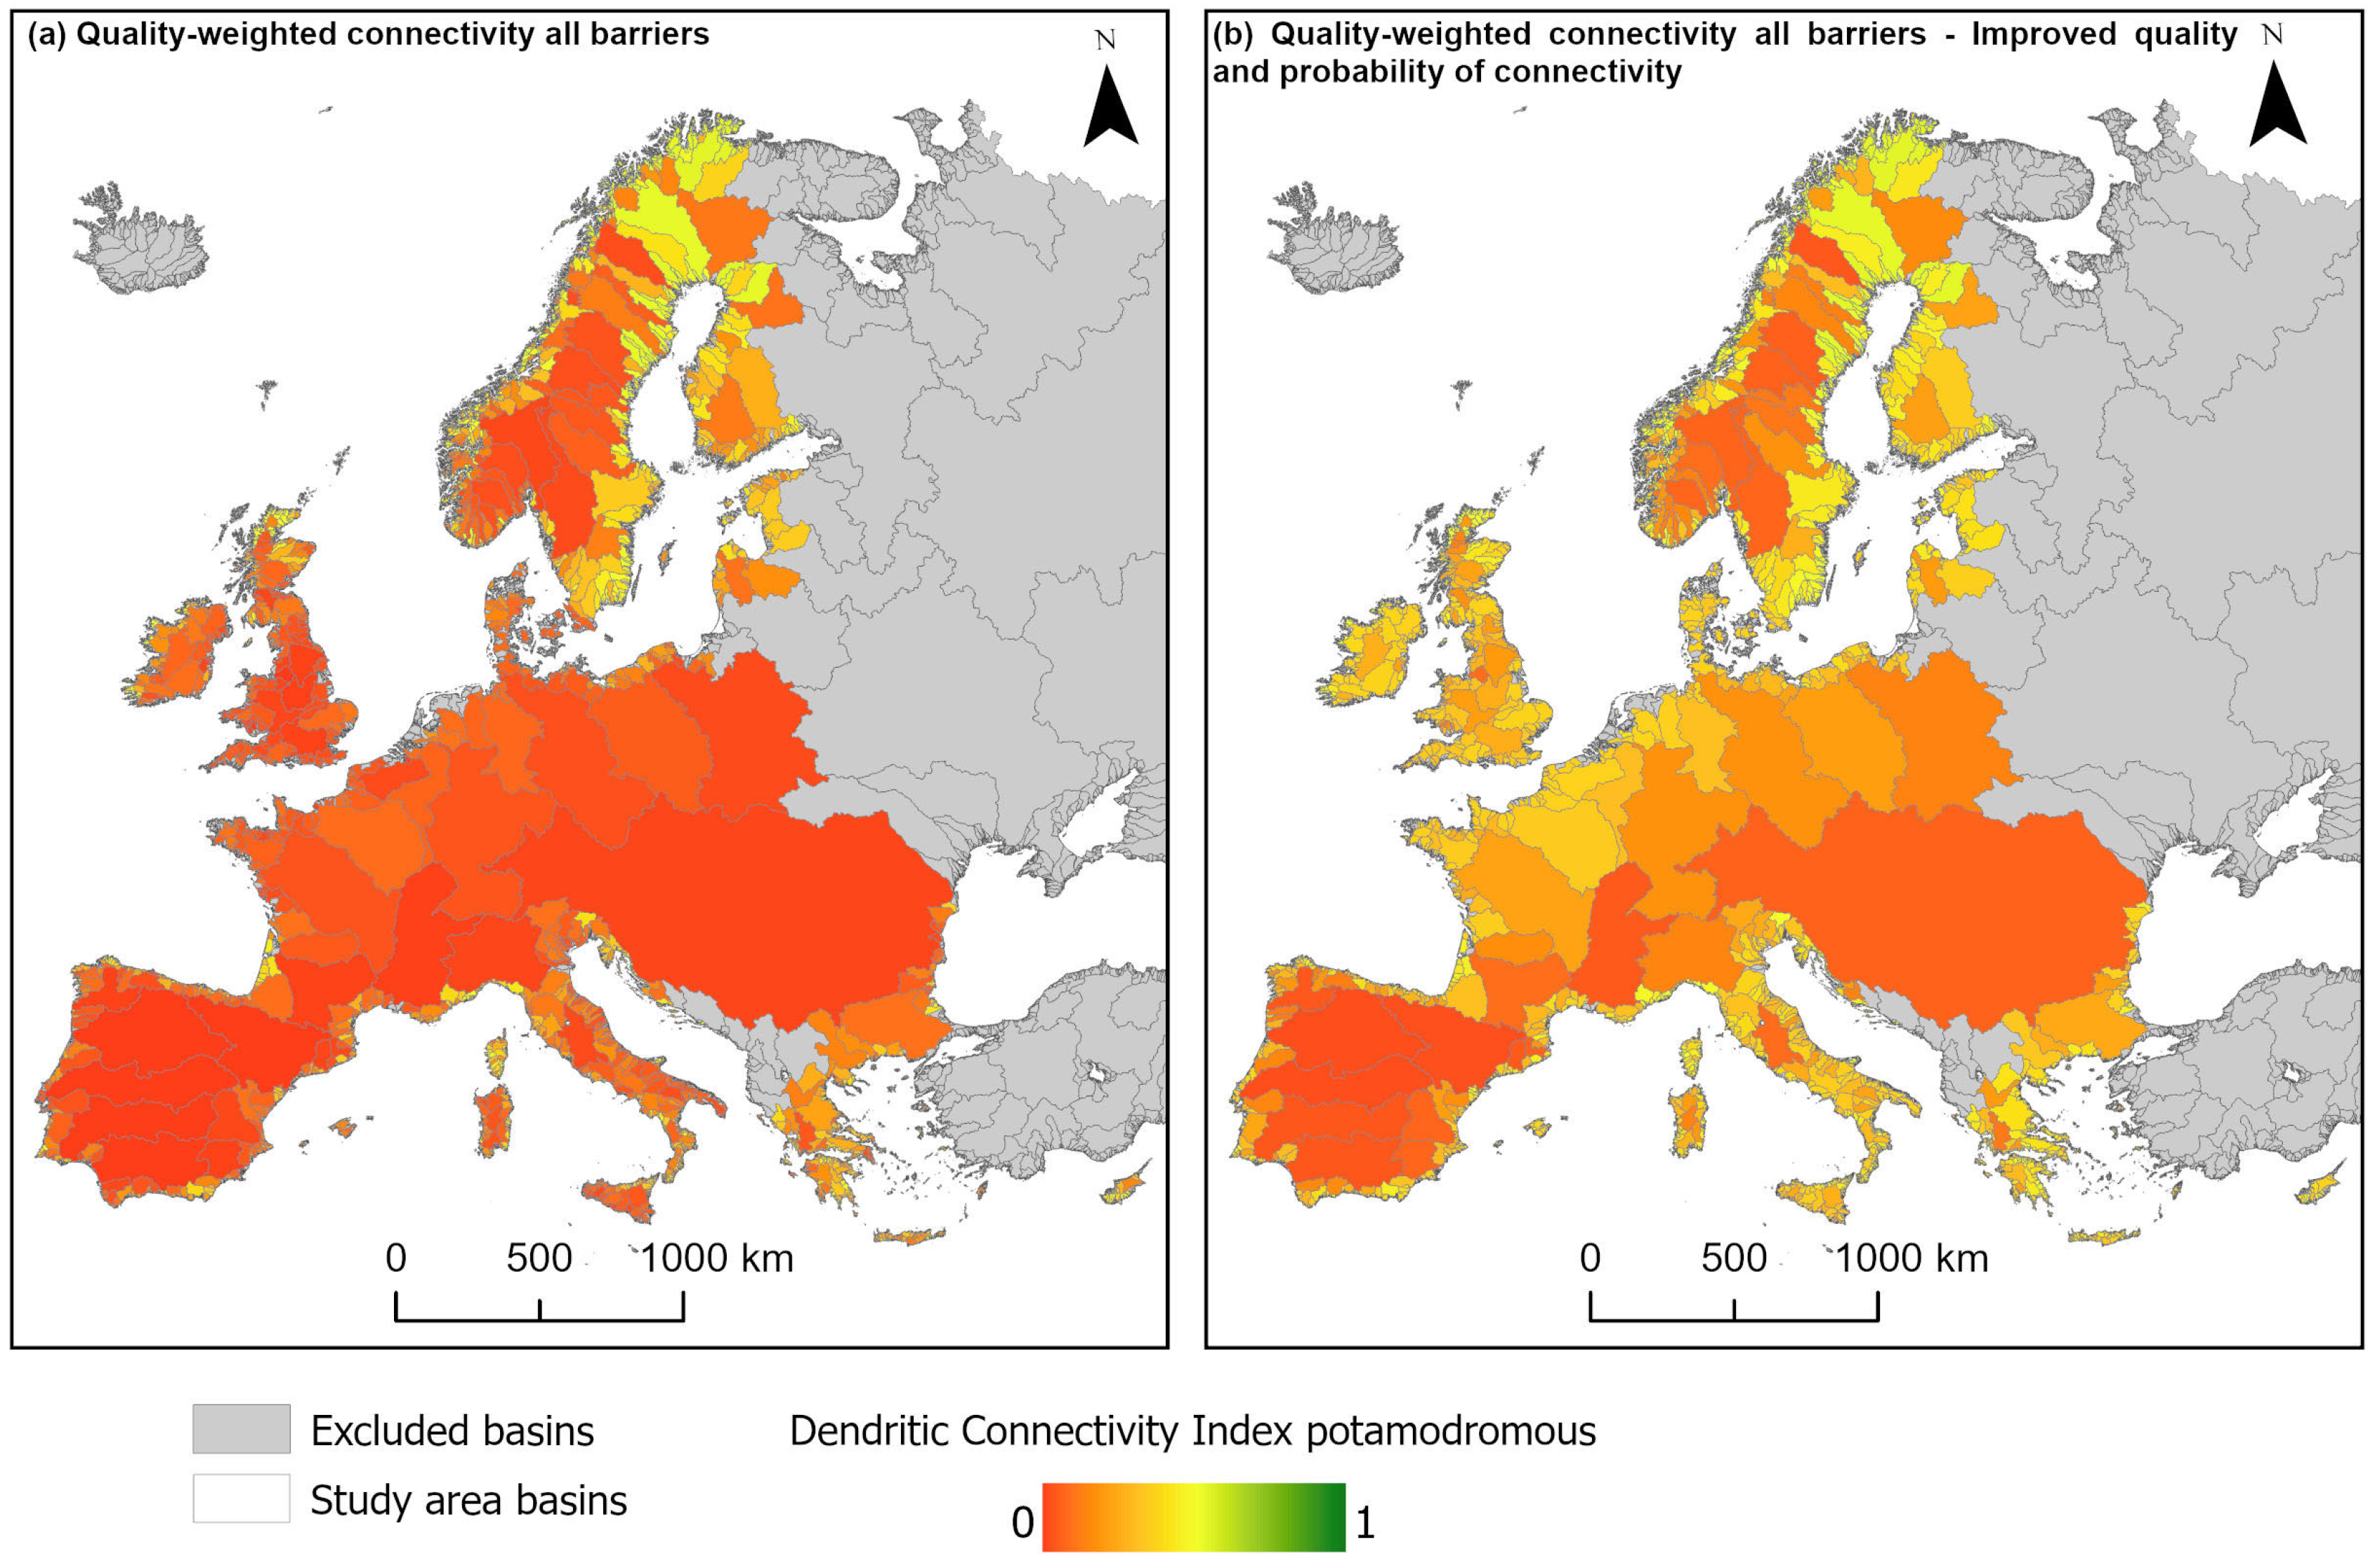
W_AB, a scenario considering all the barriers that are present and segment river length, weighted by its probability of achieving GES.
Scenarios 1 and 3 allowed us to establish structural connectivity, considering natural fragmentation (S_NB) and the structural fragmentation caused by instream barriers (S_AB). Similarly, scenarios 2 and 4 enabled a comparison of DCIp values per basin with previous scenarios when considering the ecological quality. Furthermore, we created three other scenarios reflecting ecological improvement or less stringent values of barrier permeability:
(5)
W_AB_IQ, a scenario considering all the barriers that are present and segment river length, weighted by the probability of achieving GES in a scenario of ecological quality improvement;
(6)
W_AB_IC, a scenario considering all the barriers that are present with higher values of permeability (natural barriers—0.5; artificial barriers—0.75; and reservoirs—0.9) and segment river length, weighted by its probability of achieving GES;
(7)
W_AB_IQP scenario considering all the barriers that are present with higher values of permeability (natural barriers—0.5; artificial barriers—0.75; and reservoirs—0.9) and segment river length, weighted by the probability of achieving GES in a scenario of ecological quality improvement.
In the scenarios of improved ecological quality (W_AB_IQ and W_AB_IQC), all segment values of GES below 0.6 were raised to these values. This threshold was determined as the minimum value indicating abidance by the WFD goals [32]. In the scenarios of improved barrier permeability, we increased the permeability values because not all barriers are non-negotiable, and artificial barriers can/should be retrofitted to allow for enhanced connectivity.
For artificial barriers, this may reflect scenarios of ecological restoration, while for natural barriers, this demonstrates the flexibility of the permeability criteria.
To conduct weighted connectivity calculations, each river segment’s length was multiplied by its respective probability of achieving the GES, as defined in Equation (2):
D C I p = i = 1 n j = 1 n c i j l i × p i L l j × p j L
where n is the number of fragments (number of segments with at least 1 barrier + 1), cij is the multiplied permeability of all dams between fragments i and j, li is the cumulative river length of fragment i, lj is the cumulative river length of fragment j, pi and pj are the probabilities of achieving good ecological status (GES) for fragments i and j, and L is the total length of the river basin.
Calculations were performed using the River Network toolkit (RivTool v1) software [44]. The RivTool is a freely accessible software with universal applicability that allows the integration of various inputs related to the environment, ecosystem functioning, and human activities for large-scale river network analysis. In these analyses, we used RivConnect, a tool to quantify network connectivity based on graph theory, which relies on the RivTool computing engine.

3. Results

The structural river connectivity of river basins, when considering only natural barriers (S_NB), thereby representing the natural baseline, shows a concentration of values in the highest range (0.9–1.0), as illustrated in Figure 2a. The mean connectivity value is 0.98, and the weighted mean (weighted by river basin area) is 0.93 (Table 1). This confirms that most basins exhibit high structural connectivity under natural conditions. This observation aligns with the visual representation in Figure S1 in the Supplementary Materials. Regions with slightly lower connectivity values are primarily located in Croatia and Sweden, where the lowest recorded connectivity value is 0.25.
The natural connectivity baseline is affected by the ecological status. Figure 2b characterises the river network connectivity values weighted by the probability of achieving GES, considering only natural barriers (W_NB), with the results indicating that these naturally disconnected waterbodies are affected by the ecological status. Comparing Figure S2 with Figure S1 (Supplementary Materials), lower connectivity values are more extensive and dominate Figure S2. The mean and weighted mean connectivity values are lower, at 0.30 and 0.23, respectively (Table 1). The spatial shift in connectivity values between Figures S1 and S2 highlights a general reduction in connectivity when GES probabilities are incorporated, with many areas moving from higher to lower connectivity classes. The bar chart for W_NB supports this interpretation, showing a more even distribution of connectivity values across the mid-range (0.2–0.6) (Figure 2b). This contrasts sharply with the dominance of high DCIp values observed in S_NB (Figure S1). This shift indicates that incorporating GES probabilities affects connectivity across the network, as observed in Figure S2; that is, the ability of species to inhabit the habitats decreases along the natural baseline of connectivity.
The structural river connectivity of river basins considering all barriers (natural, artificial, and reservoirs) (S_AB) showed a lower mean value compared to S_NB, but a higher mean value compared to W_NB. The mean connectivity value of S_AB is 0.85, and its weighted mean, based on river basin area, is 0.54 (Table 1). While the mean value remains relatively high, the weighted mean shows a substantial decrease compared to S_NB (S_NB weighted mean: 0.93), indicating reduced connectivity in larger basins. Compared to W_NB (W_NB weighted mean: 0.23), the weighted connectivity under S_AB is higher. The spatial distribution of S_AB connectivity values is shown in Figure 2c, with further detail provided in Figure S3. Connectivity values that are weighted by the probability of achieving GES are depicted in Figure 2d and Figure 3a, this time considering all barriers (natural, artificial, and reservoirs) (W_AB). Northern Europe, particularly Scandinavia, displays higher connectivity values, while most of Southern and Central Europe is characterised by low connectivity values. The highest connectivity value is 0.57, while the mean and weighted mean values drop to 0.23 and 0.09, respectively (Table 1). This reflects the substantial impact of artificial barriers and reservoirs on connectivity. This is displayed in Figure 2c, with most values concentrated in the lowest connectivity range (0.0–0.2), and is spatially observable in Figure 3a.
Connectivity values weighted by the probability of achieving GES, when under improved ecological quality conditions and considering all barriers (W_AB_IQ), are presented in Figure 2e and Figure S4 in the Supplementary Materials. The mean connectivity value is 0.37, and the weighted mean, based on the river basin area, is 0.15 (Table 1). These values are higher than those observed under the original W_AB scenario (mean: 0.26; weighted mean: 0.09), indicating an overall increase in connectivity values across the network under improved ecological conditions. Connectivity values remain predominantly in the lower range but with a slight shift towards intermediate classes (Figure 2e). The spatial distribution of W_AB_IQ connectivity values is further illustrated in Figure S4.
Connectivity values weighted by the probability of achieving GES, under an improved probability of connectivity and considering all barriers (W_AB_IC), are presented in Figure 2f and Figure S5. The mean connectivity value is 0.29, and the weighted mean, based on river basin area, is 0.13 (Table 1). Compared to the W_AB_IQ scenario (mean: 0.37; weighted mean: 0.15), both mean and weighted mean connectivity values are lower but remain concentrated in the lower classes, with the spatial distribution as shown in Figure S5 in the Supplementary Materials.
The results obtained in the improved scenario (W_AB_IQC) are illustrated in Figure 2g and Figure 3b, where adjustments were made to both increase the GES (a minimum 60% probability of achieving GES) and enhance barrier permeabilities (natural barriers: 0.5, artificial barriers: 0.75, reservoirs: 0.9). Compared to the scenarios with only improved ecological quality (W_AB_IQ) or only enhanced permeability (W_AB_IC), W_AB_IQC shows higher connectivity values across the network. The mean connectivity value reaches 0.40, and the weighted mean, based on the river basin area, increases to 0.20 (Table 1). These values are higher than those observed in both W_AB_IQ (mean: 0.37; weighted mean: 0.15) and W_AB_IC (mean: 0.29; weighted mean: 0.13). The bar chart in Figure 2g illustrates this shift, with a greater proportion of values falling within mid-connectivity ranges (0.3–0.6). Spatially, this scenario shows expanded areas of improved connectivity, particularly in Southern and Central Europe, as depicted in Figure 3b.

4. Discussion

Our study demonstrates that incorporating ecological and biological variables into connectivity evaluations can improve the prioritisation outcomes; however, this practice is seldom adopted due to data gaps and analysis complexity [45,46,47]. Integrating ecological quality (biological and physicochemical indicators) into connectivity assessments is paramount and highlights the relevance of integrated connectivity analysis towards effective river network habitat connectivity management. By using the probability of achieving GES as a proxy for ecological quality, we developed a more holistic approach that considers the size and health of river segments as node-weighing factors. This approach underscores the importance of prioritising connectivity gains between high-quality habitats and also of prioritising the rehabilitation of disconnected waterbodies, aligning with the goals of several EU directives and laws for sustainable river management [15,24,25,27].
Using the dendritic connectivity index for potamodromous fish species, the results indicate that most basins have a high natural structural connectivity evaluation (S_NB). This suggests that natural barriers impose a very low natural constraint on the free transfer of energy and matter along the river segments [48], representing the natural status of the network. However, there is a clear decrease in overall connectivity when accounting for the ecological quality of the river segments in the weighted connectivity, considering the natural barrier (W_NB) connectivity evaluation. When we compare the results obtained in S_NB and W_NB, it is clear that habitat quality is a determinant factor affecting the potential gain in river network connectivity. This is further supported by the contrast between W_AB_IQ and W_AB_IC. Just when considering habitat reduction based on ecological quality (W_NB), the average basin-wide connectivity experienced a decrease of almost 70%, even before integrating habitat fragmentation. This quantitatively demonstrates why full compliance with the WFD holistic approach is important. Considering artificial fragmentation in the analysis, W_AB, the overall river connectivity is affected even further, averaging just 27% across all the basins studied. Such a low value should be highlighted since 1501 of the 2188 basins studied are completely barrier-free. This outcome stems expectedly from the combined impact of all the barriers and the poor ecological quality verified in many segments, emphasising the alarming situation displayed by the monitoring cycles. The improved scenario denoted as W_AB_IQC was meant to represent a situation where the MS achieved the WFD GES goal while enhancing the permeability of artificial barriers and assuming a not-as-restrictive permeability of natural barriers, in which an improved scenario was verified. This result shows that although overall average river network connectivity would remain low, at around 40%, nonetheless, it represents a 48% increase concerning W_AB, and when looking at the area-weighted average, we can see a 122% increase in the overall connectivity of European river networks. This aligns with previous works verifying that enhancing ecological quality alongside connectivity improvements has clear benefits for river ecosystems [49].
Considering all barriers and weighting segments by GES probability (W_AB), as shown in Figure 2d and Figure 3a, there is an effective loss of connectivity due to poor habitat quality. If barriers alone limit riverine connectivity and consequently create friction in the movement of potamodromous species [50], when combined with poor ecological quality, an even greater impact on fish species can be observed. Physical barriers can have their impacts, overshadowing the effects of other stressors, and specific physicochemical stressors—such as low dissolved oxygen (DO) levels, elevated temperatures, and high suspended matter content—can impede the movement of organisms in both upstream and downstream directions [51,52].
The combined impact of structural fragmentation and ecological degradation highlights a pressing crisis affecting fish species’ resilience and mobility [13,14,18]. Restoring connectivity in low-quality areas limits its conservation benefits, reducing the effectiveness of actions and potentially generating negative ecological and social impacts [53]. In contrast, reconnecting high-quality areas enhances environmental and social benefits, underscoring that connectivity improvements should be paired with efforts to improve ecological quality to support healthy river ecosystems. This graph-based approach offers a more cost-effective solution by concentrating resources where they can produce the most significant ecological and social gains. By advancing methods that support the sustainable management of aquatic ecosystems, this study contributes to global efforts to maintain biodiversity, promote ecosystem health, and build resilience in the face of climate change.
Despite the clear results of this study, some caveats in this approach exist: (1) Only barriers with a height above 5 m and with a known placement were used. This translates into a potential underestimation of barrier-driven fragmentation. (2) The permeability of barriers is unknown; a proper quantification of barrier negotiability would improve the accuracy of the results. (3) The probability of GES is not available for all river segments of all the basins in the study area; if these existed, the results would more adequately represent the actual fragmentation state of basins. However, even when acknowledging these caveats, the main outcomes still hold.
In summary, this study underlines the need for a broader view of connectivity assessment methodologies, evaluating connectivity in combination with other aspects such as ecological quality for the better optimisation of restoration efforts. By adopting a holistic perspective that acknowledges the interdependence of structural and ecological factors, river restoration efforts can achieve enhanced environmental outcomes with a better allocation of economic needs, supporting sustainable and effective management practices.

Supplementary Materials

The following supporting information can be downloaded at: https://www.mdpi.com/article/10.3390/hydrobiology4030018/s1, Figure S1: Dendritic connectivity index for potamodromous fish species (DCIp)—structural connectivity, considering only natural barriers (S_NB); Figure S2: Dendritic connectivity index for potamodromous fish species (DCIp)—quality-weighted connectivity, considering only natural barriers (W_NB). Figure S3: Dendritic connectivity index for potamodromous fish species (DCIp)—structural connectivity, considering all barriers (S_AB). Figure S4: Dendritic connectivity index for potamodromous fish species (DCIp)—quality-weighted connectivity, considering all barriers, and with improved ecological quality (W_AB_IQ); Figure S5: Dendritic connectivity index for potamodromous fish species (DCIp)—quality-weighted connectivity, considering all barriers, and with improved probability of connectivity (W_AB_IC).

Author Contributions

Conceptualization, A.T.F., G.D., and P.B.; methodology, A.T.F., G.D., and P.B.; software, A.T.F., G.D., and T.L.; validation, G.D., M.T.F., and P.B.; formal analysis, A.T.F.; investigation, A.T.F., G.D., T.L., M.T.F., and P.B.; data curation, A.T.F. and T.L.; writing—original draft preparation, A.T.F.; writing—review and editing, A.T.F., G.D., T.L., M.T.F., and P.B.; visualization, A.T.F., G.D., T.L., M.T.F., and P.B.; supervision, G.D., M.T.F., and P.B.; project administration, M.T.F. and P.B.; funding acquisition, A.T.F. and P.B. All authors have read and agreed to the published version of the manuscript.

Funding

This study was funded by the project “Dammed Fish—Impact of structural and functional river network connectivity losses on fish biodiversity—Optimising management solutions” (PTDC/CTA-AMB/4086/2021, DOI: 10.54499/PTDC/CTA-AMB/4086/2021), from Fundação para a Ciência e Tecnologia, I.P. (FCT). António Tovar Faro was supported by a PhD grant from FCT, Portugal (2021.06859.BD). Tamara Leite was supported by a PhD grant from the FLUVIO–River Restoration and Management program funded by FCT, Portugal (UI/BD/15052/2021). Gonçalo Duarte has been financed by FCT within the project PTDC/CTA-AMB/4086/2021 and via UIDP/00239/2020. Paulo Branco was financed by national funds via FCT (LA/P/0092/2020). The Forest Research Centre (CEF) is a research unit funded by FCT through project reference UIDB/00239: Centro de Estudos Florestais, (DOI: 10.54499/UIDB/00239/2020). Associate Laboratory TERRA is also funded by FCT (LA/P/0092/2020, DOI: 10.54499/LA/P/0092/2020).

Institutional Review Board Statement

Not applicable.

Informed Consent Statement

Not applicable.

Data Availability Statement

The raw data supporting the conclusions of this article will be made available by the authors on request.

Acknowledgments

The authors would like to thank Olaf Helwig for facilitating access to the European Waterfall Database, and Lara Gonçalves for her work in compiling the waterfall data. The authors also thank Olga Vigiak and her colleagues for facilitating access to the probability maps of anthropogenic impacts affecting ecological status in European rivers.

Conflicts of Interest

The authors declare no conflicts of interest. The funders had no role in the design of the study; in the collection, analysis, or interpretation of data; in the writing of the manuscript; or in the decision to publish the results.

References

  1. Dudgeon, D. Multiple threats imperil freshwater biodiversity in the Anthropocene. Curr. Biol. 2019, 29, R960–R967. [Google Scholar] [CrossRef] [PubMed]
  2. Sayer, C.A.; Fernando, E.; Jimenez, R.R.; Macfarlane, N.B.W.; Rapacciuolo, G.; Böhm, M.; Brooks, T.M.; Contreras-MacBeath, T.; Cox, N.A.; Harrison, I.; et al. One-quarter of freshwater fauna threatened with extinction. Nature 2025, 638, 138–145. [Google Scholar] [CrossRef] [PubMed]
  3. Carvalho, L.; Mackay, E.B.; Cardoso, A.C.; Baattrup-Pedersen, A.; Birk, S.; Blackstock, K.L.; Borics, G.; Borja, A.; Feld, C.K.; Ferreira, M.T.; et al. Protecting and restoring Europe’s waters: An analysis of the future development needs of the water framework directive. Sci. Total Environ. 2019, 658, 1228–1238. [Google Scholar] [CrossRef] [PubMed]
  4. European Environment Agency. State of Nature in the EU: Results from Reporting under the Nature Directives 2013–2018; Publications Office of the European Union: Luxembourg, 2020.
  5. European Environment Agency. European Waters: Assessment of Status and Pressures 2018; Publications Office of the European Union: Luxembourg, 2018.
  6. Haddad, N.M.; Brudvig, L.A.; Clobert, J.; Davies, K.F.; Gonzalez, A.; Holt, R.D.; Lovejoy, T.E.; Sexton, J.O.; Austin, M.P.; Collins, C.D.; et al. Habitat fragmentation and its lasting impact on Earth’s ecosystems. Sci. Adv. 2015, 1, e1500052. [Google Scholar] [CrossRef]
  7. Pereira, H.M.; Leadley, P.W.; Proença, V.; Alkemade, R.; Scharlemann, J.P.W.; Fernandez-Manjarrés, J.F.; Araújo, M.B.; Balvanera, P.; Biggs, R.; Cheung, W.W.L.; et al. Scenarios for global biodiversity in the 21st century. Science 2010, 330, 1496–1501. [Google Scholar] [CrossRef]
  8. Rands, M.R.W.; Adams, W.M.; Bennun, L.; Butchart, S.H.M.; Clements, A.; Coomes, D.; Entwistle, A.; Hodge, I.; Kapos, V.; Scharlemann, J.P.W.; et al. Biodiversity conservation: Challenges beyond 2010. Science 2010, 329, 1298–1303. [Google Scholar] [CrossRef]
  9. Su, G.; Logez, M.; Xu, J.; Tao, S.; Villéger, S.; Brosse, S. Human impacts on global freshwater fish biodiversity. Science 2021, 371, 835–838. [Google Scholar] [CrossRef]
  10. Poff, N.L.; Zimmerman, J.K.H. Ecological responses to altered flow regimes: A literature review to inform the science and management of environmental flows. Freshw. Biol. 2010, 55, 194–205. [Google Scholar] [CrossRef]
  11. Suen, J.-P. Determining the ecological flow regime for existing reservoir operation. Water Resour. Manag. 2011, 25, 817–835. [Google Scholar] [CrossRef]
  12. Díaz, G.; Górski, K.; Heino, J.; Arriagada, P.; Link, O.; Habit, E. The longest fragment drives fish beta diversity in fragmented river networks: Implications for river management and conservation. Sci. Total Environ. 2021, 766, 144323. [Google Scholar] [CrossRef]
  13. Ward, J.V. The four-dimensional nature of lotic ecosystems. J. N. Am. Benthol. Soc. 1989, 8, 2–8. [Google Scholar] [CrossRef]
  14. Ward, J.V.; Tockner, K.; Schiemer, F. Biodiversity of floodplain river ecosystems: Ecotones and connectivity. Regul. Rivers. Mgmt. 1999, 15, 125–139. [Google Scholar] [CrossRef]
  15. European Union. Directive 2000/60/EC of the European Parliament and of the Council Establishing a Framework for Community Action in the Field of Water Policy; European Union: Brussels, Belgium, 2000. [Google Scholar]
  16. Hall, C.J.; Jordaan, A.; Frisk, M.G. The historic influence of dams on diadromous fish habitat with a focus on river herring and hydrologic longitudinal connectivity. Landscape. Ecol. 2011, 26, 95–107. [Google Scholar] [CrossRef]
  17. Liermann, C.R.; Nilsson, C.; Robertson, J.; Ng, R.Y. Implications of dam obstruction for global freshwater fish diversity. Biosci. 2012, 62, 539–548. [Google Scholar] [CrossRef]
  18. Lucas, M.; Baras, E. Migration of Freshwater Fishes; Blackwell Science: Oxford, UK, 2001; ISBN 978-0-632-05754-2. [Google Scholar]
  19. Barbarossa, V.; Schmitt, R.J.P.; Huijbregts, M.A.J.; Zarfl, C.; King, H.; Schipper, A.M. Impacts of current and future large dams on the geographic range connectivity of freshwater fish worldwide. Proc. Natl. Acad. Sci. USA 2020, 117, 3648–3655. [Google Scholar] [CrossRef]
  20. Humphries, P.; Winemiller, K.O. Historical impacts on river fauna, shifting baselines, and challenges for restoration. BioScience 2009, 59, 673–684. [Google Scholar] [CrossRef]
  21. Nilsson, C.; Reidy, C.A.; Dynesius, M.; Revenga, C. Fragmentation and flow regulation of the world’s large river systems. Science 2005, 308, 405–408. [Google Scholar] [CrossRef]
  22. Northcote, T.G. Migratory Behaviour of Fish and Its Significance to Movement Trough Riverine Fish Passage Facilities. In Fish Migration and Fish Bypasses; Fishing News Books: Oxford, UK, 1998; pp. 3–18. [Google Scholar]
  23. Mader, H.; Maier, C. A method for prioritizing the reestablishment of river continuity in Austrian rivers. Hydrobiologia 2008, 609, 277–288. [Google Scholar] [CrossRef]
  24. Fetting, C. The European Green Deal; ESDN: Vienna, Austria, 2020. [Google Scholar]
  25. European Commission Directorate-General for Environment. EU Biodiversity Strategy for 2030—Bringing Nature Back into Our Lives; European Commission: Brussels, Belgium, 2021.
  26. Schwarz, U. The Potential of Barrier Removal to Reconnect Europe’s Rivers; WWF: Gland, Switzerland, 2021. [Google Scholar]
  27. European Commission Directorate-General for Environment. Nature Restoration Law—For People, Climate, and Planet, Proposal for a Regulation on Nature Restoration; European Commission: Brussels, Belgium, 2022.
  28. European Environment Agency. Europe’s State of Water 2024: The Need for Improved Water Resilience; Publications Office of the European Union: Luxembourg, 2024.
  29. Petsas, P.; Almpanidou, V.; Mazaris, A.D. Landscape connectivity analysis: New metrics that account for patch quality, neighbors’ attributes and robust connections. Landsc. Ecol. 2021, 36, 3153–3168. [Google Scholar] [CrossRef]
  30. Saura, S.; Pascual-Hortal, L. A new habitat availability index to integrate connectivity in landscape conservation planning: Comparison with existing indices and application to a case study. Landsc. Urban Plan. 2007, 83, 91–103. [Google Scholar] [CrossRef]
  31. European Commission. Overall Approach to the Classification of Ecological Status and Ecological Potential: Guidance Document; No. 13; European Commission: Brussels, Belgium, 2003.
  32. Vigiak, O.; Udias, A.; Pistocchi, A.; Zanni, M.; Aloe, A.; Grizzetti, B. Probability maps of anthropogenic impacts affecting ecological status in European rivers. Ecol. Indic. 2021, 126, 107684. [Google Scholar] [CrossRef] [PubMed]
  33. De Jager, A.; Vogt, J. Rivers and Catchments of Europe—Catchment Characterisation Model (CCM); European Commission: Brussels, Belgium, 2007.
  34. European Waterfalls 2020. Available online: https://www.europeanwaterfalls.com/,2020 (accessed on 16 September 2021).
  35. Swan, B.; Gross, D. World Waterfall Database. 2012. Available online: https://www.worldwaterfalldatabase.com/ (accessed on 16 September 2021).
  36. Google Earth. Google Earth Pro; Google: Menlo Park, CA, USA, 2022. [Google Scholar]
  37. Duarte, G.; Peponi, A.; Leite, T.; Faro, A.; Moreno, D.; Anjinho, P.; Segurado, P.; Borgwardt, F.; Baattrup-Pedersen, A.; Hering, D.; et al. MERLIN Deliverable D3.1: Screening Maps: Europe-Wide Maps of the Needs and Potentials to Restore Floodplains, Rivers, and Wetlands with a Range of Restoration Measures; EU H2020 Research and Innovation Project MERLIN Deliverable; Merlin Entertainments: Poole, UK, 2023; p. 348. [Google Scholar]
  38. AMBER Consortium. The AMBER Barrier Atlas—A Pan-European Database of Artificial Instream Barriers; European Environment Agency: Copenhagen, Denmark, 2020.
  39. Wang, J.; Walter, B.A.; Yao, F.; Song, C.; Ding, M.; Maroof, A.S.; Zhu, J.; Fan, C.; McAlister, J.M.; Sikder, S.; et al. GeoDAR: Georeferenced global dams and reservoirs dataset for bridging attributes and geolocations. Earth Syst. Sci. Data 2022, 14, 1869–1899. [Google Scholar] [CrossRef]
  40. Mulligan, M.; van Soesbergen, A.; Sáenz, L. GOODD, a global dataset of more than 38,000 georeferenced dams. Sci. Data 2020, 7, 31. [Google Scholar] [CrossRef]
  41. Cote, D.; Kehler, D.G.; Bourne, C.; Wiersma, Y.F. A new measure of longitudinal connectivity for stream networks. Landsc. Ecol. 2009, 24, 101–113. [Google Scholar] [CrossRef]
  42. Bourne, C.M.; Kehler, D.G.; Wiersma, Y.F.; Cote, D. Barriers to fish passage and barriers to fish passage assessments: The impact of assessment methods and assumptions on barrier identification and quantification of watershed connectivity. Aquat. Ecol. 2011, 45, 389–403. [Google Scholar] [CrossRef]
  43. Grill, G.; Ouellet Dallaire, C.; Fluet Chouinard, E.; Sindorf, N.; Lehner, B. Development of new indicators to evaluate river fragmentation and flow regulation at large scales: A case study for the Mekong River basin. Ecol. Indic. 2014, 45, 148–159. [Google Scholar] [CrossRef]
  44. Duarte, G.; Segurado, P.; Oliveira, T.; Haidvogl, G.; Pont, D.; Ferreira, M.T.; Branco, P. The river network toolkit—Rivtool. Ecography 2019, 42, 549–557. [Google Scholar] [CrossRef]
  45. Diebel, M.W.; Fedora, M.; Cogswell, S.; O’Hanley, J.R. Effects of road crossings on habitat connectivity for stream-resident fish. River Res. Appl. 2015, 31, 1251–1261. [Google Scholar] [CrossRef]
  46. Maitland, B.M.; Poesch, M.; Anderson, A.E. Prioritising culvert removals to restore habitat for at-risk salmonids in the boreal forest. Fish. Manag. Ecol. 2016, 23, 489–502. [Google Scholar] [CrossRef]
  47. Shaw, E.A.; Lange, E.; Shucksmith, J.D.; Lerner, D.N. Importance of partial barriers and temporal variation in flow when modelling connectivity in fragmented river systems. Ecol. Eng. 2016, 91, 515–528. [Google Scholar] [CrossRef]
  48. Pringle, C. What is hydrologic connectivity and why is it ecologically important? Hydrol. Process. 2003, 17, 2685–2689. [Google Scholar] [CrossRef]
  49. Schmutz, S.; Sendzimir, J. (Eds.) Riverine Ecosystem Management: Science for Governing Towards a Sustainable Future; Springer International Publishing: Cham, Switzerland, 2018; ISBN 978-3-319-73249-7. [Google Scholar]
  50. Branco, P.; Amaral, S.D.; Ferreira, M.T.; Santos, J.M. Do small barriers affect the movement of freshwater fish by increasing residency? Sci. Total Environ. 2016, 581–582, 486–494. [Google Scholar] [CrossRef]
  51. Hayes, D.S.; Branco, P.; Santos, J.M.; Ferreira, T. Oxygen depletion affects kinematics and shoaling cohesion of cyprinid fish. Water 2019, 11, 642. [Google Scholar] [CrossRef]
  52. Le Pichon, C.; Lestel, L.; Courson, E.; Merg, M.-L.; Tales, E.; Belliard, J. Historical changes in the ecological connectivity of the Seine River for fish: A focus on physical and chemical barriers since the mid-19th century. Water 2020, 12, 1352. [Google Scholar] [CrossRef]
  53. Brettschneider, D.J.; Spring, T.; Blumer, M.; Welge, L.; Dombrowski, A.; Schulte-Oehlmann, U.; Sundermann, A.; Oetken, M.; Oehlmann, J. Much effort, little success: Causes for the low ecological efficacy of restoration measures in German surface waters. Environ. Sci. Eur. 2023, 35, 31. [Google Scholar] [CrossRef]
Figure 1. The studied river basins, along with the locations of natural and artificial barriers.
Hydrobiology 04 00018 g001
Figure 2. Bar charts representing the number of river basins per class of the dendritic connectivity index for potamodromous fish species (DCIp): (a) structural connectivity, considering only natural barriers (S_NB); (b) quality-weighted connectivity, considering only natural barriers (W_NB); (c) structural connectivity, considering all barriers (S_AB); (d) quality-weighted connectivity, considering all barriers (W_AB); (e) quality-weighted connectivity, considering all barriers, with improved ecological quality (W_AB_IQ); (f) quality-weighted connectivity, considering all barriers, with improved probability of connectivity (W_AB_IC); (g) quality-weighted connectivity, considering all barriers, with improved ecological quality and probability of connectivity (W_AB_IQC).
Hydrobiology 04 00018 g002
Figure 3. Map representation of the dendritic connectivity index for potamodromous fish species (DCIp) per river basin: (a) quality-weighted connectivity, considering all barriers (W_AB); (b) quality-weighted connectivity, considering all barriers, with improved ecological quality and probability of connectivity (W_AB_ISQC).
Hydrobiology 04 00018 g003
Table 1. Statistical values derived from our DCIp calculations: S_NB—structural connectivity, considering only natural barriers; W_NB—quality-weighted connectivity, considering only natural barriers; S_AB—structural connectivity, considering all barriers; W_AB—quality-weighted connectivity, considering all barriers; W_AB_IQ—quality-weighted connectivity, considering all barriers, with improved ecological quality; W_AB_IC—quality-weighted connectivity considering all barriers, with improved probability of connectivity; W_AB_IQC—quality-weighted connectivity, considering all barriers, with improved ecological quality and probability of connectivity. Weighted mean connectivity values were calculated by weighting each basin’s connectivity value by its area to account for differences in basin size.
S_NBW_NBS_ABW_ABW_AB_IQW_AB_ICW_AB_IQC
Mean0.980.300.850.270.370.290.40
Std. Deviation0.090.160.260.170.130.160.26
Minimum0.250.000.020.000.010.000.02
Maximum1.000.571.000.570.570.570.57
Weighted Mean (by area)0.930.230.540.090.150.130.20
Disclaimer/Publisher’s Note: The statements, opinions and data contained in all publications are solely those of the individual author(s) and contributor(s) and not of MDPI and/or the editor(s). MDPI and/or the editor(s) disclaim responsibility for any injury to people or property resulting from any ideas, methods, instructions or products referred to in the content.

