Article

Assessing Methods to Monitor Aquatic Invertebrates in a Large River: Comparing Rock Baskets and Hess Samplers in the Snake River, Wyoming, USA

by
Lusha M. Tronstad
1,2,* and
Bryan P. Tronstad
1
1
Wyoming Natural Diversity Database, University of Wyoming, Laramie, WY 82071, USA
2
Department of Zoology and Physiology, and Program in Ecology and Evolution, University of Wyoming, Laramie, WY 82071, USA
*
Author to whom correspondence should be addressed.
Hydrobiology 2024, 3(3), 209-223; https://doi.org/10.3390/hydrobiology3030014
Submission received: 19 June 2024 / Revised: 31 July 2024 / Accepted: 1 August 2024 / Published: 5 August 2024

Abstract

:
Large rivers are difficult to sample due to their size yet critical to monitor because humans heavily rely upon and alter them. Aquatic invertebrates are commonly used to assess the ecosystem quality of streams, but methods to sample large rivers are underdeveloped. We sampled aquatic invertebrates using a Hess sampler and rock baskets in the Snake River near Jackson, Wyoming, USA. Hess samples collected more aquatic invertebrate taxa and a higher proportion of Ephemeroptera, Plecoptera, and burrowing taxa. Rock baskets collected a higher proportion of Trichoptera, filterers, and clinging taxa. Bioassessment metrics differed between sampling methods; richness, diversity, evenness, Ephemeroptera, Plecoptera, and Trichoptera (EPT), and Hilsenhoff’s biotic index produced higher values in Hess samples, and percent EPT was higher in rock baskets. Non-metric multidimensional scaling and analysis of similarity indicated that the samplers collected different assemblages (p < 0.001). The standard error of total invertebrate density was smaller and most taxa were collected with seven replicate samples. Understanding how sampling methods alter the aquatic invertebrates collected will help managers develop monitoring protocols that are best suited to the river and collect the most unbiased invertebrate assemblages.

1. Introduction

Large rivers are critical to monitor, because they have been altered for navigation, power generation, water withdrawals, invasive species and waste disposal for centuries [1,2,3], but their sheer size makes working in them difficult. The definition of a large river is not well defined, but has been categorized as those with a Strahler stream order of ≥7 [4] or a lotic ecosystem with a bankfull channel width of >15 m [5]. Streams are also categorized as wadeable (<1 m depth) and non-wadeable (>1 m depth) for the purpose of sampling; non-wadeable streams are deeper and swifter making them much harder to sample. Regardless of the definition, most of the available literature on lotic ecosystems addresses smaller, wadeable streams [6]. Methods to collect reliable information in large, non-wadeable rivers is critically needed, because these ecosystems are usually the most altered [1]. For example, rivers were channelized to allow boats to easily navigate along them long before stream ecologists studied rivers [3]. Channelizing disconnects rivers from their floodplain, exacerbating the effects on biota. Dams were constructed across large rivers to produce energy, but dams disconnect fish populations, alter hydrology, cause species extinctions, alter sediment dynamics and release greenhouse gases [3]. Nutrient and pathogen pollution in large rivers has gained attention in recent years [3]. A well-known example is the high nutrient load carried by the Mississippi River causing hypoxic zones in the Gulf of Mexico [7,8]. Methods to assess how ecosystem functioning differs between large rivers and streams are being developed, and investigators are increasingly concluding that large rivers are more dynamic, spatially diverse and heterogeneous than streams [9].
Large rivers need to be monitored due to the modifications and pollution added to them. Aquatic invertebrates are commonly used to monitor lotic ecosystems as they are relatively long-lived and sedentary, easily collected, diverse, and most critically, they differ in their response to perturbations [10]. They are often collected using quantitative samplers, qualitative methods, or artificial substrates in large rivers [11]. A variety of samplers have been used to collect aquatic invertebrates in large rivers including Hess samplers, Hester-Dendy plates, rock baskets, kicknet sampling, grab samples (e.g., Ponar), and dipnet sampling [12,13,14,15,16,17,18,19]. Hess and Ponar samplers collect aquatic invertebrates that live on natural substrates within a known area. The biggest limitation of Hess samplers is the shallower water depths, but modified versions are available to sample in deeper water. An advantage of Hess samplers is that they collect invertebrates at natural densities on a variety of substrate and habitat types. Ponar samplers work best with fine substrates and can sample deeper areas, but these samplers do not work with larger substrates (e.g., cobble). Artificial substrates can provide a novel habitat by introducing plates in flowing water (i.e., Hester-Dendy) or placing natural substrates in new configurations (i.e., rock baskets). Artificial substrates allow investigators to collect aquatic invertebrates in streams and rivers that can be difficult to sample (e.g., deep, channelized rivers), but the density and proportion of invertebrate groups they collect can differ from natural substrates, e.g., [20]. Artificial substrates can also produce results that reflect better ecosystem quality compared to samples from natural substrates [20,21,22]. Dipnets and kicknets allow the user to collect samples in a variety of microhabitats, but they can collect a subset of the taxa in the area [22]. Choosing a sampling method to monitor large rivers can be difficult, and the chosen method should reduce bias and be feasible. The characteristics of the ecosystem will be the largest determinants of which sampling method is best for each river.
The Snake River in the northwestern USA has been altered like so many large rivers, with dams for power generation, water withdrawals for irrigation, and recreational use, but little is known about it. Growing interest in monitoring this large river in northwestern Wyoming led us to collect aquatic invertebrates using two methods (Hess sampler and rock baskets) to assess which sampling method was the most feasible and produced the least biased results for monitoring while reducing costs. This also allowed us to collect baseline data for future comparisons. We chose these samplers due to the cobble substrate, fast current, and practicability of their use based on previous studies and recommendations for sampling non-wadeable rivers [11]. Our specific questions were: (1.) To what degree did the invertebrate assemblage differ between the samplers? (2.) Did the methods result in similar bioassessment metrics? and (3.) How many samples should be collected to reduce variance and collect most taxa along the reach? We collected 10 aquatic invertebrate samples of each type in a reach of the Snake River to compare sampling methods. Hess samples were collected in water <42 cm deep and rock baskets were placed in deeper areas along the bank so they could be secured. Both methods sampled aquatic invertebrates along the margin of the river but differed in the depth of water sampled. Rock baskets were 25 cm in height and created an artificial habitat for invertebrates, whereas Hess samples collected invertebrates on natural substrates. The results will provide information to help develop aquatic invertebrate monitoring protocols in the Snake River and other large rivers with cobble substrate.

2. Materials and Methods

2.1. Study Site

The headwaters of the Snake River flow from the Teton Wilderness and southern Yellowstone National Park, WY, USA. The river flows through Jackson Lake in Grand Teton National Park, a dammed natural lake (Figure 1). From Jackson Lake, the river flows westward into Idaho and Washington where it is a tributary of the Columbia River. Flow in this seventh-order stream is driven by snowmelt with the highest discharge in the spring and the lowest discharge in the autumn [23]; however, the dam on Jackson Lake regulates flows where we sampled. The discharge of the Snake River south of Jackson, Wyoming (USGS WY-13018750 gaging station) varied between 26.9 and 380 m3/s, with peak discharge occurring in late May and June, and base flows < 42 m3/s occurring from October to April. We sampled in a braided section of the Snake River between Wilson and Jackson, Wyoming when flows were ~92 to 122 m3/s and bankfull width ranged from 320 to 575 m. The elevation was ~1880 m and cobble dominated the substrate. Two samples of each type were collected in a smaller side channel (16 m wide) and the other eight samples of each type were collected in a larger side channel (45 m wide). The side channels had similar habitats, and we did not observe differences in the invertebrate assemblages. The water was swift and deep (>1 m) making the river not wadeable. The riparian vegetation was primarily willow and cottonwood trees.

2.2. Field Methods

We measured water chemistry using a Yellow Springs Instrument (YSI) Professional Plus that was calibrated before sampling to assess general conditions. The sonde measured water temperature, dissolved oxygen (mg/L and percent saturation), specific conductivity, and oxidation-reduction potential. We measured water velocity upstream of each rock basket using a FloMate 2000 that was zeroed before use.
We sampled aquatic invertebrates using two methods (n = 10 samples collected using each method) along a 1.3 km reach of the Snake River to estimate which method was best suited for monitoring. We collected Hess samples when rock baskets were retrieved in September 2022 to measure the aquatic invertebrate assemblage they collected. Hess samples (243 µm mesh) were collected by the same person using standardized protocols in areas of the river < 42 cm deep so that water would not flow over the top (Figure 2a,b). After ensuring the bottom of the sampler was sealed, we scrubbed all rocks within the Hess sampler. After all cobbles were removed, we used the handle of a brush to agitate the sediment and collect invertebrates living there. We rinsed the sample into the dolphin bucket and elutriated the sample in a bucket to remove rocks. We sieved the sample with 250 µm mesh and preserved the invertebrates in ~80% ethanol in Whirl-Paks.
Rock baskets were placed in the river during early August and left for 30 days to colonize with aquatic invertebrates to assess the invertebrate assemblage collected using this method (Figure 2c,d). We constructed rock baskets (25 × 25 × 25 cm) from hardware cloth (1.3 cm openings). We filled the baskets with rocks of similar size from the river so that biofilm was established and resources were available for colonizing invertebrates. We placed the rock baskets in the river along a bank and tethered them to a tree so they would not be swept away. We measured the depth and water velocity at each rock basket when they were retrieved. We lifted rock baskets from the water and placed them in a tub upon retrieval while an extra-large kicknet (Wildco; 243 µm; 30 cm × 51 cm) was held downstream against the basket to catch any invertebrates that escaped during retrieval. Rocks in the basket were scrubbed with brushes by the same people and protocols to standardized processing, and sieved with 250 µm mesh. Invertebrates clinging to the rock baskets were not collected. Invertebrates were preserved in ~80% ethanol in Whirl-Paks. We measured the mean particle size of all rocks and counted the number of rocks in each basket.

2.3. Invertebrate Processing and Bioassessment Metrics

We counted and identified aquatic invertebrates in samples to assess differences in sampling methods. Density (ind/m2) was calculated by dividing the number of invertebrates in the sample by the sampler area and dividing by the subsample processed, if applicable. We separated all samples into large (>2 mm mesh) and small fractions (250 µm to 2 mm) using sieves for more efficient sorting and these fractions were combined electronically during analysis. Invertebrates were numerous in rock basket samples so we subsampled by pouring the sample in a tray, mixing thoroughly, placing a Plexiglas divider in the tray and removing a fraction (1/2 to 1/8) with a turkey baster for identification. All invertebrates were identified from Hess samples. We identified aquatic insects to genus typically using Merritt et al. [24] and non-insect invertebrates using Thorp et al. [25]. We calculated six bioassessment metrics which assess the ecosystem quality of the river and can be compared with other rivers or reaches. Ephemeroptera, Plecoptera and Trichoptera (EPT) richness counted the number of taxa within these three orders where ecosystem quality is considered better when more taxa were present. The proportion of EPT taxa divided the number of EPT taxa in each replicate sample by the total number of unique taxa in each replicate sample. Taxa richness was the number of unique taxa observed, taxa diversity was calculated with Shannon’s diversity index and taxa evenness was estimated as taxa diversity divided by the natural log of taxa richness. Hilsenhoff’s Biotic Index (HBI) was calculated as the tolerance value for each taxa from [26] multiplied by their density. These values were summed for each sampler type and replicate sample. Summed values were divided by the total density in each replicate to calculate an average tolerance value for invertebrates [27]. Higher values of all metrics were interpreted as better ecosystem quality with the exception of HBI. We classified invertebrates into functional feeding groups (FFG) and habit using information from Barbour et al. [26] and Merritt et al. [24].

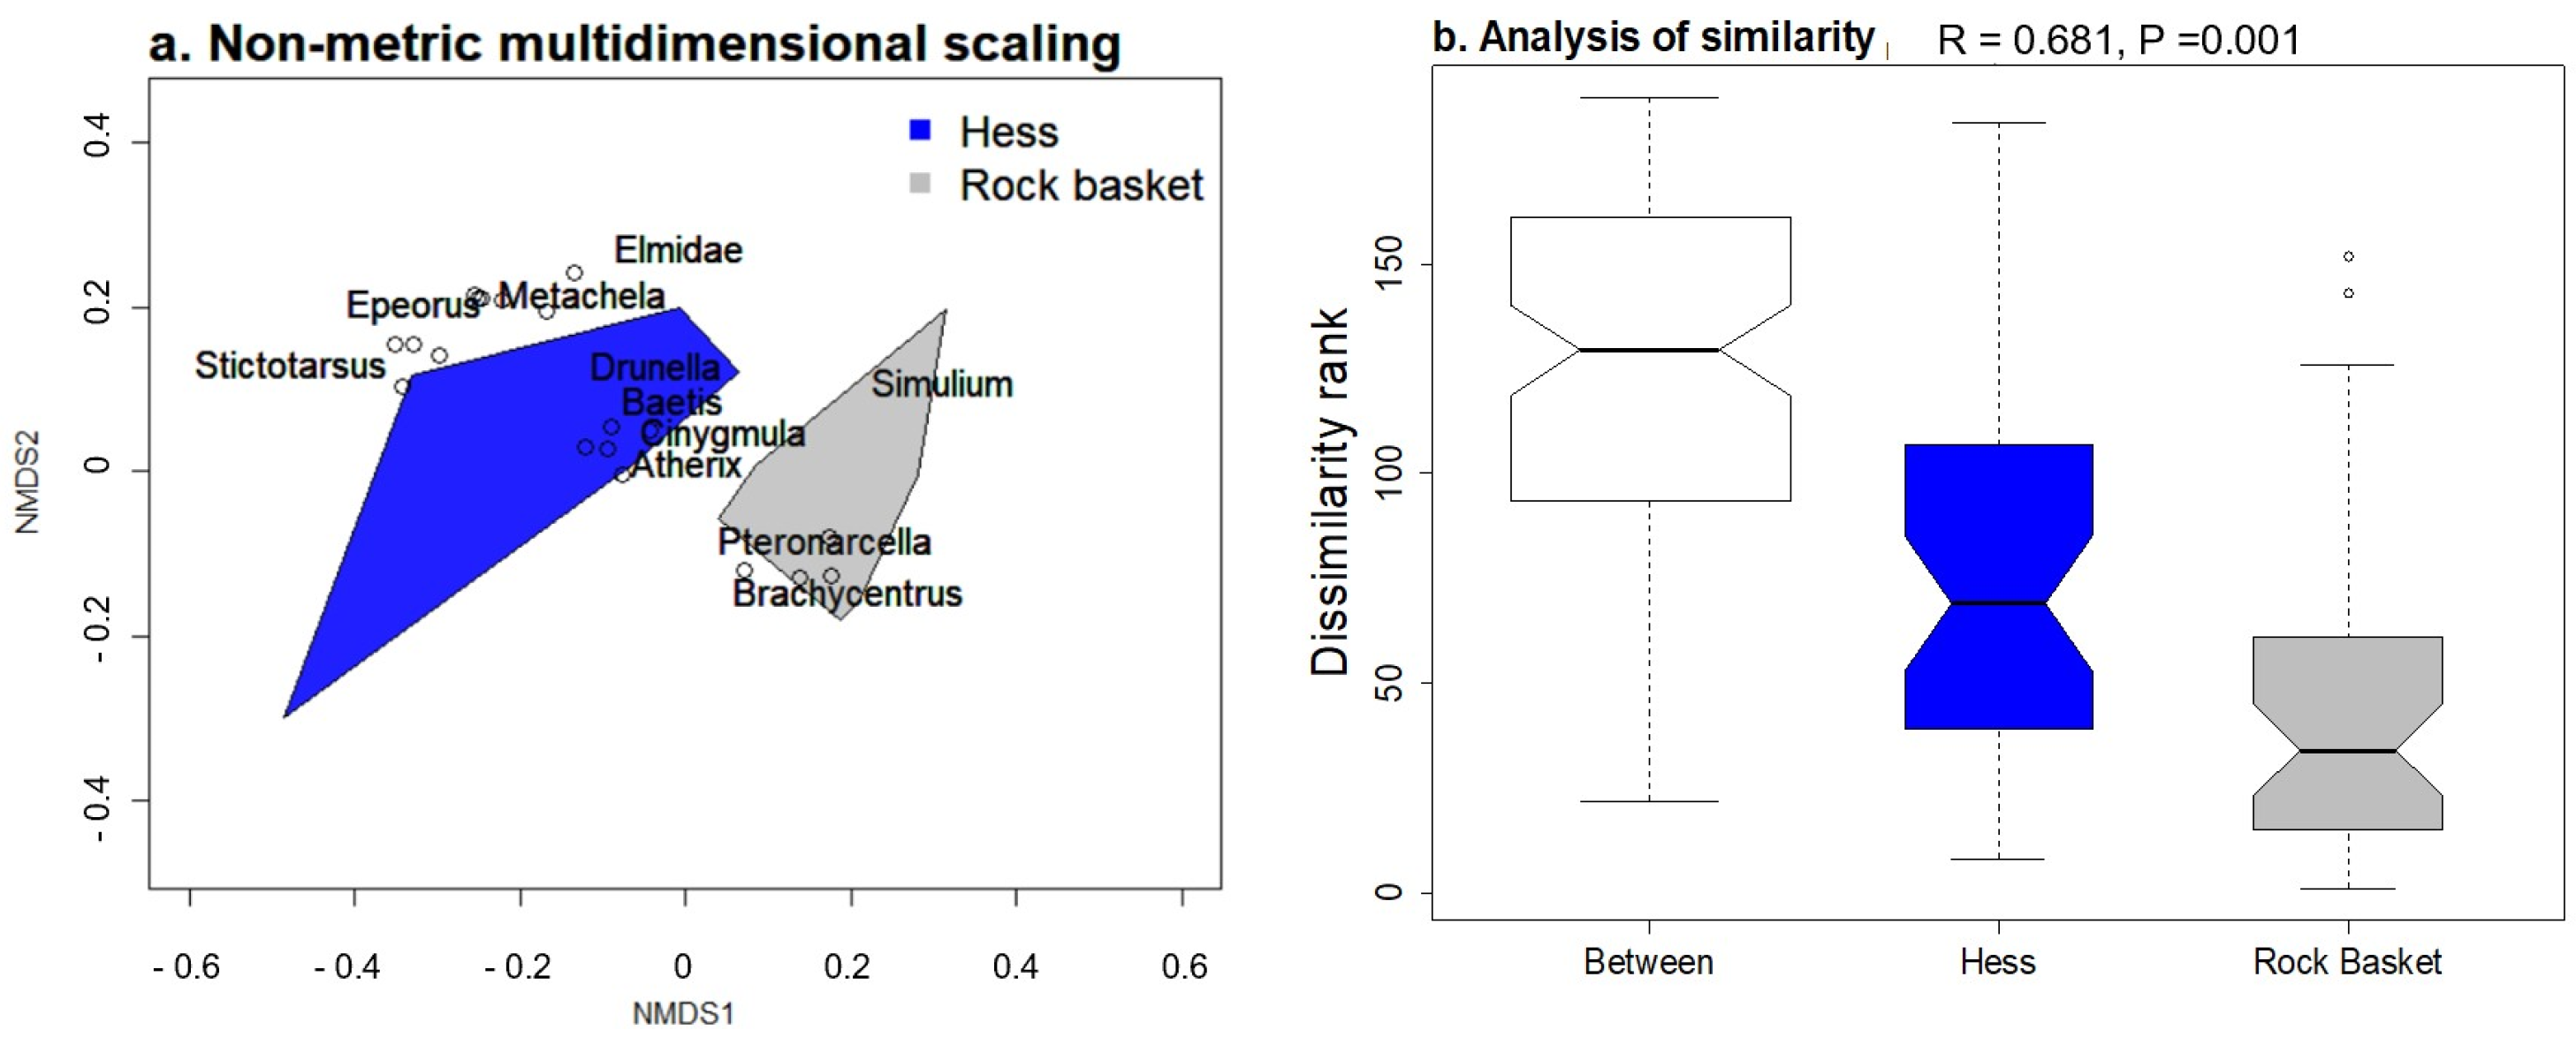
2.4. Invertebrate Assemblages

We compared the density of invertebrates, the proportion of each invertebrate group (e.g., insect orders), and bioassessment metrics between Hess and rock basket samples using Program R (R Development Core Team 2023). We used generalized linear models (GLM) with a gamma or normal distribution to estimate differences between methods after checking model assumptions of normality, linearity, homoskedasticity, and independence. We examined histograms of the data and we used the package ‘fitdistrplus’ [28] to select the distribution that most closely fits the data for analysis. Differences among FFGs and habits were compared using the emmeans function [29]. We used non-metric multidimensional scaling (NMDS) in the vegan package [30] to assess the overlap in invertebrate assemblages between the sampling methods. We removed taxa only collected at one site or whose abundance was <0.1% of the total. We used analysis of similarity (ANOSIM) and dissimilarity ranks to compare methods. Dissimilarity ranks calculated the dissimilarity for each sampler type and when all data are combined. The box width in the plots represents the number of samples, and box height is the dissimilarity ranks. Comparing dissimilarity calculated from both sampler types (between) to individual sampler types suggested if assemblages differed between sampling methods.

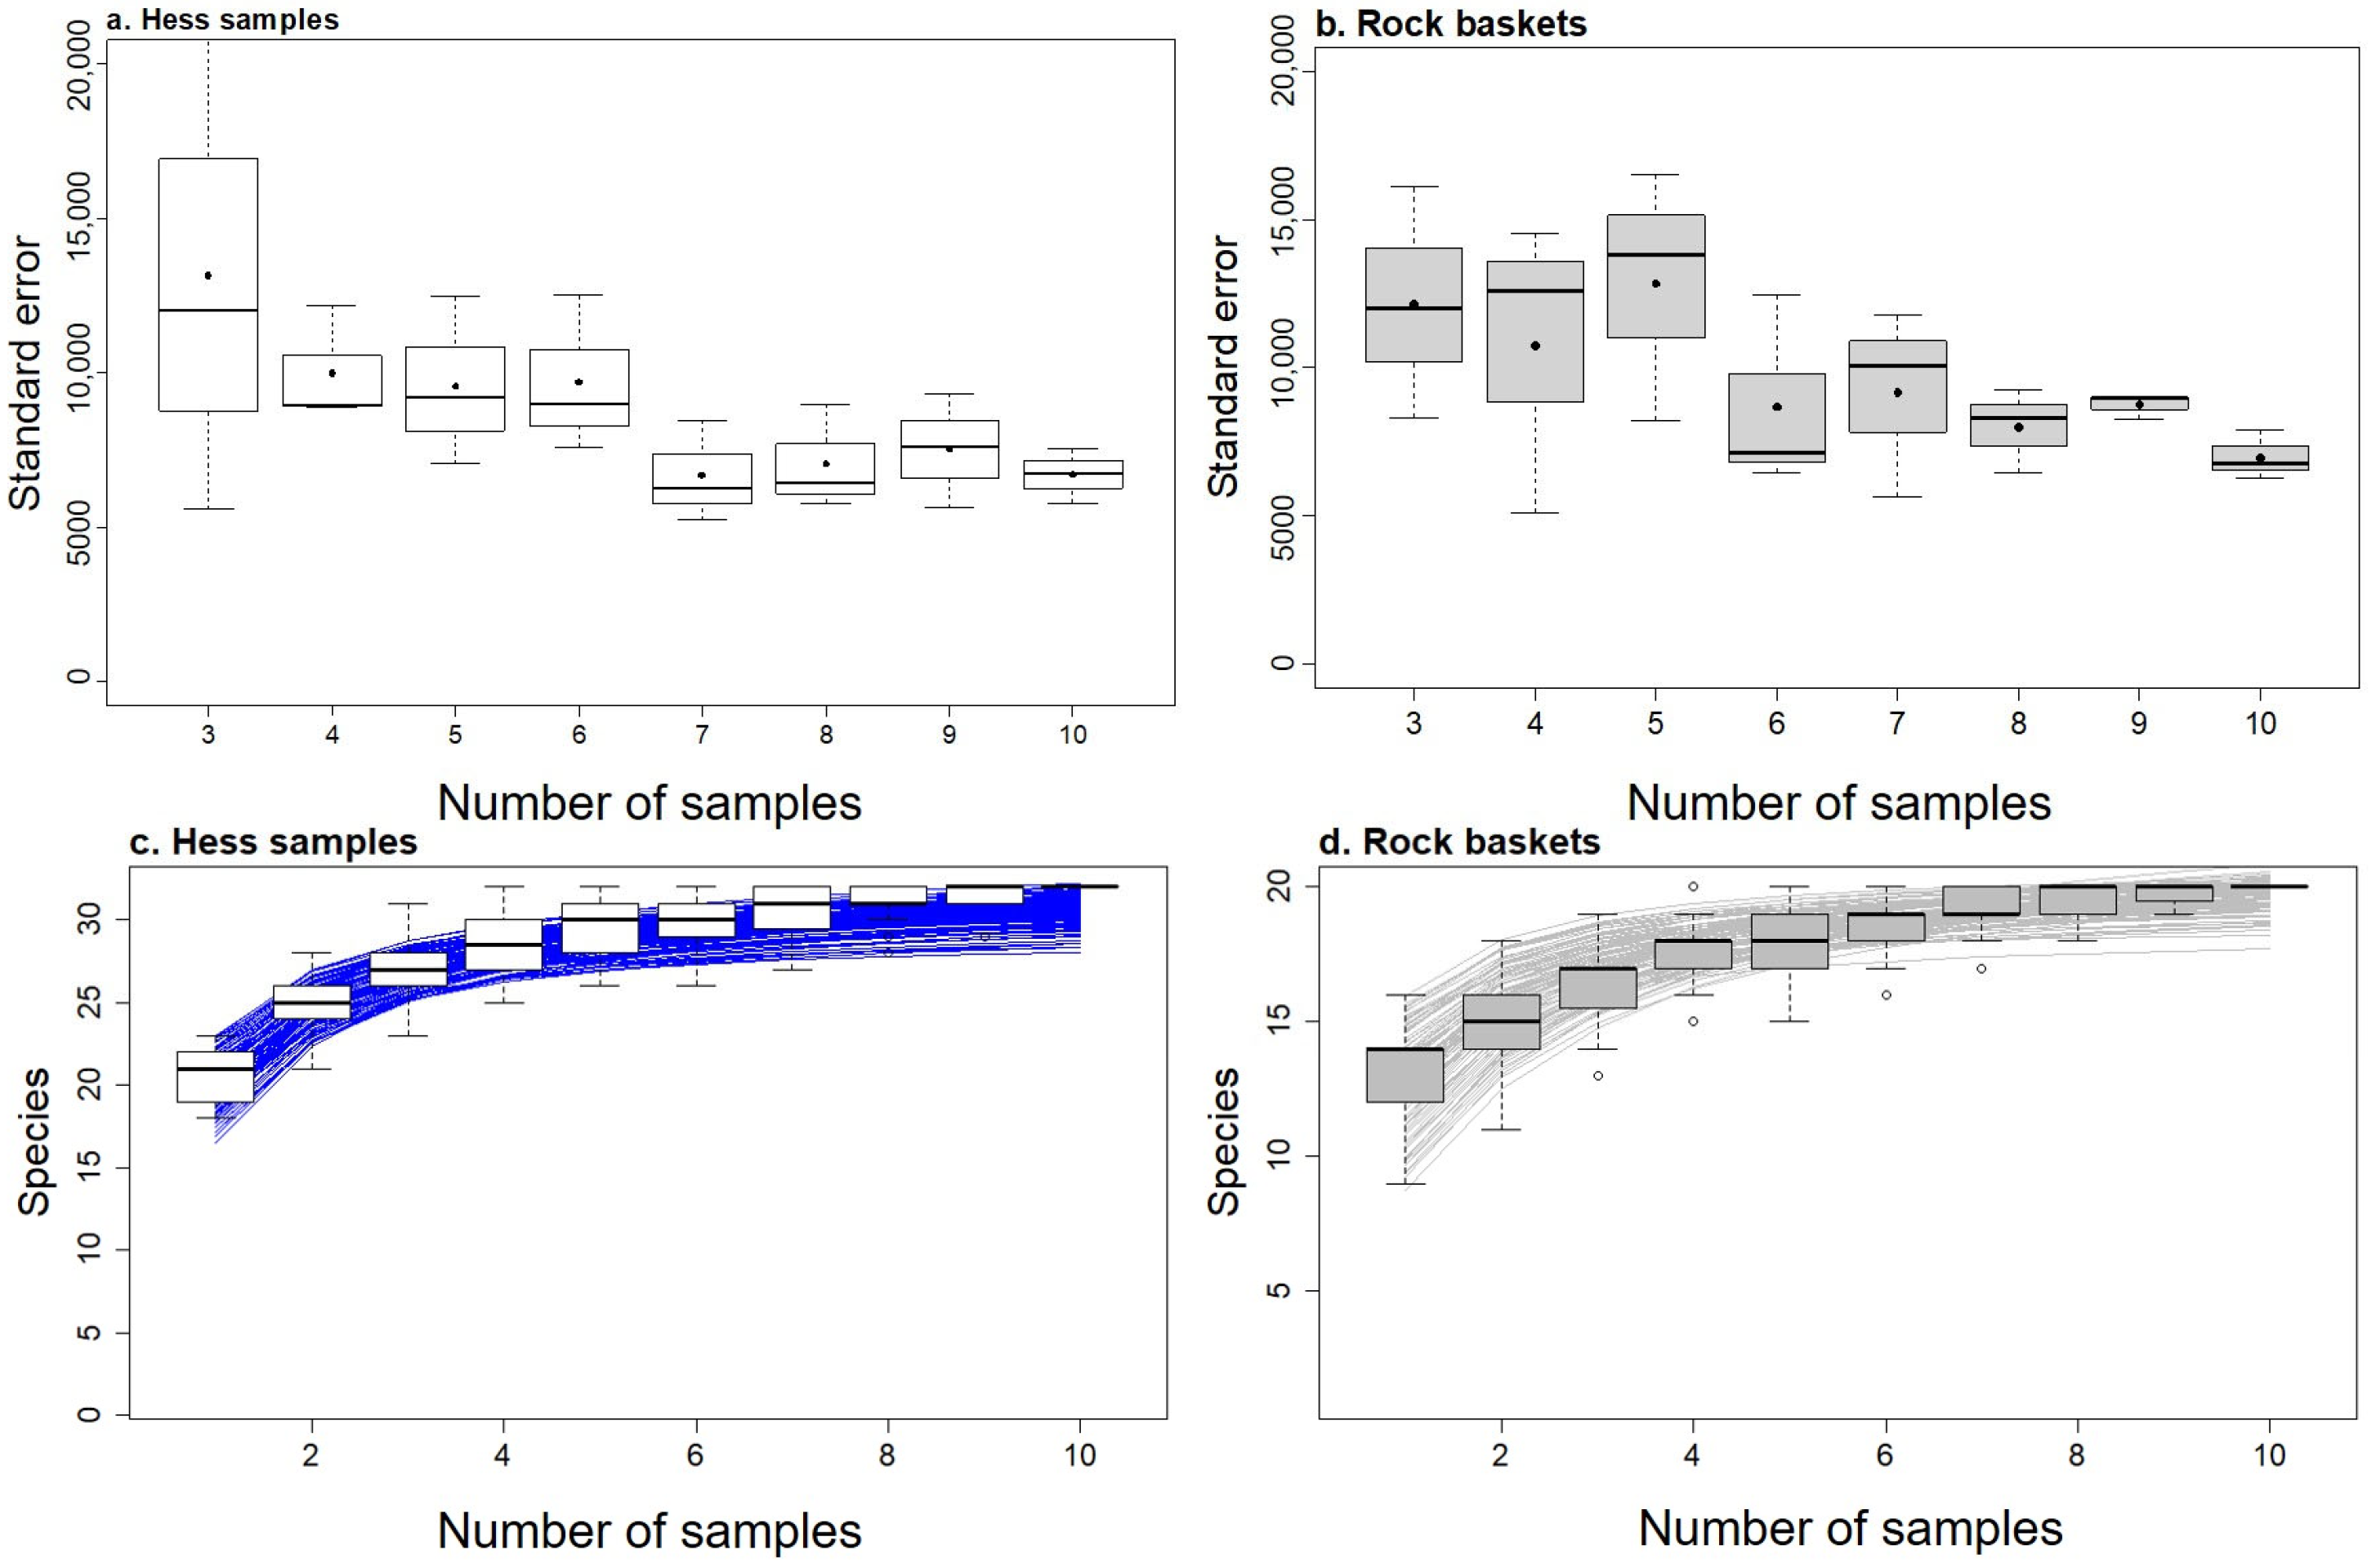
2.5. Variance and Species Accumulation Curves

We calculated the variance when 3 to 10 samples were collected of each type to estimate how many samples are needed to reduce variance to inform future sampling. We used the sim_df function in the package faux [31] to simulate 1000 estimates of the total density of the invertebrates collected with each sampler. Simulated data had the same mean and variance as the empirical data. We used the random function in Program R to randomly select 3 to 10 samples from the simulated data. Samples were selected three times for each number of samples so that standard error could be calculated. We calculated the standard error by dividing the standard deviation by the square root of the number of samples collected. We created species accumulation curves for samples collected with Hess samplers and rock baskets using the specaccum() function in the vegan package [30]. We used the Michaelis Menten method to model species accumulation. Data were summarized using the plyr package [32].

3. Results

3.1. Water Chemistry

The Snake River near Jackson, Wyoming had water saturated with oxygen and oxygen concentrations suitable for aquatic life (Table 1). The water temperature was warm, the concentration of dissolved ions was low (specific conductivity), pH was slightly basic and oxidation-reduction potential suggested that conditions were reducing (<200 mV).

3.2. Hess Samples

Invertebrates in Hess samples were abundant (31,953 ind/m2 ± 987 standard error). We collected 18 taxa per Hess sample (±0.40) on average and 31 taxa when all Hess samples were combined (composited estimate of richness; Table A1). Diptera represented the most abundant invertebrate group (37%) followed by Ephemeroptera (32%), Trichoptera (16%), Annelida (10%), Plecoptera (2%), and Trombidiformes (Acari; 2%), and Nematoda, Ostracoda and Coleoptera comprised < 1% (Figure 3). The most numerous taxa in Hess samples were non-Tanypodinae Chironomidae (26%), Drunella (16%), Baetis (14%), Brachycentrus (10%) and Oligochaeta (10%). The density of all other taxa comprised < 5% of the total density individually. Hess samples had a diversity of 2.1 ± 0.069 and evenness of 0.72 ± 0.024. On average, we collected 12 ± 0.49 EPT taxa per sample and 67% ± 0.023 of taxa collected were EPT. The mean tolerance value of invertebrates in Hess samples was 4.0 (±0.22; HBI). Gatherers (58%) were the most common FFG in Hess samples, followed by predators (19%), filterers (14%), shredders (4%), scrapers (4%), and parasites (1%). The most common habit of invertebrates collected in Hess samples was burrowers (45%), clingers (34%), swimmers (16%), climbers (4%), and sprawlers (<1%).

3.3. Rock Baskets

Invertebrates in rock baskets were numerous (75,554 ind/m2 ± 3892). The mean water velocity in front of the rock baskets was 0.56 m/s ± 0.067, and rock baskets were submerged 45.4 cm ± 4.0 (measured at the top of the basket). On average, 41 rocks ± 2.1 were in each basket and the mean particle size was 7.7 cm ± 0.47. We collected 11 taxa per basket (±0.65) on average and 20 taxa when all baskets were combined (composited estimate of richness; Table A1). Trichoptera was the most abundant invertebrate group (52%), followed by Diptera (37%), Ephemeroptera (9%) and Plecoptera (1%), and Hemiptera, Coleoptera and Annelida comprised <1%. Rock baskets were dominated by a few taxa; Brachycentrus comprised 46% of the individuals, 24% of individuals were Simulium, 11% were non-Tanypodinae Chironomidae and 6% were Hydropysche. Rock baskets had a diversity of 1.5 ± 0.010 and evenness of 0.60 ± 0.035. On average, we collected 9 ± 0.47 EPT taxa per sample and 83% ± 0.025 of the taxa collected were EPT. The mean tolerance value of invertebrates in rock baskets was 3.4 (±0.25; HBI). Filterers (76%) were the most common FFG in rock baskets, followed by gatherers (18%), predators (4%), scrapers (2%) and shredders (<1%). The most common habit of invertebrates collected in rock baskets was clingers (82%), burrowers (13%), swimmers (5%), climbers (<1%) and sprawlers (<1%). Water velocity, mean particle size, standard deviation of mean particle size, and the number of rocks in each basket explained little variance (t < 1.0, p > 0.4) in total density; however, invertebrates were generally denser at shallower depths (t = 1.9, p = 0.1).

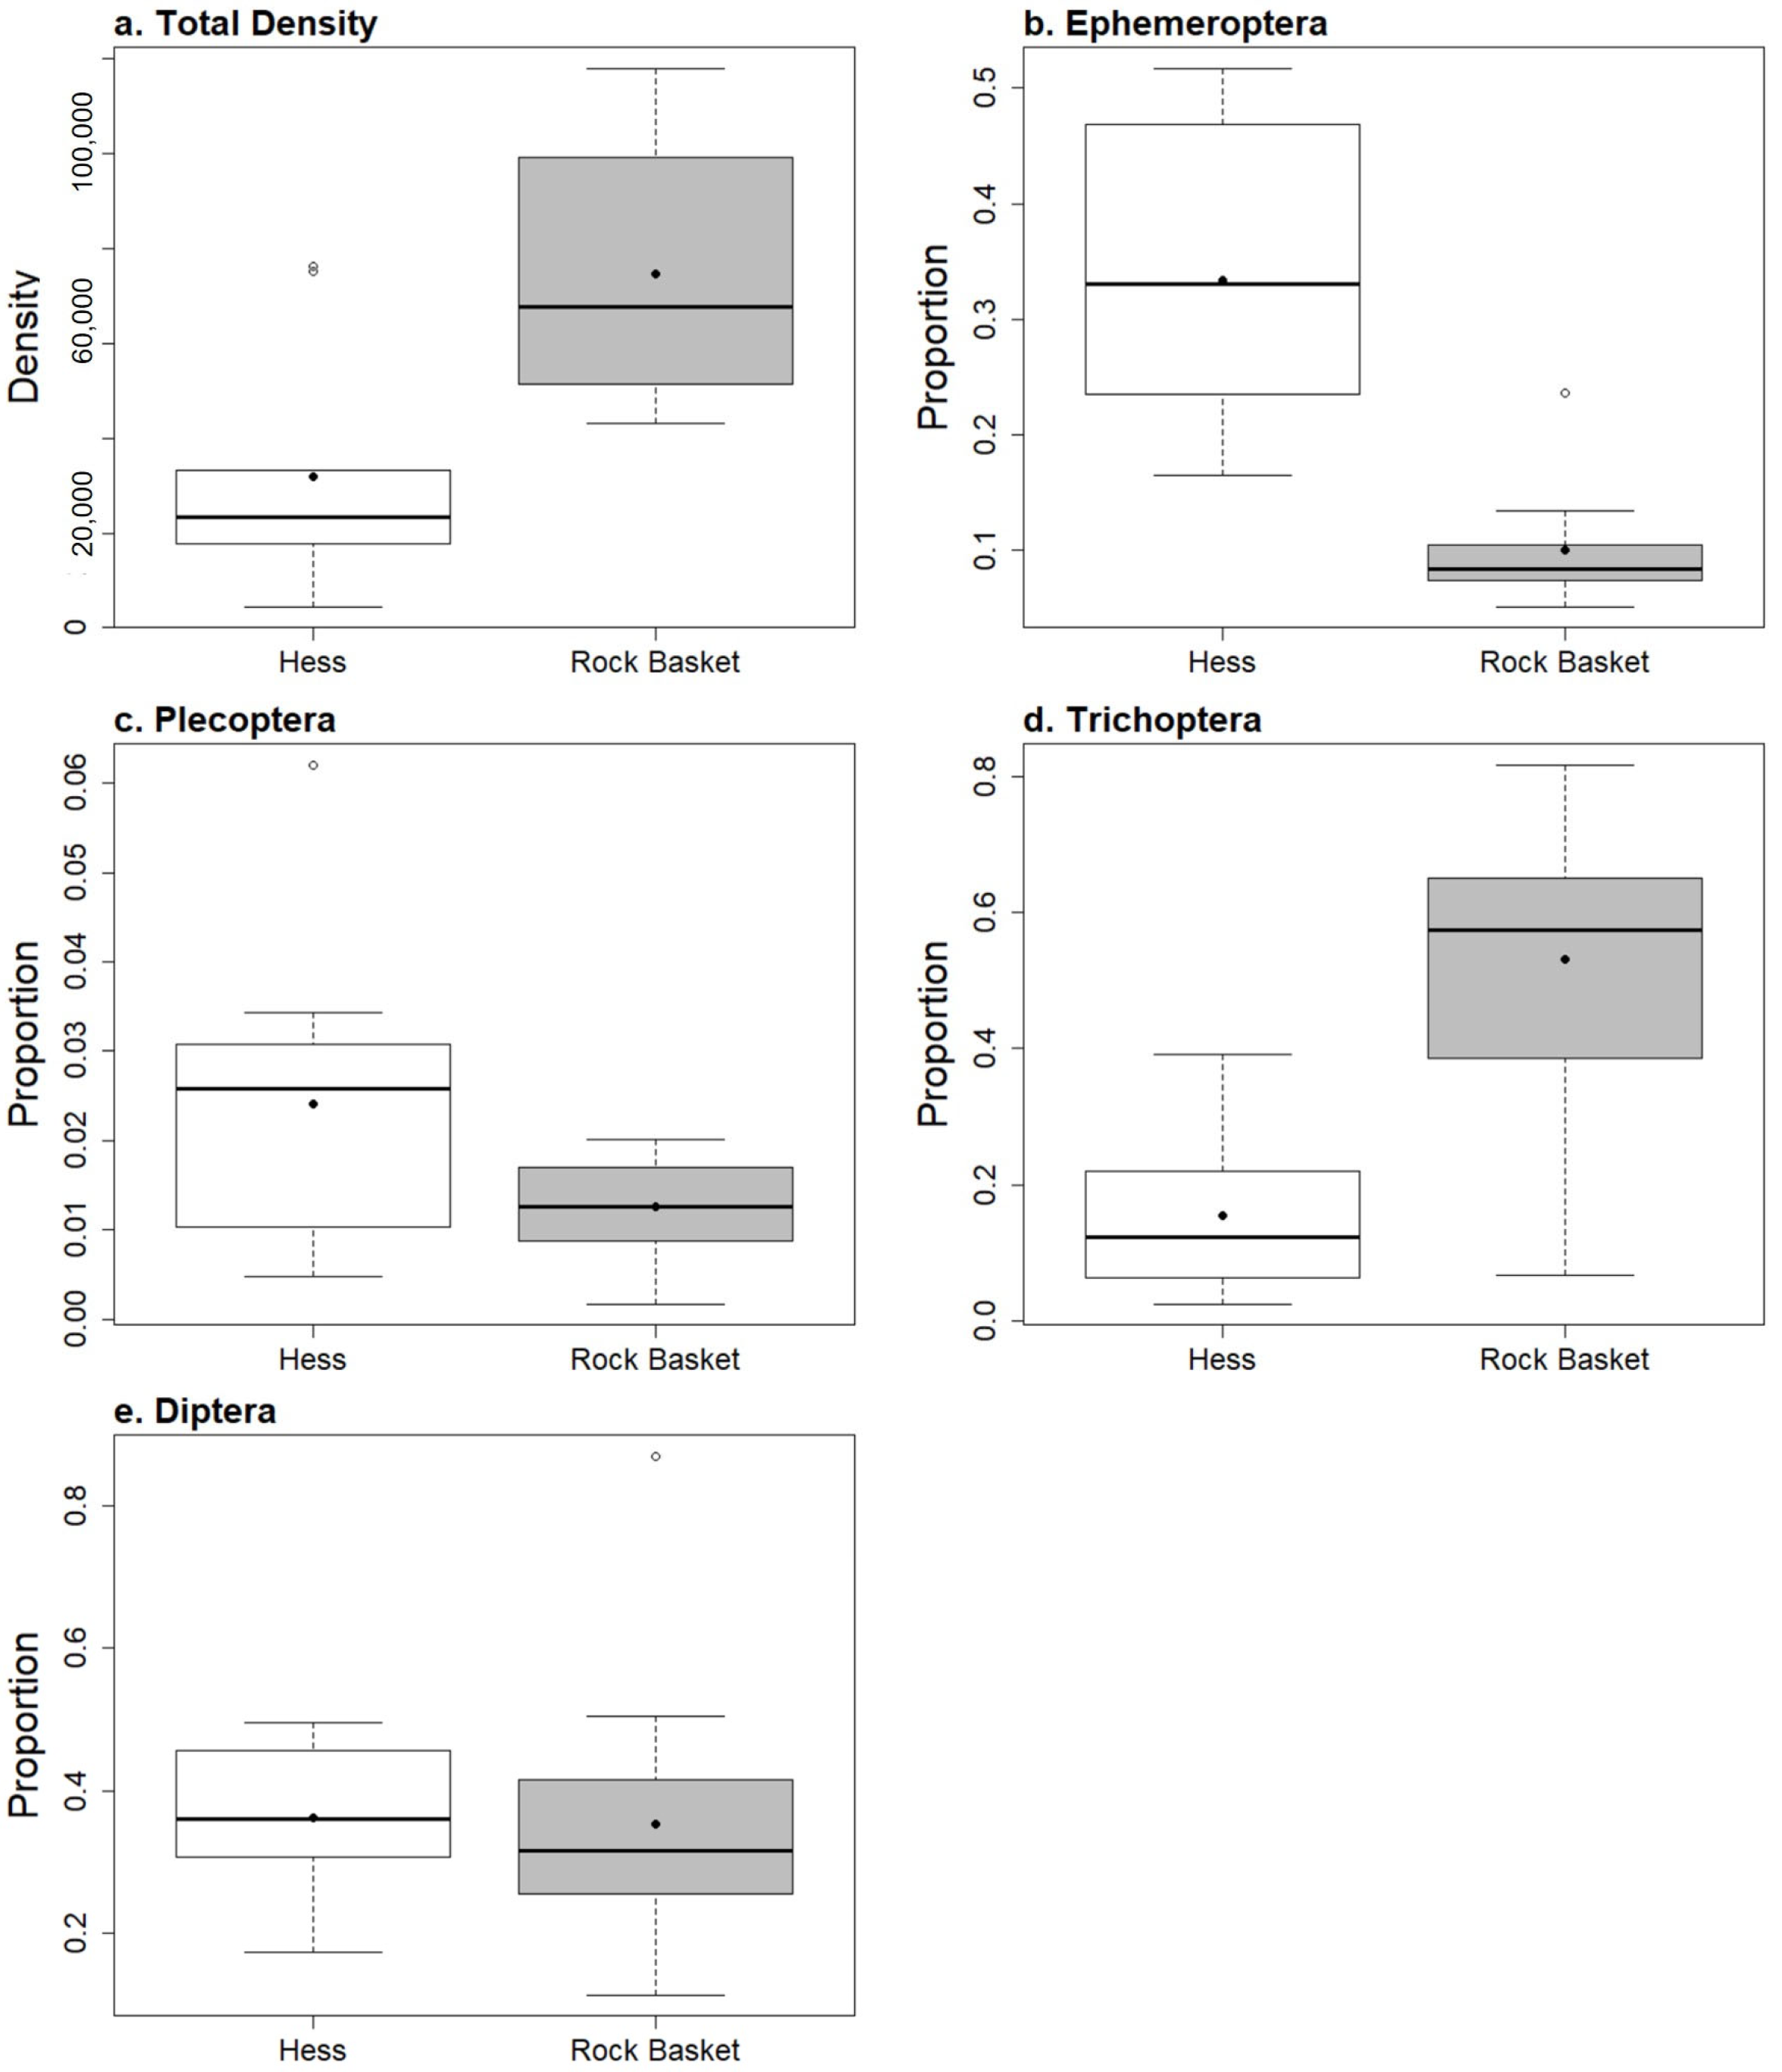
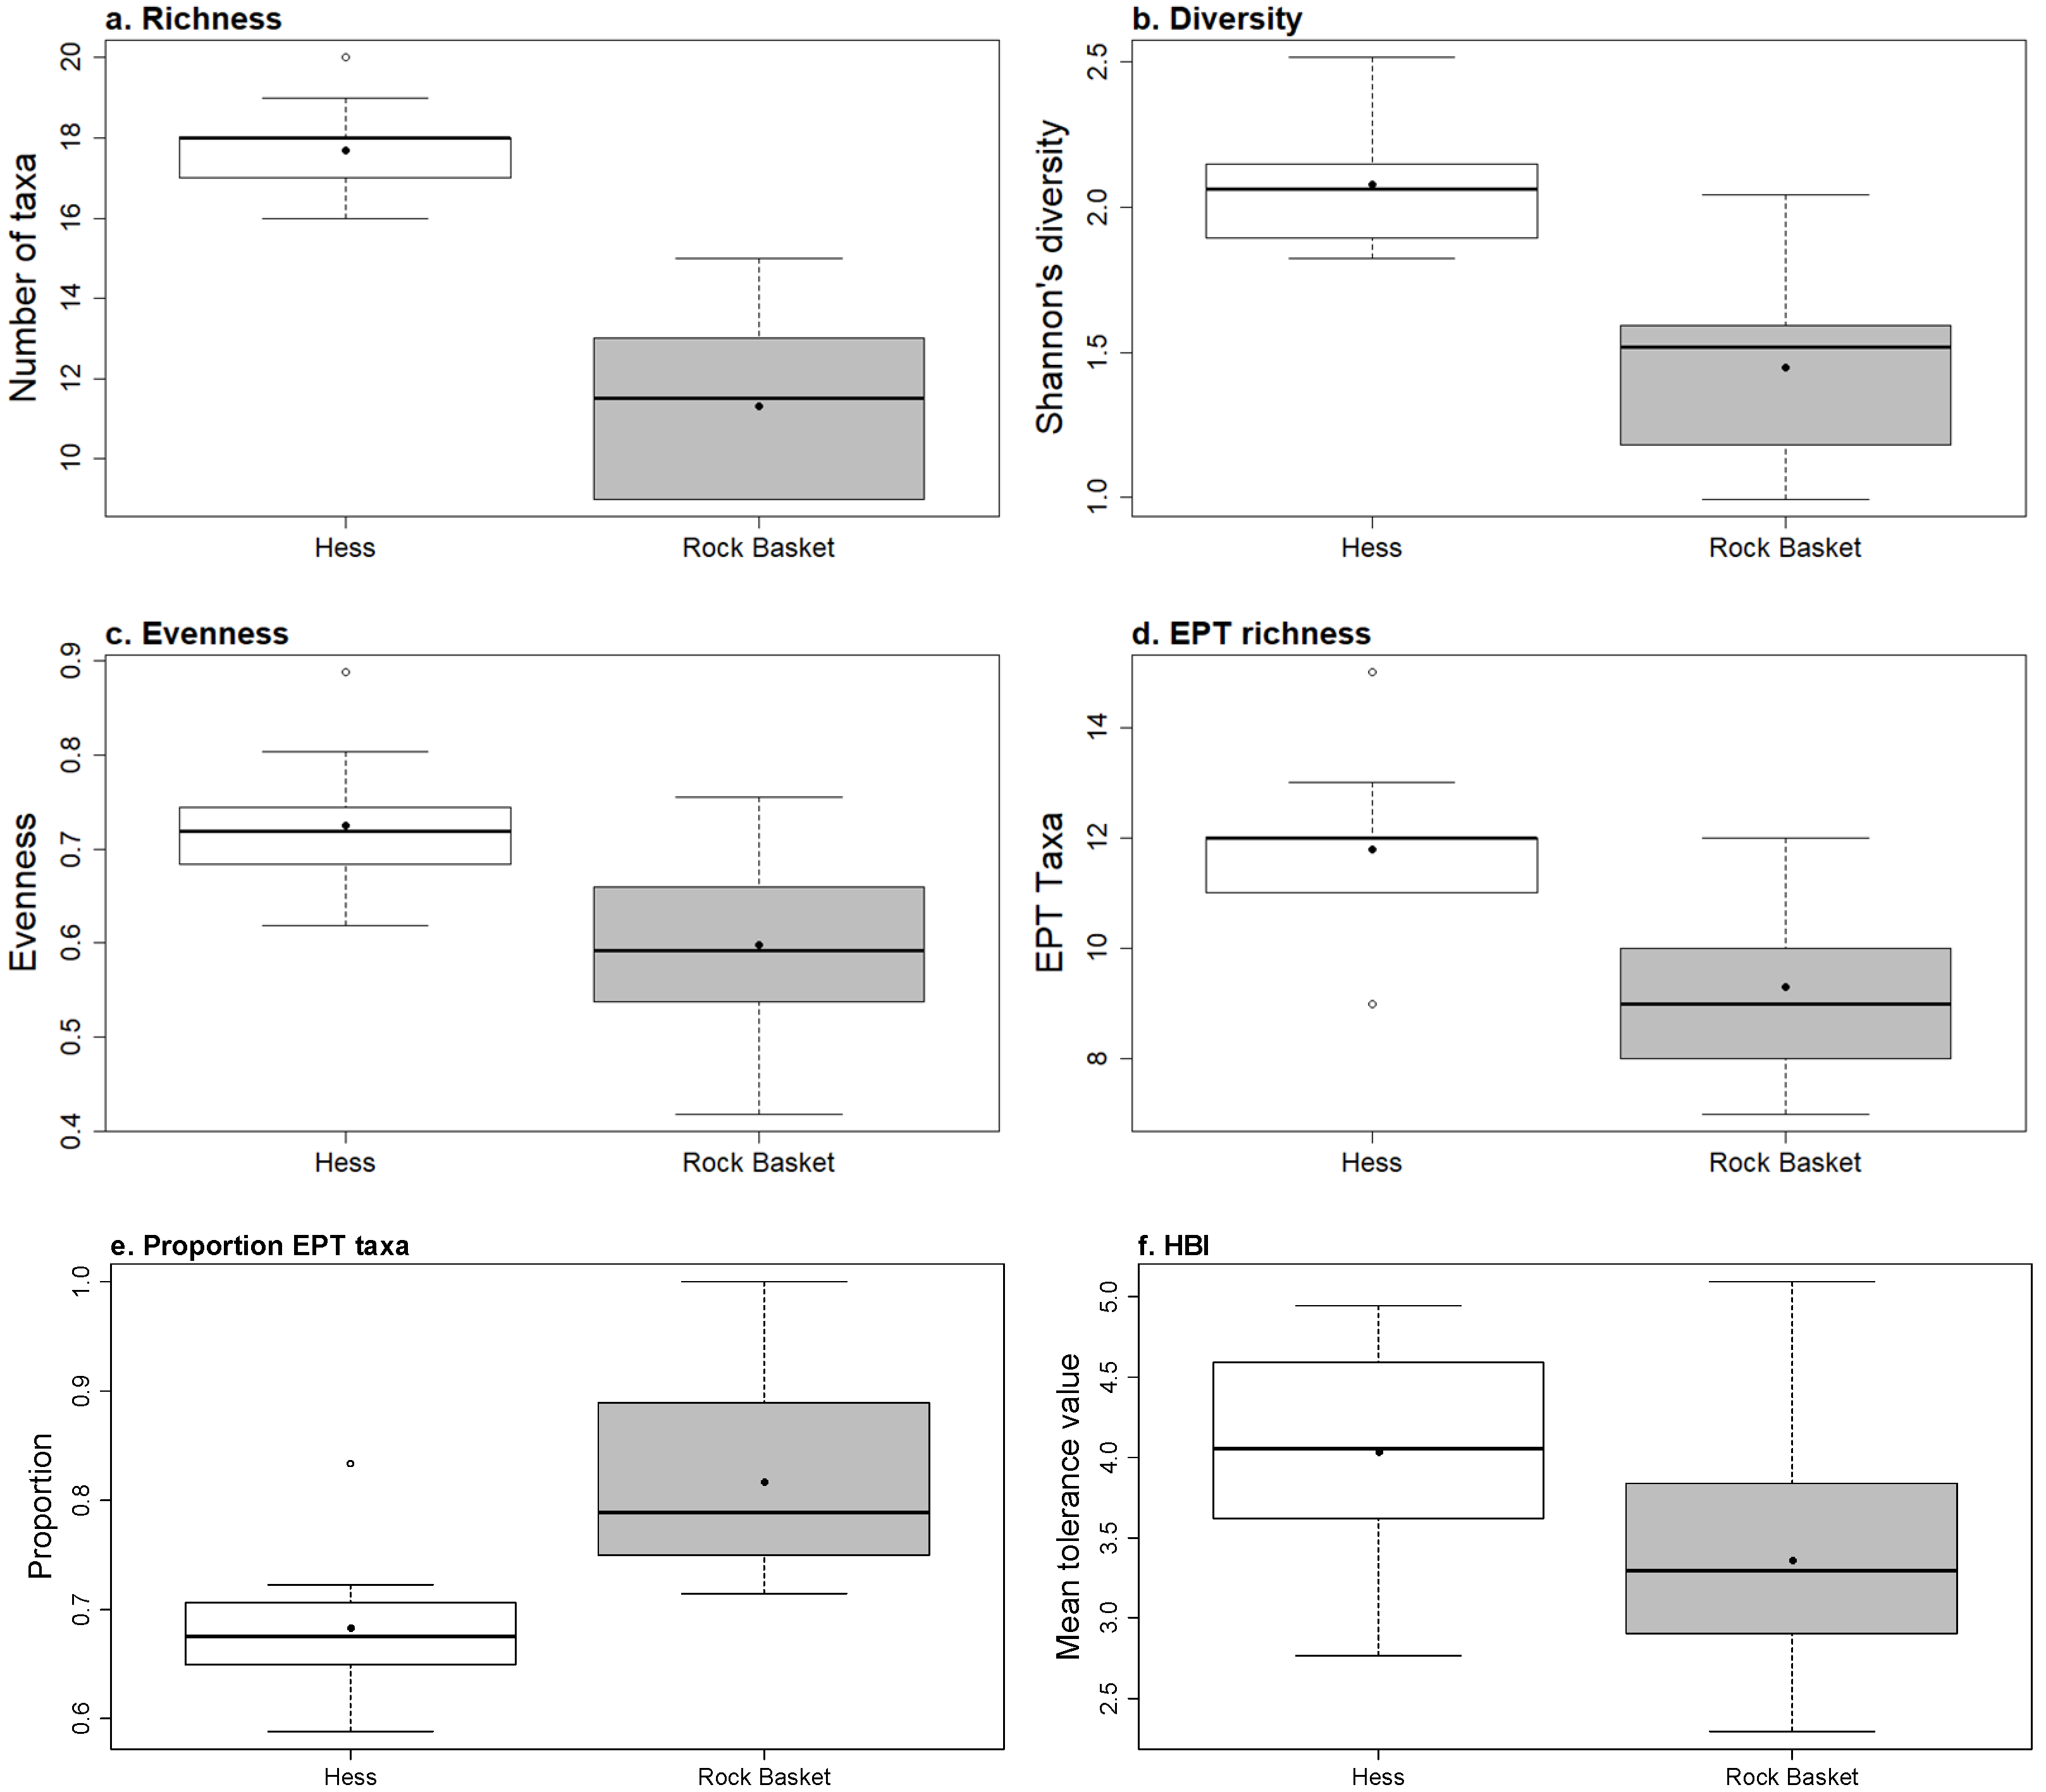
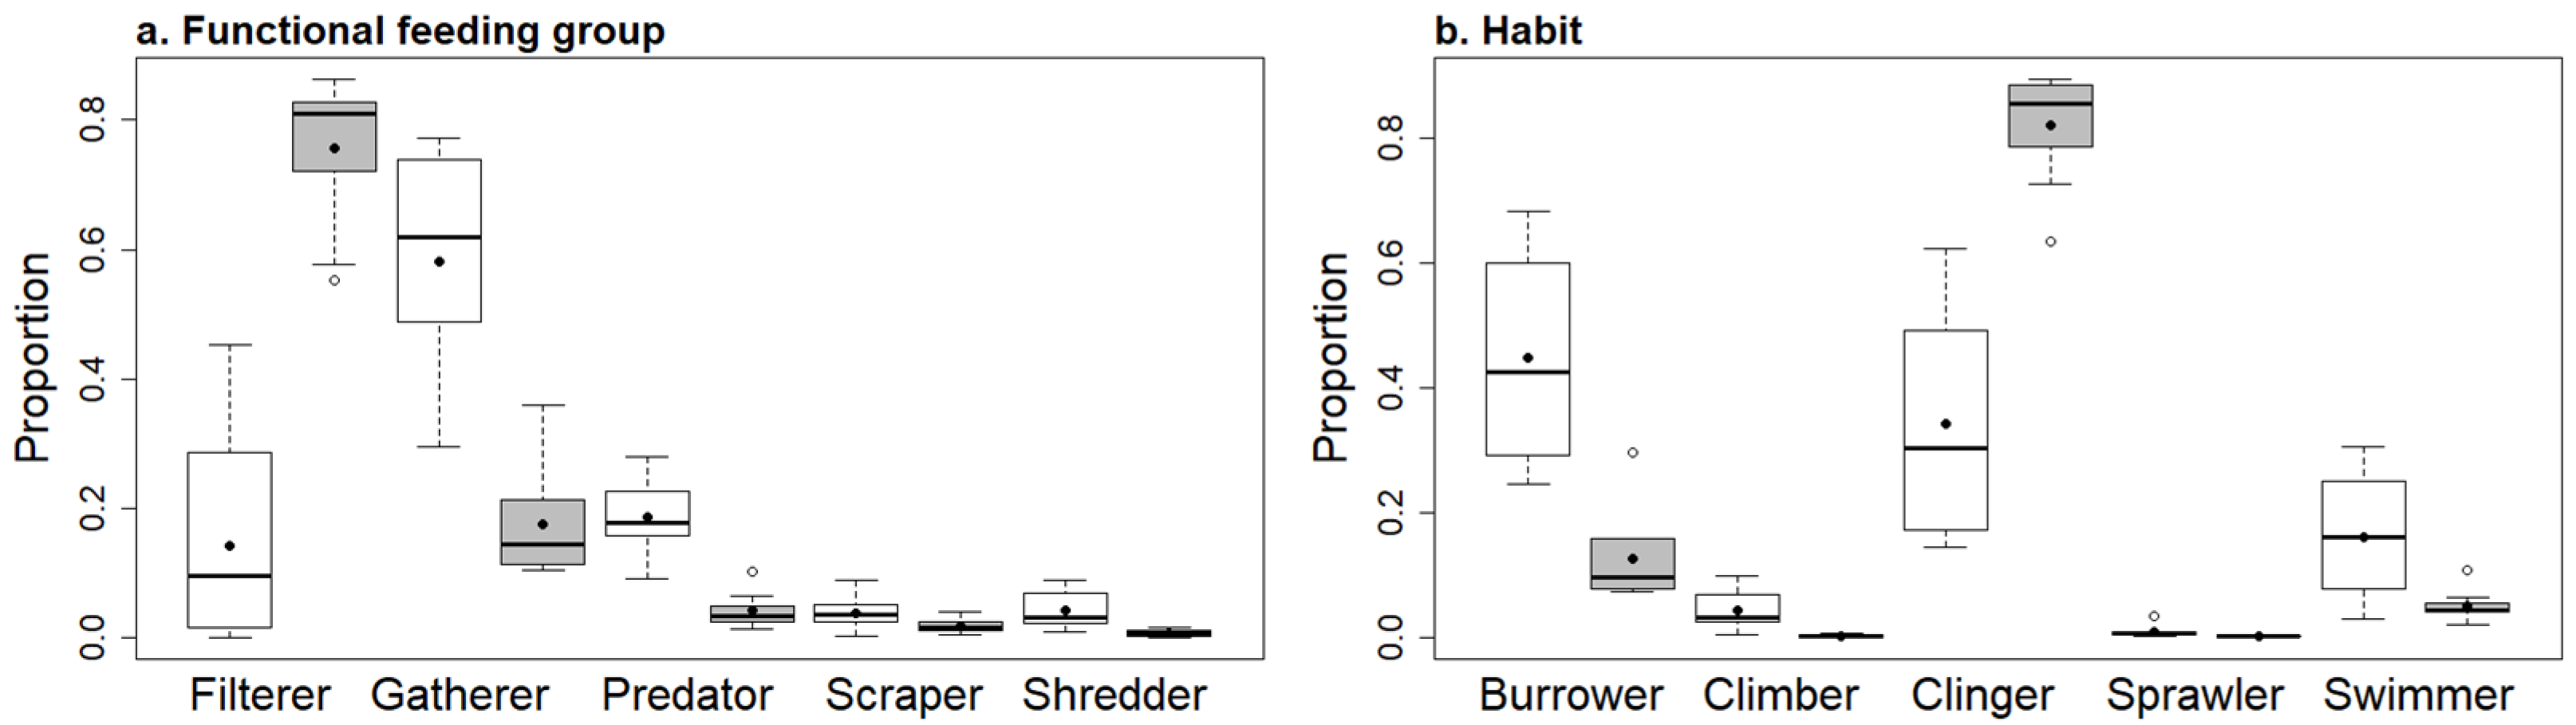
3.4. Comparing Samplers

Rock baskets collected more invertebrates (Figure 3a); however, the assemblage was dominated by a few taxa that benefitted from the structure. Rock baskets collected 2.4 times more invertebrates compared to Hess samples (t = 3.2, p = 0.005) and 34 taxa combined (t = 7.6, p < 0.0001; Table A1). We collected 14 taxa in Hess samples that were not in rock baskets and three taxa that were unique to rock baskets (Table A1). Nearly all the invertebrates collected in rock baskets were insects (99.9%) compared to 88% of individuals in Hess samples (t = 3.5, p = 0.002). The proportion of Ephemeroptera (t = 5.8, p < 0.0001; Figure 3b) and Plecoptera (t = 2.5, p = 0.02; Figure 3c) were higher in Hess samples compared to rock baskets. Conversely, Trichoptera comprised a higher proportion of individuals in rock baskets (t = 4.5, p < 0.0001; Figure 3c). The proportion of Diptera did not differ between samples (t = 0.1, p = 0.91; Figure 3e). We collected 1.6 times more taxa in Hess samples compared to rock baskets (t = 7.3, p < 0.0001; Figure 4a). Shannon’s diversity index was 43% higher (t = 5.2, p < 0.0001; Figure 4b), and evenness was 20% higher in Hess samples than in rock baskets (t = 3.0, p = 0.008; Figure 4c). We collected 1.3 times more EPT taxa in Hess samples (t = 3.6, p = 0.002; Figure 4d), but the proportion of EPT taxa in rock baskets was 16% higher than Hess samples (t = 4.8, p = 0.0001; Figure 4e). The mean tolerance value of taxa was 18% higher in Hess samples than in rock baskets (t = 2.0, p = 0.06; Figure 4e), but both HBI scores indicated a healthy ecosystem.
The proportion of FFGs and invertebrate habits differed between samplers. We calculated a higher proportion of filterers in rock baskets (t = 2.5–3.6, p = 0.0001–0.01; emmeans, p = 0.016; Figure 5a), but the proportion of gatherers (emmeans, p = 1.0), scrapers (emmeans, p = 1.0), shredders (emmeans, p = 0.89) and predators (emmeans, p = 1.0) did not differ between samplers. The proportion of invertebrate habits differed between samplers (t = 0.3–5.6, p < 0.0001–0.77; Figure 5b). We calculated a higher proportion of burrowers in Hess samples (emmeans, p = 0.0005). The proportion of climbers (emmeans, p < 0.0001), clingers (emmeans, p = 0.057), sprawlers (emmeans, p = 0.0.0007), and swimmers (emmeans, p = 0.002) did not differ between samplers. The assemblages collected by Hess samplers and rock baskets differed according to NMDS analysis (Figure 6a). The polygons did not overlap, suggesting that the proportion and taxa collected differed. Analysis of similarity supported this result (R = 0.681, p = 0.001; Figure 6b).

3.5. Variance and Species Accumulation with Sample Size

Variance decreased and the percent of taxa collected increased when more samples were collected. The standard error of total invertebrate density was higher in rock baskets than in Hess samples (t = 2.7, p = 0.01), and the standard error decreased as the number of samples increased (t = −4.5, p < 0.001; Figure 7a,b). The standard error was consistently smaller when at least seven samples were used in calculations. Species accumulation curves showed that Hess samples (Figure 7c) accumulated more taxa than rock baskets (Figure 7d). The models suggested that seven Hess samples collected 97% of taxa and seven rock baskets collected 95% of taxa within the reach we sampled.

4. Discussion

Hess samplers and rock baskets collected different invertebrate assemblages, which influenced the calculated bioassessment metrics. Despite differences in invertebrate densities and the proportion of groups between samplers, about the same number of samples were needed to reduce variance. We are aware of two studies that compared Hess samplers and rock baskets previously. Sanders [33] compared nine samplers in the lower Mississippi River and concluded that Hess samples and rock baskets were both viable sampling methods that were practical to collect. Rabeni and Gibbs [34] compared a modified Hess sampler to rock baskets collected by divers in a deep river and concluded that rock baskets collected higher densities and more taxa. In general, quantitative samplers collected 0.8 to 3 times more taxa than other artificial substrate samplers in wadeable streams [20,21,22,35,36]. In our study, rock baskets collected 2.4 times more individuals than Hess samples, but Hess samples collected 1.6 times more taxa than rock baskets. Rabeni and Gibbs (1978) concluded that these methods collected a comparable proportion of invertebrate groups and both methods were viable in deep rivers; however, samples from the Snake River did not have comparable proportions of insect orders between Hess samplers and rock baskets with the exception of Diptera. Additionally, rock baskets only collected insects while Hess samples also collected non-insect invertebrates. The proportion of insects differed between Hess and artificial substrate (i.e., Hester-Dendy plates) in the Niobrara River, Nebraska, suggesting that invertebrates collected with artificial substrate can differ from natural assemblages. What type of sampler to use depends on the questions asked and the objectives of the study. Two complimentary types of sampling can be performed, but using dual methods greatly increases costs.
Several methods are used to collect aquatic invertebrates in large rivers that are categorized as passive (e.g., rock baskets and Hester-Dendy multiplate samplers) and active methods (e.g., Ponar, Hess samples, kick nets, snag sampling) [11]. Each method has advantages and disadvantages. For example, passive methods allow sampling in difficult areas and can be deployed quickly; however, results are not comparable to other methods, they collect a bias invertebrate assemblage and require more trips to the location [11,21]. Conversely, active methods require one trip to the location, result in natural densities and assemblages of invertebrates, can quantitatively sample natural substrate, but these methods can be difficult to use with some substrate types, some methods require specialized equipment (e.g., a boat) and they can be difficult to use in rivers with high flow [11]. We chose to compare Hess samples and rock baskets due to the practicality of the method in the Snake River. Dipnet and kicknet samples would be difficult to use because of the strong currents in the Snake River and our previous work showed that dipnet samples collected a subset of the invertebrate community [22]. We did not have access to a boat and Ponar samples do not work on cobble substrate [11]. We chose rock baskets instead of Hester-Dendy plates because Hester-Dendy plates would have been difficult to deploy and maintain in the Snake River. Additionally, our previous work [21,22] and others [20,37] showed that artificial substrate can cause bias on collection, causing bioassessment metrics to indicate better ecosystem quality compared to sampling on natural substrate. Rock baskets are recommended as a viable sampling protocol in large rivers [33,34] and may provide a feasible artificial substrate sampler [11]. We chose Hess samplers because they sample natural substrate but are limited by river depth; however, shallower areas in large rivers have been shown to have more species and bioassessment metrics responded more strongly compared to those calculated from invertebrates collected in deeper areas [16].
Sample size, variance and replicate samples should be considered with any study or monitoring program. Our analysis suggested variance stabilized at about seven replicate samples for both Hess samples and rock baskets. Additionally, most taxa were collected within a river reach when seven samples were collected in our study. Many bioassessment studies composite replicate samples; however, we strongly discourage compositing, because compositing samples can inflate bioassessment metrics [22]. Most bioassessment protocols composite samples and only identify 300 to 500 individuals [13,38]. They assume that composite samples are homogenous; however, this assumption may not be accurate. Taxa richness likely suffers from compositing. Instead, we suggest that replicate samples be kept separate in the field and subsampling be used on the small fractions (<2 mm sieve). For example, we identified between 80 and 1035 individuals in each Hess sample and 500 and 1371 individuals in rock basket samples which resulted in more taxa identified in our samples compared to only 500 individuals identified when all samples are composited. Further subsampling can reduce the number of taxa identified per replicate; however, we wanted to account for as much taxa richness as possible. Hess samples were smaller than rock baskets, allowing us to conduct less subsampling, but rock baskets were large and dominated by a few taxa, making subsampling more practical. Compositing samples and identifying a minimal number of taxa is cheaper; however, the quality of the data suffers and can alter conclusions.
Bioassessment metrics differed between Hess samples and rock baskets. Hess samples had a high proportion of Ephemeroptera and Plecoptera, but rock baskets had a higher proportion of Trichoptera (Appendix A). This resulted in Hess samples having a higher number of EPT taxa, but rock baskets contained a higher percentage of EPT taxa. Richness, diversity, and evenness were higher in Hess samples because this method collected an assemblage with a variety of taxa that were less dominated by a few taxa. Conversely, rock baskets were mainly dominated by Brachycentrus, Simulium, and Hydropysche, resulting in a lower evenness value. Hilsenhoff’s biotic index was higher for Hess samples compared to rock baskets, but overall, the values were low. The mean HBI value for Hess samples suggested the ecosystem quality of the Snake River along this reach was very good and ranged between excellent and good [27]. The HBI scores for rock baskets were excellent on average but ranged between excellent and good. Rock baskets indicated that ecosystem quality along this reach of the Snake River was slightly better than Hess samples on average, but the range of values highly overlapped.
Both Hess samplers and rock baskets can be used to sample aquatic invertebrates in large rivers, and the advantages and disadvantages should be considered depending on the characteristics of the river and the goals of the study or monitoring [11]. Hess samples have the advantage of collecting invertebrates on natural substrates, which produces unaltered densities of aquatic invertebrates. All the invertebrates are removed from a known area making the samples quantitative and repeatable. Hess samples can be rapidly collected with minimal gear and they only require one trip [11]. One disadvantage of a Hess sampler is that they must be collected in shallower water. Aquatic invertebrates were two times denser in shallower riffles compared to deeper pools [21,39], individuals in riffles were more responsive to biomonitoring [16], and stream velocity explained minimal differences compared to other stream characteristics [39]. Additionally, Hess samples can only sample substrate that fits within it; however, other studies have used modified samplers to collect in deeper water [34] or samplers that collect invertebrates in a larger area [40]. On the other hand, rock baskets have the advantage of collecting abundant invertebrates in many conditions. Managers or researchers can place a basket full of rocks in a river with cobble or gravel substrate and return a month later to collect a sample. The disadvantages of passive samplers are that they can provide unique habitats producing samples that do not reflect the invertebrate densities or assemblages found on natural substrates and they were dominated by a few taxa [11,20,21]. In our study, rock baskets provided an excellent habitat for filterers, which is why we collected such a high proportion of these insects. Filterers were abundant on branches submerged along the riverbank, which was composed of a very small natural microhabitat. Our rock baskets were 25 cm tall, which provided a new habitat for filtering invertebrates to colonize, and the values we reported were from individuals on the cobble and not the rock baskets themselves. The height of the rock baskets gave filterers access to fast-moving water, and we suggest using shorter baskets in future studies. Rock baskets also do not function well in rivers dominated by fine substrate because they become buried. Rock baskets require two trips to the site: one to deploy them and a second to collect them. Depending on how far the field site is, two trips can add substantial cost. We suggest having two people for field work when Hess samples are collected and three people for retrieving rock baskets (two people to lift rock baskets and one person to hold the kicknet) which adds to costs. Collecting Hess samples in the current or hauling rock baskets to shore requires extra hands beyond what is needed in wadeable streams.

5. Conclusions

Large river are some of the most altered ecosystems on Earth due to draining floodplains, damming rivers for power production, channelizing them for navigation, reclaiming land, disposing of waste and a source of water, yet we lack critical knowledge about them due to sampling constraints from their sheer size and lack of a paradigm on their ecology. Assuming that large rivers function like smaller streams leads to incorrect assumptions and stresses the need for studying these ecosystems so that informed management decisions can be made. Monitoring our large rivers is critical to assess their ecosystem quality and identify reaches that would benefit from management actions. Assessing which methods collect the least bias invertebrate samples in large rivers is critical to produce accurate bioassessment metrics and reliable results to base decisions upon. We suggest using Hess samples in large rivers with gravel or cobble substrate if conditions allow. Hess samples collected invertebrates at their natural densities and proportions, required only one trip to the field site, and the samples were more economical to process. Rock baskets required two trips to the field site and collected an assemblage dominated by a few taxa that thrived in the rock basket conditions creating altered densities and proportions in comparison. The number of invertebrates in rock baskets made processing samples slower and more costly. Rock baskets may be better under some conditions and we suggest using a design that is shorter (e.g., 25 cm wide, 25 cm deep and 12 cm tall). The square shape worked well compared to round designs because they were less likely to roll. We suggest adding rope handles to aid retrieval. We recommend retaining replicate samples because they are easier to process in the laboratory, less costly to sample, they can be easily subsampled and more taxa can be identified compared to composite samples. Studies that address methods are critical to perform prior to developing a monitoring protocol to gain efficiency and produce data to develop a paradigm for large rivers.

Author Contributions

Conceptualization, L.M.T.; methodology, L.M.T. and B.P.T.; identification, B.P.T.; formal analysis, L.M.T.; writing—original draft preparation, L.M.T.; writing—review and editing, L.M.T. and B.P.T.; visualization, L.M.T.; project administration, L.M.T.; funding acquisition, L.M.T. All authors have read and agreed to the published version of the manuscript.

Funding

The Teton Conservation District, Jackson, Wyoming, USA funded the study.

Institutional Review Board Statement

Not applicable.

Data Availability Statement

Data are available with permission from the authors.

Acknowledgments

We appreciate the assistance of Amy Marie Storey, Tresize Tronstad, David Lee and Carlin Girard with fieldwork, and a private landowner for allowing us to work on their property. Two anonymous reviewers and the academic editor improved the manuscript.

Conflicts of Interest

The authors declare no conflicts of interest.

Appendix A

Table A1. The mean density and standard error of invertebrates collected from ten Hess samples and ten rock baskets in the Snake River, Wyoming. An * indicates taxa only collected in Hess samples and ‡ highlights taxa only collected in rock baskets.
TaxaHessRock Basket
Arthropoda
Arachnida
Acari *548 ± 226
Insecta
Coleoptera
Dytiscidae
Stictotarsus *30 ± 8
Elmidae372 ± 42
Ampumixis 86 ± 86
Diptera
Athericidae
Atherix161 ± 50114 ± 15
Ceratopogonidae
Probezzia *108 ± 22
Chironomidae (pupae)329 ± 69272 ± 40
Non-Tanypodinae8462 ± 13588054 ± 757
Tanypodinae51 ± 1286 ± 0
Empididae23 ± 23
Hemerodromia *93 ± 93
Metachela *113 ±33
Neoplasta 86 ± 86
Limoniidae
Hexatoma *146 ± 29
Simuliidae (pupae)51 ± 13886 ± 363
Simulium1499 ± 50418,262 ± 7643
Ephemeroptera
Baetidae
Baetis4353 ± 15123367 ± 359
Ephemerellidae
Drunella5181 ± 19382223 ± 417
Heptageniidae
Cinygmula1014 ± 4081281 ± 227
Epeorus *332 ± 90
Rhithrogena *579 ± 185
Leptophlebiidae 120 ± 15
Neoleptophlebia *630 ± 154
Paraleptophlebia35 ± 3586 ± 0
Hemiptera ‡ 86 ± 86
Plecoptera204 ± 75
Chloroperlidae
Plumiperla *235 ± 55
Perlidae
Claassenia42 ± 7535 ± 79
Perlodidae *336 ± 153
Pteronarcyidae
Pteronarella247 ± 126459 ± 93
Trichoptera93 ± 0
Brachycentridae
Brachycentrus3511 ± 180934,262 ± 7186
Glossosomatidae
Glossosoma *12 ± 12
Hydropsychidae
Arctopsyche103 ± 28314 ± 66
Hydropsyche760 ± 1854429 ± 613
Lepidostomatidae
Lepidostoma1358 ± 483201 ± 16
Leptoceridae
Oecetis139 ± 1995 ± 15
Annelida
Oligochaeta3136 ± 122286 ± 86
Nematoda *179 ± 55
Crustacea
Ostracoda *93 ± 93
Molluska
Gastropoda
Physa gyrina 16 ± 2

References

  1. Petts, G.; Moller, H.; Roux, A. Historical Change in Large Alluvial Rivers: Western Europe; Wiley: Chichester, UK, 1993. [Google Scholar]
  2. Leitner, P.; Borgwardt, F.; Birk, S.; Graf, W. Multiple stressor effects on benthic macroinvertebrates in very large European rivers—A typology-based evaluation of faunal responses as a basis for future bioassessment. Sci. Total Environ. 2021, 756, 143472. [Google Scholar] [CrossRef] [PubMed]
  3. Best, J. Anthropogenic stresses on the world’s big rivers. Nat. Geosci. 2018, 12, 7–21. [Google Scholar] [CrossRef]
  4. Johnson, B.L.; Richardson, W.B.; Naimo, T.J. Past, present, and future concepts in large river ecology. BioScience 1995, 45, 134–141. [Google Scholar] [CrossRef]
  5. Czuba, J.A.; Allen, G.H. When does a stream become a river? River Res. Appl. 2023, 39, 1925–1929. [Google Scholar] [CrossRef]
  6. Hynes, H.B.N. Keynote address. In Proceedings of the International Large River Symposium, Honey Harbour, ON, Canada, 14–21 September 1986; pp. 5–10. [Google Scholar]
  7. Dodds, W. Nutrients and the “dead zone”: The link between nutrient ratios and dissolved oxygen in the northern Gulf of Mexico. Front. Ecol. Environ. 2006, 4, 211–217. [Google Scholar] [CrossRef]
  8. Rabalais, N.; Turner, R.; Wiseman, W. Gulf of Mexico hypoxia, aka “the dead zone”. Annu. Rev. Ecol. Syst. 2002, 33, 235–263. [Google Scholar] [CrossRef]
  9. Tank, J.L.; Rosi-Marshall, E.J.; Baker, M.A.; Hall, R.O., Jr. Are rivers just big streams? A pulse method to quantify nitrogen demand in a large river. Ecology 2008, 89, 2935–2945. [Google Scholar] [CrossRef] [PubMed]
  10. Rosenberg, D.M.; Resh, V.H. (Eds.) Freshwater Biomonitoring and Benthic Macroinvertebrates; Chapman and Hall: New York, NY, USA, 1993; 512p. [Google Scholar]
  11. Flotemersch, J.; Stribling, J.B.; Paul, M. Concepts and Approaches for the Bioassessment of Non-Wadeable Streams and Rivers; US Environmental Protection Agency: Cincinnati, OH, USA, 2006. [Google Scholar]
  12. Neto, J.M.; Feio, M.J.; Teixeira, H.; Patricio, J.; Serra, S.R.Q.; Franco, J.N.; Calapez, A.R.; Constantino, E. Transitional and freshwater bioassessments: One site, two perspectives? Mar. Pollut. Bull. 2014, 78, 153–164. [Google Scholar] [CrossRef]
  13. Hughes, R.M.; Herlihy, A.T.; Gerth, W.J.; Pan, Y. Estimating vertebrate, benthic macroinvertebrate, and diatom taxa richness in raftable Pacific Northwest rivers for bioassessment purposes. Environ. Monit. Assess. 2012, 184, 3185–3198. [Google Scholar] [CrossRef]
  14. Bartsch, L.A.; Richardson, W.B.; Naimo, T.J. Sampling benthic macroinvertebrates in a large flood-plain river: Considerations of study design, sample size, and cost. Environ. Monit. Assess. 1998, 52, 425–439. [Google Scholar] [CrossRef]
  15. Weigel, B.M.; Dimick, J.J. Development, validation, and application of a macroinvertebrate-based Index of Biotic Integrity for nonwadeable rivers of Wisconsin. J. N. Am. Benthol. Soc. 2011, 30, 665–679. [Google Scholar] [CrossRef]
  16. Szekeres, J.; Borza, P.; Csnyi, B.; Graf, W.; Huber, T.; Leitner, P.; Milosevic, D.; Paunovic, M.; Pavelescu, C.; Eros, T. Comparison of littoral and deep water sampling methods for assessing macroinvertebrate assemblages along the longitudinal profile of a very large river (the Danube River, Europe). River Res. Appl. 2019, 35, 989–998. [Google Scholar] [CrossRef]
  17. Blocksom, K.A.; Flotemersch, J.E. Comparison of macroinvertebrate sampling methods for nonwadeable streams. Environ. Monit. Assess. 2005, 102, 243–262. [Google Scholar] [CrossRef]
  18. Roby, K.B.; Newbold, J.D.; Erman, D.C. Effectiveness of an artificial substrate for sampling macroinvertebrates in small streams. Freshw. Biol. 1978, 8, 1–8. [Google Scholar] [CrossRef]
  19. Czerniawska-Kusza, I. Use of Artificial Substrates for Sampling Benthic Macroinvertebrates in the Assessment of Water Quality of Large Lowland Rivers. Pol. J. Environ. Stud. 2004, 13, 579–584. [Google Scholar]
  20. Letovsky, E.; Myers, I.E.; Canepa, A.; McCabe, D.J. Differences between kick sampling techniques and short-term Hester-Dendy sampling for stream macroinvertebrates. Bios 2012, 83, 47–55. [Google Scholar] [CrossRef]
  21. Tronstad, L.M.; Hotaling, S. Long-term trends in aquatic ecosystem bioassessment metrics are not influenced by sampling method: Empirical evidence from the Niobrara River. Knowl. Manag. Aquat. Ecosyst. 2017, 418, 28. [Google Scholar] [CrossRef]
  22. Tronstad, L.M.; Wilmot, O.; Thornbrugh, D.; Hotaling, S. To composite or replicate: How sampling method and protocol differences alter collected stream invertebrates and associated bioassessment metrics. Environ. Monit. Assess. 2020, 192, 531. [Google Scholar] [CrossRef] [PubMed]
  23. Stanford, J.A.; Thompson, A.; Asher, E.; Gregory, S.V.; Reeves, G.; Ratliff, D.; Bouwes, N.; Frissell, C.; Williams, R.N. Columbia River Basin. In Rivers of North America; Elsevier: Amsterdam, The Netherlands, 2023; pp. 558–615. [Google Scholar]
  24. Merritt, R.W.; Cummins, K.W.; Berg, M.B. An Introduction to the Aquatic Insect of North America; Kendall/Hunt Publishing Company: Dubuque, IA, USA, 2019; 1498p. [Google Scholar]
  25. Thorp, J.H.; Covich, A.P. (Eds.) Ecology and Classification of North American Freshwater Invertebrates, 3rd ed.; Elsevier: New York, NY, USA, 2010; 1021p. [Google Scholar]
  26. Barbour, M.T.; Gerritsen, J.; Snyder, B.D.; Stribling, J.B. Rapid Bioassessment Protocols for Use in Streams and Wadeable Rivers: Periphyton, Benthic Macroinvertebrates and Fish; EPA 841-B-99-002; U.S. Environmental Protection Agency: Washington, DC, USA, 1999. [Google Scholar]
  27. Hilsenhoff, W.L. An improved biotic index of organic stream pollution. Great Lakes Entomologist 1987, 20, 31–39. [Google Scholar] [CrossRef]
  28. Delignette-Muller, M.; Dutang, C. fitdistrplus: An R package for fitting distributions. J. Stat. Softw. 2015, 64, 1–34. [Google Scholar] [CrossRef]
  29. Lenth, R. emmeans: Estimated Mearginal Means, aka Least-Squares Means. Comprehensive R Archive Network. 2021. Available online: https://cran.r-project.org/web/packages/emmeans/emmeans.pdf (accessed on 15 July 2023).
  30. Oksanen, J.; Blanchet, F.G.; Kindt, R.; Legendre, P.; Minchin, P.R.; O’Hara, R.B.; Simpson, G.L.; Solymos, P.; Henry, M.; Stevens, H.; et al. vegan: Community Ecology Package. 2013. Available online: https://cran.r-project.org/web/packages/vegan/vegan.pdf (accessed on 15 July 2023).
  31. DeBruine, L. faux: Simulation for Factorial Designs. R Package Version 1.2.1. Zenodo. 2023. Available online: https://debruine.github.io/faux/ (accessed on 15 July 2023).
  32. Wickham, H. The Split-Apply_Combine Strategy for Data Analysis. J. Stat. Softw. 2011, 40, 1–29. [Google Scholar] [CrossRef]
  33. Sanders, L.; Bingham, C.; Beckett, D. Macroinvertebrate Gear Evaluation; US Army Engineer Waterways Experiment Station: Vicksburg, MS, USA, 1986. [Google Scholar]
  34. Rabeni, C.F.; Gibbs, K. Comparison of two methods used by divers for sampling benthic invertebrates in deep rivers. J. Fish. Res. Board Can. 1978, 35, 332–336. [Google Scholar] [CrossRef]
  35. McCabe, D.J.; Hayes-Pontius, E.M.; Canepa, A.; Berry, K.S.; Levine, B.C. Measuring standardized effect size improves interpretation of biomonitoring studies and facilitates meta-analysis. Freshw. Sci. 2012, 31, 800–812. [Google Scholar] [CrossRef]
  36. Turner, A.M.; Trexler, J.C. Sampling aquatic invertebrates from marshes: Evaluating the options. J. N. Am. Benthol. Soc. 1997, 16, 694–709. [Google Scholar] [CrossRef]
  37. Canton, S.P.; Chadwick, J.W. Aquatic Insect Communities of Natural and Artificial Substrates in a Montane Stream. J. Freshw. Ecol. 1983, 2, 153–158. [Google Scholar] [CrossRef]
  38. Flotemersch, J.E.; Blocksom, K.; Hutchens, J.J.; Autrey, B.C. Development of a standardized Large River Bioassessment Protocol (LR-BP) for macroinvertebrate assemblages. River Res. Appl. 2006, 22, 775–790. [Google Scholar] [CrossRef]
  39. Rabeni, C.F.; Minshall, G.W. Factors Affecting Microdistribution of Stream Benthic Insects. Oikos 1977, 29, 33–43. [Google Scholar] [CrossRef]
  40. Bevilacqua, M.S.; Vitório, A.; Felix, R.W.; Ribeiro, E.G.; Bozelli, R.L.; Figueiredo-Barros, M.P.; de Assis Esteves, F. Small is better: Comparing the efficiency of two Surber samplers’ sizes for biomonitoring programs in tropical headwater streams in the Amazon region. Environ. Monit. Assess. 2020, 192, 708. [Google Scholar] [CrossRef]
Figure 1. (a) The reach we sampled was south of Jackson Lake along the Snake River in northwestern Wyoming (the yellow line is the watershed boundary) (b) located in the western United States of America. The stars mark the location of the reach we sampled. (c) The Snake River has a braided channel through the area and we sampled two side channels.
Hydrobiology 03 00014 g001
Figure 2. (a) We used a Hess sampler to collect aquatic invertebrates in shallower areas of the Snake River, and (b) one person held the sampler while the other person scrubbed cobble and agitated substrate. (c) We filled rock baskets with cobble from the river and let them colonize for 30 days before retrieving them. (d) Note the filtering caddisflies that were abundant on the rock basket. We did not include invertebrates attached to the basket in our collections.
Hydrobiology 03 00014 g002
Figure 3. (a) Total density of aquatic invertebrates was higher in Hess samples (white) compared to rock baskets (grey). A higher proportion of (b) Ephemeroptera and (c) Plecoptera were collected in Hess samples, but (d) Trichoptera dominated rock baskets. (e) The proportion of Diptera did not differ between sampling methods. Bold lines are median, black circles are means, 25th percentile (lower box edge), 75th percentile (upper box edge), and whiskers represent the minimum and maximum values excluding outliers (open circles).
Hydrobiology 03 00014 g003
Figure 4. Bioassessment metrics calculated from Hess samplers (white) and rock baskets (grey). (a) The number of taxa collected in each replicate sample; (b) Shannon’s diversity index; (c) taxa evenness; (d) the number of taxa in the insect orders Ephemeroptera, Plecoptera, and Trichoptera (EPT); (e) the proportion of EPT taxa in each sample and (f) the mean tolerance value of taxa where 0 indicates a sensitive assemblage and 10 represents the most tolerant assemblage. Bold lines are median, black circles are means, 25th percentile (lower box edge), 75th percentile (upper box edge), and whiskers represent the minimum and maximum values excluding outliers (open circles).
Hydrobiology 03 00014 g004
Figure 5. The proportion of invertebrates in Hess samples (white) and rock baskets (grey) within (a) functional feeding groups and (b) habits. Bold lines are median, black circles are means, the lower edge of the box is the 25th percentile, the upper edge of the box is the 75th percentile, and the whiskers represent the minimum and maximum values excluding outliers (open circles).
Hydrobiology 03 00014 g005
Figure 6. (a) The assemblages collected by Hess samplers and rock baskets differed according to non-metric multidimensional scaling. Note that the polygons do not overlap. (b) Analysis of similarity supports that the assemblages differed between the sampling methods (R = 0.681, p = 0.001).
Hydrobiology 03 00014 g006
Figure 7. Standard error of total invertebrate density for (a) Hess samples and (b) rock baskets. We randomly selected samples from 1000 stimulated estimates of densities three times for each calculation. The species accumulation curves of taxa were calculated for (c) Hess samplers and (d) rock baskets. Note the differences in the y-axis where Hess samples accumulated more taxa.
Hydrobiology 03 00014 g007
Table 1. Water chemistry of the Snake River near Jackson, Wyoming, on 7 September 2022, when rock baskets were retrieved and Hess samples were collected.
ParameterMeasurementUnits
Dissolved oxygen 100.3% saturation
9.37mg O2/L
Water temperature18.6°C
Specific conductivity168.5µS/cm
pH8.62
Oxidation-reduction potential86.7mV
Disclaimer/Publisher’s Note: The statements, opinions and data contained in all publications are solely those of the individual author(s) and contributor(s) and not of MDPI and/or the editor(s). MDPI and/or the editor(s) disclaim responsibility for any injury to people or property resulting from any ideas, methods, instructions or products referred to in the content.

