Article

Resiliency and Recovery of Aquatic Vegetation Following Scouring Floods in Two First-Magnitude Springs, Missouri, USA

Department of Biology, Missouri State University, 901 South National Ave., Springfield, MO 65897, USA
Hydrobiology 2022, 1(2), 164-182; https://doi.org/10.3390/hydrobiology1020013
Submission received: 30 January 2022 / Revised: 26 March 2022 / Accepted: 28 March 2022 / Published: 31 March 2022

Abstract

:
This study quantifies the loss of vegetative cover in Alley and Big springs, Missouri, following a catastrophic, ‘100 year’ flood, and documents their subsequent recovery. Foliar cover of aquatic vegetation was measured in each spring along six transects, each having three sample cells (1 m2, N = 18). Species diversity analyses included taxa richness, Shannon’s diversity index, and Simpson’s diversity index, which were expressed as the effective number of species (S, He, and De). Species metrics were calculated as individual species frequency (ISF), percent foliar cover (PFC), and species importance value (SIV). Post-flood community diversity metrics (S, He, and De) for the springs were largely not significant for most measures (Epps–Singleton test p > 0.05). This suggests that they may not be sufficiently sensitive for detecting change in springs when the sample size is small. Bare substrate increased significantly at Big Spring post-flood (mean = 87.50%; Epps–Singleton test, p = 0.02), but not at Alley Spring (Epps–Singleton test, p = 0.42). Various alga taxa generally exhibited increased frequency and abundance following the flood, which is reflected in their overall higher SIVs. Most hydrophyte species at Alley Spring showed a marked decline compared to the pre-flood average, only to substantially increase in the last year of sampling, thus maintaining their approximate species important values relative to their pre-flood averages. Several hydrophyte species at Big Spring showed significant decreases (Epps–Singleton test p < 0.05) in their respective community metrics, and recovery had not returned to pre-flood levels on the last sampling date. This study showed that loss and recovery of aquatic vegetation in high-magnitude Ozark springs following flooding are a function of flood intensity as well as substrate size and retention, and proximity to the receiving stream.

1. Introduction

Floods can have substantial impacts on the ecological functioning and survivability of aquatic vegetation in lotic waters [1]. Impacts can be either beneficial (e.g., soil and nutrient supplements), or destructive (e.g., physical damage and physiological stress). Previous research on flooding impacts on aquatic vegetation has focused largely on physiological impacts such as respiration and photosynthesis [2,3,4,5,6,7,8,9,10]. Fewer studies have addressed the physical consequences of flooding on aquatic vegetation. Moreover, research on impacts of scouring floods on lotic vegetation has primarily been conducted for rivers and small streams [1,11,12,13,14], while springs have received little attention by comparison [15]. Unlike other lotic systems, aquatic vegetation in springs is often more diverse and stable given the physical and chemical stability of those systems due to their flows largely coming from groundwater sources [15,16,17,18,19]. Because of such stability, flooding impacts on springs are therefore expected to be less destructive compared to those in surface-fed streams.
The karst topography of the Ozarks physiographic region [20] supports thousands of springs, including several first-magnitude springs (>3 m3/s flow) [16,21,22]. The occurrence and distribution of aquatic vegetation in these springs are becoming increasingly better known [16,18,19,23]. The Heartland Inventory and Monitoring Network (HTLN) of the U.S. National Park Service has conducted annual aquatic vegetation surveys at large (first- and second-magnitude) springs located at Ozark National Scenic Riverways (OZAR), Missouri since 2007 [18,24,25,26]. This historical data provided a unique opportunity to document and assess recovery of aquatic vegetation in two of those springs following a catastrophic flood.
This paper quantifies the loss of vegetative cover in Alley and Big springs, Missouri following a catastrophic flood, documents its subsequent recovery, and explains differential responses in recovery. Based on the historical data, the hypothesis for this study was that aquatic vegetation in both springs would recover rapidly (e.g., weeks) and at similar rates in each spring.

2. Materials and Methods
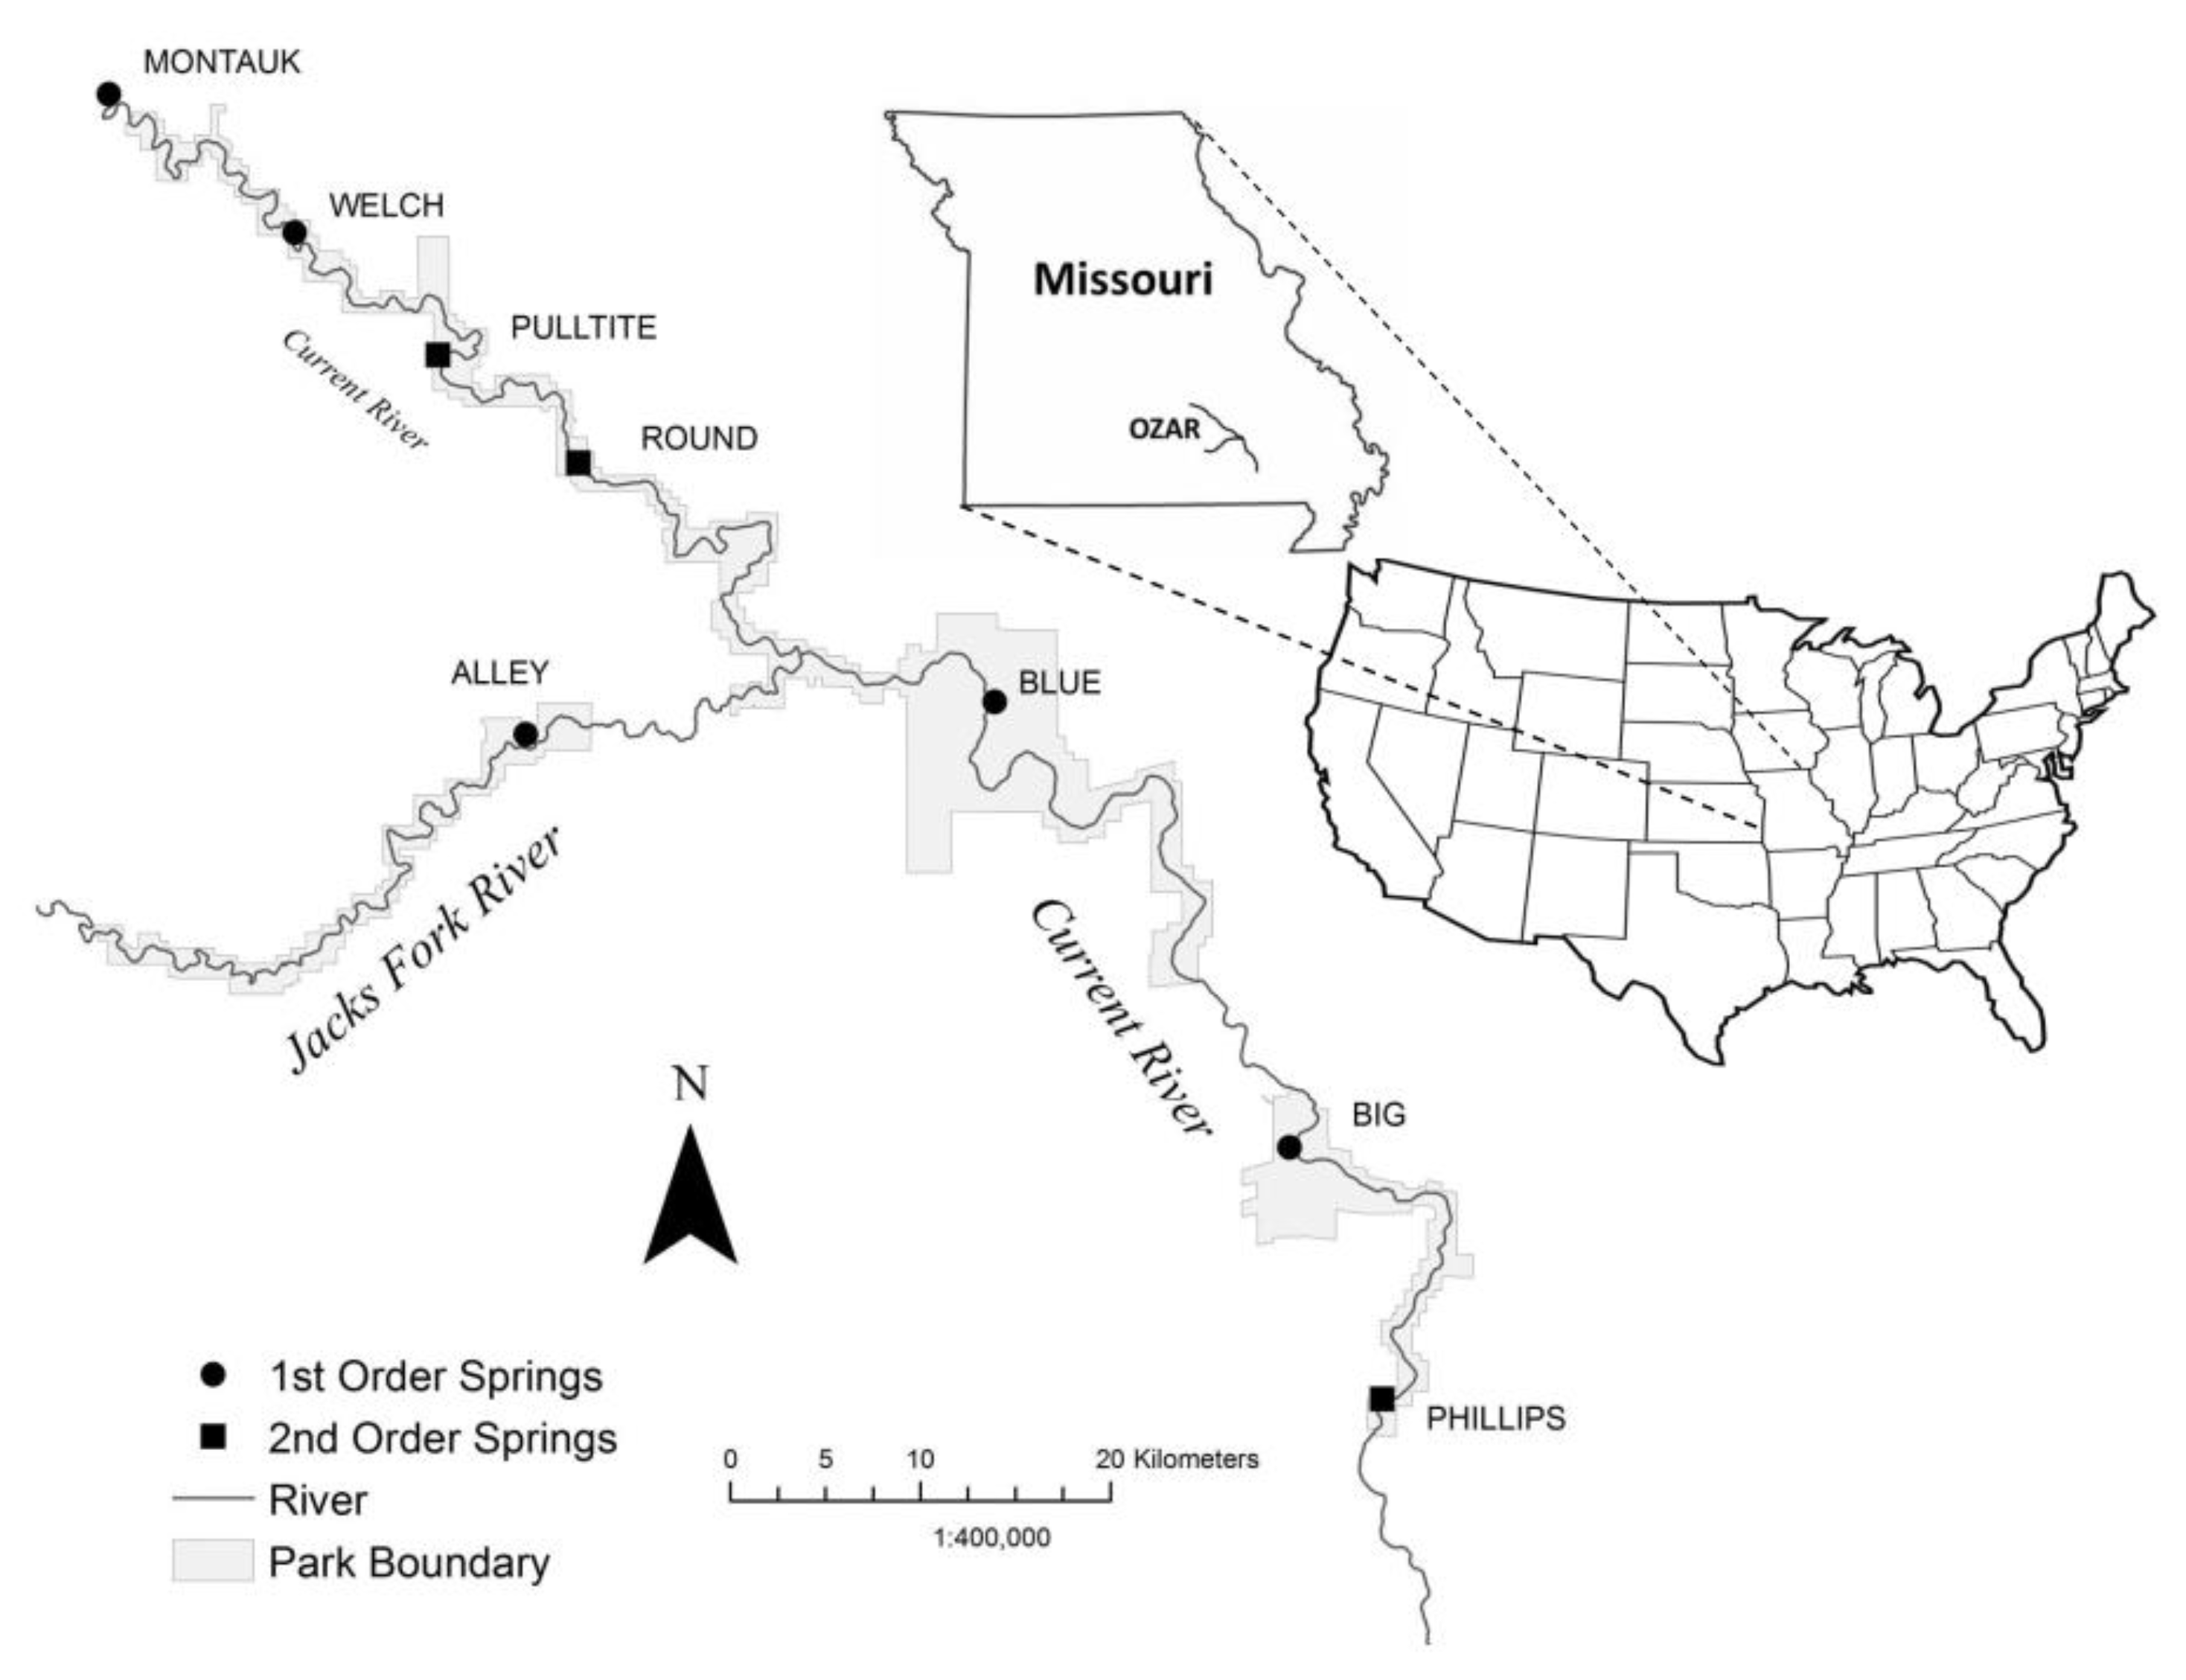
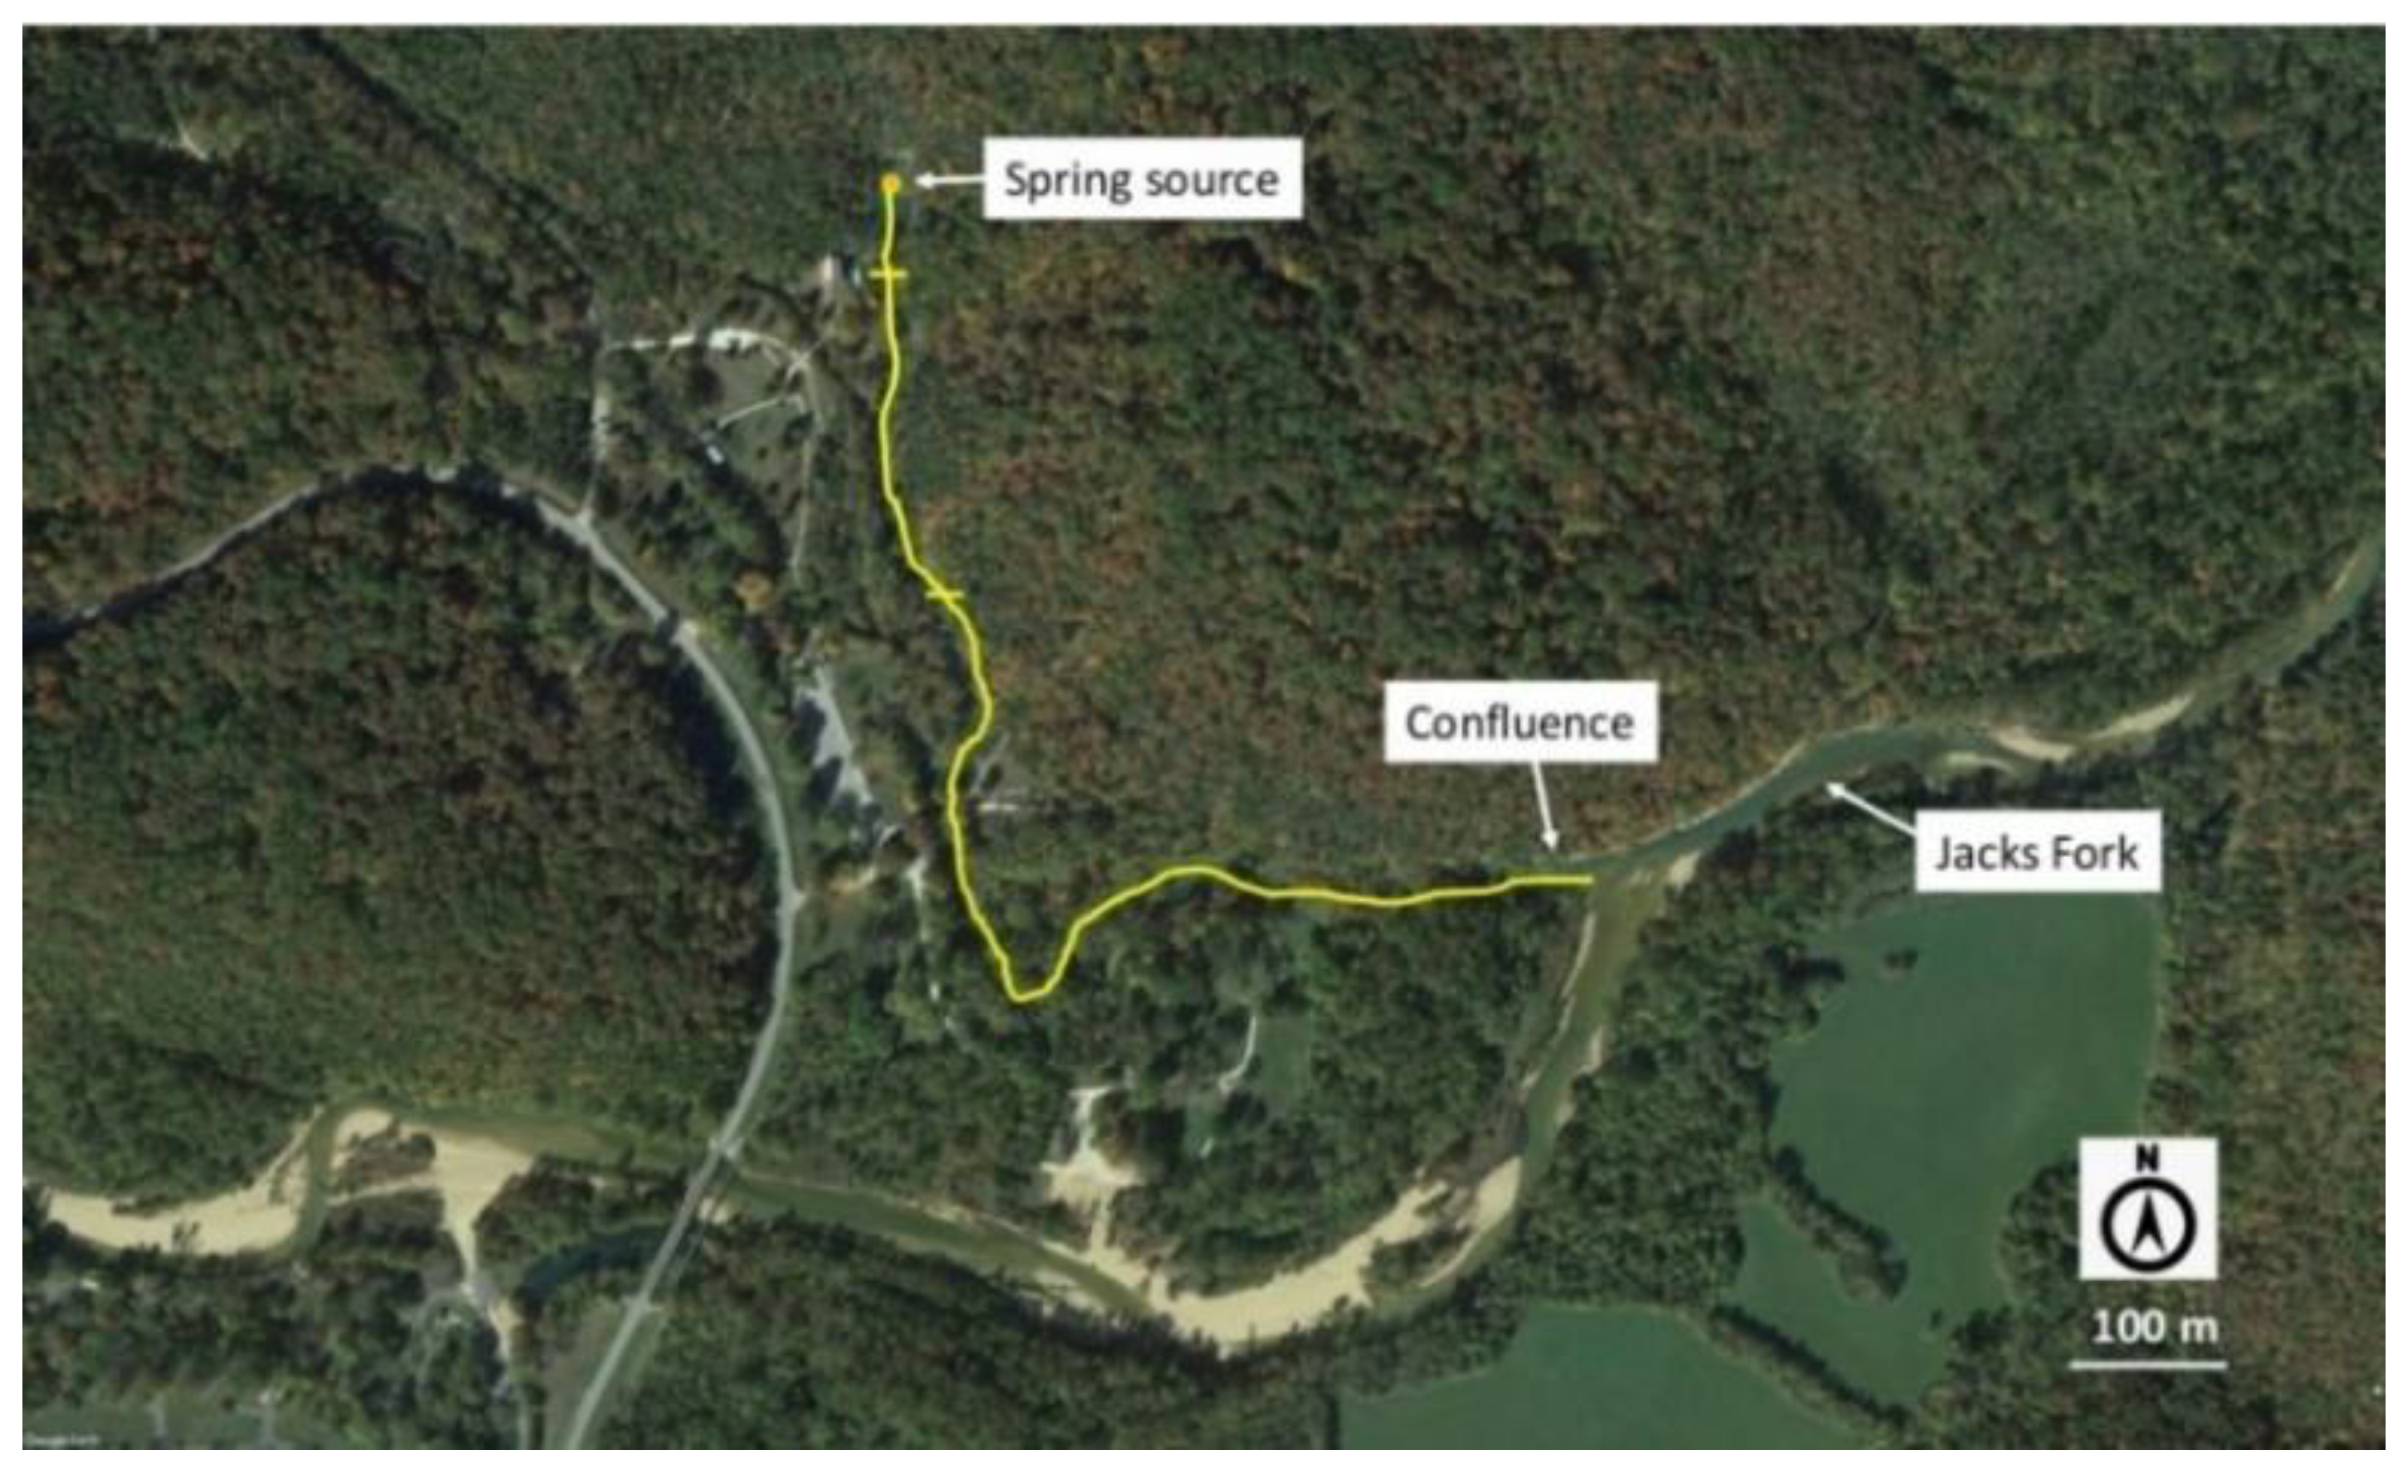
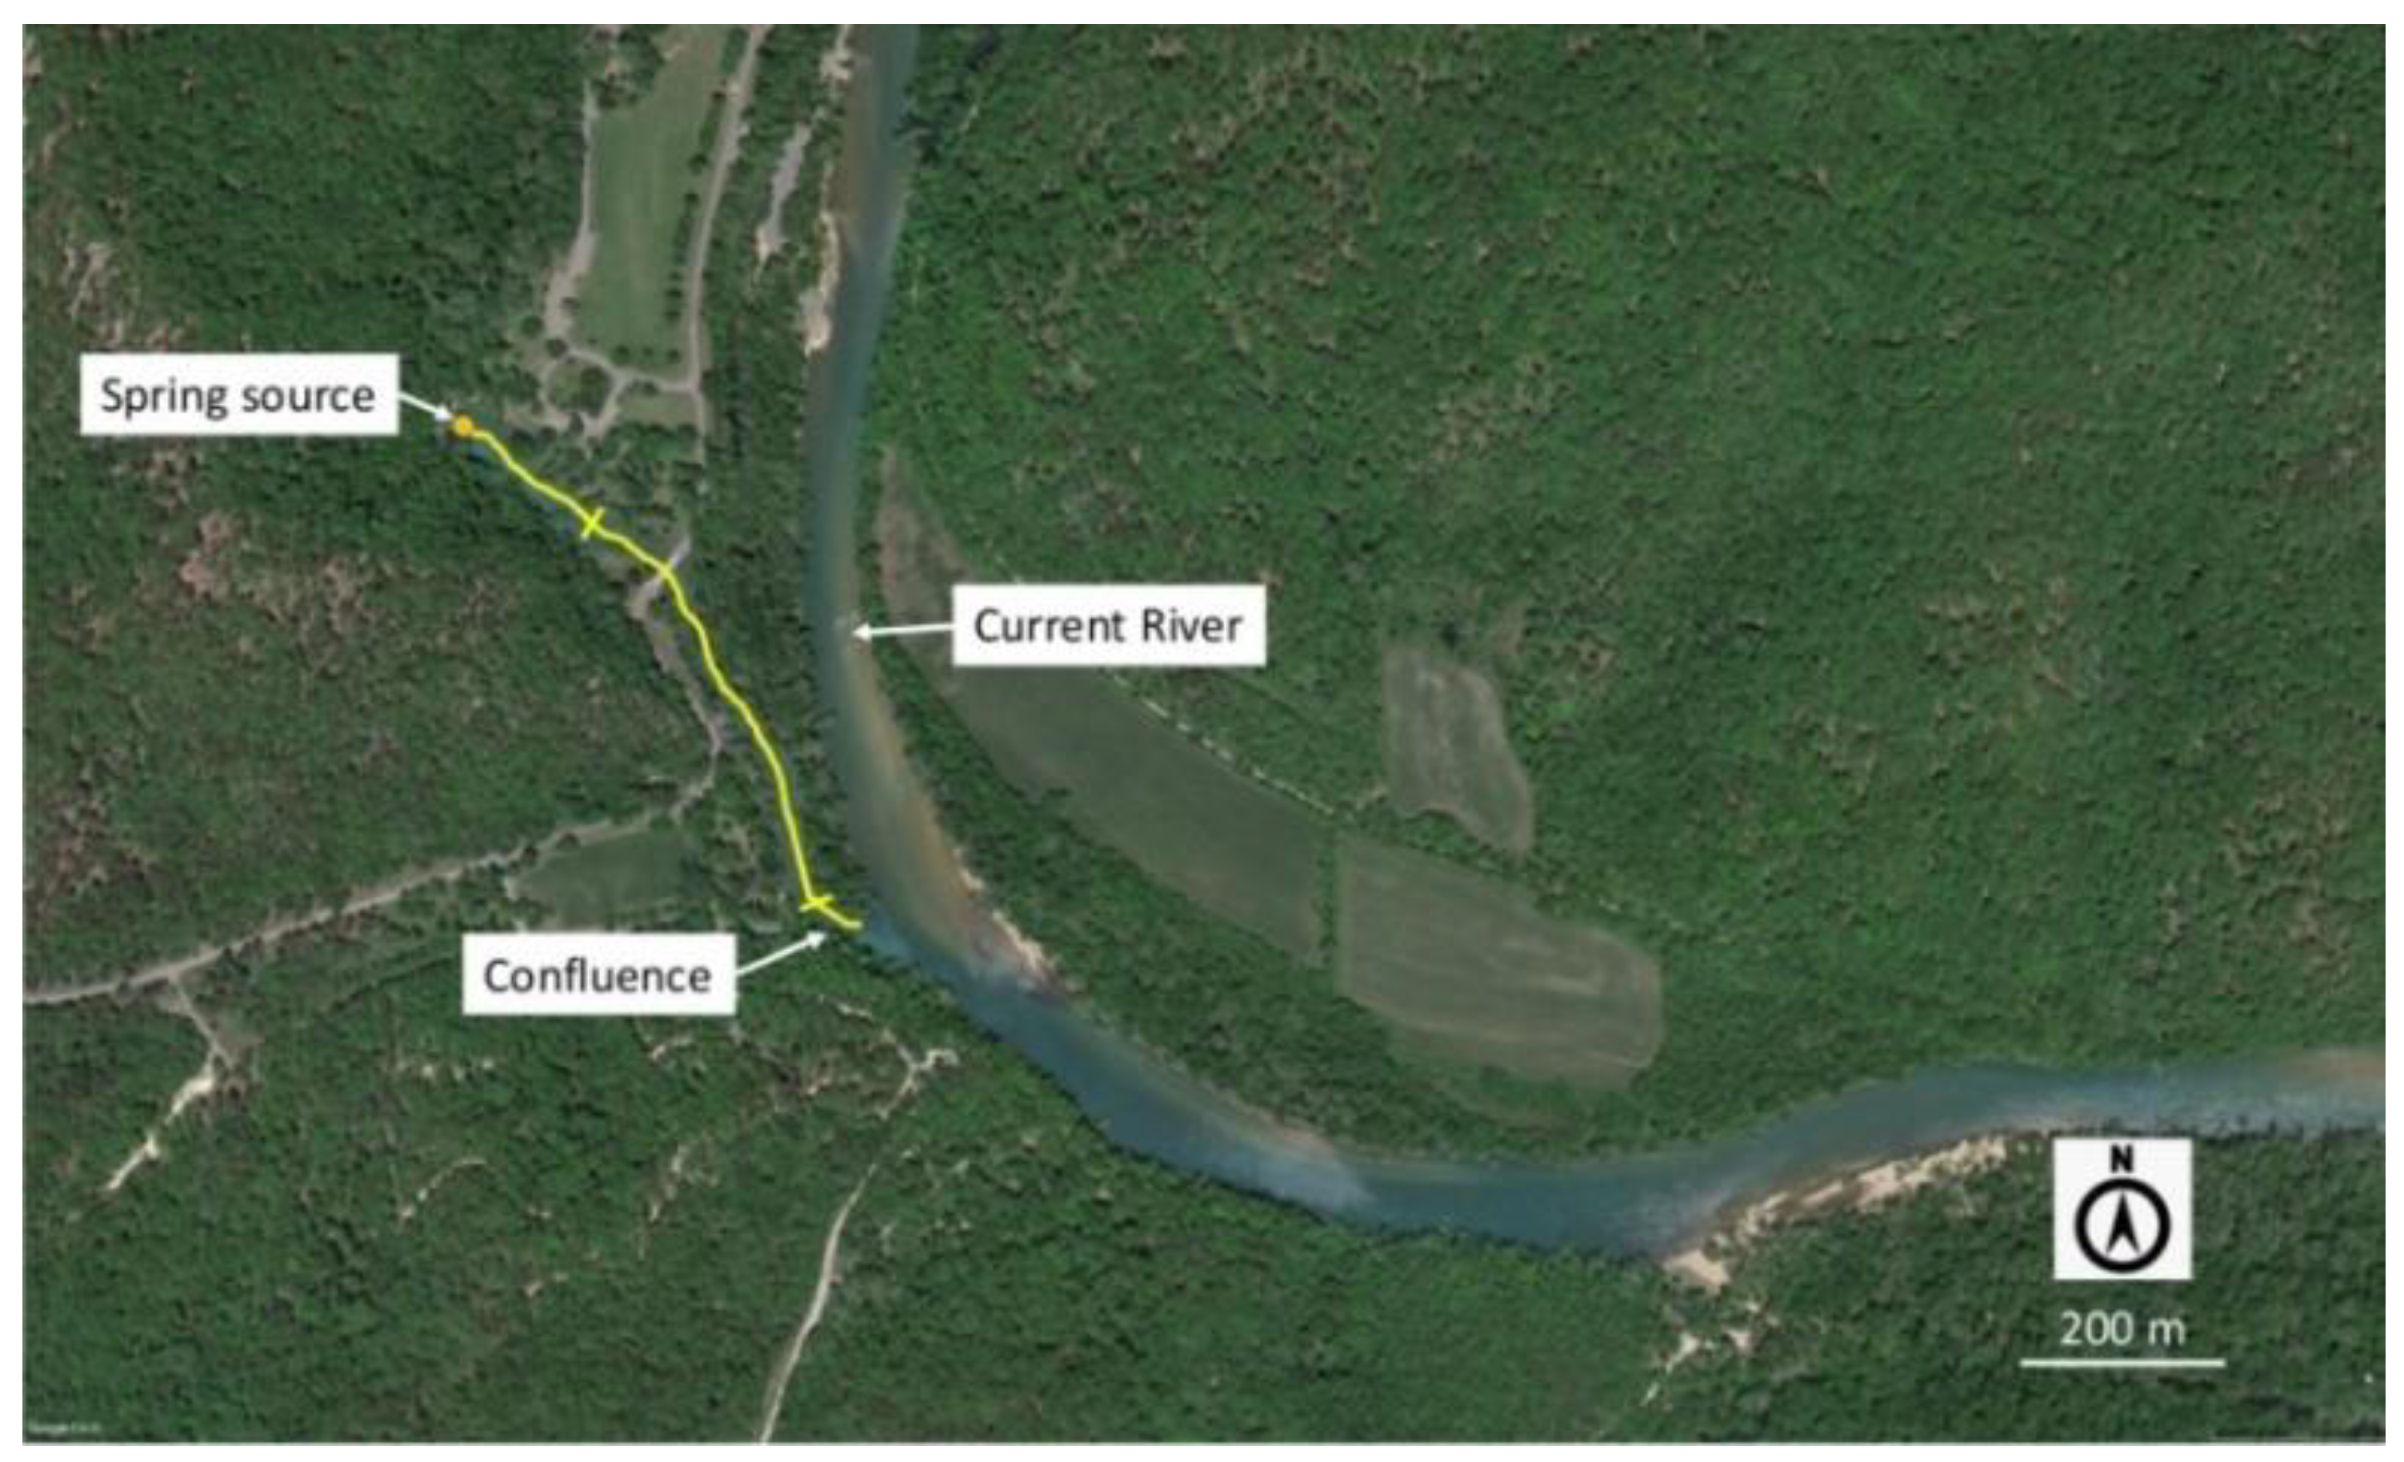
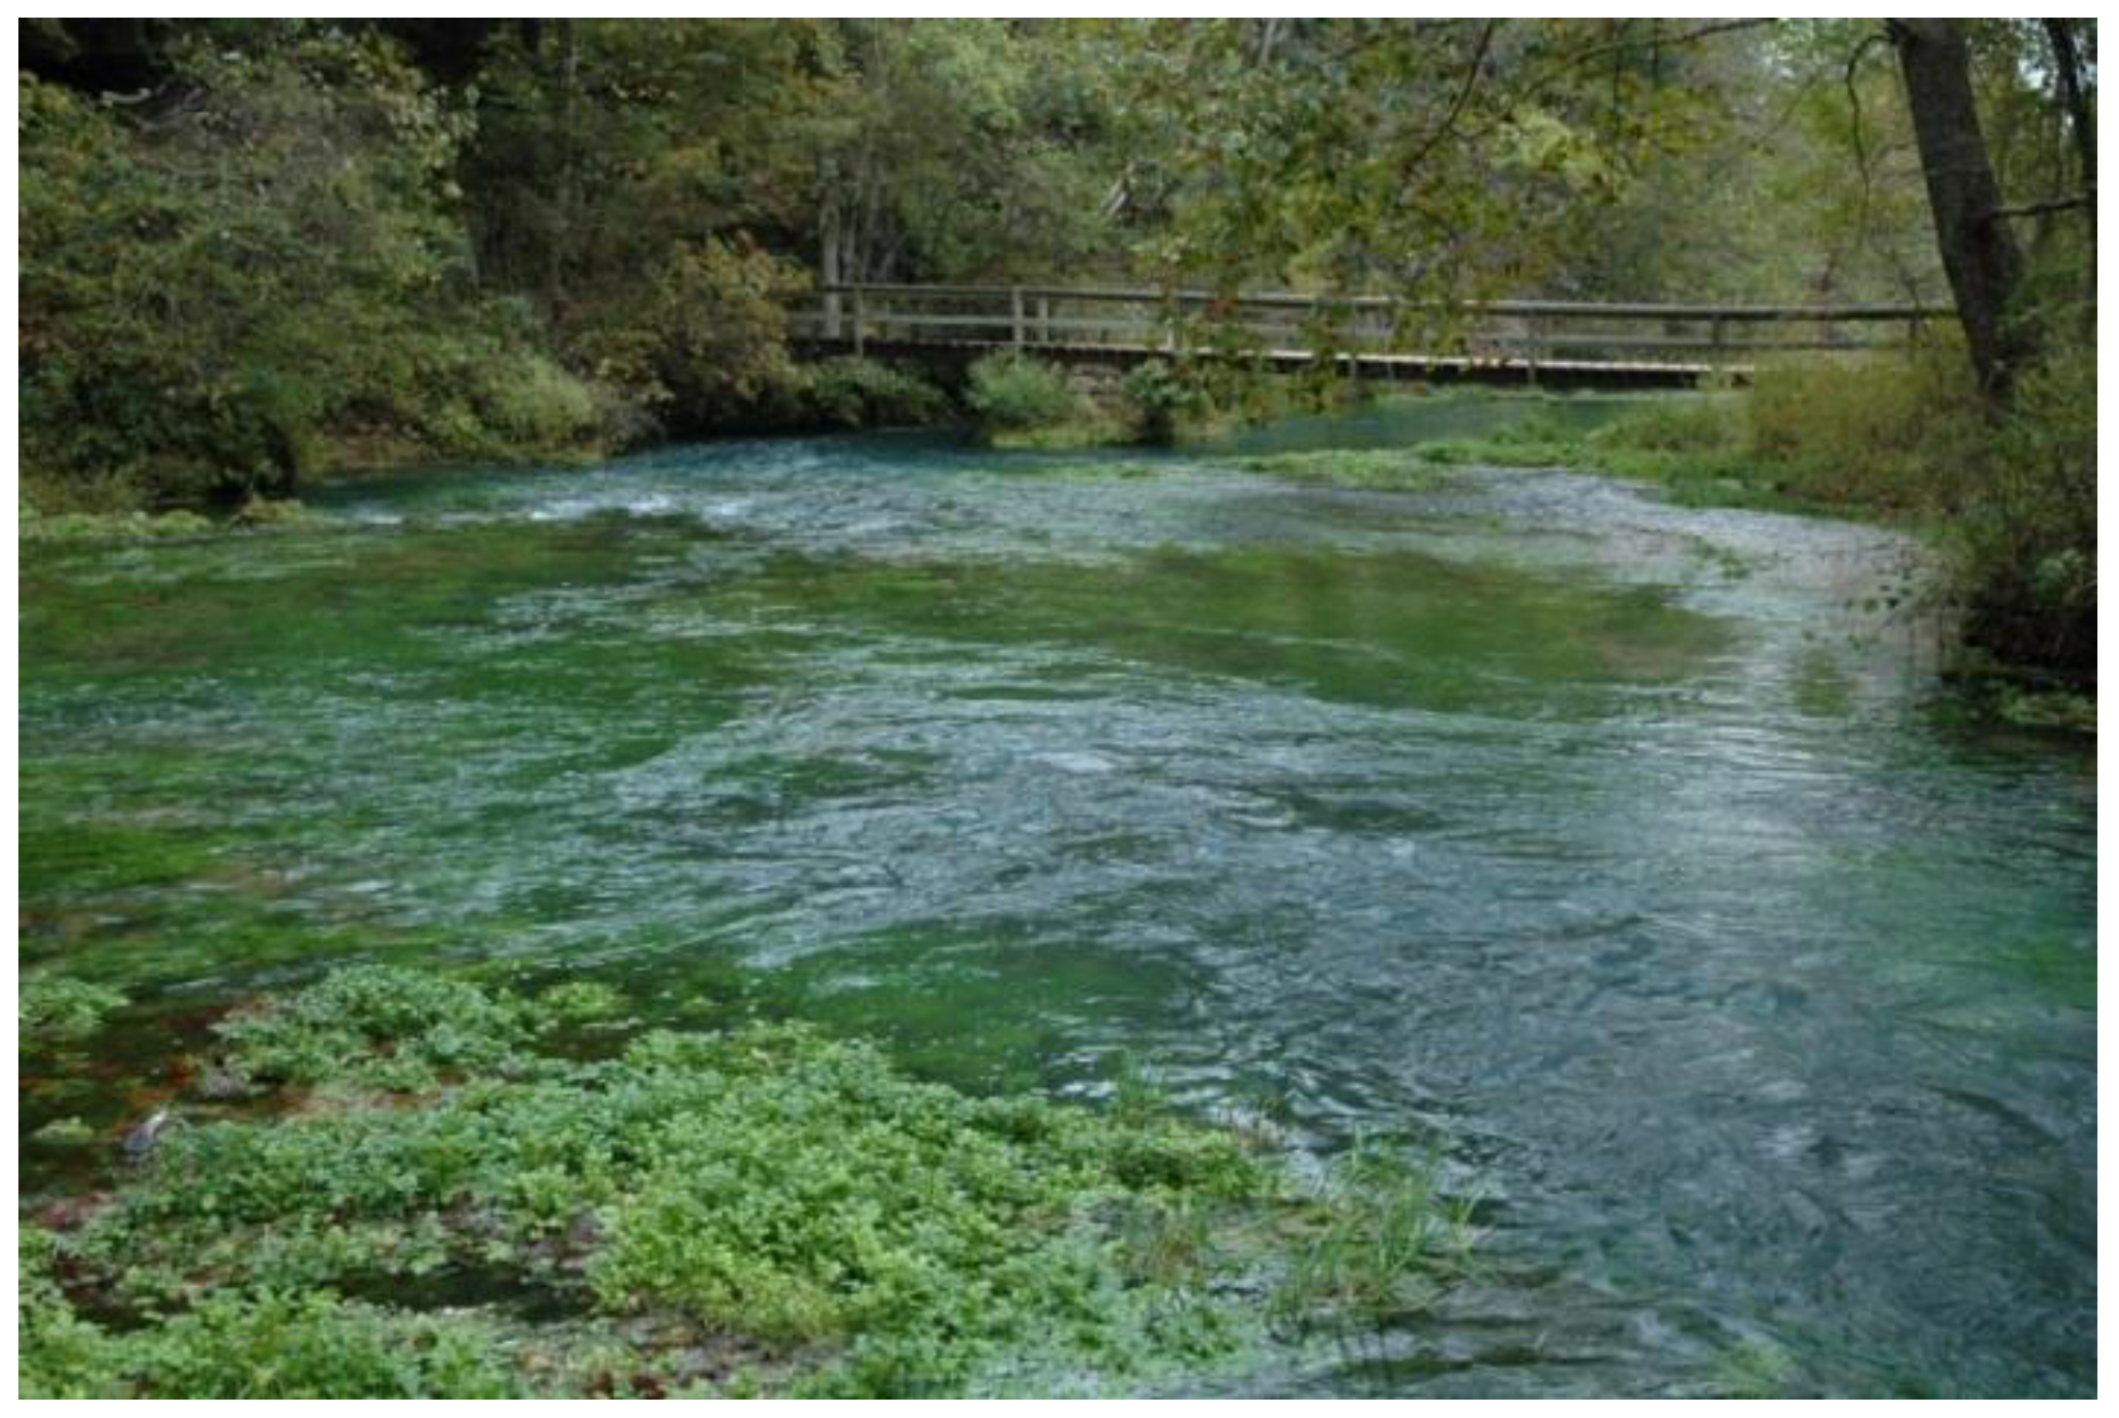
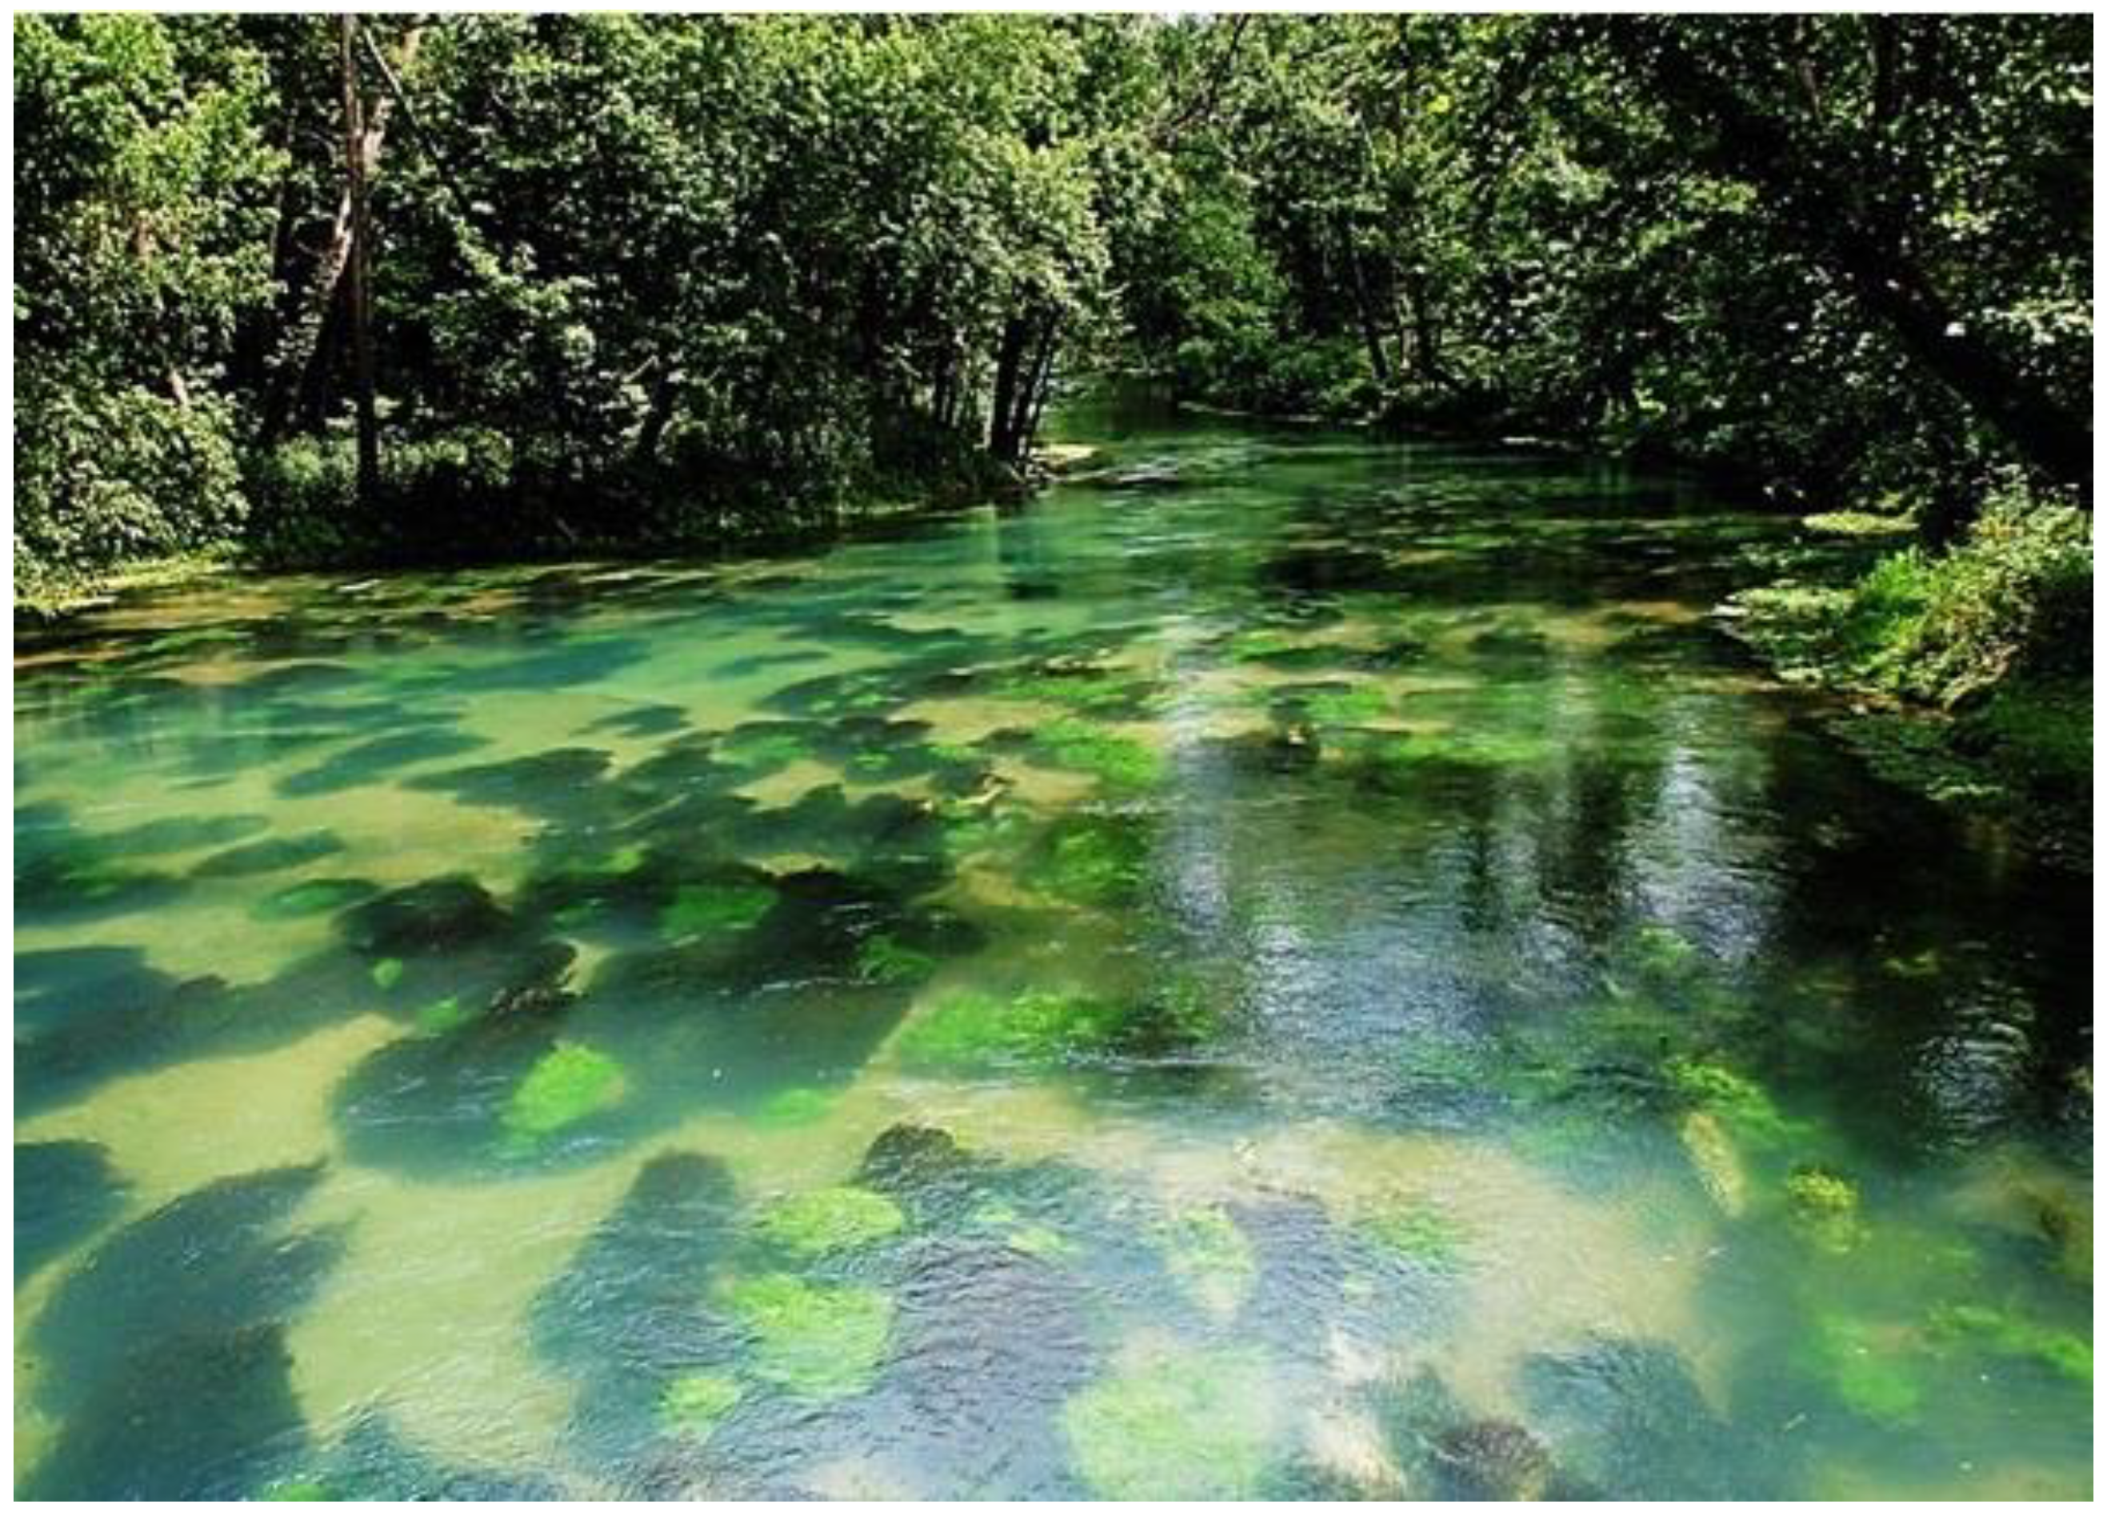
2.1. Study Sites

This study was conducted at Alley Spring (Shannon County) and Big Spring (Carter County), Ozark National Scenic Riverways (OZAR), Missouri (Figure 1).
The springs are strikingly different with respect to landscape features and in-channel habitat characteristics although water chemistry is similar in both (Table 1). Most large springs at OZAR, including Alley Spring, have coarse, large pebble to small cobble substrates (32–90 mm) that are well embedded [25]. In contrast, the substrate at Big Spring consists largely of fine sands, silt, and smaller gravels (≤8 mm). The channel of Alley Spring is well separated from its receiving stream (Jacks Fork) and is not inundated in its upper reaches by flooding of that stream (Figure 2). The stretch of spring run used for monitoring purposes is located approximately 600 m upstream from the Jacks Fork. In contrast, the channel of Big Spring runs parallel to and is narrowly separated from the Current River by a narrow peninsula ranging in width from approximately 50 to 300 m (Figure 3). Flood waters from the Current River sometimes cross the barrier between the two channels, thus exacerbating scouring and flooding in the spring channel. There is no US Geological Survey (USGS) discharge gage at Alley Spring, but mean discharge for Alley Spring measured during annual monitoring from 2007 to 2016 was 3.62 m3/s (range = 1.23–5.58 m3/s) and following procedures described in Bowles et al. [24]. Discharge for Big Spring during sampling from 2007 to 2012 at Big Spring ranged from 9.85 to 13.93 m3/s. The historic mean discharge for this spring, based on a 95 year period of record, is approximately 15.94 m3/s (USGS gage 07067500b) [27].

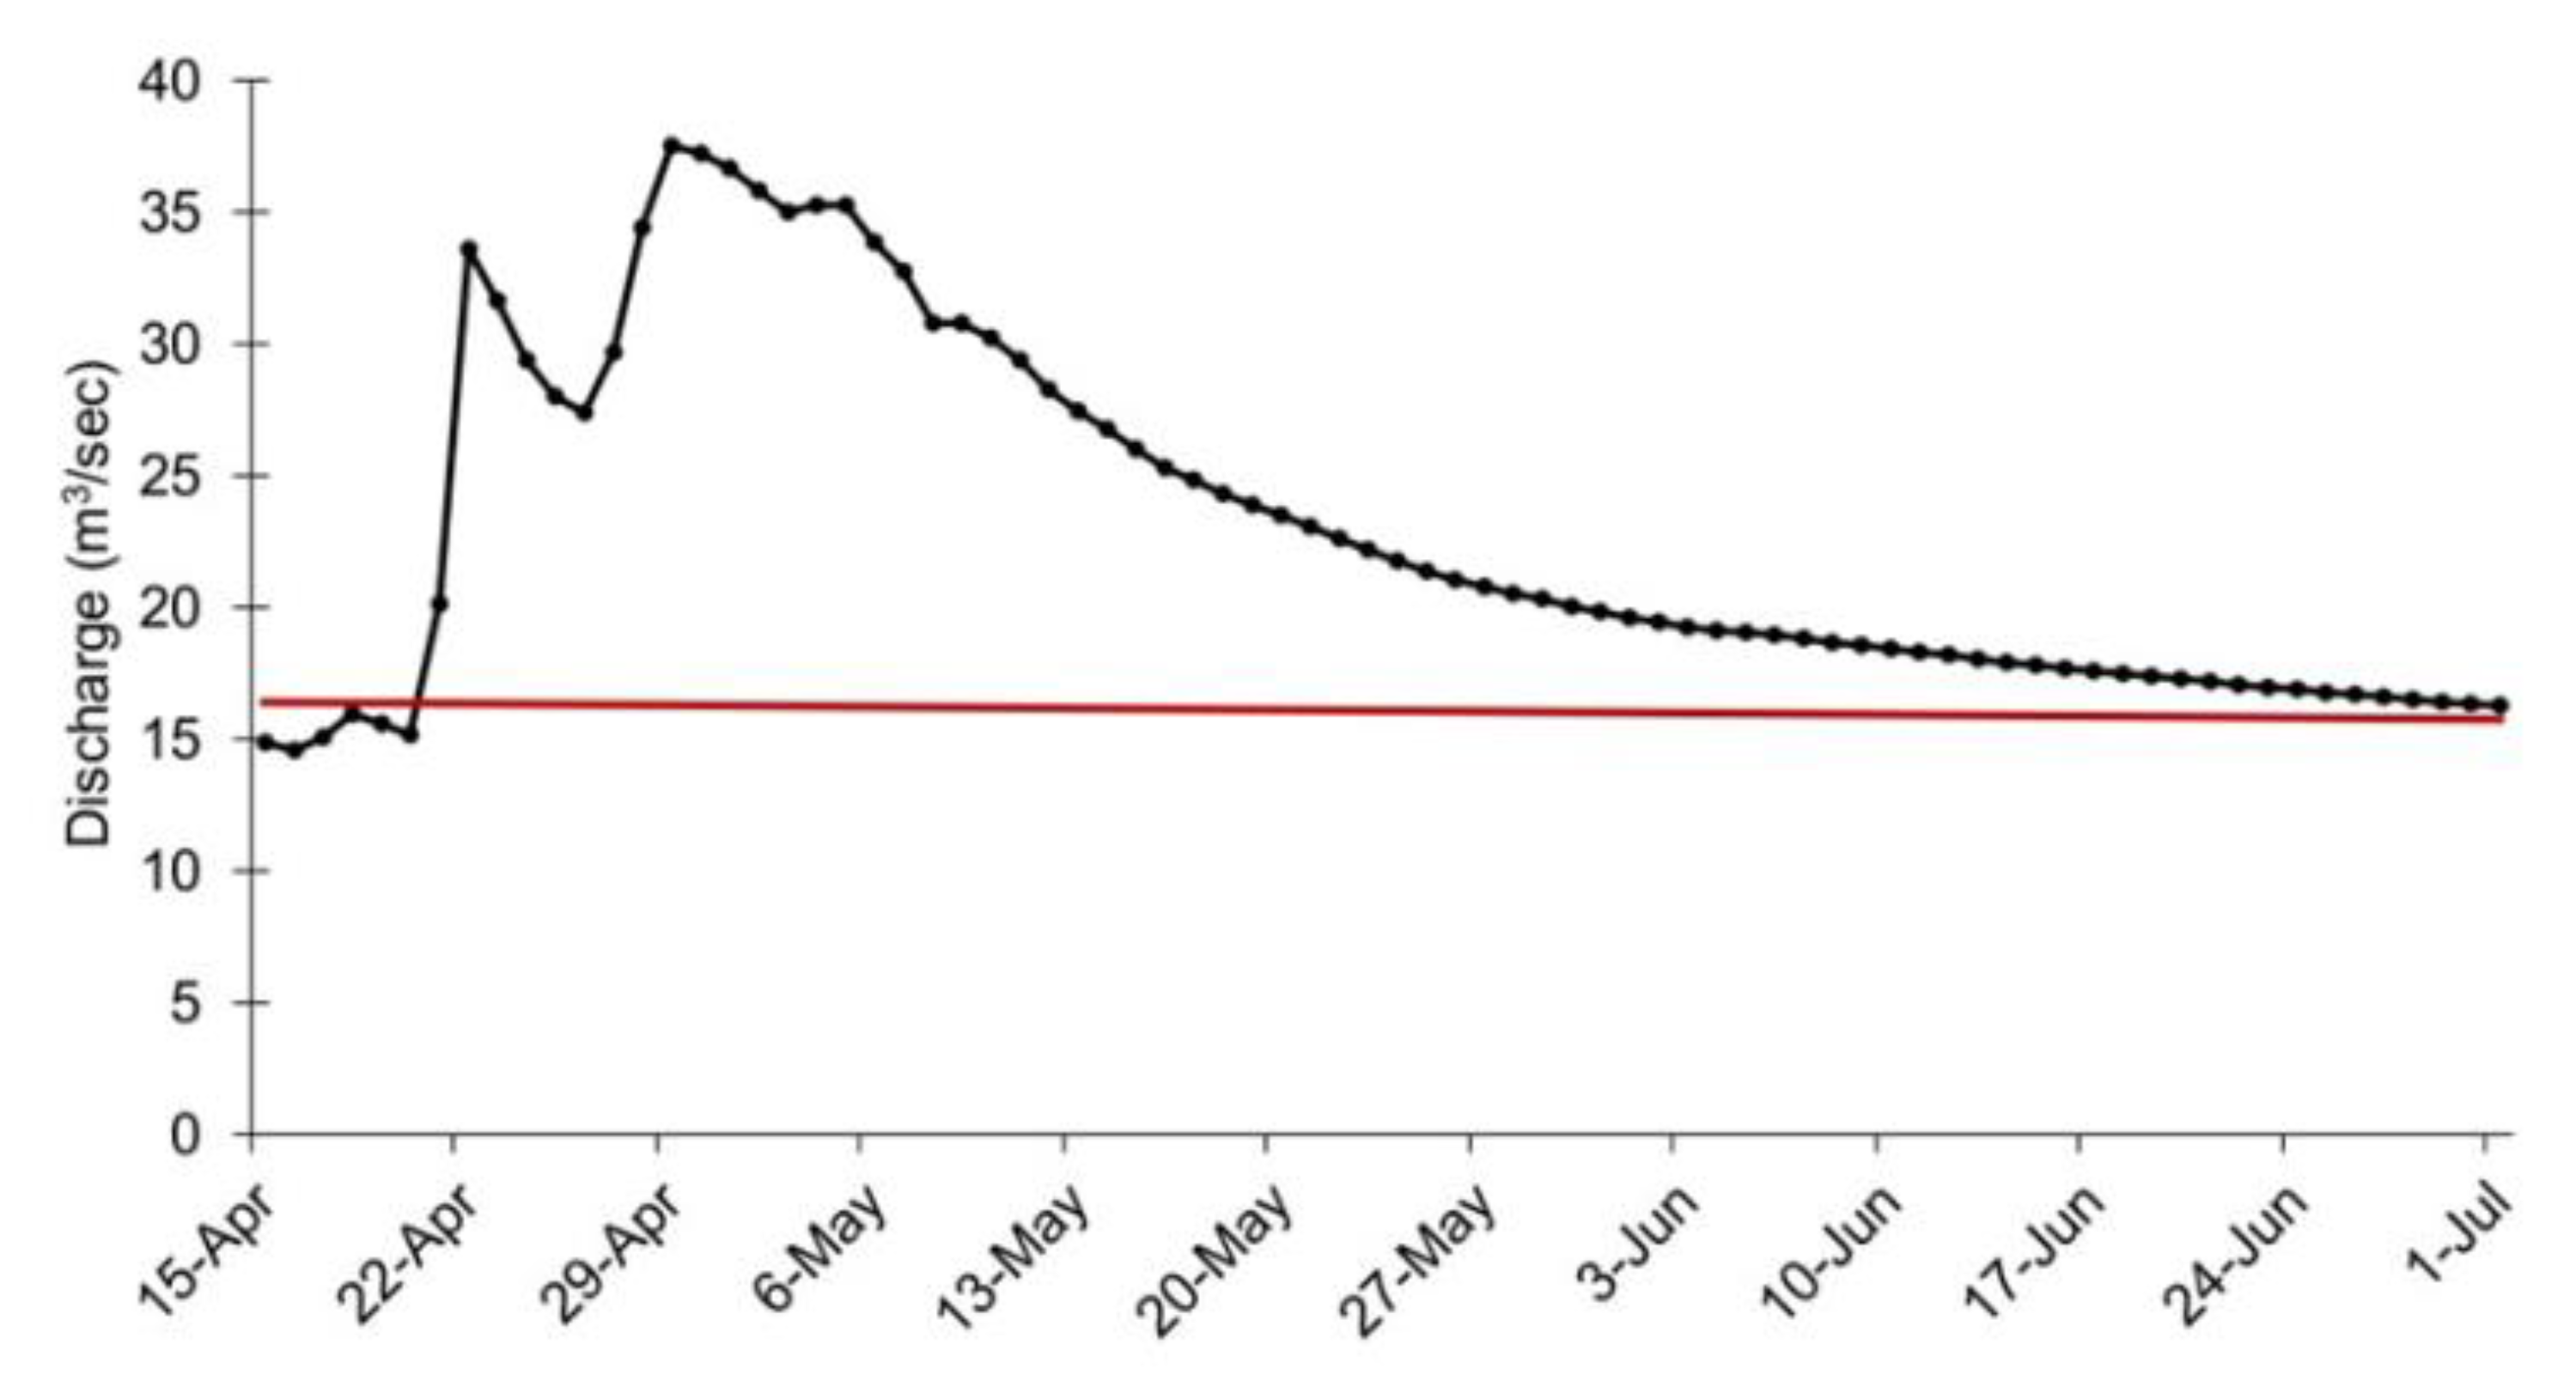
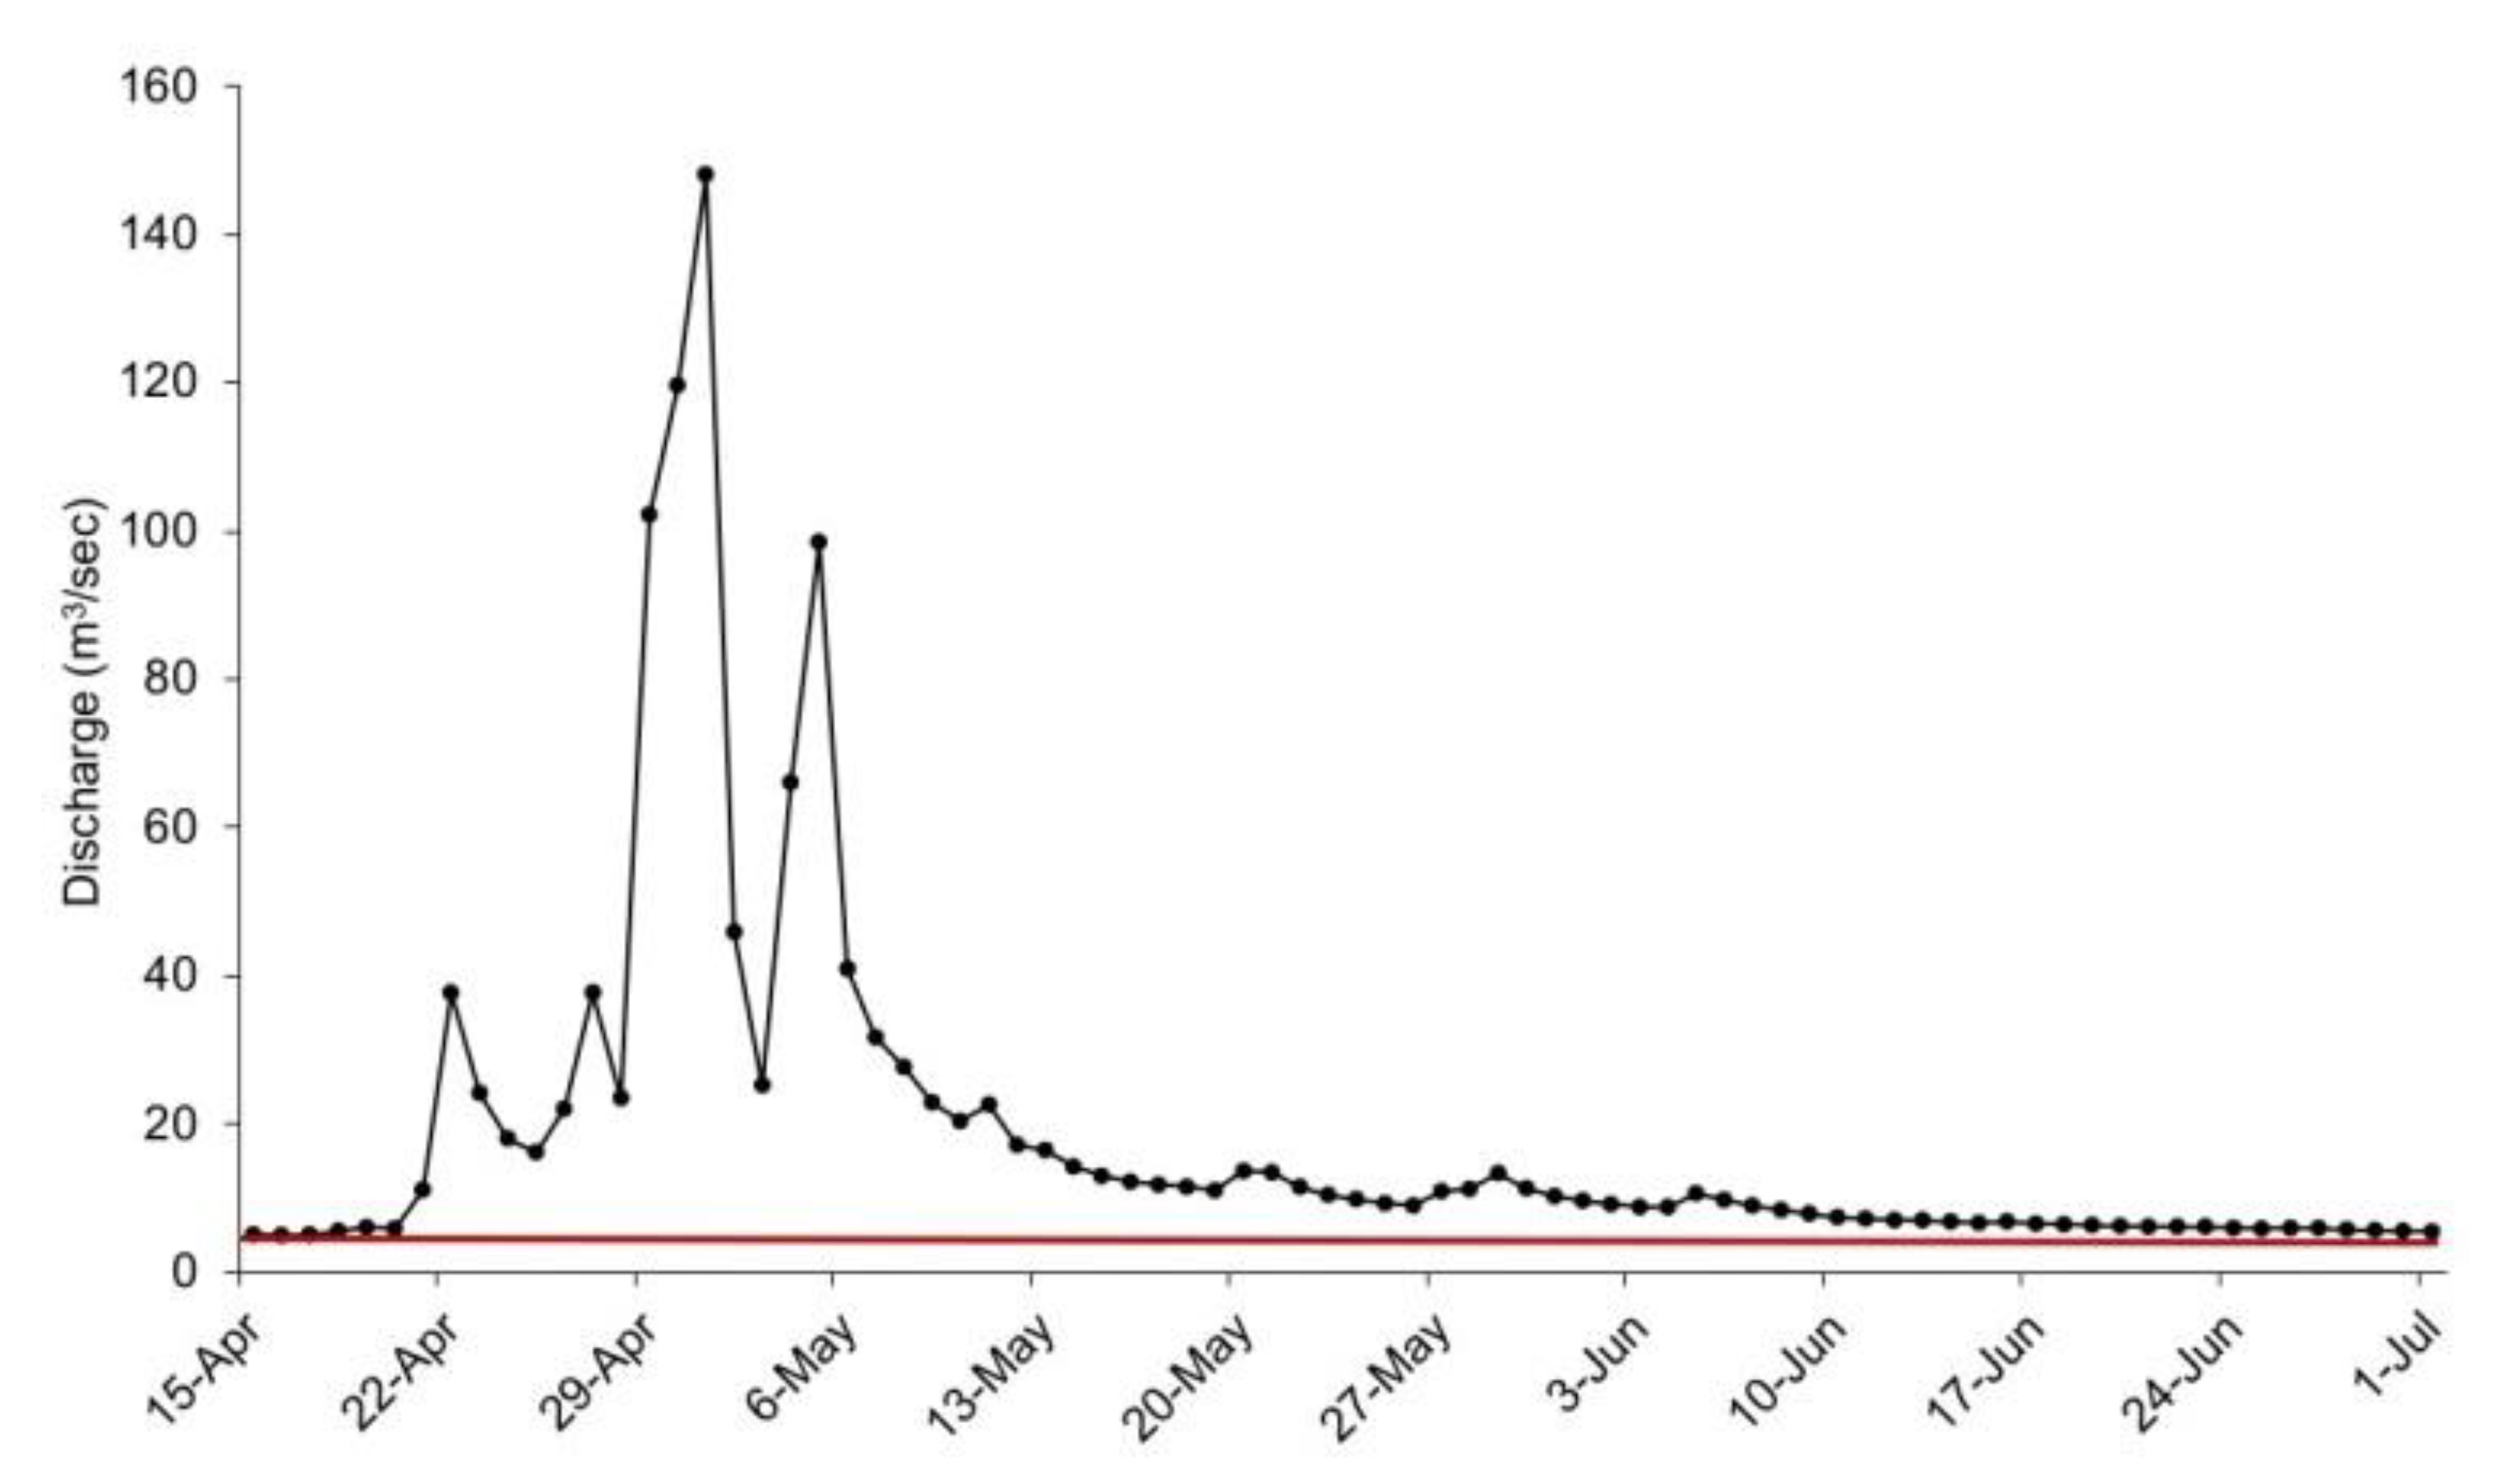
2.2. The Flood Event

Substantial precipitation events in the Current River Watershed in southcentral Missouri began on 17 April 2017 and continued through 23 April 2017, resulting in over 12.7 cm rainfall being deposited to the recharge basins of the two springs. Subsequently, the last weekend of April 2017 saw torrential rainfall in the Ozarks physiographic region. From Friday 28 April to Sunday 30 April 2017, area rainfall ranged from to 20.3 to 30.5 cm. The collective rainfall during this period caused widespread flooding. On 30 April 2017, the Current River at Van Buren, Missouri crested at a record 11.3 m. Flood stage at this location is 6.1 m. This historic, ‘100 year’, flood event caused substantial and unprecedented damage to natural resources and park infrastructure at OZAR, which resulted in much of the park being closed to the public for several months while repairs and cleanup were conducted. In addition to the flooding and damage on the Current River and its major tributary the Jacks Fork, there also was destructive flooding of springs at OZAR. Because there is no discharge gage at Alley Spring, flood specific flow data are unavailable. However, discharge was estimated for this area during the flood event as the difference between the discharge for the Jacks Fork approximately 0.9 km upstream of its confluence with Alley Spring USGS gage 07065495 [27]) and the discharge for the Jacks Fork at Eminence approximately 9 km downstream USGS gage 07066000 [27] (Figure 4). Under typical flow patterns, Alley Spring contributes approximately 80% or more of the discharge in the Jacks Fork at the downstream location. There are three tributaries in this stretch of river and each has a discharge of approximately 0.20 m3/s or less. Those respective adjustments were applied to the total discharge measurement. The estimated discharge is not likely accurate for the spring because the flood flows upstream of Alley Spring were far greater than previously recorded, but it reasonably reflects the dynamics and duration of the flood event in that drainage. The peak discharge for Big Spring during this flood was approximately 35 m3/s and flows above 30 m3/s were sustained for several days (Figure 5).
The other large springs at OZAR (Figure 1) also had increased flow levels following the storm event, but the flooding in those springs was not as severe. This is due in part because they have different recharge zones. Those data are not presented here.

2.3. Vegetation Assessment

Alley and Big springs each have robust growths of aquatic vegetation in their respective channels (Figure 6 and Figure 7). The upstream boundary of the sampling reach in each spring is located at the first wadable area downstream of the spring source [24]. The accessible reach of Alley Spring is 190 m and that of Big Spring is 460 m. Aquatic vegetation was sampled at six transects oriented perpendicular to flow with three equally-spaced sample cells (1 m2) per transect (N = 18) using a 1 m2 PVC sampling frame and view bucket to observe vegetation. Plant species foliar cover in each sample cell was recorded using a modified Daubenmire scale: 1 = 0–0.99%, 2 = 1–5%, 3 = 5–25%, 4 = 25–50%, 5 = 50–75%, 6 = 75–95%, 7 = 95–100% [24,29]. All sampling was done during July and August. The 2017 sampling data were collected three months following the flood. See Bowles et al. [24] for further details on methodology used for monitoring vegetation in the springs. Additional data on water quality and instream and riparian habitat at the springs can be found in Bowles and Dodd [18]. Ten years of aquatic vegetation monitoring data are available for each spring collected prior to the 2017 flooding event that were used for baseline comparisons. Additional monitoring data for Alley Spring extends through 2019 and 2020 for Big Spring. Bowles and Dodd [18] provided a summary of the plant community data collected from 2007 to 2012.

2.4. Metrics and Statistical Analyses

Data collected from all sample cells were summarized by plant taxa for the area sampled, first by transect, then by site. Mean values along with a measure of variability (±1 standard error of the mean) were calculated for the community. Foliar cover estimates for each species were used to determine measures of species diversity, which were analyzed using the midpoints of the respective cover classes. Analyses were conducted using two broad categories: (1) diversity, and (2) individual species dynamics. Diversity analyses included taxa richness, Shannon’s diversity index [30], and Simpson’s diversity index [31], which were subsequently expressed as the effective number of species (S, He, and De, respectively) [24,32,33]. The advantage of converting Shannon’s diversity index and Simpson’s diversity index to the effective number of species is that it makes their values linear, thus allowing for direct comparison. The effective number of species for each diversity measure reflects the number of species found in a similar community when all species occur in equal density [24]. If all species occur in equal abundance in the community within and among sample years, then taxa richness, Shannon’s diversity index and Simpson’s diversity index would all be equal [32].
Metrics calculated for individual taxa were individual species frequency (ISF), percent foliar cover (PFC), and species importance value (SIV) (see Bowles et al. [24] for details on calculating these metrics). Species importance values are a measure of the relative dominance of species in a spring community—the larger the importance value, the more important the species. In some instances, species identifications were not practical for this study (i.e., algae, moss). In such instances, ‘taxa’ is a more appropriate term, but species is retained for the metric names to avoid confusion.
Because the data series was not monotonic due to the discrete flood event in 2017, the data were analyzed as two groups with the groups being prior to the flood (2007–2016) and after the flood (2017–2019 Alley Spring; 2017–2020 Big Spring). The Epps–Singleton [34] test (α = 0.05) for equality of distributions was used to analyze data, including diversity metrics (S, He, De, Evenness, and bare substrate), and individual metrics (ISF, PFC, SIV) for each taxon [35] (PAST statistical software, version 4.06b). The small-sample correction factor was used for calculations since the total sample size was below 25 [34]. The Epps–Singleton test was used because it has greater power than similar non-parametric tests, is valid for both discrete and continuous distributions, and it allows for small and unequal sample sizes [36].

3. Results

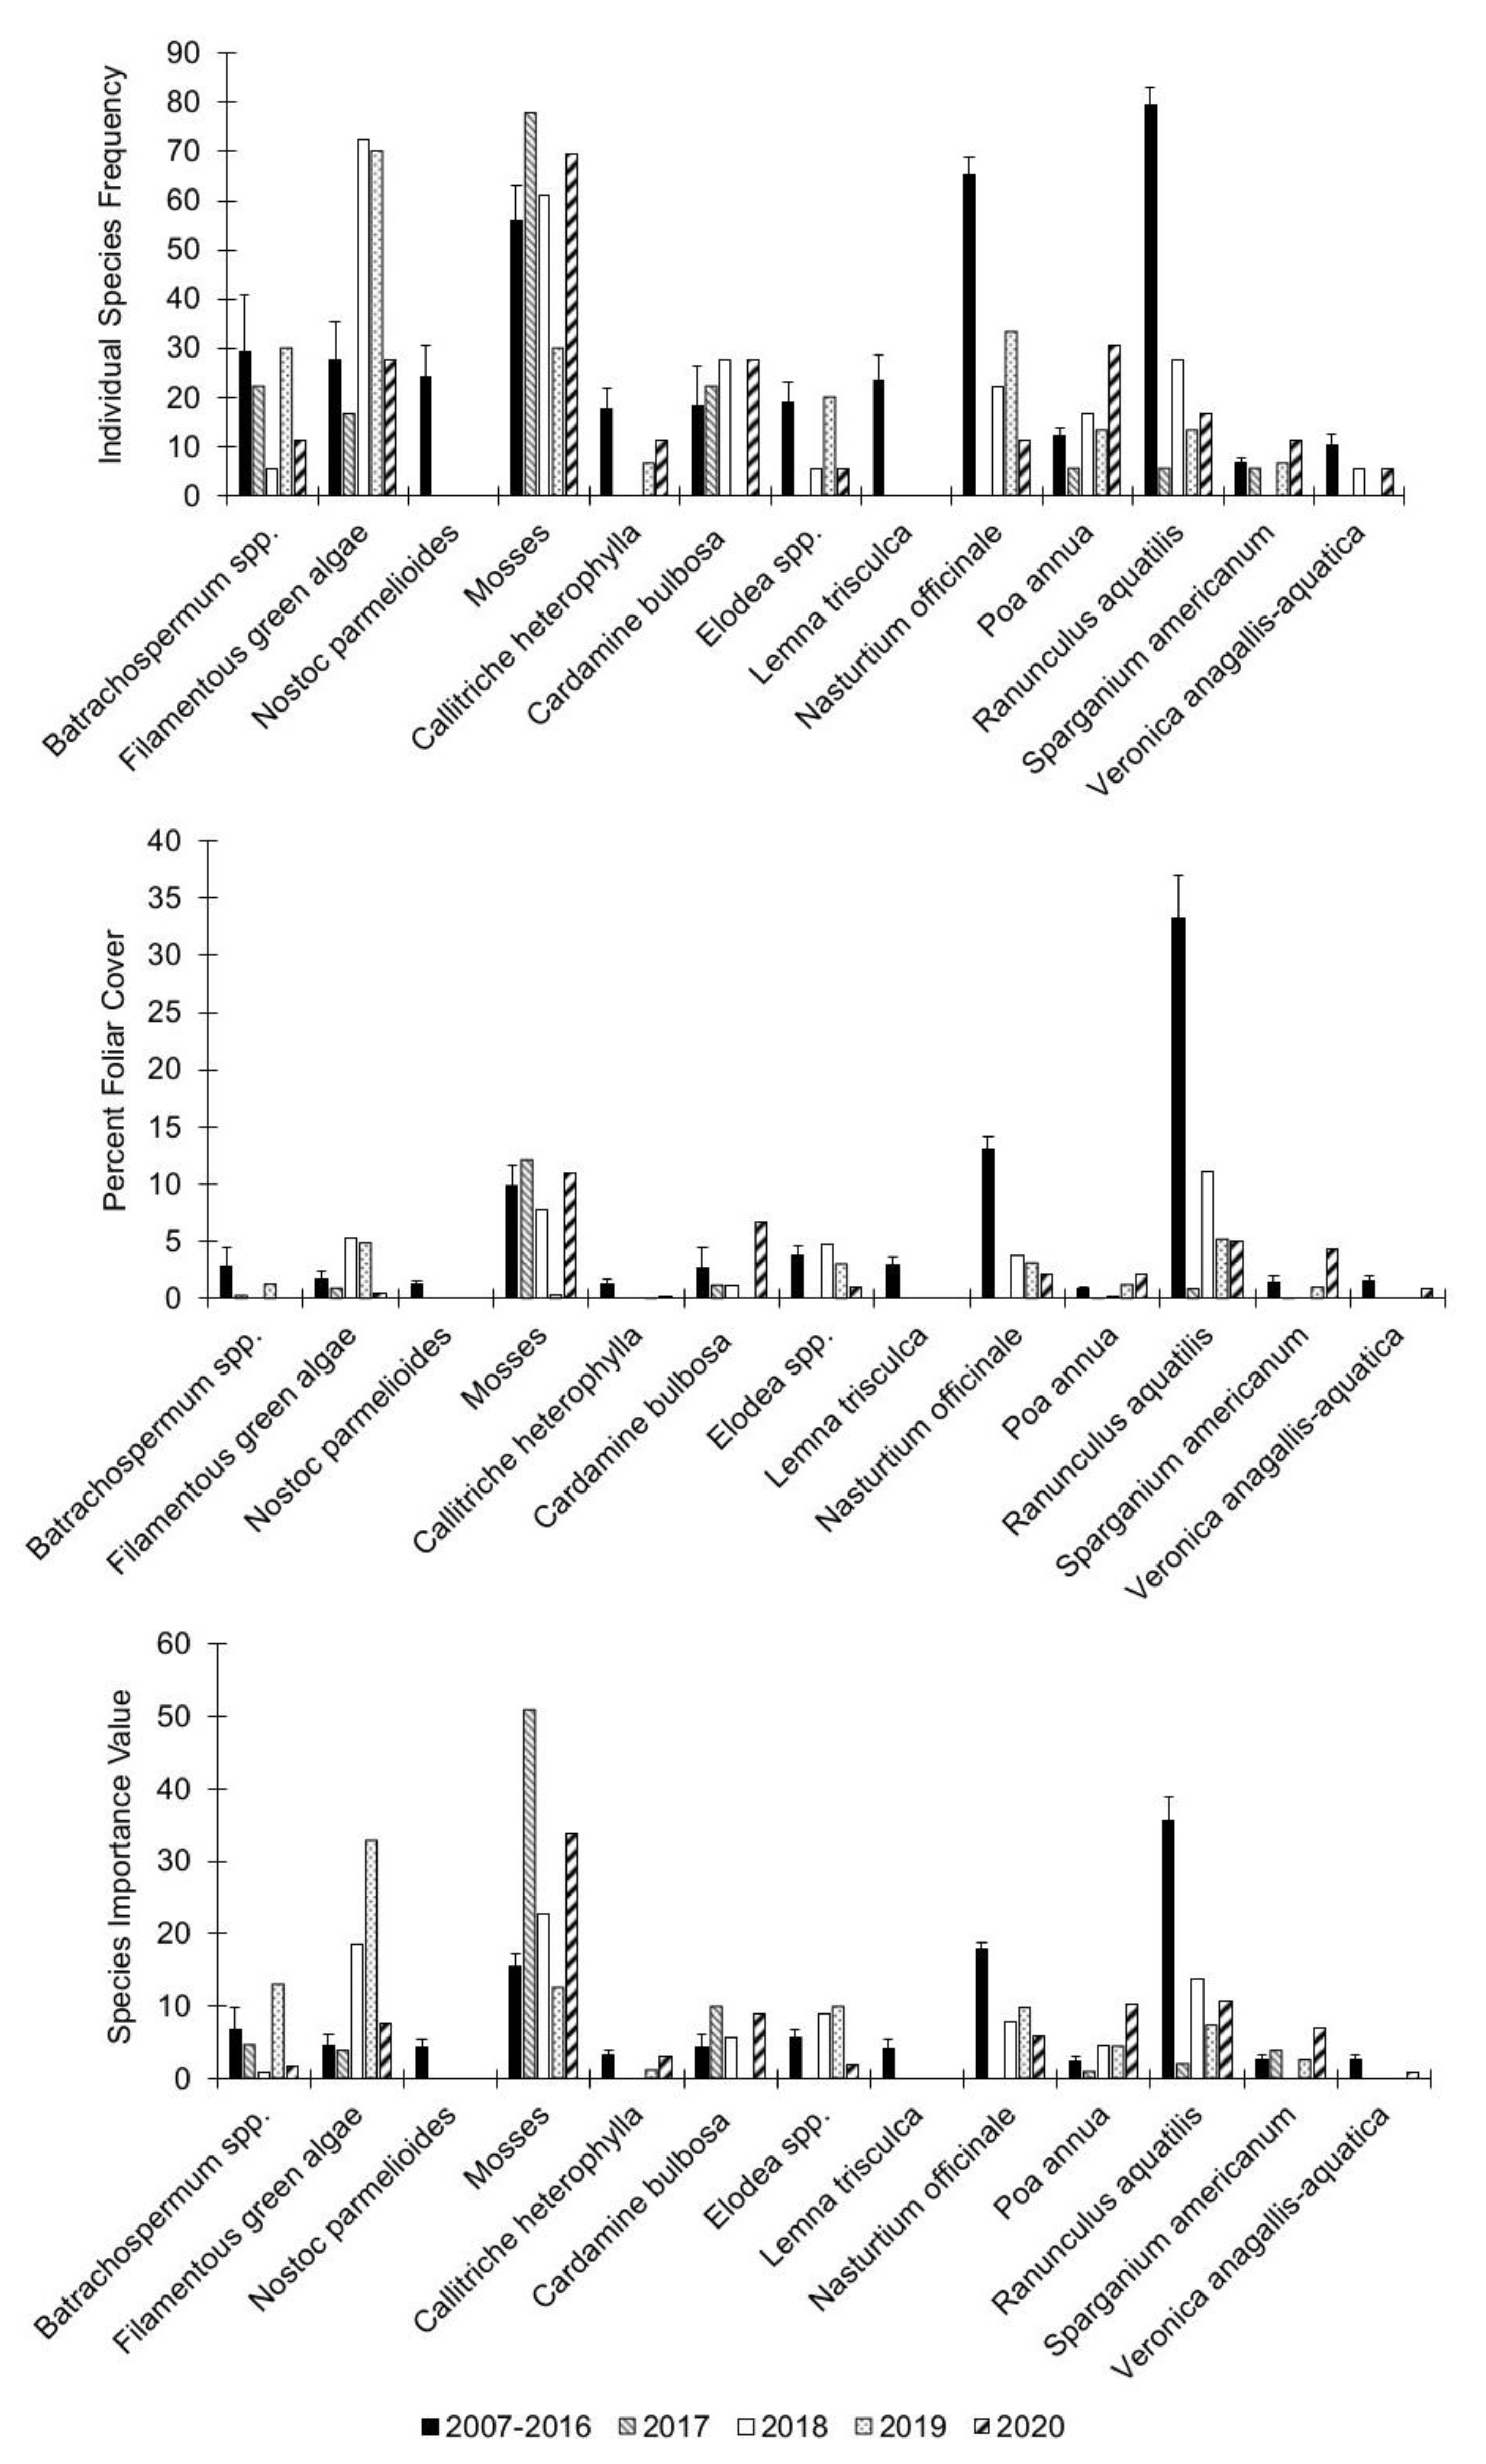
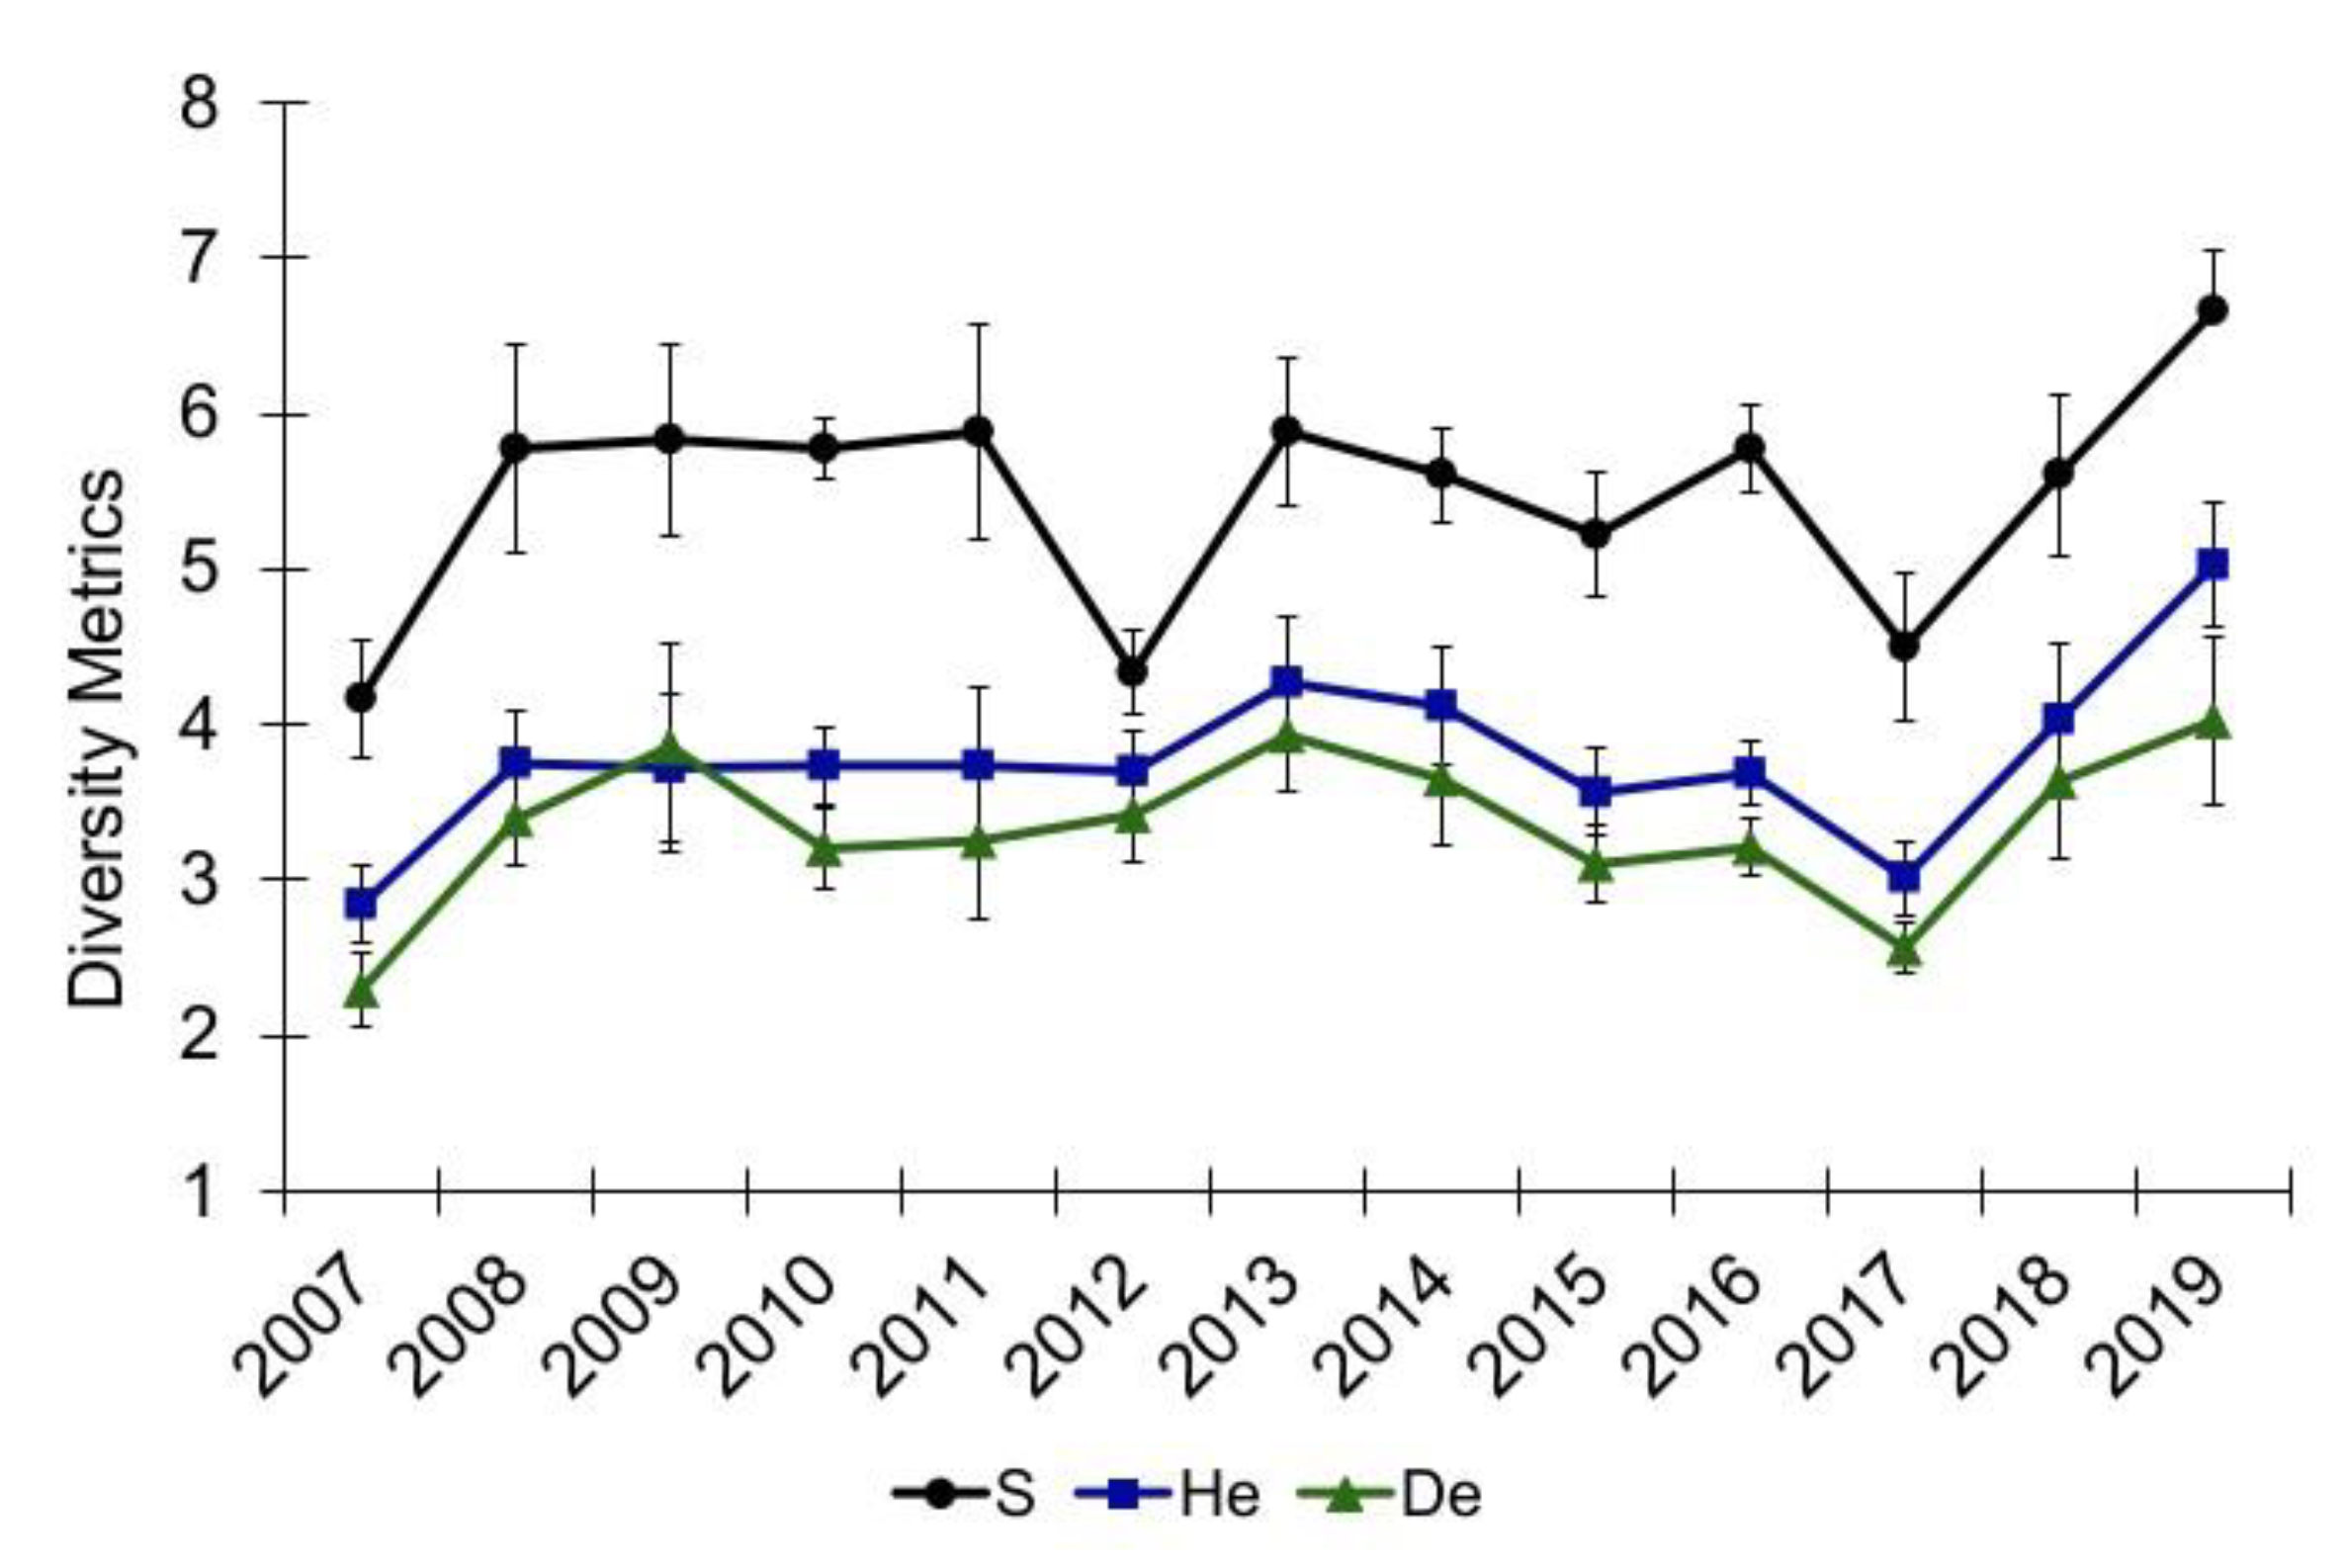
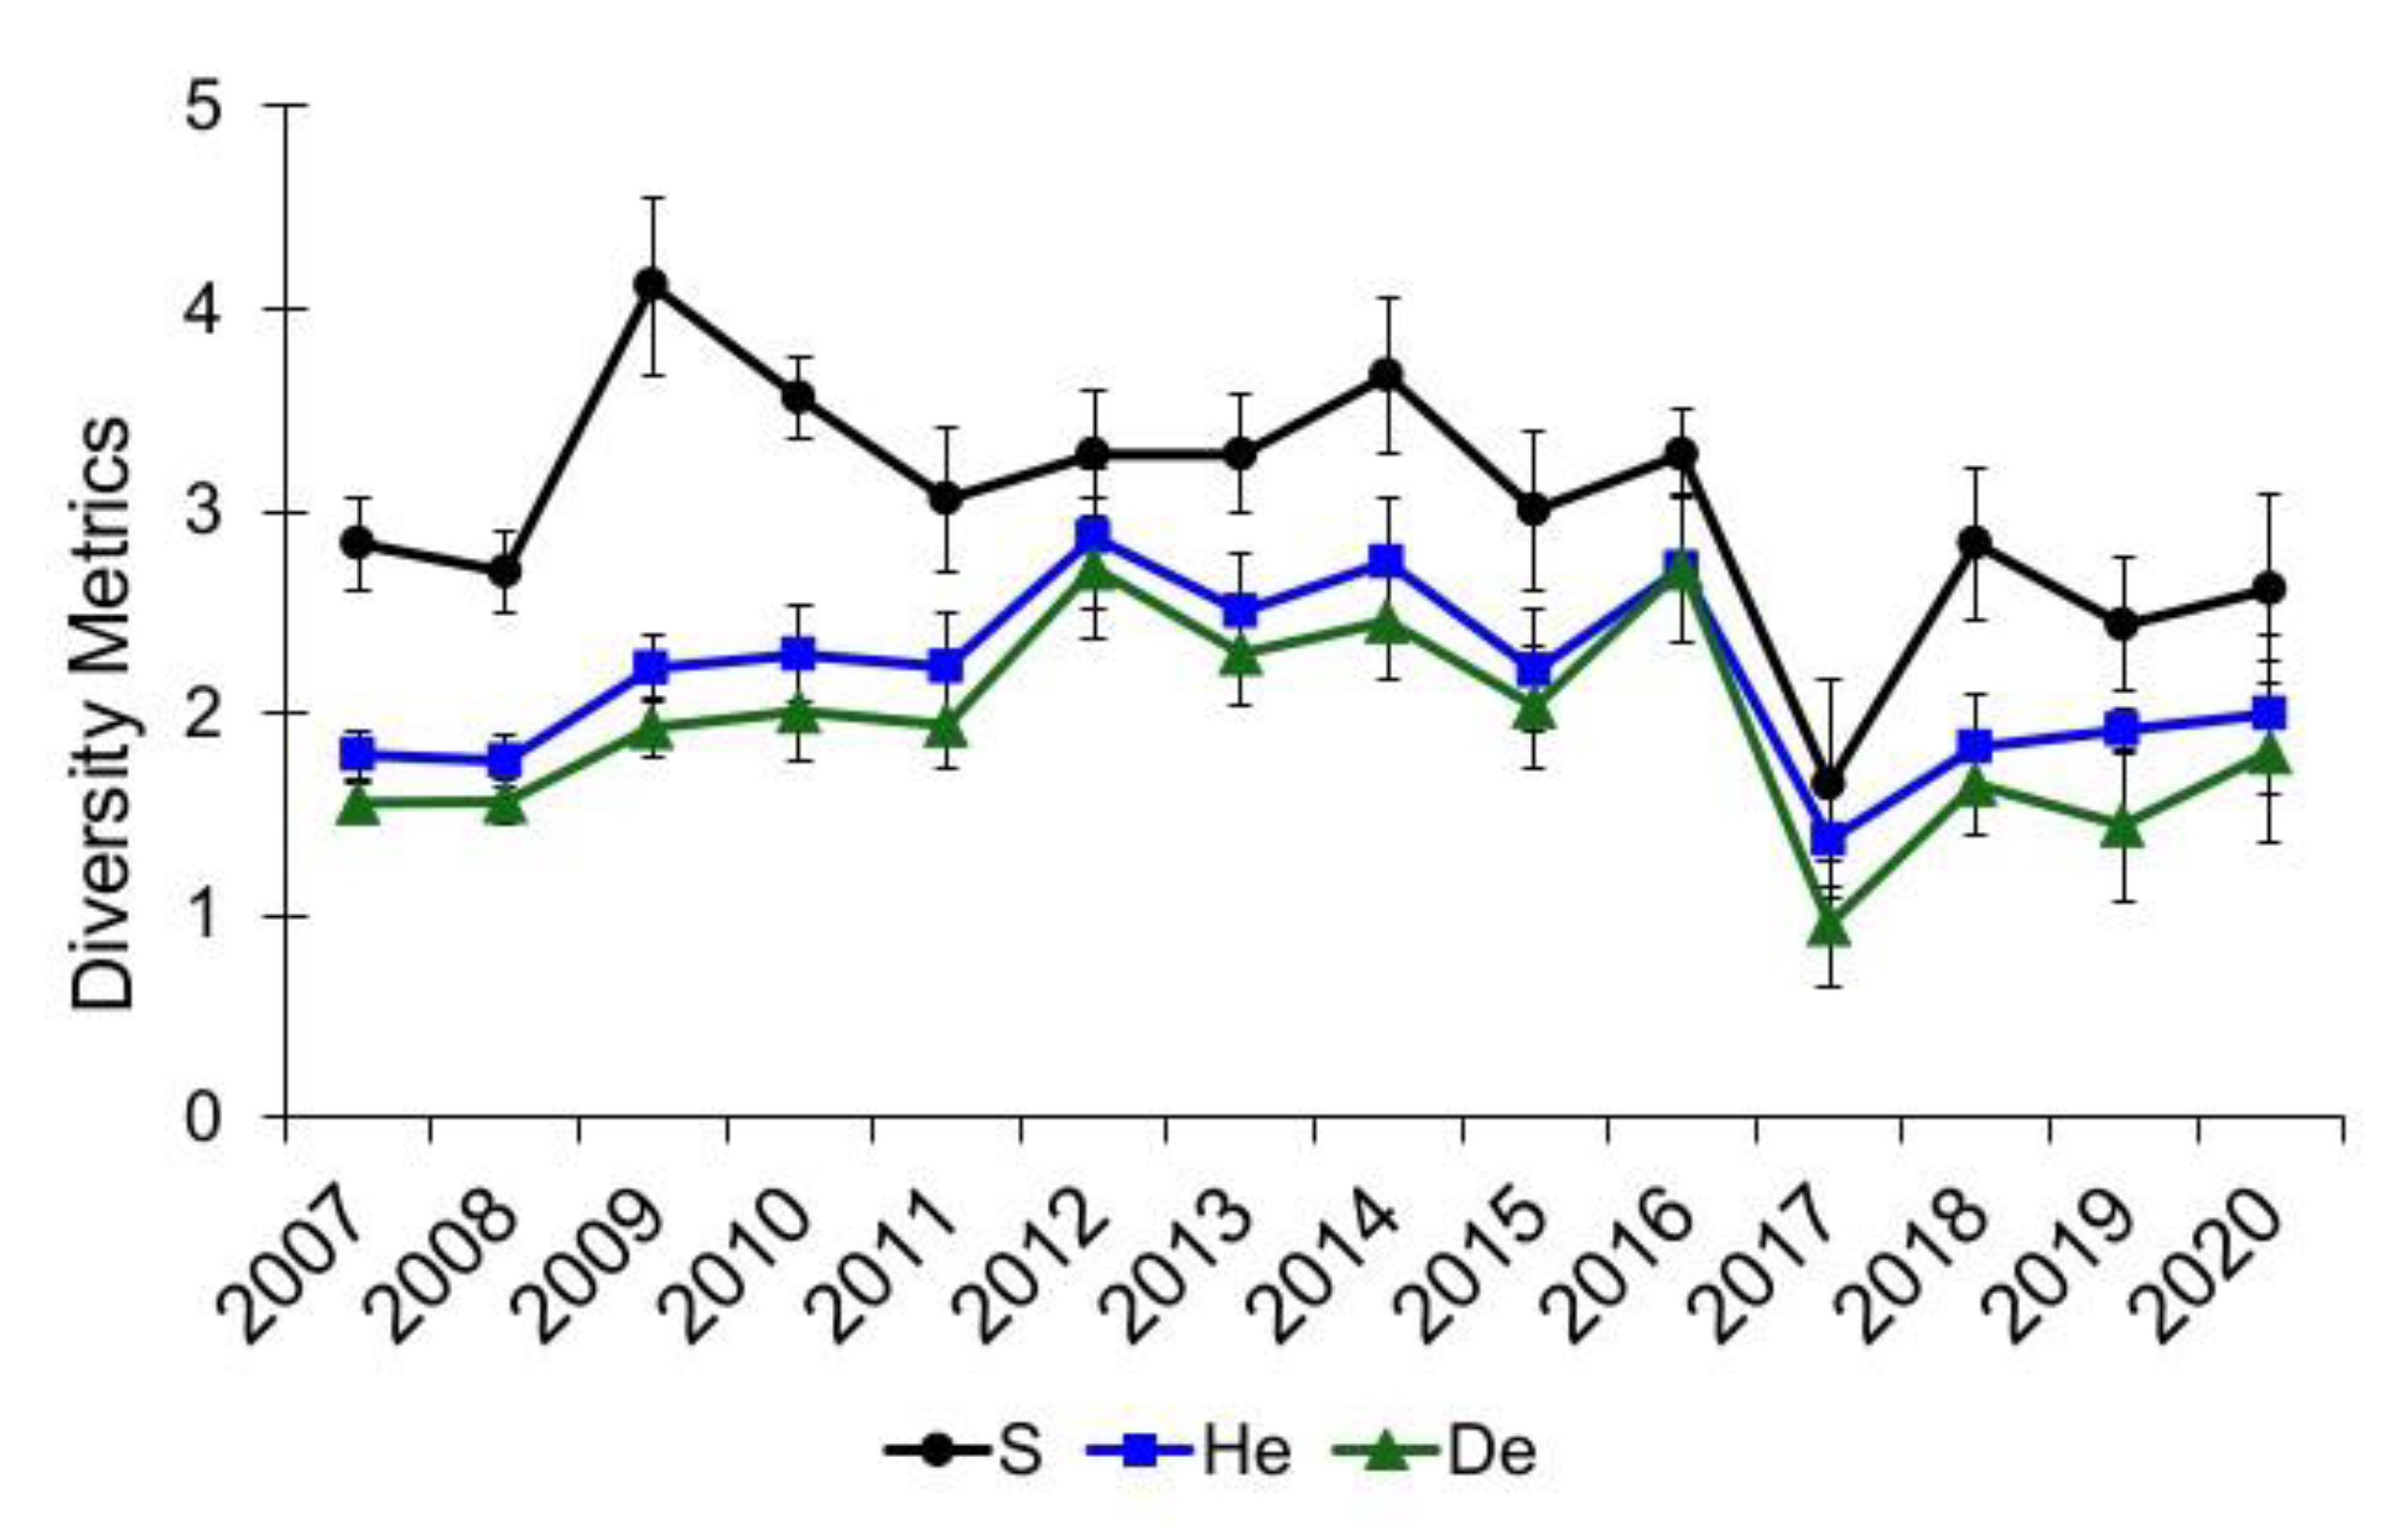
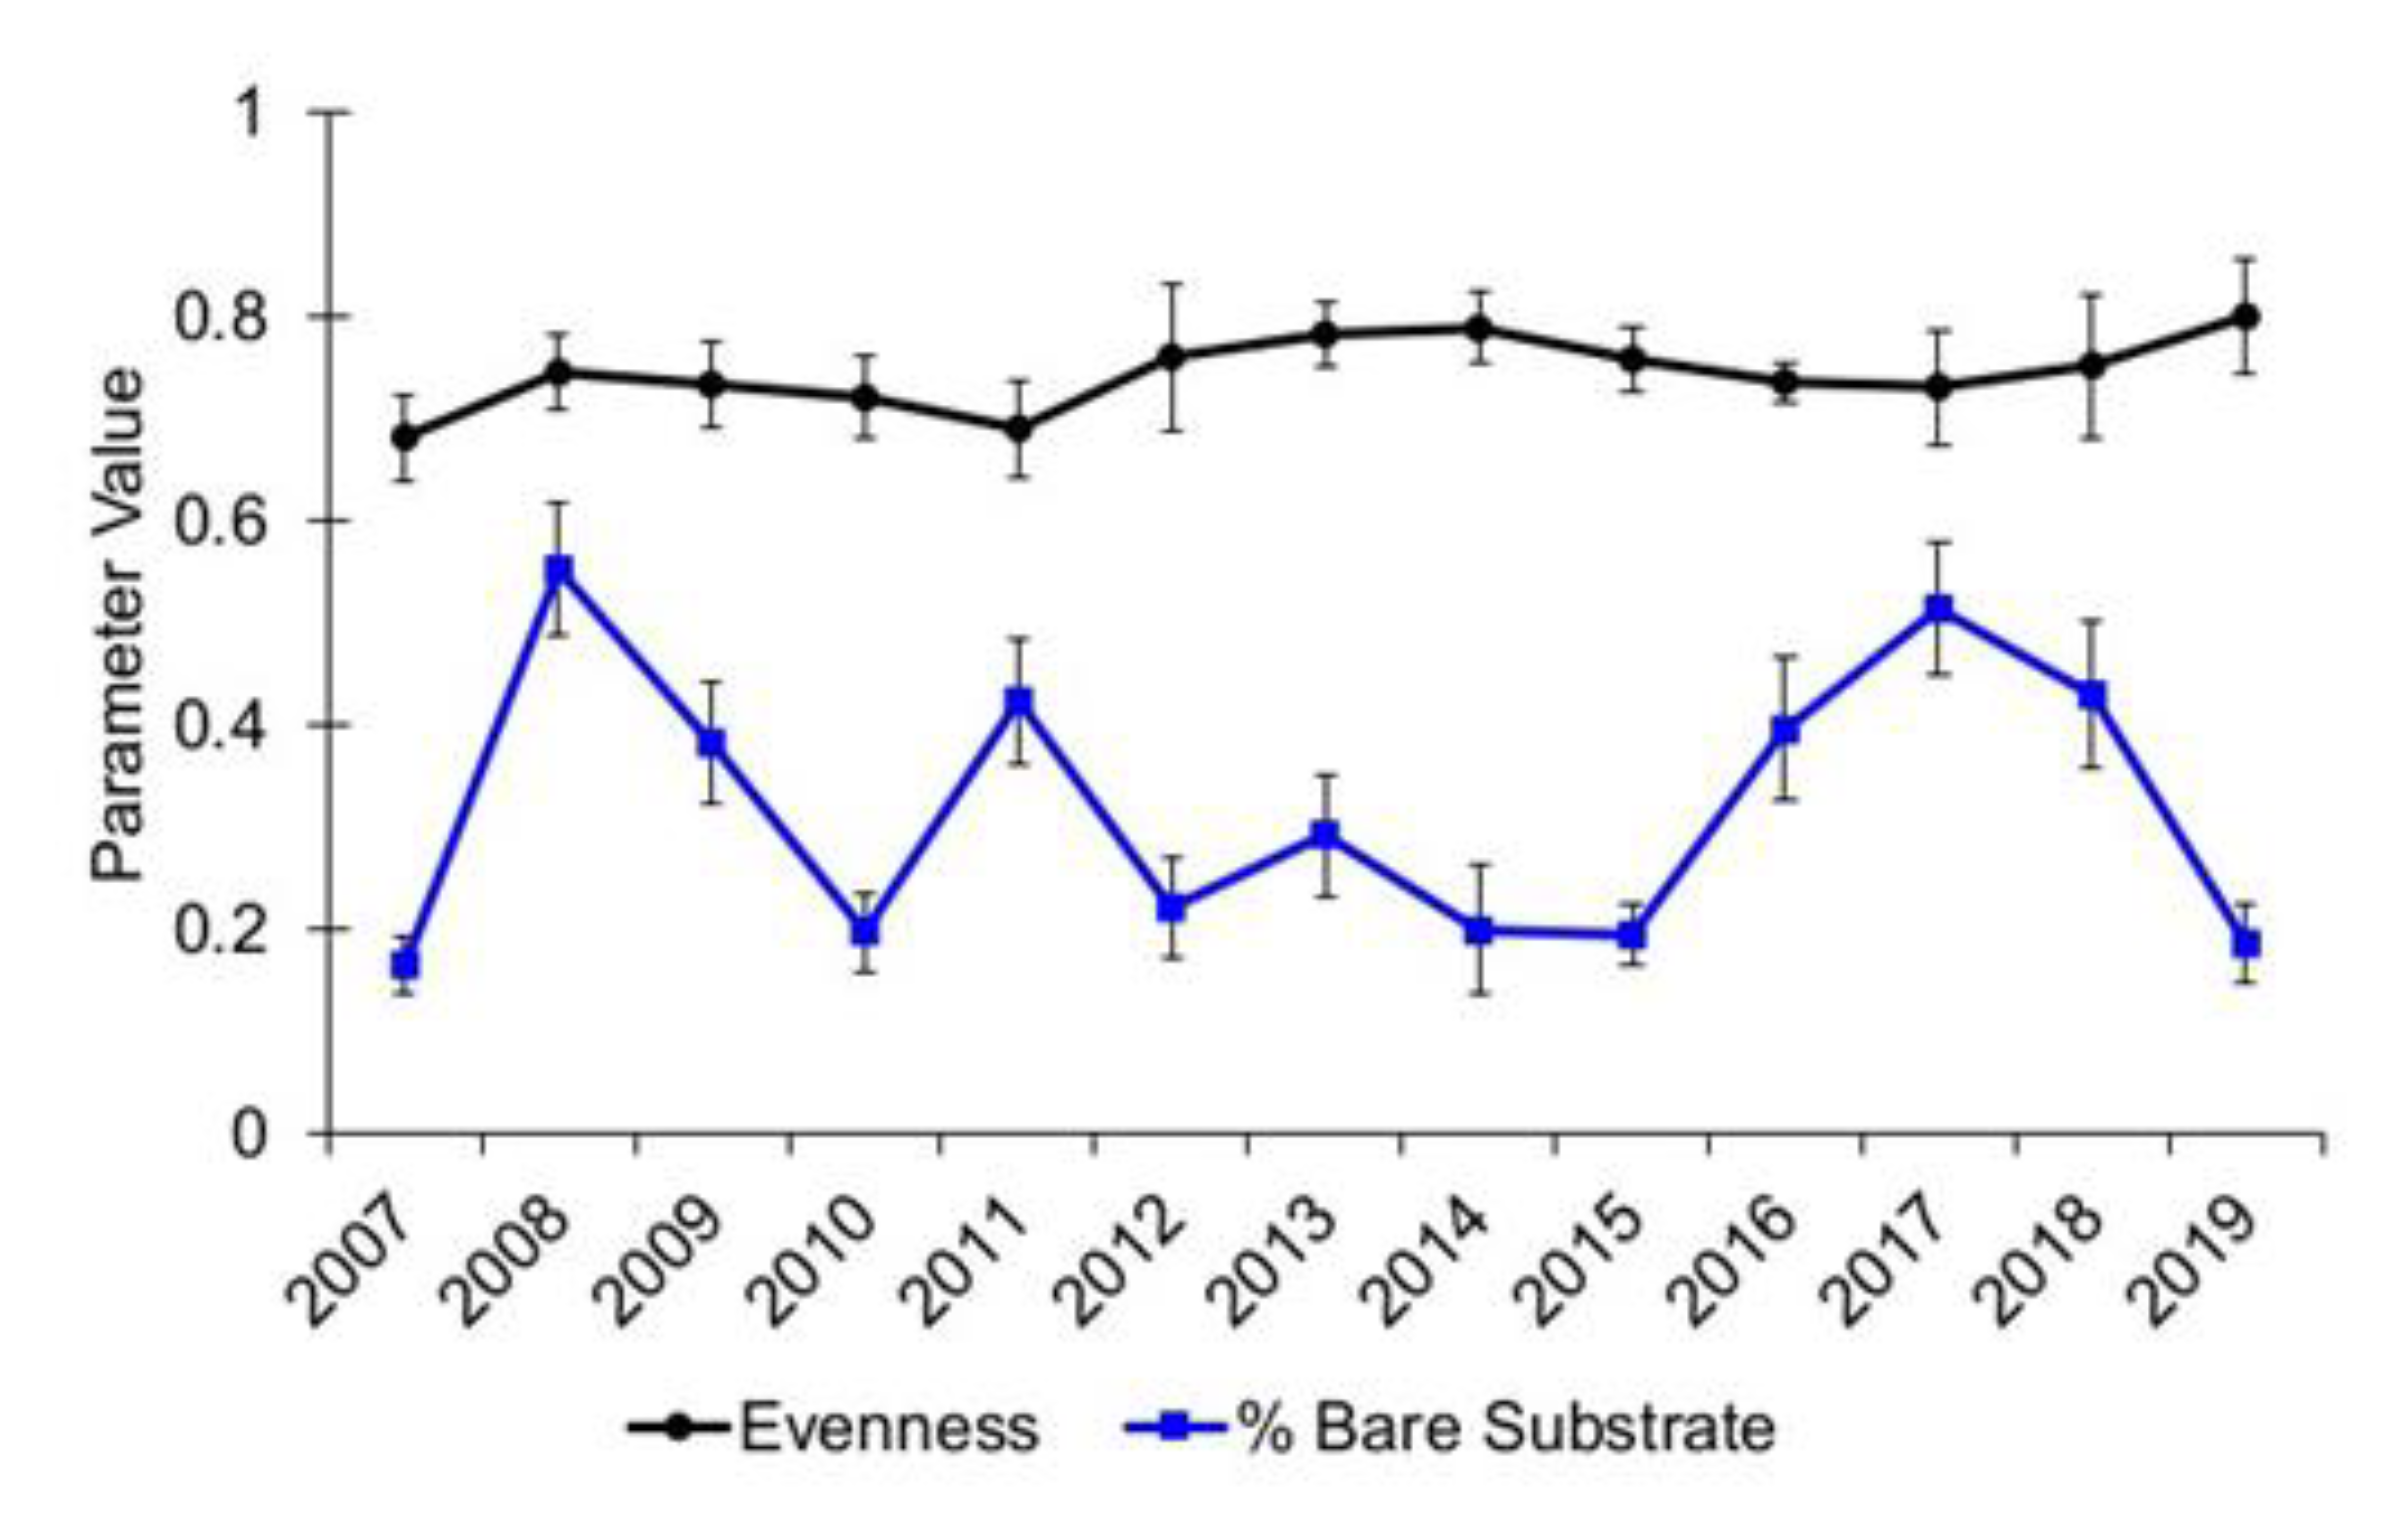
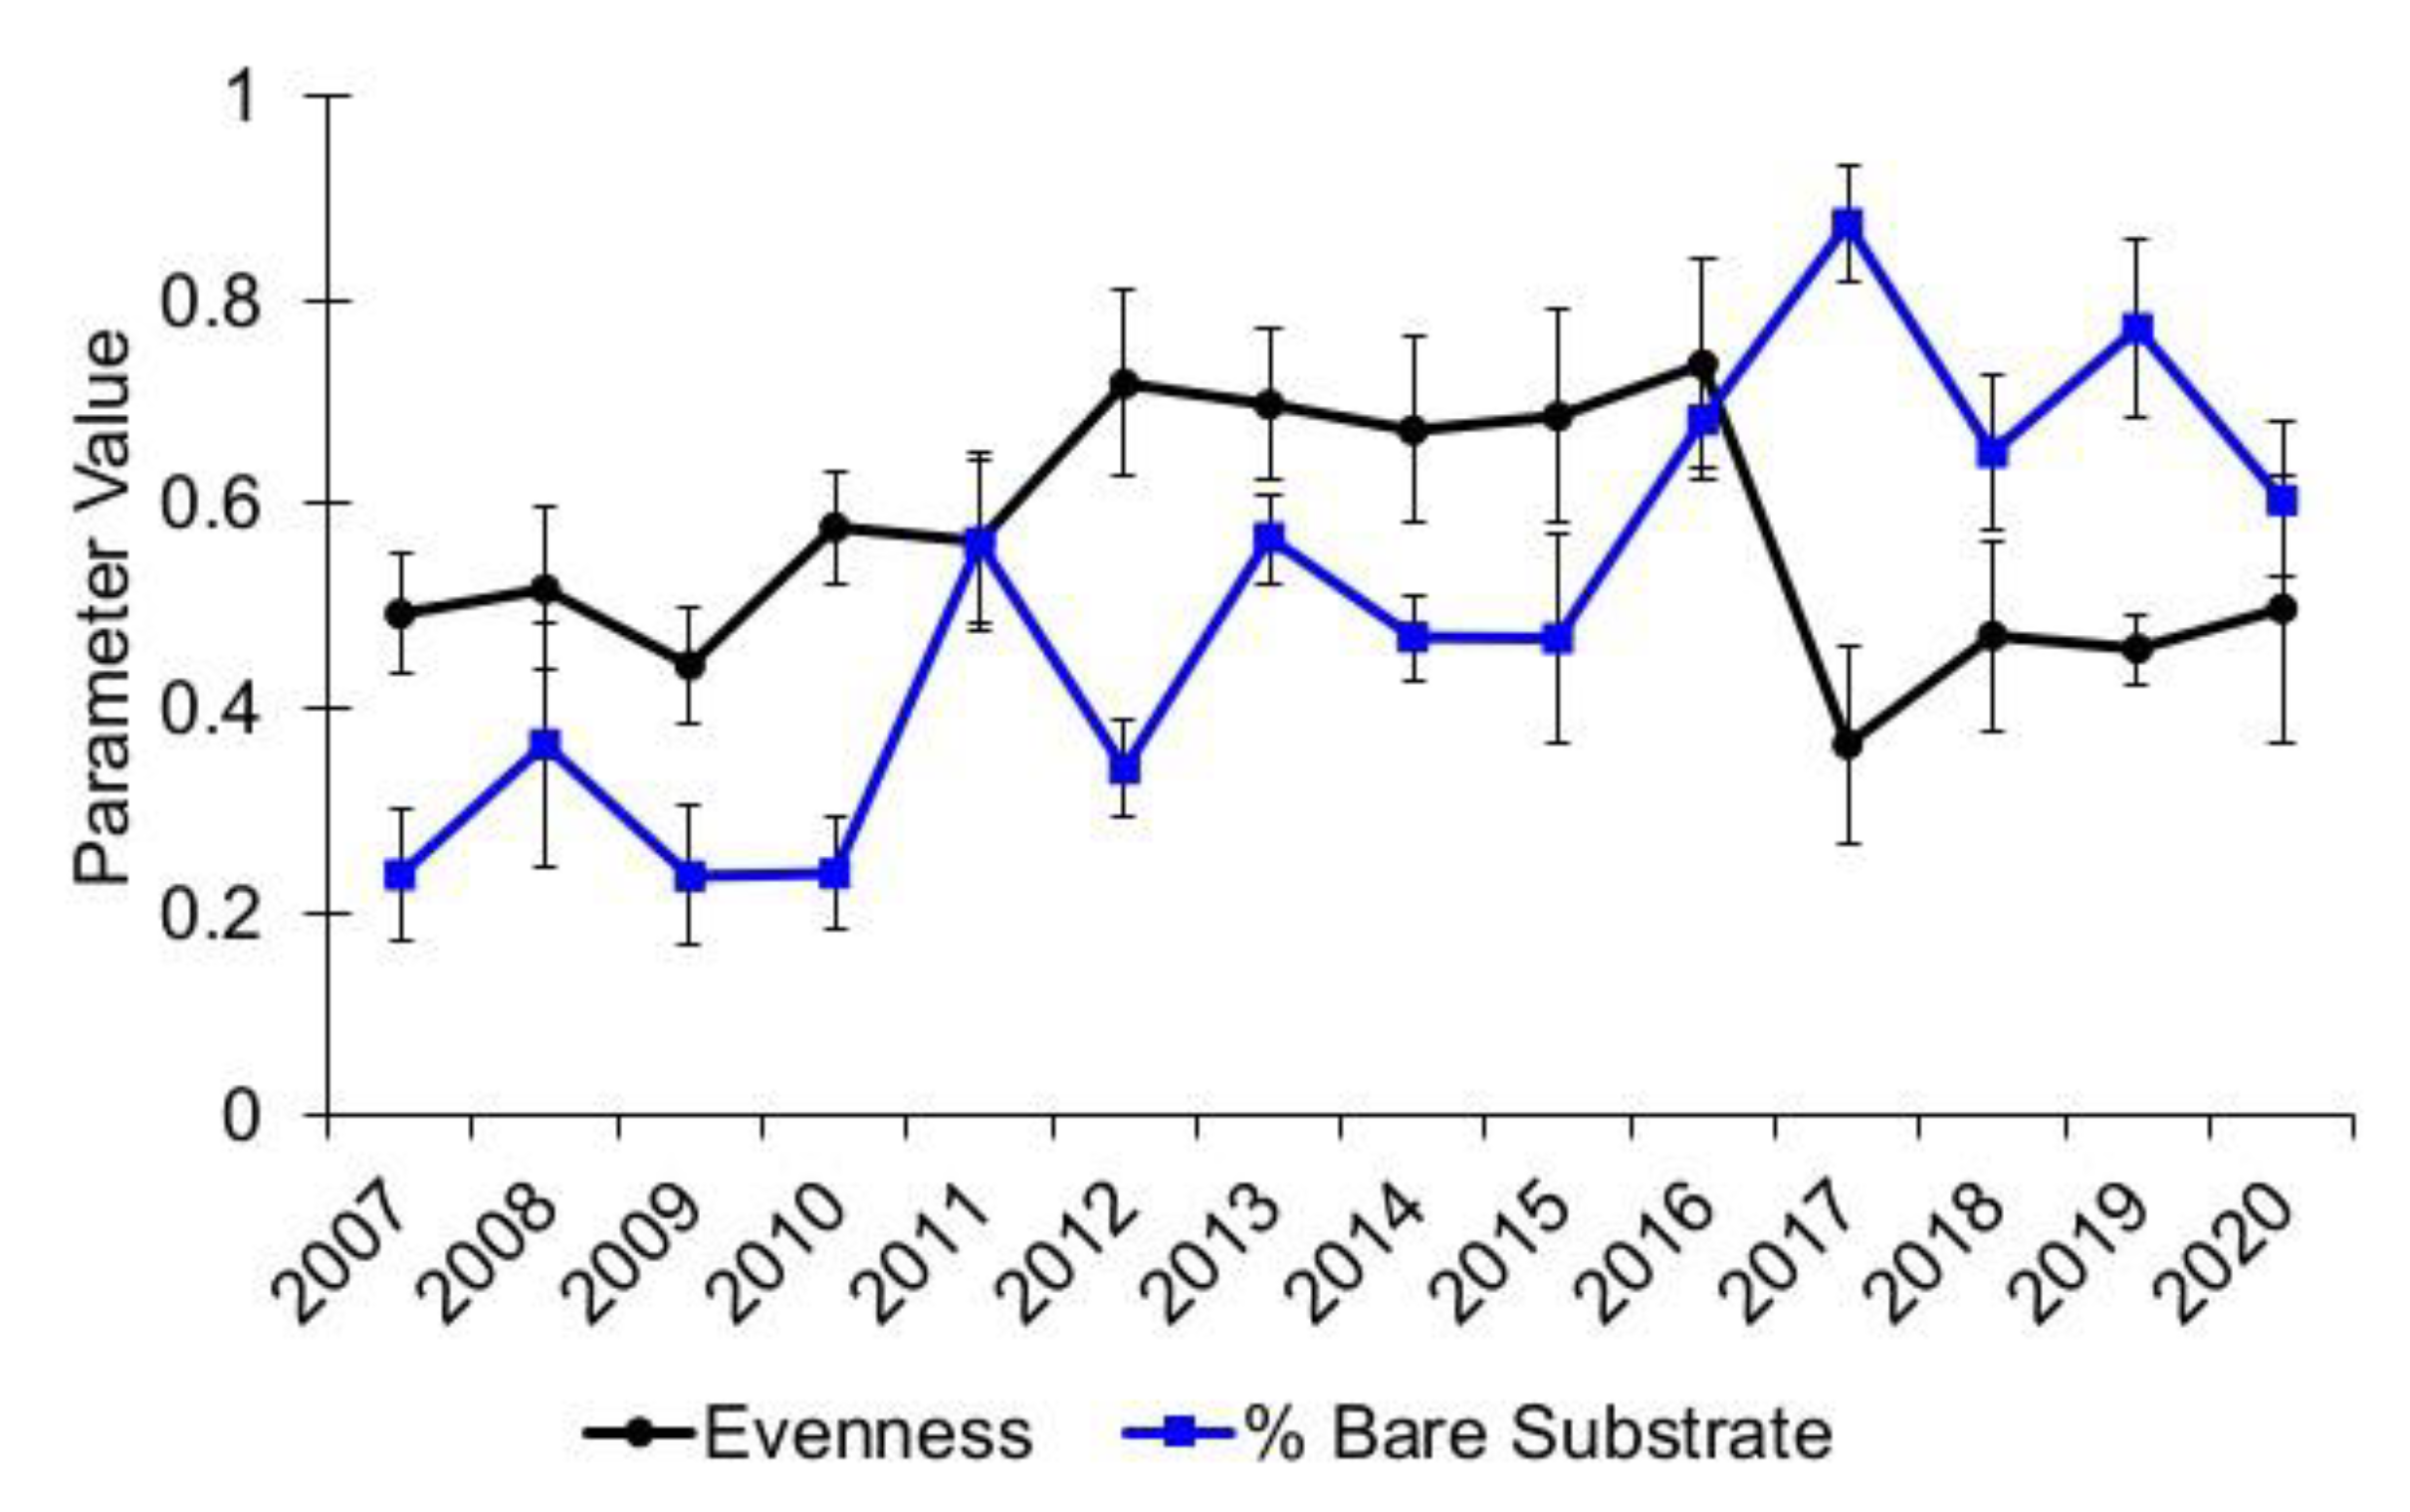
3.1. Community Diversity

Alley Spring and Big Spring experienced catastrophic flood damage to their respective channels, resulting in aquatic vegetation being denuded so that mostly bare substrate remained immediately following the flood (Figure 8). Community diversity metrics (S, He, and De) decreased at Alley Spring in 2017, but they recovered to pre-flood levels in 2018 (Figure 9), and those differences were not significant (Epps–Singleton test p > 0.05, Table 2). Although mean species richness declined in Alley Spring in 2012, He and De did not decline appreciably compared to 2017 when all three metrics decreased (Figure 9). Discharge for Alley Spring in 2012 at the time of sampling was 1.23 m3/s, which was the lowest discharge measured for this site during annual sampling between 2007 and 2017 (mean = 3.62 m3/s). The low flow at Alley Spring in 2012 resulted in a smaller area of channel that was assessed, thus leading to decreased species richness for this site. Similar to that observed for Alley Spring, the community diversity data for Big Spring also decreased following the 2017 flood (Figure 10) and remained below the pre-flood average through 2020, but only the observed decrease in species richness (S) was significant (Epps–Singleton test, p = 0.02, Table 2). Although the observed p-value of 0.08 for He was not significant, biological significance cannot be ruled out.
For Alley Spring, taxa evenness in 2017 remained essentially unchanged from the preceding year (2016), and the comparison of pre- and post-flood data was not significant (Epps–Singleton test, p = 0.93, Table 2). The average evenness at Alley Spring for the 2007–2016 pre-flood period was 0.74 (se = 0.01) while it was 0.73 (se = 0.01) in 2017 (Figure 11). In contrast, taxa evenness for Big Spring in 2017 was 0.36, which is markedly lower than the pre-flood average evenness value of 0.61 (se = 0.03), and it remained lower through the 2020 sampling event (Figure 12). Although the comparison of pre- and post-flood evenness data for Big Spring was not significant (Epps–Singleton test, p = 0.05, Table 2), the potential for biological significance cannot be ruled out.
The amount of bare substrate measured at Alley Spring increased in 2017 (mean = 51.42%) relative to most previous years, although the average amount of bare substrate had been comparably high in other years, especially following floods in 2008 and 2011 (Figure 11). Bare substrate measured in 2019 (mean = 18.65%) show values have largely returned to pre-flood levels in that spring (Figure 11), and the comparison of pre- and post-flood portions of bare substrate in Alley Spring showed they are not significantly different (Epps–Singleton test, p = 0.42, Table 2). Taxa evenness remained higher than the amount of bare substrate in all years at Alley Spring. Data from previous sampling years show the dynamic nature of vegetative cover at this spring. Collectively, the data show that aquatic vegetation at Alley Spring has largely recovered since the 2017 flood.
In contrast, the amount of bare substrate at Big Spring greatly increased following the flood (mean = 87.50%) and remained significantly higher than that recorded during previously sampled years through the 2020 sampling date (Figure 12, Epps–Singleton test, p = 0.02, Table 2). Moreover, taxa evenness was consistently greater than the average amount of bare substrate prior to the flood, but the percentage of post-flood bare substrate remained greater that taxa evenness (Figure 12). The data show that the vegetative community at Big Spring had not fully recovered to pre-flood levels by the 2020 sampling date. Generally, the recovery of vegetation in the two springs was slower than hypothesized, and it occurred at different rates.

3.2. Individual Species Dynamics

Individual species dynamics for the effective number of species at Alley Spring across years showed that various taxa of algae responded positively to the flooding event of 2017 and generally showed increased occurrence and abundance post-flood, which is reflected in their overall higher species importance values (Figure 13). This was especially true for filamentous green algae, whose pre-flood average SIV was 10.56, had increased to 11.58 in 2019. It is noteworthy that the pre-flood mean SIV of 8.36 for the red alga Batrachospermum increased to 23.81 after the flood only to drop precipitously thereafter (Table 3). However, the only significant post-flood responses were for Batrachospermum (PFC, p = 0.005), filamentous green algae (ISF, p = 0.002), and the cyanobacterium Nostoc parmelioides (SIV, p = 0.04) (Epps–Singleton test, Table 3). Mosses, in comparison to algae, at Alley Spring stayed at relatively high densities following the flood and maintained their high species importance values across years sampled. Only the ISF for mosses was significantly higher post-flood (Epps–Singleton test, p = 0.03, Table 3). Moss rhizoids firmly attach to the rock substrate making them more resilient to increased flood velocities during floods.
Hydrophytes at Alley Spring exhibited a broad range of responses in the effective number of species after the flood (Table 3). Most hydrophyte species showed a marked decline in effective numbers of species compared to the pre-flood average, only to rebound and substantially increase in the last year of sampling, thus recovering their approximate species important values relative to their pre-flood averages. However, most of the observed differences were not significant. The exceptions were for Callitriche heterophylla, which had significantly lower PFC post-flood (Epps–Singleton test, p = 0.002), and Veronica anagallis-aquatica had significantly lower ISF and SIV (Epps–Singleton test, p = 0.0003 and 0.004, respectively). Interestingly, the submersed duckweed, Lemna trisulca, exhibited increased frequency, percent foliar cover, and species importance following the flood, but returned to near average values in 2019, although those responses were not significantly different (Epps–Singleton test, p ≥ 0.07).
The plant community at Big Spring showed a much different pattern compared to Alley Spring (Figure 14) with multiple taxa showing significant trends among taxa relative to the post-flood data (Table 3). Similar to that observed for Alley Spring, filamentous green algae showed dramatic increases in frequency, cover and species importance values in the years following the flood and remaining higher that the pre-flood average three years after the flood in 2020 (Figure 14), but those differences were not statistically significant (Table 3). Similarly, Batrachospermum also showed no significant differences pre- and post-flood. Nostoc parmeliodies could not be tested because no examples of this species were not detected in post-flood samples. Thus, although it could not be tested statistically, the population of N. parmelioides, in Big Spring clearly was negatively impacted suggesting that the effects of scouring may be long-term. Moss showed a recovery response similar to that observed at Alley Spring, and it generally retained a high species importance value at Big Spring (SIV = 33.75 in 2020).
In stark contrast to Alley Spring, several species of hydrophytes in Big Spring had marked decreases in their respective frequency, foliar cover and species importance values (Table 3). In the post-flood years at Big Spring, recovery of most hydrophyte species has been slow with metric values far lower compared to those of the pre-flood years. The most striking examples of this response were for Nasturtium officinale and Ranunculus aquatilis, which showed significant differences in pre- and post-flood responses for ISF, PFC, and SIV (Epps–Singleton test, p < 0.0001), and V. anagallis-aquatica, for which ISF and SIV were significantly different (p < 0.0001). Veronica anagallis-aquatica with a pre-flood SIV of 2.61 was not found again in Big Spring until sampling was conducted in 2020. For N. officinale, the pre-flood average SIV was 17.81, but the SIV did rise above 9.77 through the 2020 sampling event. Similarly, the pre-flood average SIV for R. aquatilis was 35.52, but following the flood the SIV has not increased above 13.76. In contrast, the non-native grass (Poa annua) gained in frequency, foliar cover, and importance following the flood, although these gains were not significant. The emergent bur reed (Sparganium americanum) and spring cress (Cardamine bulbosa) exhibited reduced foliar cover in the post-flood years, but, conversely, their importance values in the community increased after the flood, thus indicating their resilience to flooding. For C. bulbosa, the observed post-flood decrease in ISF and increase in SIV were significant (Epps–Singleton test, p < 0.0001).

4. Discussion

The most important findings of this study are that loss and recovery of aquatic vegetation in high-magnitude Ozark springs following flooding primarily are a function of flood intensity as well as geomorphology of the spring channel, especially substrate size and retention. Although Alley and Big springs each experienced previous floods during the period for which annual plant monitoring data had been collected (particularly in 2008 and 2011), those floods did not result in a loss of vegetation similar to the magnitude observed after the 2017 flood. The flood reported in this study was the flood of record, and it resulted in historically high, scouring flows at both springs that were sustained for over a month.
This study showed that individual species metrics (ISF, PFC, and SIV) were the strongest indicators of disturbance and recovery evaluated based on the number of significant results. Bare substrate and evenness also showed distinct responses, which are useful for assessing recovery. In contrast, diversity metrics (S, He, and De) for both springs generally did not provide statistically significant responses, especially for Alley Spring. However, those results do not obviate biological significance because diversity in each spring did markedly decrease following the flood. This unexpected response may be due to the relatively small sample size in this study (i.e., ≤14 years), which may not be sufficient for detection of significant change. Larger sample sizes may show those diversity metrics to be more robust indicators of disturbance. Regardless, diversity metrics were a strong visual tool for showing when impacts occurred in the springs in this study. Collectively, all of the previous metrics should be considered when evaluating impacts to these springs.
The physically destructive hydrodynamic forces that occur during floods can substantially decrease plant biomass (e.g., mechanical fragmentation and uprooting), as well as alter the geomorphological profile of the channel (e.g., substrate alteration) [11,12,14,37,38,39,40]. Previous research has shown that current velocities of less than 0.5 m/s generally result in positive growth rates of most submersed plants [40], while velocities in excess of 1 m/s usually decrease their presence and abundance [12]. Point velocities within the channels of both Alley and Big springs commonly exceed 0.5 m/s [41], yet the springs in this study contain a broad diversity of aquatic vegetation with substantial areal coverage [26]. The stability of springs systems and lower flooding frequency and intensity compared to streams and rivers may help account for this discrepancy. Indeed, Kim and Choi [42] found that flow turbulence rather than flow velocity is what causes most damage to plants during floods, and that appears to be true for the large springs in this study.
The extent of the damage sustained by individual plants is directly related to the morphology of the plant species as well as their root system structure [43,44,45,46]. Although high breaking and anchoring strength are the primary adaptations for resisting mechanical damage from water movement, stressors damage the plants when they can no longer resist breaking or uprooting at a certain point [44,45,46,47]. Scouring floods surpass those resistance mechanisms leading to excess breakage or uprooting of aquatic plants, and it also can wash out fine sediment along with seed banks. Moreover, higher-magnitude floods, at a certain point, result in catastrophic damage to plants because uprooted vegetation and other debris itself become destructive to other downstream vegetation as well as channel integrity [48]. All of these stressors appear to have been involved in the removal of vegetation from Alley and Big springs.
Higher frequency and magnitude of flooding generally result in decreased plant development and establishment, but infrequent, low-intensity flooding can provide optimum conditions for plant development [15,46,49,50]. This was substantiated by Haslam [1], who found that a flood in rivers of 2.5-fold the normal flow regime removed some of the dominant aquatic plants in a stream, but a flood of 4-fold the normal flow rate removed half the dominant species and most of small plants. Even though interflood water velocities might be favorable, few or no macrophytes will be present soon after intense or frequent floods [46]. That finding mirrors my observations at Alley and Big springs following the 2017 flood where the channels of each spring were heavily scoured nearly three months later.
In this study, some species in the springs were substantially impacted by the flood while others suffered less impacts and even demonstrated increased foliar coverage in subsequent years. Notably, the observed increases among algae in this study following the flood may be due to decreased competition for space and sunlight with hydrophytes that were substantially impacted by the scouring. The broader range of responses among hydrophytes in this study likely indicate some species have more adaptive potential to higher water velocities, while other species are more vulnerable to destruction and may lose most of their biomass during floods [1,40,46,51]. Two species represented in this study, Veronica anagallis-aquatica and Nasturtium officinale, have been shown to have high susceptibility to stem breakage at high current velocities [46], which was apparent in this study. In addition, Riss and Biggs [46] also found that Ranunculus trichophyllus, a species with morphology similar to R. aquatilis, had an optimum water velocity ranging from 0.4 to 0.6 m/s, beyond which plant damage occurred. While specific current velocities in either of the springs were not measured during the flood, it is strongly suspected that velocities greatly exceeded 1 m3/s, thus helping to explain why that species was so readily removed from Big Spring.
Substrate size and stability have been shown to be important in plant responses and survivability to flooding [37,46], and it appears substrate size played a key role in the response of vegetation to flooding in this study. Depending on channel slope and substrate size of a stream, floods may flush or bury propagules, completely remove deposits of fine sediment in some cases, or lead to the deposition of fine sediment in other situations [40,47,51]. Furthermore, the presence of aquatic vegetation in a spring channel can influence local substrate composition by increasing roughness and retention of substrate up to some current velocities, especially fine grain sizes [37,39,46]. Scouring eliminates those substrate deposits, thus further exacerbating plant damage by removing roots. As reported here, the recovery response of the plant community at Alley Spring was faster compared to Big Spring. This finding is attributed to the larger, less mobile substrate of the former spring compared to the finer substrate of the latter, which was more resistant to scouring and allowed better retention of root masses and propagules. The finer substrates in Big Spring likely resulted in a higher flush rate or loss of plant propagules (i.e., roots, seeds, fragments) from the substrate, which delayed recolonization and recovery [39,52,53,54,55,56]. Indeed, plants with extensive roots systems in well anchored substrates have a better chance of not being uprooted in floods although their leaves may be damaged [1,39,43,53,57,58]. Additionally, the elevated discharge and scouring potential at Big Spring was sustained much longer than that of Alley Spring due in part to its close proximity and parallel orientation to its receiving stream, the Current River, which allowed for mixing of flood waters from the two systems, thus augmenting the intensity of the flood in the spring channel. These various impacts were more severe in Big Spring during the flood, and it likely explains the slower recovery of the vegetation community in that spring.
The springs in this study are much less dynamic and are comparatively stable with scouring floods occurring less frequently compared to surface streams. Thus, the recovery mechanisms exhibited by spring-inhabiting plant species may not allow them to respond or recover as quickly. The results of this study show that large springs take far longer to recover from a scouring flood. Such a response may be applicable to spring ecosystems worldwide. The data presented here also show that there is a standard need for an increased sample size and frequency following flood events to adequately capture taxa richness due and community evenness. Impacts to aquatic vegetation in springs following scouring floods may last years before recovery is fully achieved. Therefore, monitoring aquatic vegetation following a major flood may yield skewed results, which in turn may erroneously influence management decisions by conservation organizations.

5. Conclusions

This study showed that recovery of aquatic vegetation in large springs following a major flood can be a long process, taking months to years to complete. This study also showed that rate of recovery is related to an assemblage of variables including flood magnitude and duration, and channel characteristics such as substrate size and retention. Future research efforts in these springs should include assessments of flood impacts on individual species, including the role of factors such as root type, mass, and retention, interactions with other species, as well as microhabitat characteristics.

Author Contributions

The author was responsible for all aspects related to this paper, including data collection, analyses, and writing. The author has read and agreed to the published version of the manuscript.

Funding

This research received no external funding. Data collection was funded by the United States National Park Service.

Institutional Review Board Statement

Not applicable.

Informed Consent Statement

Not applicable.

Data Availability Statement

All data used in this study are deposited in the official databases of the Heartland Inventory and Monitoring Network, United State National Park Service, Wilson’s Creek National Battlefield, 6424 West Farm Road 182. They are available upon request.

Acknowledgments

This study was completed while the senior author worked for the National Park Service. I thank Victoria Grant for some enlightening discussions relative to this paper. I also thank several people for assisting with fieldwork over the course of this study including Hope Dodd, Tyler Cribbs, Jan Hinsey, Jeff Williams Cameron Cheri, Jessica Luraas, Catherine Ciak, Mike Gossett, John Dotten, Jennifer Haack, Ryan Green, Myranda Clark, Beth Bailey, Kevin Murray, Mike DeBacker, Gina Botella, Melanie Weber, Zach Morris, Allison Keefe, Kristen Kohlhepp, Robin Graham, Chris Morris, Josh DeLay, and Joe Chilton. The constructive comments of five peer reviewers on an early draft of the manuscript is greatly appreciated and resulted in an improved paper. The interpretations of the data in this paper are solely those of the author.

Conflicts of Interest

The author declares no conflict of interest.

References

  1. Haslam, S.M. River Plants, the Macrophytic Vegetation of Watercourses, 2nd revised ed.; Forrest Text: Sŵn y Nant, UK, 2006; p. 438. [Google Scholar]
  2. Jackson, M.B.; Colmer, T.D. Response and adaptation by plants to flooding stress. Ann. Bot. 2005, 96, 501–505. [Google Scholar] [CrossRef] [PubMed]
  3. Bailey-Serres, L.; Voesnenek, L.A.C.J. Flooding stress: Acclimations and genetic diversity. Annu. Rev. Plant Biol. 2008, 59, 313–339. [Google Scholar] [CrossRef] [PubMed] [Green Version]
  4. Colmer, T.D.; Voesenek, L.A.C.J. Flooding tolerance: Suites of plant traits in variable environments. Funct. Plant Biol. 2009, 36, 665–681. [Google Scholar] [CrossRef] [PubMed]
  5. Jackson, M.B.; Ishizawa, K.; Ito, O. Evolution and mechanisms of plant tolerance to flooding stress. Ann. Bot. 2009, 103, 137–142. [Google Scholar] [CrossRef] [PubMed] [Green Version]
  6. Peralta, P.; Armstrong, W.; Voesenek, L.A.C.J. Plants and flooding stress. New Phytol. 2011, 190, 269–273. [Google Scholar] [CrossRef]
  7. Caudle, K.L.; Maricle, B.R. Effects of flooding on photosynthesis, chlorophyll fluorescence, and oxygen stress in plants of varying flooding tolerance. Trans. Kansas Acad. Sci. 2012, 115, 5–18. [Google Scholar]
  8. Jones, J.I.; Collins, A.L.; Naden, P.S.; Sear, D.A. The relationship between fine sediment and macrophytes in rivers. River Res. Appl. 2012, 28, 1006–1018. [Google Scholar] [CrossRef]
  9. Herrera, A. Responses to flooding of plant water relations and leaf gas exchange in tropical tolerant trees of a black-water wetland. Front. Plant Sci. 2013, 4, 106. [Google Scholar] [CrossRef] [Green Version]
  10. Voesenek, L.A.C.J.; Bailey-Serres, J. Flood adaptive traits and processes: An overview. New Phytol. 2015, 206, 57–73. [Google Scholar] [CrossRef]
  11. Henriques, J. Aquatic macrophytes. In Aquatic Biology and Hydroelectric Power Development in New Zealand; Henriques, P.R., Ed.; Oxford University Press: Auckland, New Zealand, 1987; pp. 207–222. [Google Scholar]
  12. Chambers, P.A.; Prepas, E.E.; Hamilton, H.R.; Bothwell, M.L. Current velocity and its effect on aquatic macrophytes in flowing waters. Ecol. Appl. 1991, 1, 249–257. [Google Scholar] [CrossRef]
  13. Tremolieres, M.; Carbiener, R.; Ortscheit, A.; Klein, J.-P. Changes in aquatic vegetation in Rhine floodplain streams in Alsace in relation to disturbance. J. Veg. Sci. 1994, 5, 169–178. [Google Scholar] [CrossRef]
  14. Sangmek, P.; Meksumpun, C. Influence of eco-hydrological factors on aquatic plant succession in a regulated river: A case study of the Petchburi River, Thailand. Water Environ. J. 2015, 29, 243–251. [Google Scholar] [CrossRef]
  15. Czarnecka, B.; Rysiak, A.; Chabudziński, L. Spring flora diversity versus ecosystem stressors: Case studies from the Western Roztocze and Lublin Upland border, South-East Poland. Ecohydrol. Hydrobiol. 2020, 20, 693–706. [Google Scholar] [CrossRef]
  16. Steyermark, J.A. Studies of the vegetation of Missouri—II. Phanerogamic flora of the freshwater springs in the Ozarks of Missouri. Publ. Field Mus. Nat. Hist. Bot. Ser. 1941, 9, 476–641. [Google Scholar]
  17. Lemke, D. Aquatic macrophytes of the upper San Marcos River, Hays Co., Texas. Southwest. Nat. 1989, 34, 289–291. [Google Scholar] [CrossRef]
  18. Bowles, D.E.; Dodd, H.R. The floristics and community ecology of aquatic vegetation occurring in seven large springs at Ozark National Scenic Riverways, Missouri. J. Bot. Res. Inst. Tex. 2015, 9, 235–249. [Google Scholar]
  19. Bowles, D.E.; Cheri, C.R. Aquatic vegetation of springs at Buffalo National River, Arkansas. Castanea 2019, 84, 224–237. [Google Scholar] [CrossRef]
  20. Rafferty, M.D. The Ozarks, Land and Life, 2nd ed.; University of Arkansas Press: Fayetteville, AR, USA, 2001; p. 368. [Google Scholar]
  21. Meinzer, O.E. Large Springs in the United States; Water-Supply Paper 557; U.S. Geological Survey: Washington, DC, USA, 1927; p. 94.
  22. Vineyard, J.D.; Feder, G.; Pflieger, W.L.; Lipscomb, R.G. Springs of Missouri with Sections on Fauna and Flora; Water Resources Report No. 29; Missouri Geological Survey and Water Resources: Rolla, MO, USA, 1974; p. 220.
  23. Bowles, D.E. Vascular plants of Mammoth Spring, Arkansas. J. Torrey Bot. Soc. 2020, 147, 87–93. [Google Scholar] [CrossRef]
  24. Bowles, D.E.; Dodd, H.R.; Williams, M.H.; Morrison, L.M.; James, K.; DeBacker, M.D.; Ciak, C.E.; Hinsey, J.A.; Rowell, G.A.; Haack, J.L. Protocol for Monitoring Spring Communities at Ozark National Scenic Riverways, Missouri; Natural Resource Report NPS/HTLN/NRR—2008/029; National Park Service: Fort Collins, CO, USA, 2008; p. 214.
  25. Bowles, D.E.; Dodd, H.R.; Hinsey, J.A.; Cribbs, J.T.; Luraas, J.A. Spring Communities Monitoring at Ozark National Scenic Riverways, Missouri: 2007–2009 Status Report; Natural Resource Technical Report NPS/OZAR/NRTR—2011/511; National Park Service: Fort Collins, CO, USA, 2011; p. 57.
  26. Bowles, D.E.; Dodd, H.R. Aquatic Vegetation Monitoring in Springs at Ozark National Scenic Riverways, 2007–2015; Natural Resource Data Series NPS/OZAR/NRDS—2016/1044; National Park Service: Fort Collins, CO, USA, 2016; p. 21.
  27. United States Geological Survey (USGS). National Water Information System, USGS Gages 07067500, 07065495, 07066000, Missouri. Available online: https://waterdata.usgs.gov/nwis/uv/ (accessed on 28 April 2020).
  28. Mugel, D.N.; Richards, J.M.; Schumacher, J.G. Geohydrologic Investigations and Landscape Characteristics of Areas Contributing Water to Springs, the Current River, and Jacks Fork, Ozark National Scenic Riverways, Missouri; Scientific Investigations Report 2009-5138; U.S. Geological Survey: Reston, VA, USA, 2009; p. 92.
  29. Daubenmire, R.F. Canopy coverage method of vegetation analysis. Northwest Sci. 1959, 33, 43–64. [Google Scholar]
  30. Shannon, C.E. A mathematical theory of communication. Bell Syst. Tech. J. 1948, 27, 379–423, 623–656. [Google Scholar] [CrossRef] [Green Version]
  31. Simpson, E.H. Measurement of diversity. Nature 1949, 163, 688. [Google Scholar] [CrossRef]
  32. Hill, M.O. Diversity and evenness: A unifying notation and its consequences. Ecology 1973, 54, 427–432. [Google Scholar] [CrossRef] [Green Version]
  33. Joust, L. Entropy and diversity. Oikos 2006, 113, 2. [Google Scholar]
  34. Epps, T.W.; Singleton, K.J. An omnibus test for the two-sample problem using the empirical characteristic function. J. Stat. Comput. Sim. 1986, 26, 177–203. [Google Scholar] [CrossRef]
  35. Hammer, Ø.; Harper, D.A.T.; Ryan, P.D. PAST: Paleontological statistics software package for education and data analysis. Palaeontol. Electron. 2001, 4, 228. [Google Scholar]
  36. Goerg, S.J.; Kaiser, J. Nonparametric testing of distributions—the Epps–Singleton two-sample test using the empirical characteristic function. Stata J. 2009, 9, 454–465. [Google Scholar] [CrossRef] [Green Version]
  37. Bendix, J.; Hupp, C.R. Hydrological and geomorphological impacts on riparian plant communities. Hydrol. Process. 2000, 14, 2977–2990. [Google Scholar] [CrossRef]
  38. Bilby, R. Effects of a spate on the macrophyte vegetation of a stream pool. Hydrobiologia 1977, 56, 109–112. [Google Scholar] [CrossRef]
  39. Henry, C.P.; Bornette, G.; Amoros, C. Differential effects of floods on the aquatic vegetation of braided channels of the Rhone River. J. N. Am. Benthol. Soc. 1994, 13, 439–467. [Google Scholar] [CrossRef]
  40. Bornette, G.; Puijalon, S. Macrophytes: Ecology of Aquatic Plants; Encyclopedia of Life Sciences; John Wiley & Sons, Ltd.: Chichester, UK, 2009; p. 11. [Google Scholar]
  41. Bowles, D.E.; Dodd, H.R.; Hinsey, J.A.; Cribbs, J.T.; Williams, J.M. Aquatic Invertebrate Community Structure in Springs at Ozark National Scenic Riverways, Missouri, 2007–2016; Natural Resource Data Series NPS/HTLN/NRDS—2018/1161; National Park Service: Fort Collins, CO, USA, 2018; p. 37.
  42. Kim, J.-H.; Choi, I.-K. Vegetation behavior and its habitat at region against flood flow in urban streams. J. Eng. Sci. Technol. 2013, 8, 306–315. [Google Scholar]
  43. Puijalon, S.; Bornette, G.; Sagnes, P. Adaptations to increasing hydraulic stress: Morphology, hydrodynamics and fitness of two higher aquatic plant species. J. Exp. Bot. 2005, 56, 777–786. [Google Scholar] [CrossRef] [Green Version]
  44. Puijalon, S.; Bouma, T.J.; Douay, C.J.; van Groenendael, J.; Anten, N.P.R.; Martel, E.; Bornette, G. Plant resistance to mechanical stress: Evidence of an avoidance–tolerance trade-off. New Phytol. 2011, 191, 1141–1149. [Google Scholar] [CrossRef]
  45. Schutten, J.; Dainty, J.; Davy, A.J. Root anchorage and its significance for submerged plants in shallow lakes. J. Ecol. 2005, 93, 556–571. [Google Scholar] [CrossRef]
  46. Riis, T.; Biggs, B.J.F. Hydrologic and hydraulic control of macrophyte establishment and performance in streams. Limnol. Oceanogr. 2003, 48, 1488–1497. [Google Scholar] [CrossRef] [Green Version]
  47. Koehl, M.A.R. The interaction of moving water and sessile organisms. Sci. Am. 1982, 247, 110–120. [Google Scholar] [CrossRef]
  48. Hickey, J.T.; Salas, J.E. Environmental Effects of Extreme Floods; U.S.-Italy Research Workshop on the Hydrometeorology, Impacts, and Management of Extreme Floods: Perugia, Italy, 1995; p. 23. [Google Scholar]
  49. Maltchik, L.; Pedro, F. Responses of aquatic macrophytes to disturbance by flash floods in a Brazilian semiarid intermittent stream. Biotropica 2001, 33, 566–572. [Google Scholar] [CrossRef]
  50. Keruzoré, A.A.; Willby, N.J. Avoidance of hydrological disturbance by aquatic vegetation in the floodplain of a large upland river. Aquat. Bot. 2014, 116, 19–26. [Google Scholar] [CrossRef]
  51. Padial, A.A.; Carvalho, P.; Thomaz, S.M.; Boschilia, S.M.; Rodrigues, R.B.; Kobayashi, J.T. The role of an extreme flood disturbance on macrophyte assemblages in a Neotropical floodplain. Aquat. Sci. 2009, 71, 389–398. [Google Scholar] [CrossRef]
  52. Barrat-Segretain, M.-H.; Henry, C.P.; Bornette, G. Regeneration and colonization of aquatic plant fragments in relation to the disturbance frequency of their habitats. Arch. Hydrobiol. 1999, 145, 111–127. [Google Scholar] [CrossRef]
  53. Barrat-Segretain, M.-H.; Bornette, G.; Hering-Vilas-Bôas, A. Comparative abilities of vegetative regeneration among aquatic plants growing in disturbed habitats. Aquat. Bot. 1998, 60, 201–211. [Google Scholar] [CrossRef]
  54. Blom, C.W.P.M.; Voesenek, L.A.C.J. Flooding: The survival strategies of plants. Trends Ecol. Evol. 1996, 11, 290–295. [Google Scholar] [CrossRef] [Green Version]
  55. Combroux, I.; Bornette, G.; Willby, N.J.; Amoros, C. Regenerative strategies of aquatic plants in disturbed habitats: The role of the propagule bank. Arch. Hydrobiol. 2001, 152, 215–235. [Google Scholar]
  56. Mony, C.; Puijalon, S.; Bornette, G. Resprouting response of aquatic clonal plants to cutting may explain their resistance to spate flooding. Folia Geobot. 2011, 46, 155–164. [Google Scholar] [CrossRef]
  57. Strauss, V.; Janauer, G.A. Impact of the 2002 extreme flood on aquatic macrophytes in a former side channel of the river Danube (Austria). Belg. J. Bot. 2007, 140, 17–24. [Google Scholar]
  58. Kitamura, K.; Yoshimura, J.; Tainaka, K. Potential impacts of flooding events and stream modification on an endangered endemic plant, Schoenoplectus gemmifer (Cyperaceae). Ecol. Res. 2009, 24, 533–546. [Google Scholar] [CrossRef] [Green Version]
Figure 1. Map showing the locations of large springs at Ozark National Scenic Riverways (OZAR), Missouri.
Hydrobiology 01 00013 g001
Figure 2. Map of Alley Spring showing the flow path to the Jacks Fork. Base photo from Google Earth. Perpendicular bars on the channel marker define the sampling reach for this study.
Hydrobiology 01 00013 g002
Figure 3. Map of Big Spring showing the flow path to the Current River. Base photo from Google Earth. Perpendicular bars on the channel marker define the sampling reach for this study.
Hydrobiology 01 00013 g003
Figure 4. Estimated discharge (m3/s) at Alley Spring Missouri, 15 April–1 July 2017. Data extrapolated from [27]. The solid horizontal line represents the historic mean flow for this spring of approximately 3.60 m3/s.
Hydrobiology 01 00013 g004
Figure 5. Discharge (m3/s) at Big Spring, Missouri, 15 April–1 July 2017. Data from [27]. The solid horizontal line represents the historic mean flow for this spring of approximately 15.90 m3/s.
Hydrobiology 01 00013 g005
Figure 6. Alley Spring, Missouri. Downstream perspective from the upper end of the sampling reach showing typical vegetation patterns. The bridge crossing the channel was washed away during the 2017 flood. Photo taken by author in July 2005.
Hydrobiology 01 00013 g006
Figure 7. Big Spring, Missouri. Downstream perspective from the bridge crossing the channel showing typical vegetation patterns. The dominant plant species in this photo are Ranunculus aquatilis (dark green) and Nasturtium officinale (light green). Photo taken by author in July 2008.
Hydrobiology 01 00013 g007
Figure 8. Big Spring, Missouri. Upstream perspective from the bridge crossing the channel: (a) Top photo taken in 2008; (b) middle photo taken in July 2017; (c) bottom photo taken in August 2020. Note large tree in top photo is missing in post-flood photos. All photos by author.
Hydrobiology 01 00013 g008
Figure 9. Community diversity metrics for aquatic vegetation at Alley Spring, Missouri. S is taxa richness, He and De are the effective numbers of species for the Shannon’s diversity index, and Simpson’s diversity index, respectively. Values are the means with standard error bars.
Hydrobiology 01 00013 g009
Figure 10. Community diversity metrics for aquatic vegetation at Big Spring, Missouri. S is taxa richness, He and De are the effective numbers of species for the Shannon’s diversity index, and Simpson’s diversity index, respectively. Values are the means with standard error bars.
Hydrobiology 01 00013 g010
Figure 11. Species distribution evenness for aquatic vegetation and percent bare substrate at Alley Spring, Missouri. Values are the means with standard error bars.
Hydrobiology 01 00013 g011
Figure 12. Species distribution evenness for aquatic vegetation and percent bare substrate at Big Spring, Missouri. Values are the means with standard error bars.
Hydrobiology 01 00013 g012
Figure 13. Individual species frequency, percent foliar cover, and species importance values for aquatic vegetation at Alley Spring, Missouri. Values for the period 2007–2016 represent the means for that period and the error bars are the standard error for the entire period. Values for 2017 to 2019 represent the means and standard errors across transects for those specific years. Rare and singleton species occurrences are excluded from these graphs.
Hydrobiology 01 00013 g013
Figure 14. Individual species frequency, percent foliar cover, and species importance values for aquatic vegetation at Big Spring, Missouri. Values for the period 2007–2016 represent the means for that period and the error bars the are standard error for the entire period. Values for 2017 to 2019 represent the means and standard errors across transects for those specific years. Singleton species occurrences are excluded from these graphs.
Hydrobiology 01 00013 g014
Table 1. Habitat and watershed variables for Alley and Big springs, Ozark National Scenic Riverways. Data from Mugel et al. [28], and the Heartland Inventory and Monitoring Network database. Values are the means.
VariableAlleyBig
Recharge area (km2)382.201118.00
Mean annual discharge m3/s3.7812.49
Forested (km2)227.50899.60
Cultivated (km2)2.866.24
Open (km2)148.46199.16
Urban (km2)3.9010.40
Public owned land (km2)80.60663.00
Human population in recharge area1767.005355.00
Channel width (mean) (m)13.9832.77
Depth (cm)55.7571.27
Length of spring run (m)988.00656.00
Source elevation (m asl)217.93137.77
Mouth elevation (m asl)205.74130.45
Overall channel slope (%)0.940.95
Current velocity (m/s)0.460.38
Dominant substrate size (mm)58.9136.50
Substrate embeddedness (%)0.320.54
Canopy cover (%)0.240.23
Water temperature (°C)13.7814.24
Specific conductance (μS/cm)266.71311.53
Dissolved oxygen (mg/L)9.419.32
pH7.247.27
Table 2. Epps–Singleton test (α = 0.05) results for community diversity metrics measured at Alley Spring and Big Spring, Missouri, for data collected in the period 2007–2020. W = test statistic; p = probability. Abbreviations for effective numbers of species: taxa richness (S), Shannon’s diversity index (He), and Simpson’s diversity index (De).
SpringWp
Alley
S3.710.45
He2.60.63
De3.790.43
Evenness0.860.93
Bare Substrate3.870.42
Big
S11.540.02
He8.370.08
De6.860.14
Evenness9.410.05
Bare Substrate12.240.02
Table 3. Epps–Singleton test (α = 0.05) results for individual species metrics measured at Alley Spring and Big Spring, Missouri, for data collected in the period 2007–2020. Bold values are significant (p < 0.05). W = test statistic; p = probability. p-values are limited to four or less decimal places. Some comparisons could not be tested because zero specimens were encountered post-flood. Metrics are ISF = individual species frequency, PFC = percent foliar cover, and SIV = species importance value.
TaxaPFCISFSIV
WpWpWp
Alley Spring
Batrachospermum spp.14.830.0053.170.535.880.21
Filamentous green algae (Chlorophyta)3.240.5217.340.0023.410.49
Nostoc parmelioides Kütz. ex Bornet and Flahault2.970.563.440.499.980.04
Mosses (Bryophyta)5.060.2810.50.033.610.46
Lemna trisculca L.8.60.072.740.61.710.79
Callitriche heterophylla Pursh17.40.0026.880.147.380.12
Cardamine bulbosa (Schreb. ex Muhl.) Britton, Sterns and Poggenb.1.340.852.10.722.630.62
Elodea spp.7.210.121.430.842.170.7
Glyceria striata (Lam.) Hitchc.4.320.361.060.96.330.18
Nasturtium officinale W.T. Aiton0.810.942.670.991.250.87
Sparganium americanum Nutt.4.070.43.70.452.20.69
Veronica anagallis-aquatica L.4.960.2921.260.000315.350.004
Big Spring
Batrachospermum spp.2.370.671.760.780.980.91
Filamentous green algae (Chlorophyta)9.030.063.180.534.220.38
Nostoc parmelioides Kütz. ex Bornet and Flahaultno testno testno testno testno testno test
Mosses (Bryophyta)4.420.366.790.152.150.71
Callitriche heterophylla Pursh16.20.0035.160.273.550.47
Cardamine bulbosa (Schreb. ex Muhl.) Britton, Sterns and Poggenb.0.590.969161.2067.01<0.0001
Elodea spp.1.120.892.240.697.380.12
Lemna trisculca L.no testno testno testno test no test
Nasturtium officinale W.T. Aiton143.57<0.0001106.93<0.000172.49<0.0001
Poa annua L.1.410.842.280.686.140.19
Ranunculus aquatilis L.31.060.0003221.64<0.000135.71<0.0003
Sparganium americanum Nutt.1.970.759.10.064.110.39
Veronica anagallis-aquatica L.6.310.1831.990.000150.29<0.0001
Publisher’s Note: MDPI stays neutral with regard to jurisdictional claims in published maps and institutional affiliations.

