Article

Sulfate (SO42−) Decline Supported Lake Kinneret (Israel) Invasion of N2-Fixing Cyanobacterium Aphanizomenon ovalisporum

by
Moshe Gophen
1,2,* and
Valerie Levin-Orlov
1,2
1
Research Institute, Tel-Hai Academic College, P.O. Box 831, Kiryat Shmone 11016, Israel
2
MIGAL Scientific Research Institute, P.O. Box 831, Kiryat Shmone 11016, Israel
*
Author to whom correspondence should be addressed.
Hydrobiology 2022, 1(2), 146-163; https://doi.org/10.3390/hydrobiology1020012
Submission received: 17 January 2022 / Revised: 13 February 2022 / Accepted: 1 March 2022 / Published: 31 March 2022

Abstract

:
Since 1990, the Lake Kinneret trophic status has shifted from phosphorus to nitrogen limitation. In the summer of 1994, an outbreak of N2 fixing cyanobacterium Aphanizomenon ovalisporum invaded the epilimnion of Lake Kinneret. Since then, sporadic densities of harmful cyanobacteria (HFCB) reappeared in the lake together with other toxic non-N2 fixing cyanobacteria. This predicted ecological modification developed because of a worldwide well-known background condition of descent N/P mass ratio. Reevaluation of the lake and its watershed ecosystems data exposed additional potential support of the process reduction of the epilimnetic sulfate (SO42−) concentration. Climate condition changes resulted in sulfate input reduction and its potential competitive interaction with molybdenum (MoO42−) enhanced the HFCB growth rate. The working hypothesis was the reevaluated incorporation of long-term records including rainfall, river discharge, depth of ground water table in the Hula valley peat soil, total moisture capabilities, and Kinneret epilimnion sulfate concentration. Results justify conclusive inference in Lake Kinneret of the following: sufficient phosphorus, insufficient nitrogen, and sulfate decline availabilities induced the HFCB outbreak in the summer of 1994.

1. Introduction

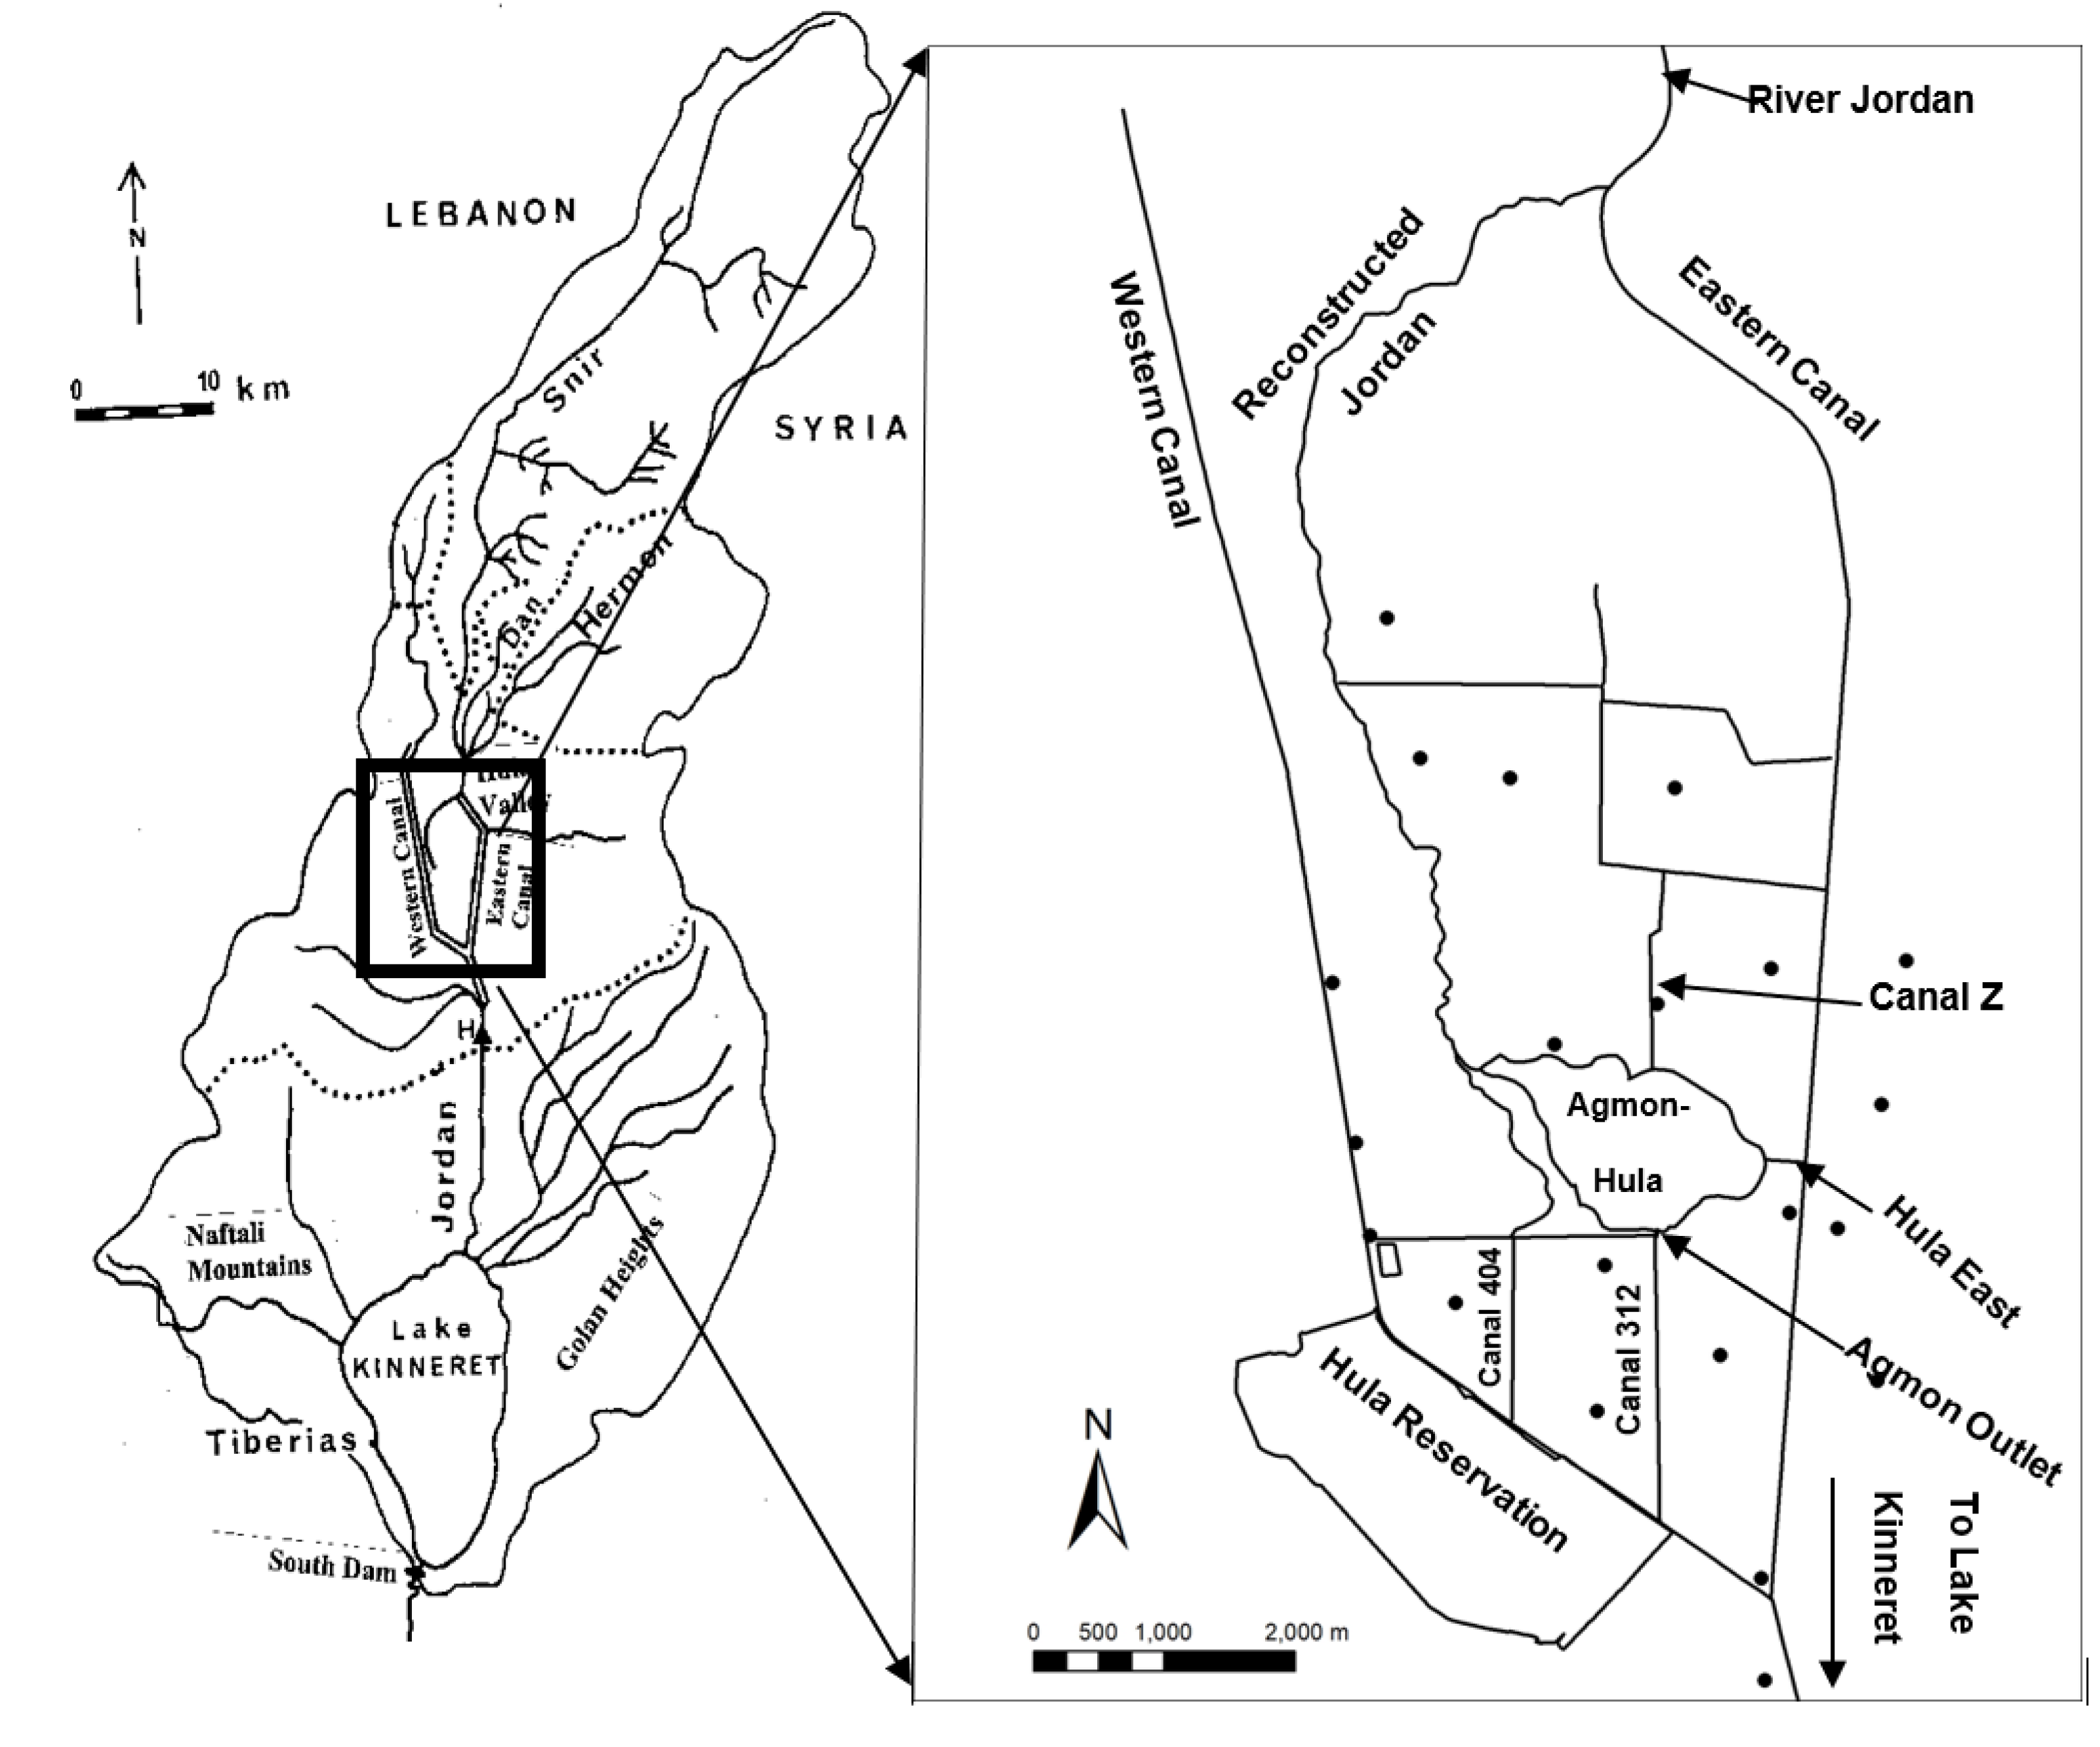
Lake Kinneret, the only natural freshwater lake in Israel, is a warm monomictic lake which is stratified from May through mid-December (anoxic hypolimnion) and totally mixed from mid-December through April. Due to its high temperature of seasonal and bathymetrical mean range of 15–33 °C, the thermal stratification is stable and separates the lake into two thermal compartments of epilimnetic 0–20 m depth and hypolimnetic thickness at 24 m (20 m-bottom). The epilimnion is rich in oxygen and poor in other nutrients. Oxygen is completely absent in the hypolimnion, which is rich in ammonia, sulfides, and CO2. Due to the stability of the thermal structure, there is a steep gradient of substances in the metalimnion, indicating a slow rate of nutrient exchange between the epilimnetic and hypolimnetic layers. The maximum and mean depth of Lake Kinneret when the water level is maximally legislated (208.8 m below sea level) is 43 and 26 m, respectively. The water surface area is 168 km2 and total volume is 4.301 km3. Lake utilization is multi-purposed for water supply, recreation, tourism, and fishery. About 150 active fishers harvest 1000–1200 tons of commercially marketed lake fish. During the spring and summer months, more than two million recreation days (personal time days) were recently documented. The major lake function is as a water supply for domestic demands, therefore safety of water quality for drinking, sailing, sailors, and swimmers is a national concern. Very low biomass density of HFCB was recorded in Lake Kinneret before 1990. Later, domination of algal community was due to cyanobacteria (nitrogen fixers and non-fixers). The enhancement of toxic HFCB in Lake Kinneret initiated a national concern because of deteriorated water supply as well as human health. The Hula Valley and Lake Kinneret are located in the Syrian African Rift Valley in northern Israel (Figure A1). Lake Kinneret is the only natural freshwater lake in Israel. Until 2010, an average of 336 mcm (336 million cubic meters) of water was pumped annually (34% in winter and 66% in summer) from the lake, mostly for domestic usage and partly for agricultural irrigation south of the Kinneret. Since 2010, desalinization plants have supplied most of the demand for domestic consumption, and supply is therefore directed to other regions. The total national water supply is 2.11 bcm (billion cubic meters), of which 0.55 bcm comes from the Kinneret–Jordan water system, and 0.7 bcm comes from desalinization. The area of the Kinneret drainage basin Figure A1 is 2730 km2, of which approximately 200 km2 is the Hula Valley. Three major headwater rivers (Hatzbani, Banyas, and Dan) flow from the Hermon Mountain region (Figure A1) in the northern part of the Kinneret drainage basin. These three headwaters and more other rivers join the Jordan River and flow downstream into Lake Knneret. The Jordan River contributes approximately 63% of the Kinneret water budget and more than 50% of the total external nutrient input originate from the Hula Valley.
The background of the outbreak of cyanobacteria has been widely studied. Most of the studies focus either on the mass ratio between available nitrogen and phosphorus or on limitation thresholds of those nutrients. Vast efforts were invested into studies regarding the impact of physical conditions such as temperature and stratification consequences, as well as turbulence and internal mass water motions. In other words, the impact of changes of climatic conditions. Not much was attributed to the study of the impact of trace elements such as heavy metals (molybdenum, vanadium, etc.). Intensive studies were carried out about the impact of the trace element of selenium on the bloom dynamics of Peridinium gatunenze in Lake Kinneret. The similarity of the trace elements’ influence on cyanobacteria growth was not widely implemented. Nevertheless, these studies did not include the optional existence of competitive interrelationships between Peridinium and cyanobacteria. The driving force of phosphorus or nitrogen on the cyanobacteria growth rate was documented [1,2,3,4,5,6]. Moreover, the positive impact of the N/P ratio on the enhancement of cyanobacteria domination in freshwater lakes and reservoirs has been intensively documented [3,4,7,8,9,10]. Nevertheless, in N-limited ecosystems the competitive capability of N2-fixing cyanobacterium created by the nitrogenase enzyme requires sufficient Mo supply to enhance their production. This is because sufficient supply of the supplemented micro-element of molybdenum (Mo, as MoO42−), which is an enzyme cofactor of nitrogenase, is essentially required [11]. Although Mo is occasionally described as a “heavy metal”, its properties are very different from the typical agents of this elemental category. MoO42− is much less toxic than the typical heavy metals such as lead, thallium, mercury, or cadmium. Molybdenum is a common trace element in toxic waters as MoO42−. The cytological–biochemical process of MoO42− incorporation by N2-fixer cyanobacterium has been well documented [12,13]. Availability of Mo has also been documented [12]. The competitive properties of SO42− with Molybdenum have been documented [11,12]. Consequently, it has been suggested that in an ecosystem like Lake Kinneret where long periods of heavy bloom form P. gatunenze, domination was replaced by cyanobacteria, including N2-fixers and non-fixers, a catchment very rich in SO42− outsources such as the peat soil in the Hula valley is relevant. The peat soil in the Hula valley contains huge loads of Gypsum which are an effective supplier of SO42− accompanied by deep borehole-artesian flows containing SO42− into Lake Kinneret. The purpose of this survey is to evaluate optional capabilities of ecological opportunities such as supplemental SO42− aimed at strengthening competition with MoO42 to suppress N2-fixer cyanobacterium. The negative impact of cyanobacteria on water quality and human safety has been internationally and widely studied. Significant parts of the studies have been attributed to the availabilities of nitrogen and phosphorus and the consequences to lake eutrophication [3,4,5,6,8,9,10]. In Israel, after the 1950s when Lake Kinneret became the principal water supply qualified to be drinking water, optional eutrophication was a concern and removal of the Peridnium biomass was efficiently achieved. Therefore, the appearance of the unpredicted outbreak of toxic N2-fixer cyanobacterium became a major topic in the master plan of Lake Kinneret research. The present paper confirms that this research continues.

2. Material and Methods

The GWT in the Hula Valley (2000–2020) were provided by the Hula Project Data Base in Migal’s Scientific Research Institute. Information about the Jordan River discharge (1970–2018) (mcm/year; 106 m3/year) and sulfate concentration were provided by Israel Hydrological Service of the National Water Authority; Mekorot, Water Supply Company, Kinneret and River Jordan monitoring Unit., and Kinneret Limnological Laboratory, IOLR (LKDB 1970–2021). All data for Sulfate and Mo concentrations were given in ppm and mM, and ppb and µM, respectively. Rainfall data (1940–2020) were provided by the Israeli Meteorological Service–Meteorological Station, Dafna (M. Peres responsibility).

2.1. Statistical Methods

Three regression methods were performed (StataSE 17): (1) fractional polynomial regression of continuous covariates, a form of parsimonious parametric modeling (published in Applied Statistics 43: 429–467), (2) linear regression with confidence interval percentage (95%) (StataSE17), and (3) LOWESS Smoother (0.8 Bandwidth), which provides weighted scatterplot smoothing. All mass loadings are given in metric tons.

2.2. Ground Water Table Mapping

Distributional mapping of subterranean waters was carried out by incorporation of Ground Water Table (GWT) records and Inverse Distance Weighting (IDW), which is a deterministic method for multivariate interpolation with a known scattered set of recorded GWT depth. The assigned values to unknown points of GWT depths were calculated with a weighted average of the values available at the known points.

3. Results

3.1. Sulfate (SO42−) Resources

What is the size and seasonality of the sulfate load in Lake Kinneret? The answer was given in 52 annual reports (1969–2021) published by the Kinneret Limnological Laboratory [14] and numerous documented papers and books published during long-term studies [2,14,15,16]. Due to the seasonality of the thermal structure in Lake Kinneret, concentration of SO42− slightly varies between epilimnion and hypolimnion layers in summer (stratification) and winter (fully mixed) months. Moreover, the SO42− supply to Lake Kinneret originates mostly from outsourcing. Water input into Lake Kinneret is contributed through the headwater river discharges of Hazbani, Banias, and Dan Rivers combining into the Jordan River (65% of total input). Nevertheless, SO42− concentration in the headwater, including the northern flow to the joint formation of the River Jordan in the Hula Valley and several other runoff springs, is below 30 ppm. Southern to the Hula Valley, the SO42− concentration in the Jordan River is above 100 ppm. Another significant contributor of SO42− is sub-lacustrine salty-hot springs, where SO42− concentrations varies between 200–780 ppm [17]. A recent new outsource was formed as a consequence of deep borehole drilling (Shamir) [18] where SO42− concentration varies between 600–650 ppm. The SO42− source within the Hula Valley is peat soil which contains a high content of gypsum (CaSO4). The anthropogenic activity of agricultural cultivation, irrigation, and drainage in the Hula Valley enhance gypsum dissolution and SO42− drifting downstream. The hydrological structure directs these drifted matters towards the Jordan River, continuing downstream into Lake Kinneret.

3.2. Sulfate (SO42−) Outsources in the Hula Valley

The hydrological input compartments in the Hula Valley which supply SO42− into Lake Agmon include the following: the principal drainage canal, “Canal 101” or “Canal Z” several other branches of drainage canals; Hula East conveyor and the reconstructed River Jordan “Hula Branch”. The output of SO42− towards River is in Table 1.
The results shown in Table 1 indicate that 273 (1709–1437) tons of SO42− are retained in Lake Agmon annually and 1437 tons are conveyed downstream. Moreover, concentrations of input SO42− are high and low in winter and summer, respectively.
High concentrations of SO42− of 600–650 ppm and a yield of 20 mcm/year (106 m3) are measured in Shamir boreholes and contained approximately 12,000–13,000 tons of SO42−.
Distribution of SO42− concentrations (ppm) in Lake Kinneret (Figure 1, Figure 2 and Figure 3) and in the Hula Valley are shown (Figure 4 and Figure 5).
The results given in Figure 1 indicate an increase of SO42− concentration in Lake Kinneret from 2000–2020.
Data given in Figure 2 indicate that prior to the 2010, SO42− concentrations in Lake Kinneret significantly (r2 = 0.3758; p = 0.0002) declined.
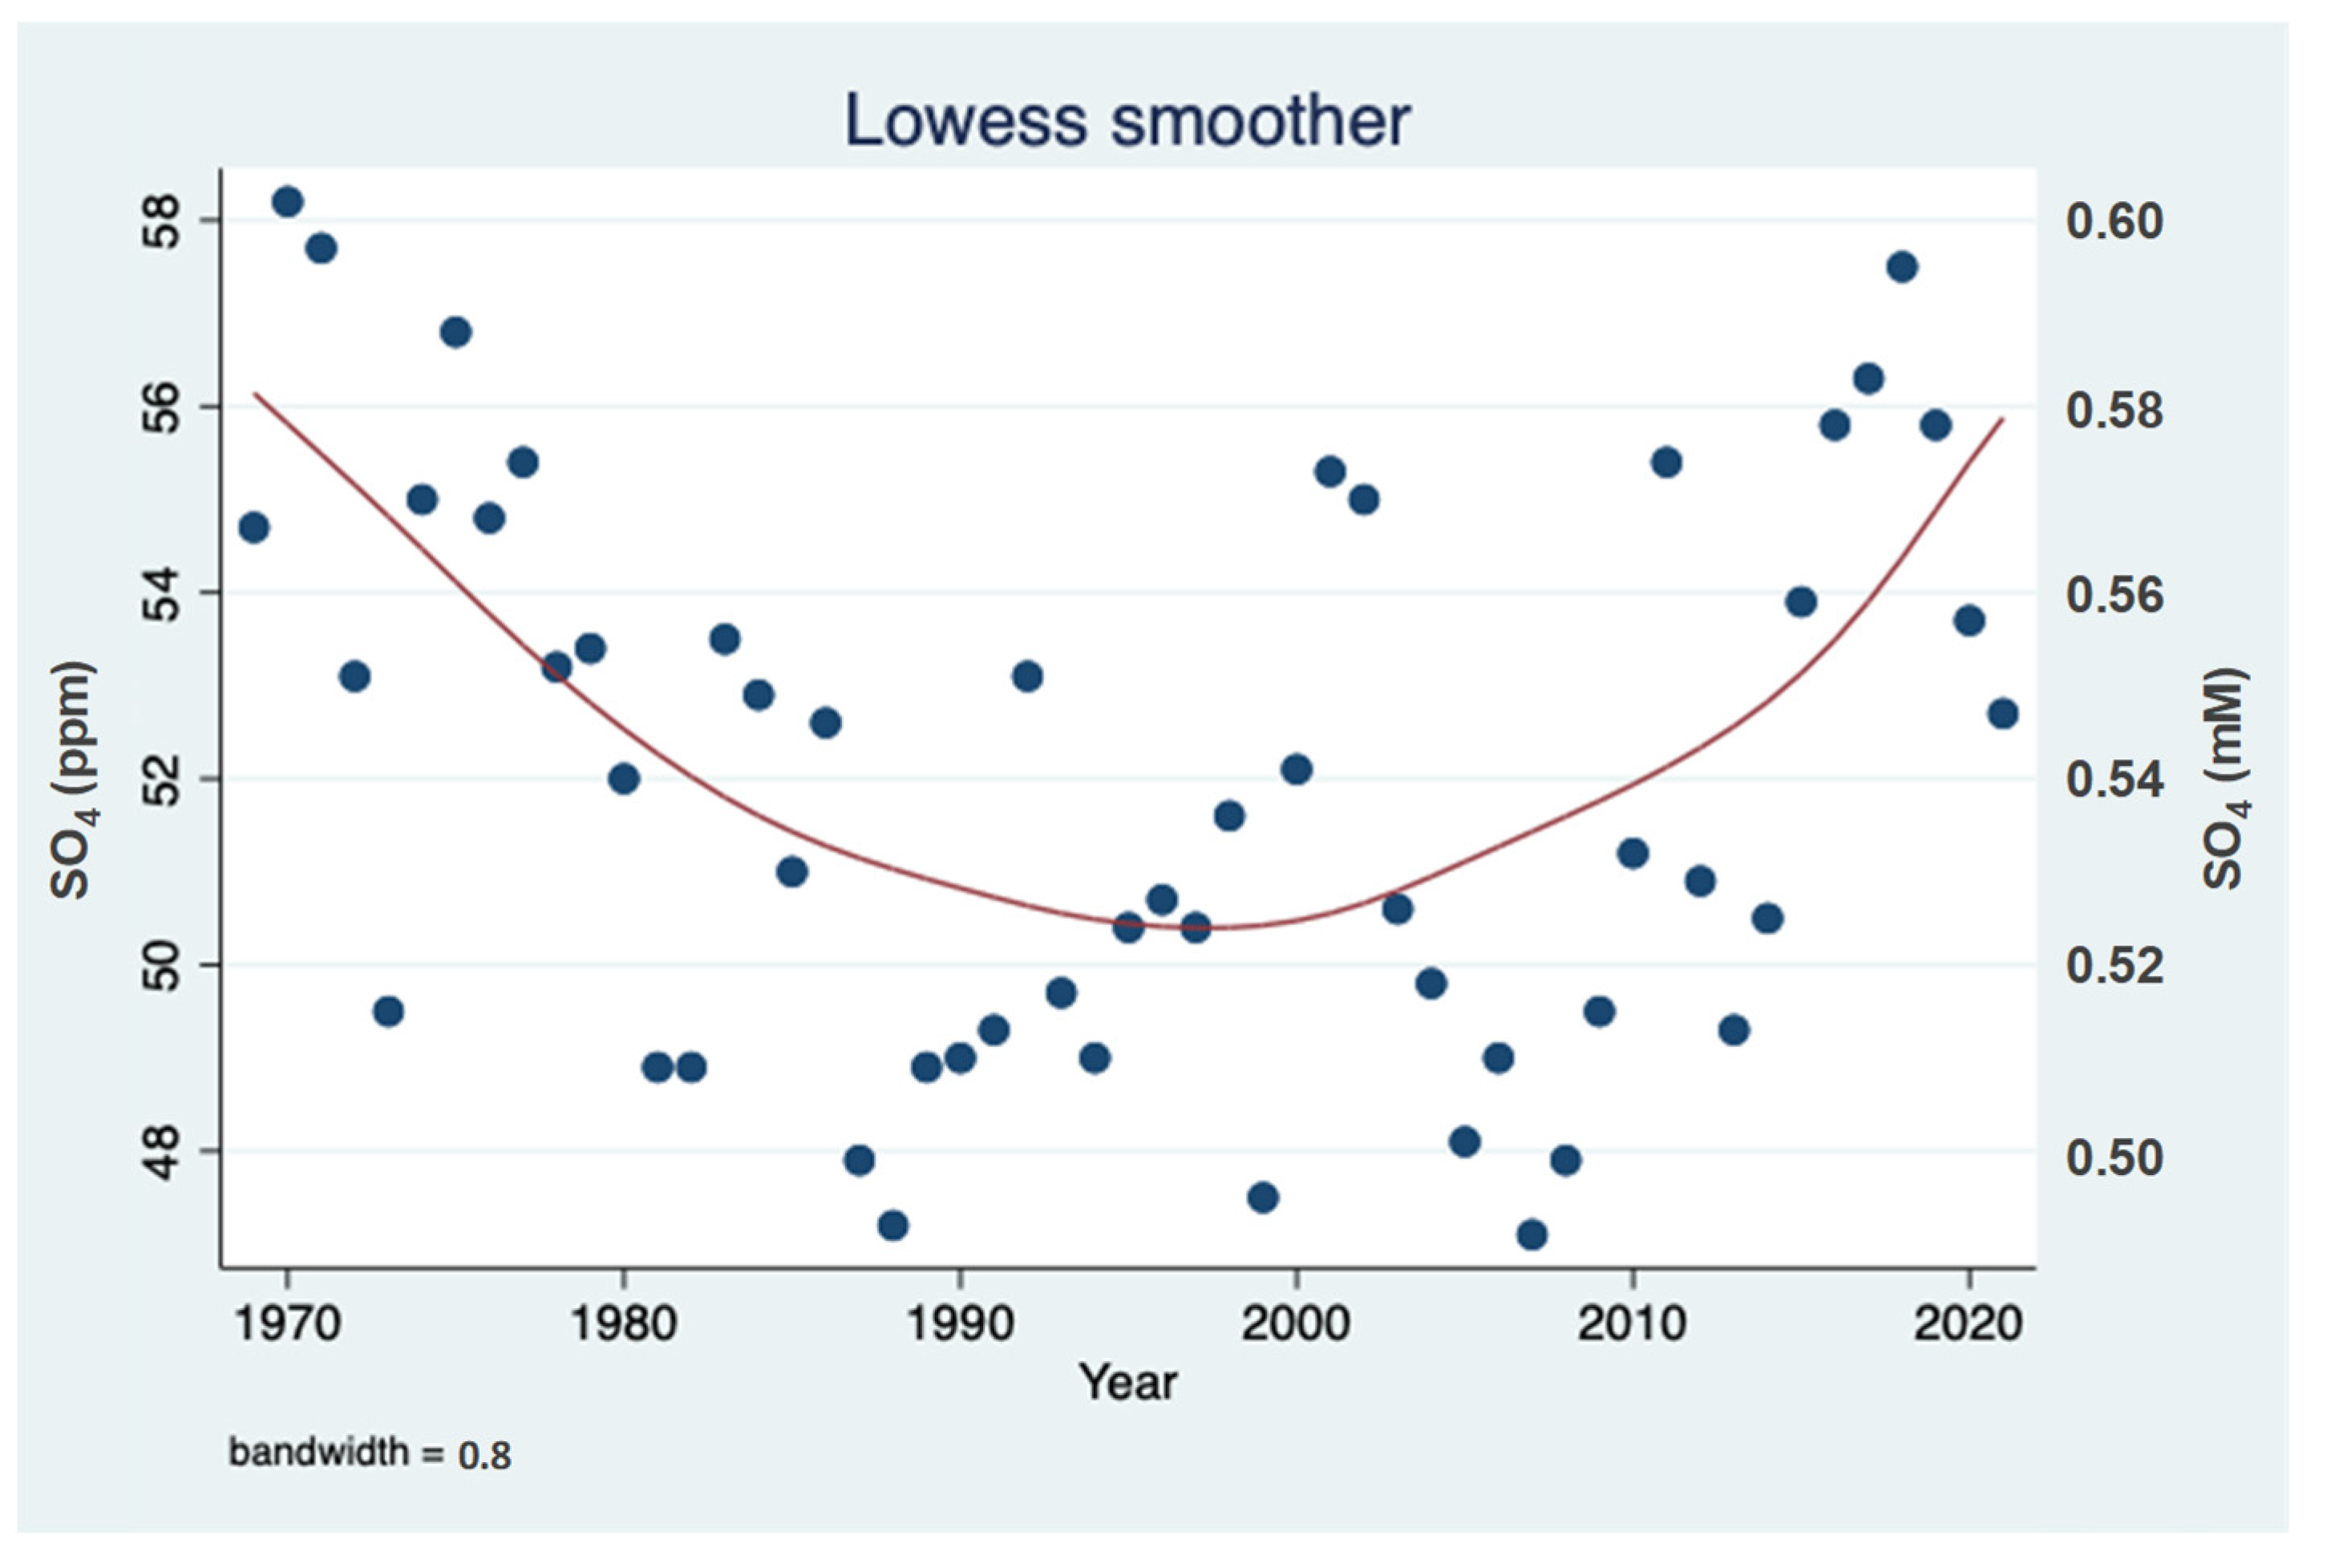
The trend of changes (LOWESS; 0.8 plot) of long-term SO42− concentration (ppm; mM) fluctuations in Lake Kinneret represent the 1970–1998-decline and 1987–2004 elevation.
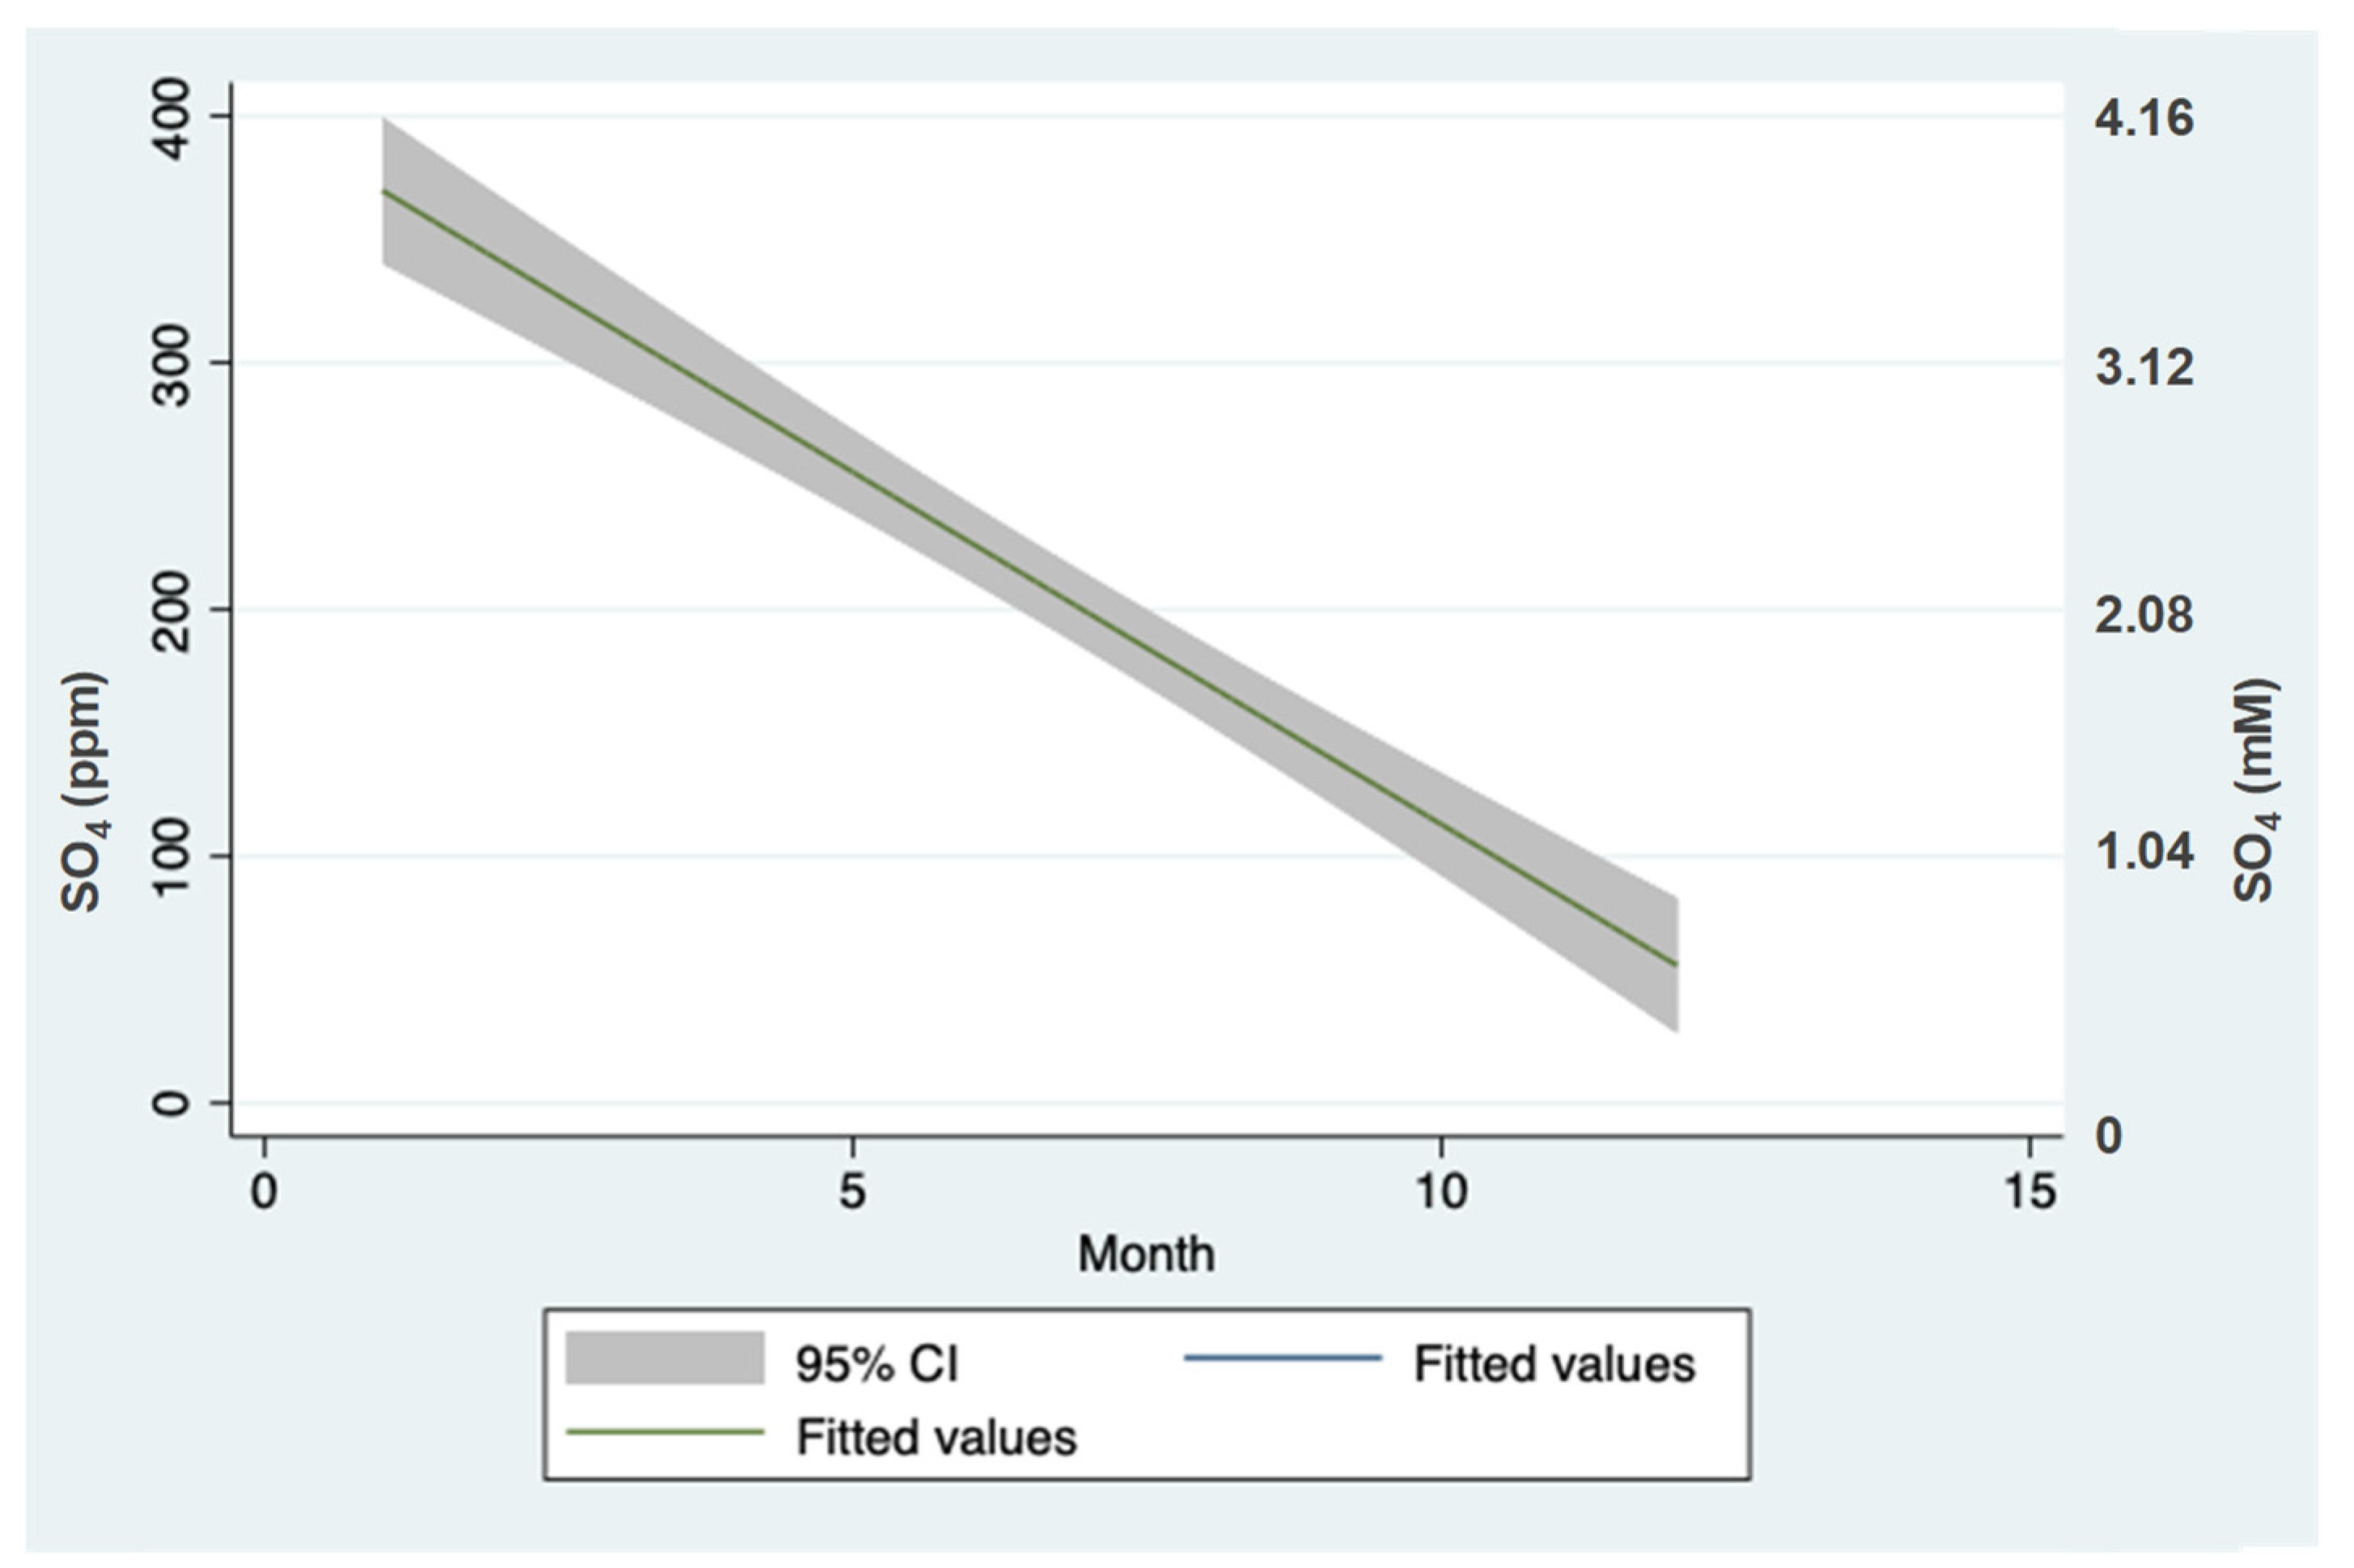
The seasonal changes of SO42− concentrations in the Hula Valley are given in Figure 4, indicating significant seasonal decline.
Quantitative and seasonal relations between the River Jordan discharge and sulfate concentrations (ppm) and mass loads (ton) ranges are presented in Figure 5, Figure 6, Figure 7, Figure 8, Figure 9, Figure 10 and Figure 11.
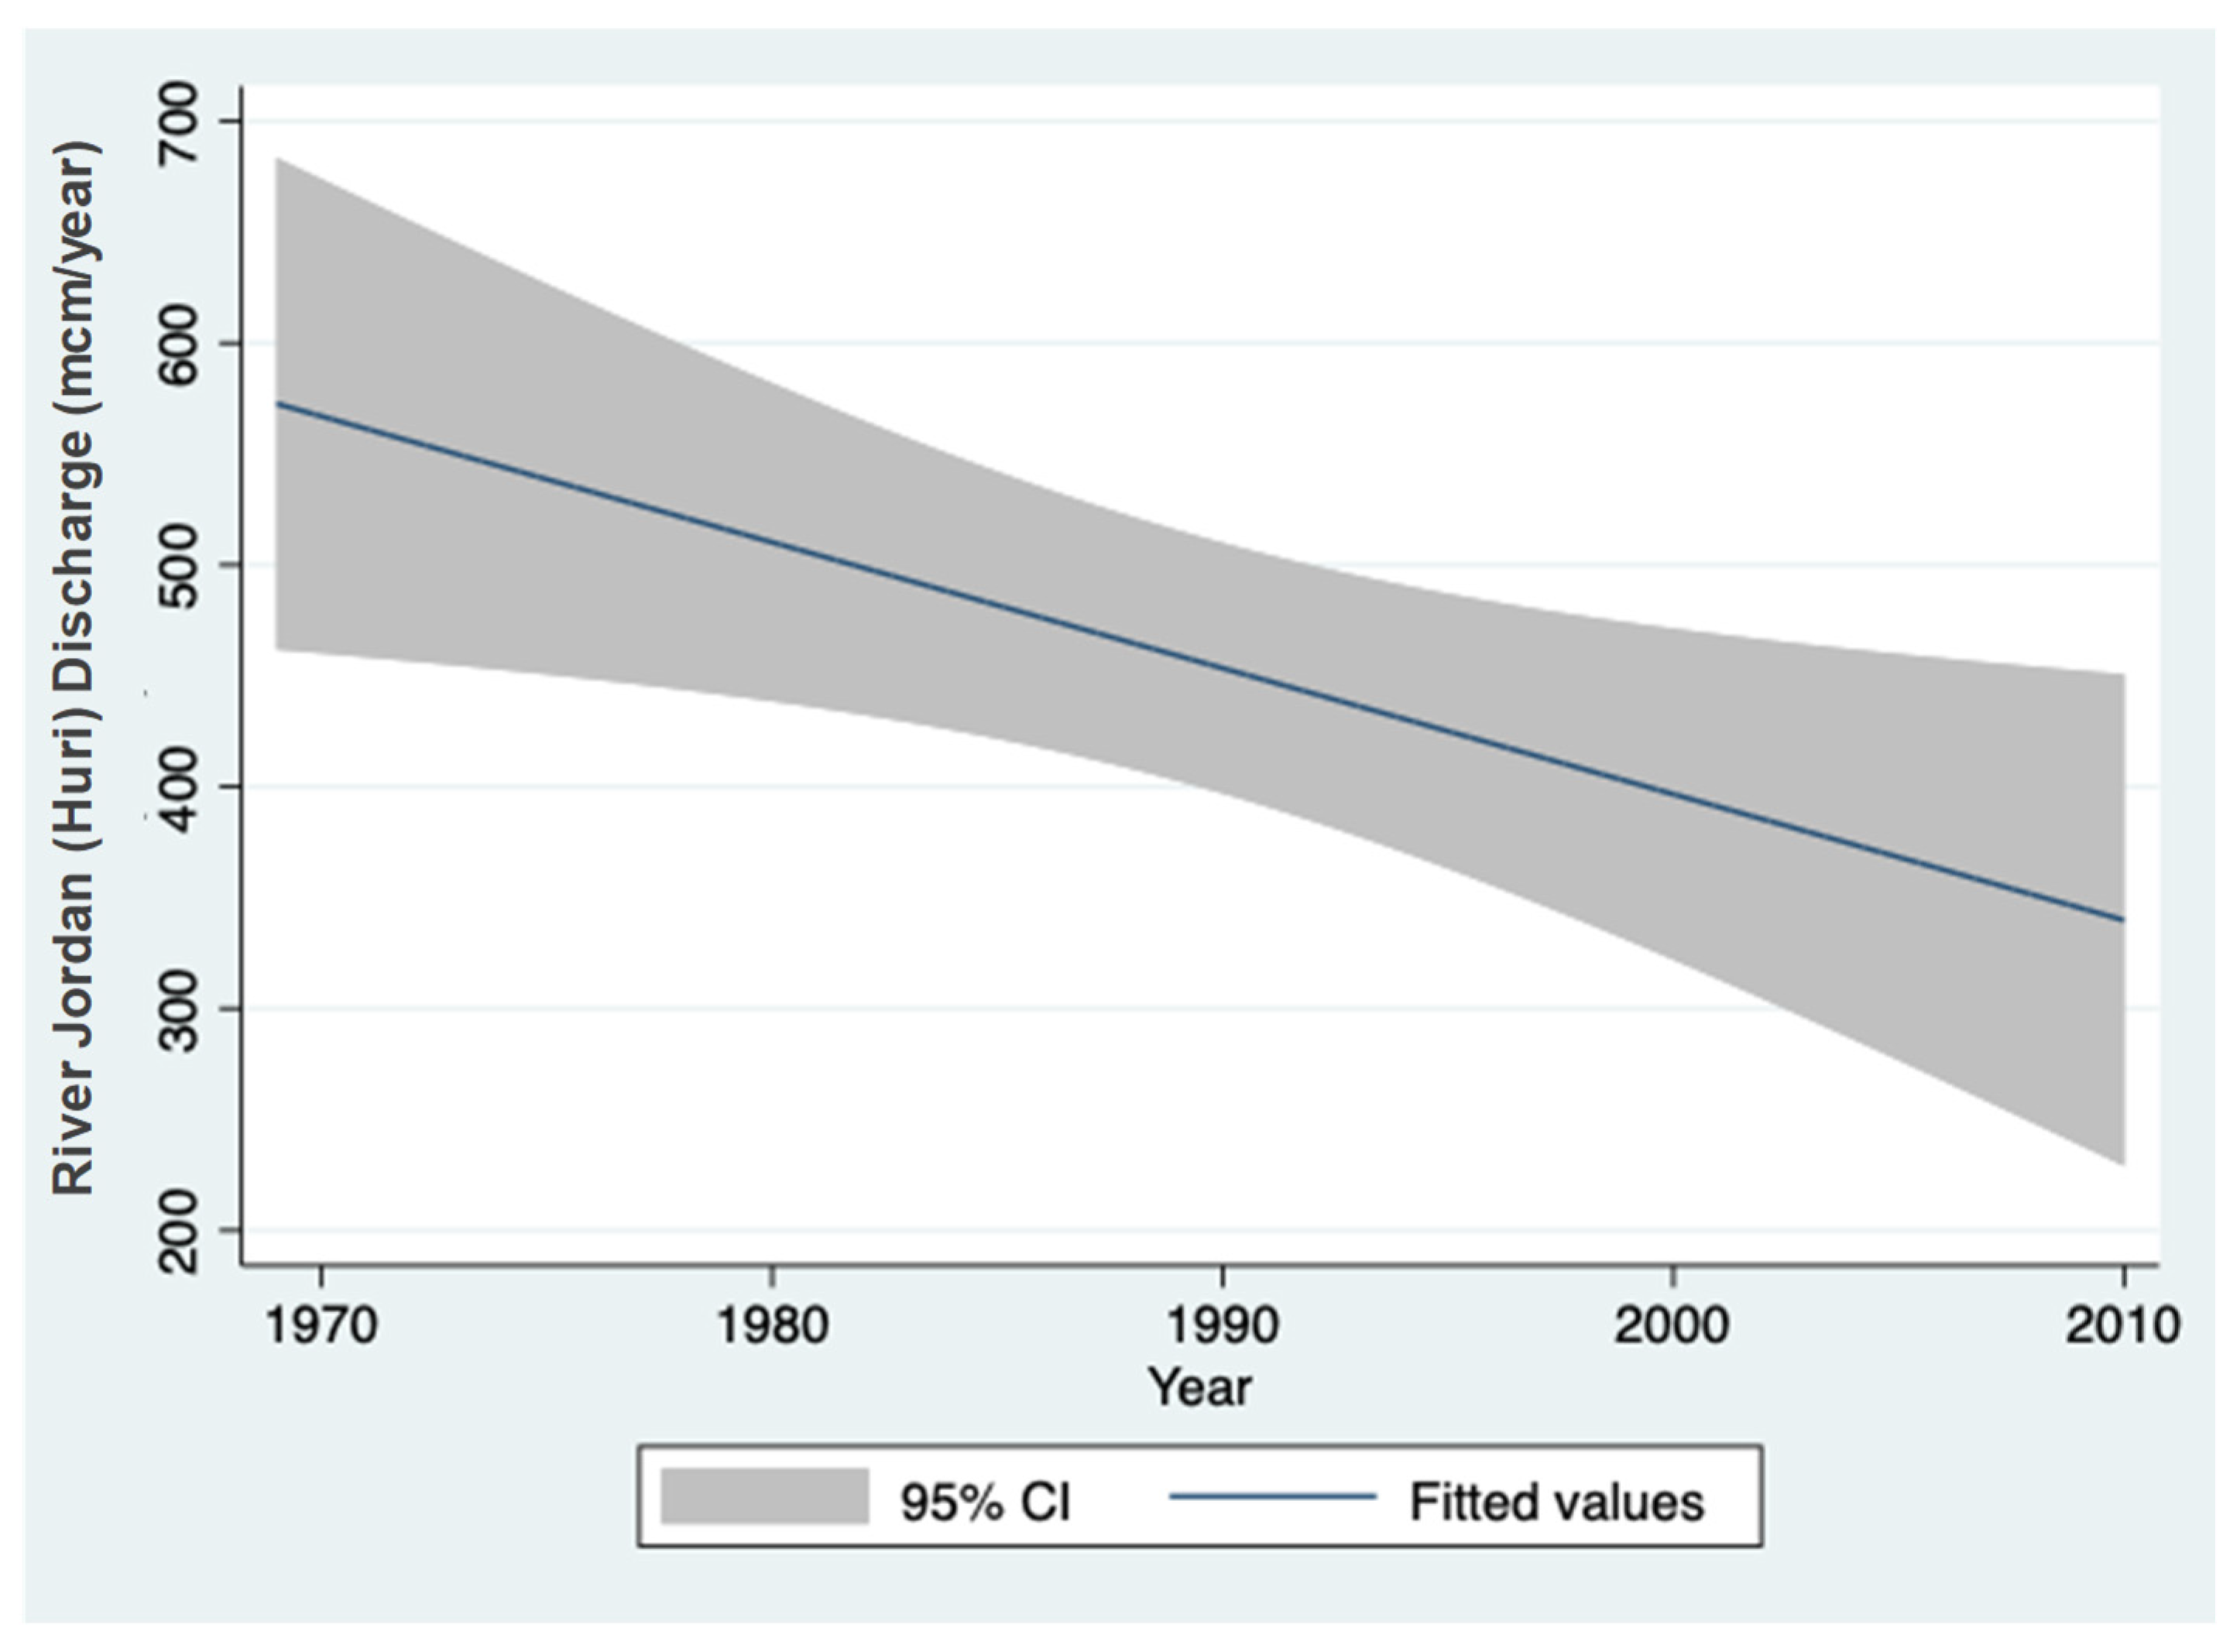
The long-term (1970–2010) decline of the River Jordan discharge presented in Figure 5 confirms the regional Climate Condition Changes (CCC).
The annual and monthly fluctuations of SO42− input into Lake Kinneret through the discharge River Jordan are shown in Figure 6, Figure 7, Figure 8, Figure 9, Figure 10, Figure 11 and Figure 12.
The dependent SO42− capacity within the River Jordan discharge indicates the seasonality of the CCC realities: 1970–1978, sharp decline, 1978–1998, moderate decline; early 2000s, sharp decline. The long-term decline of Jordan discharge and consequently SO42− input was confirmed.
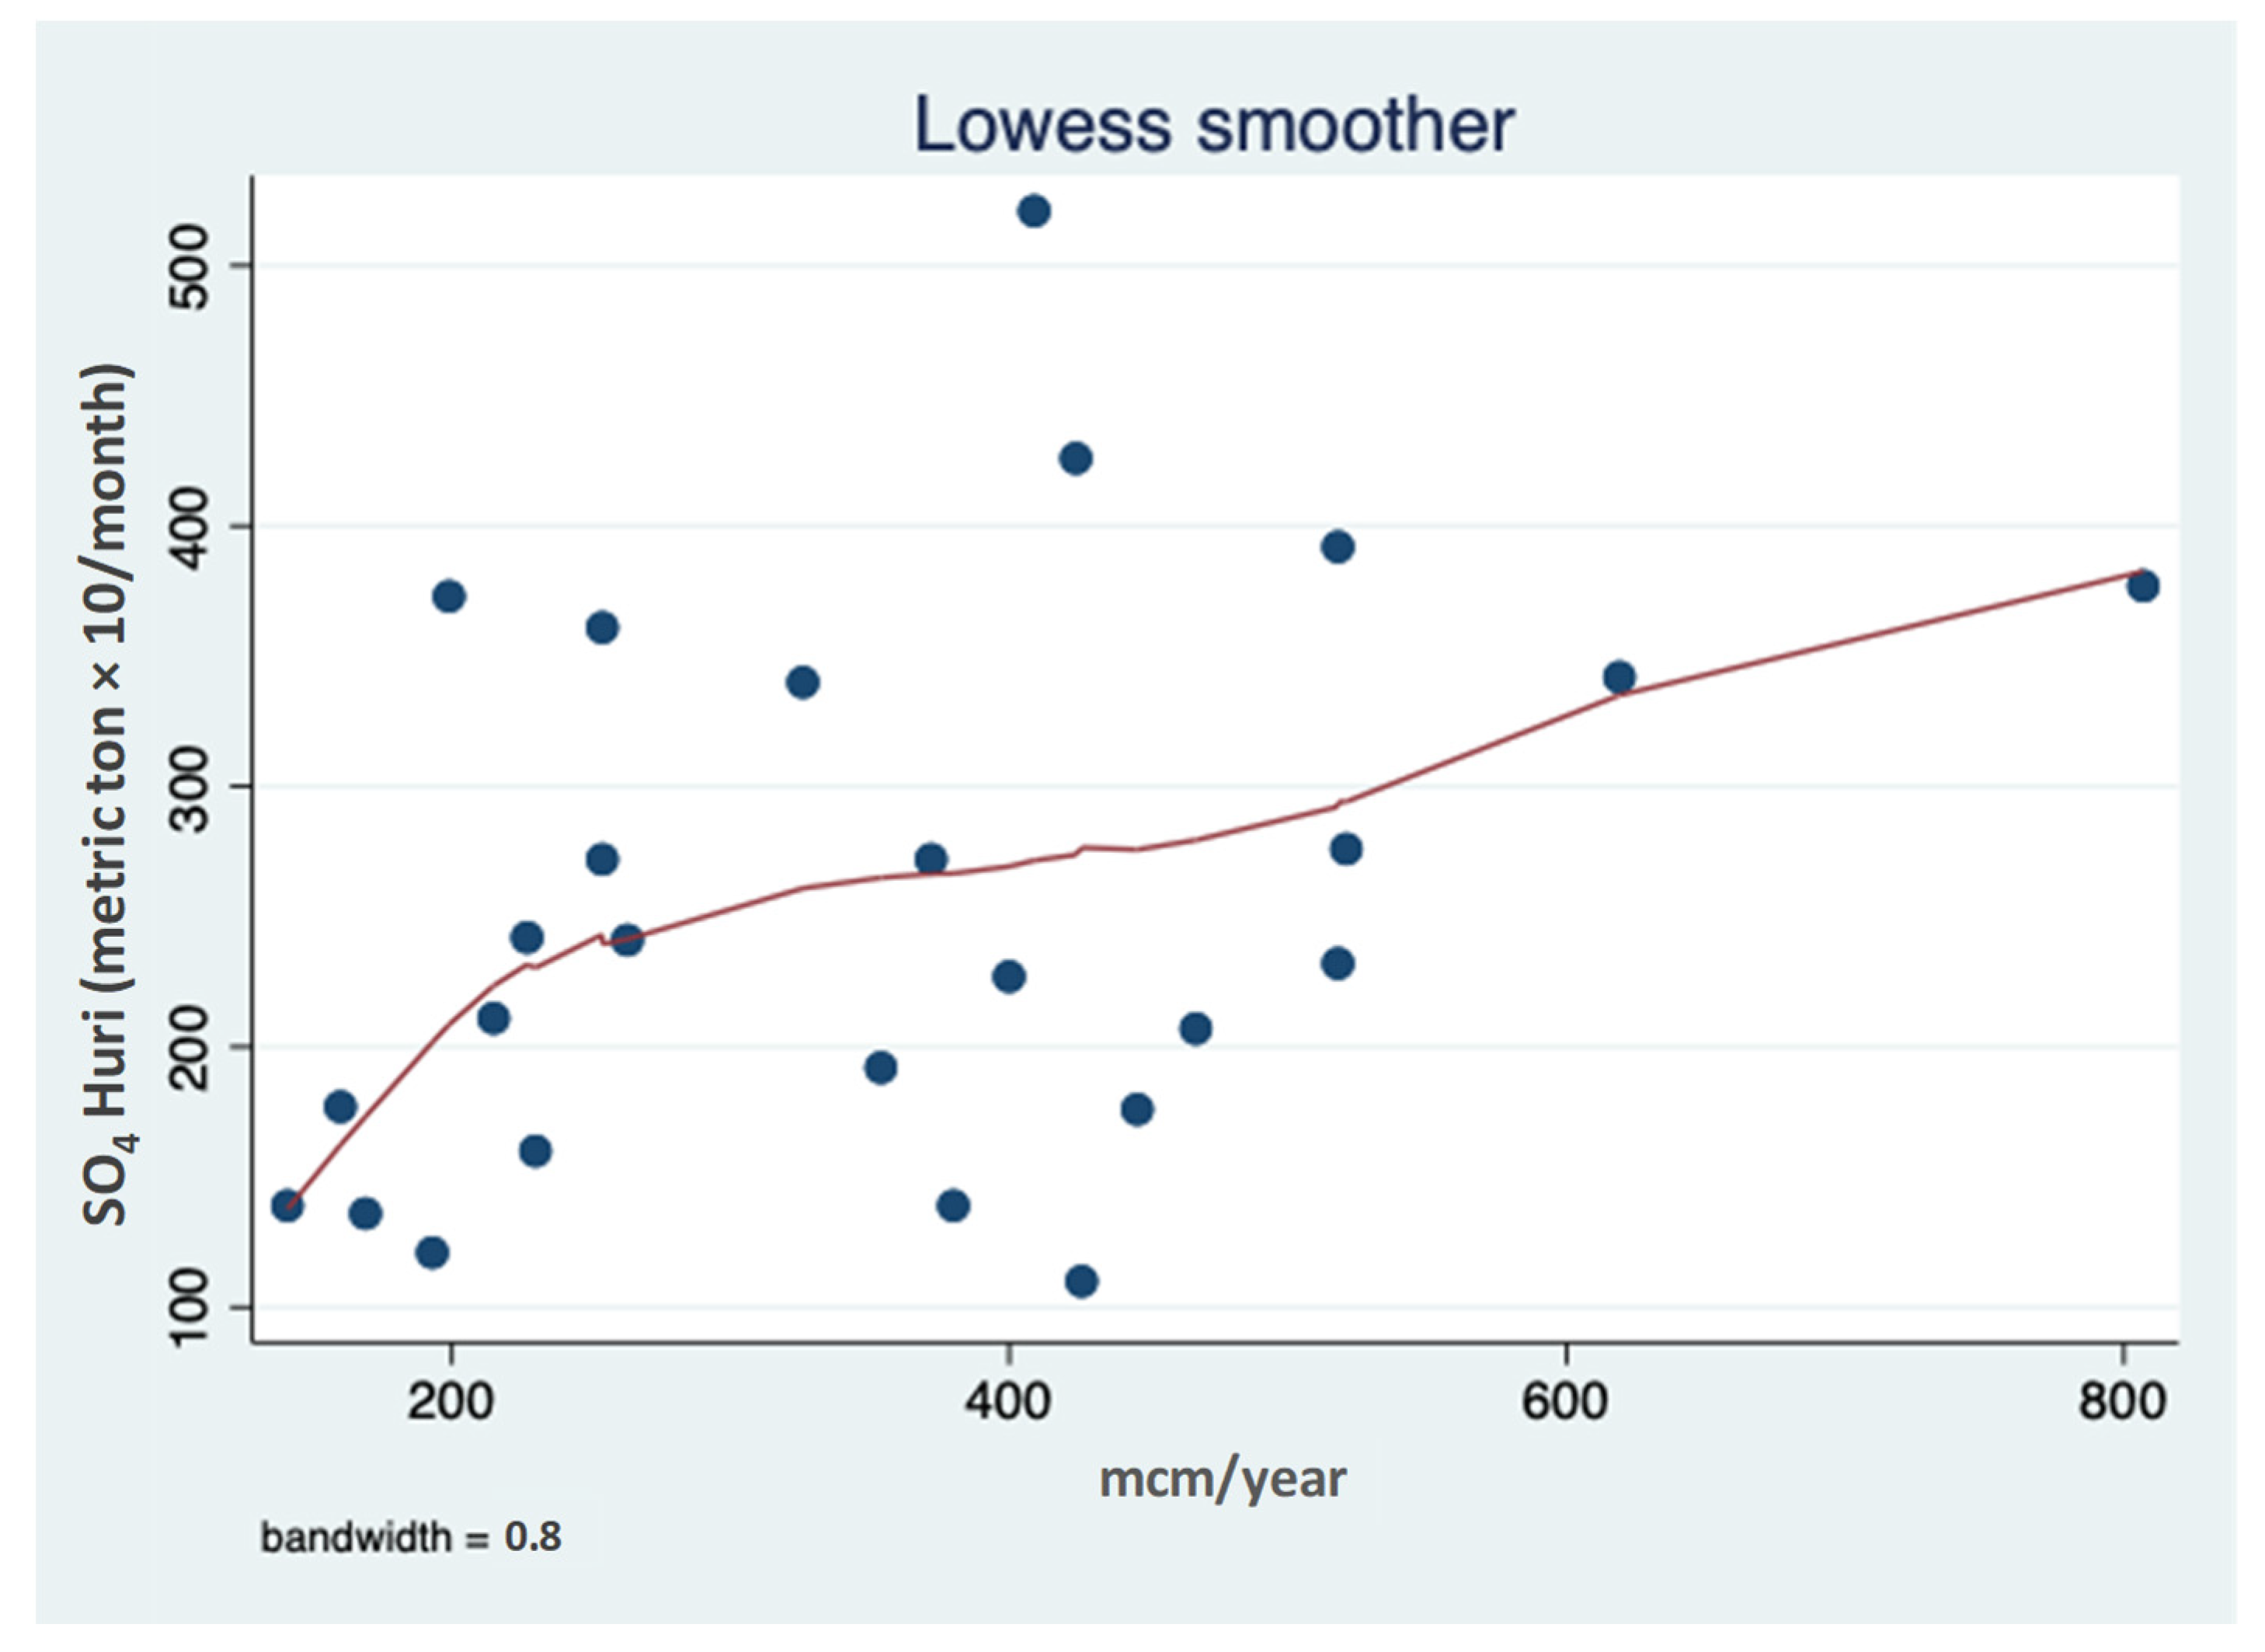
The dependence relation between SO42− input and discharge is confirmed in Figure 7. The higher the discharge, the higher the SO42− input.
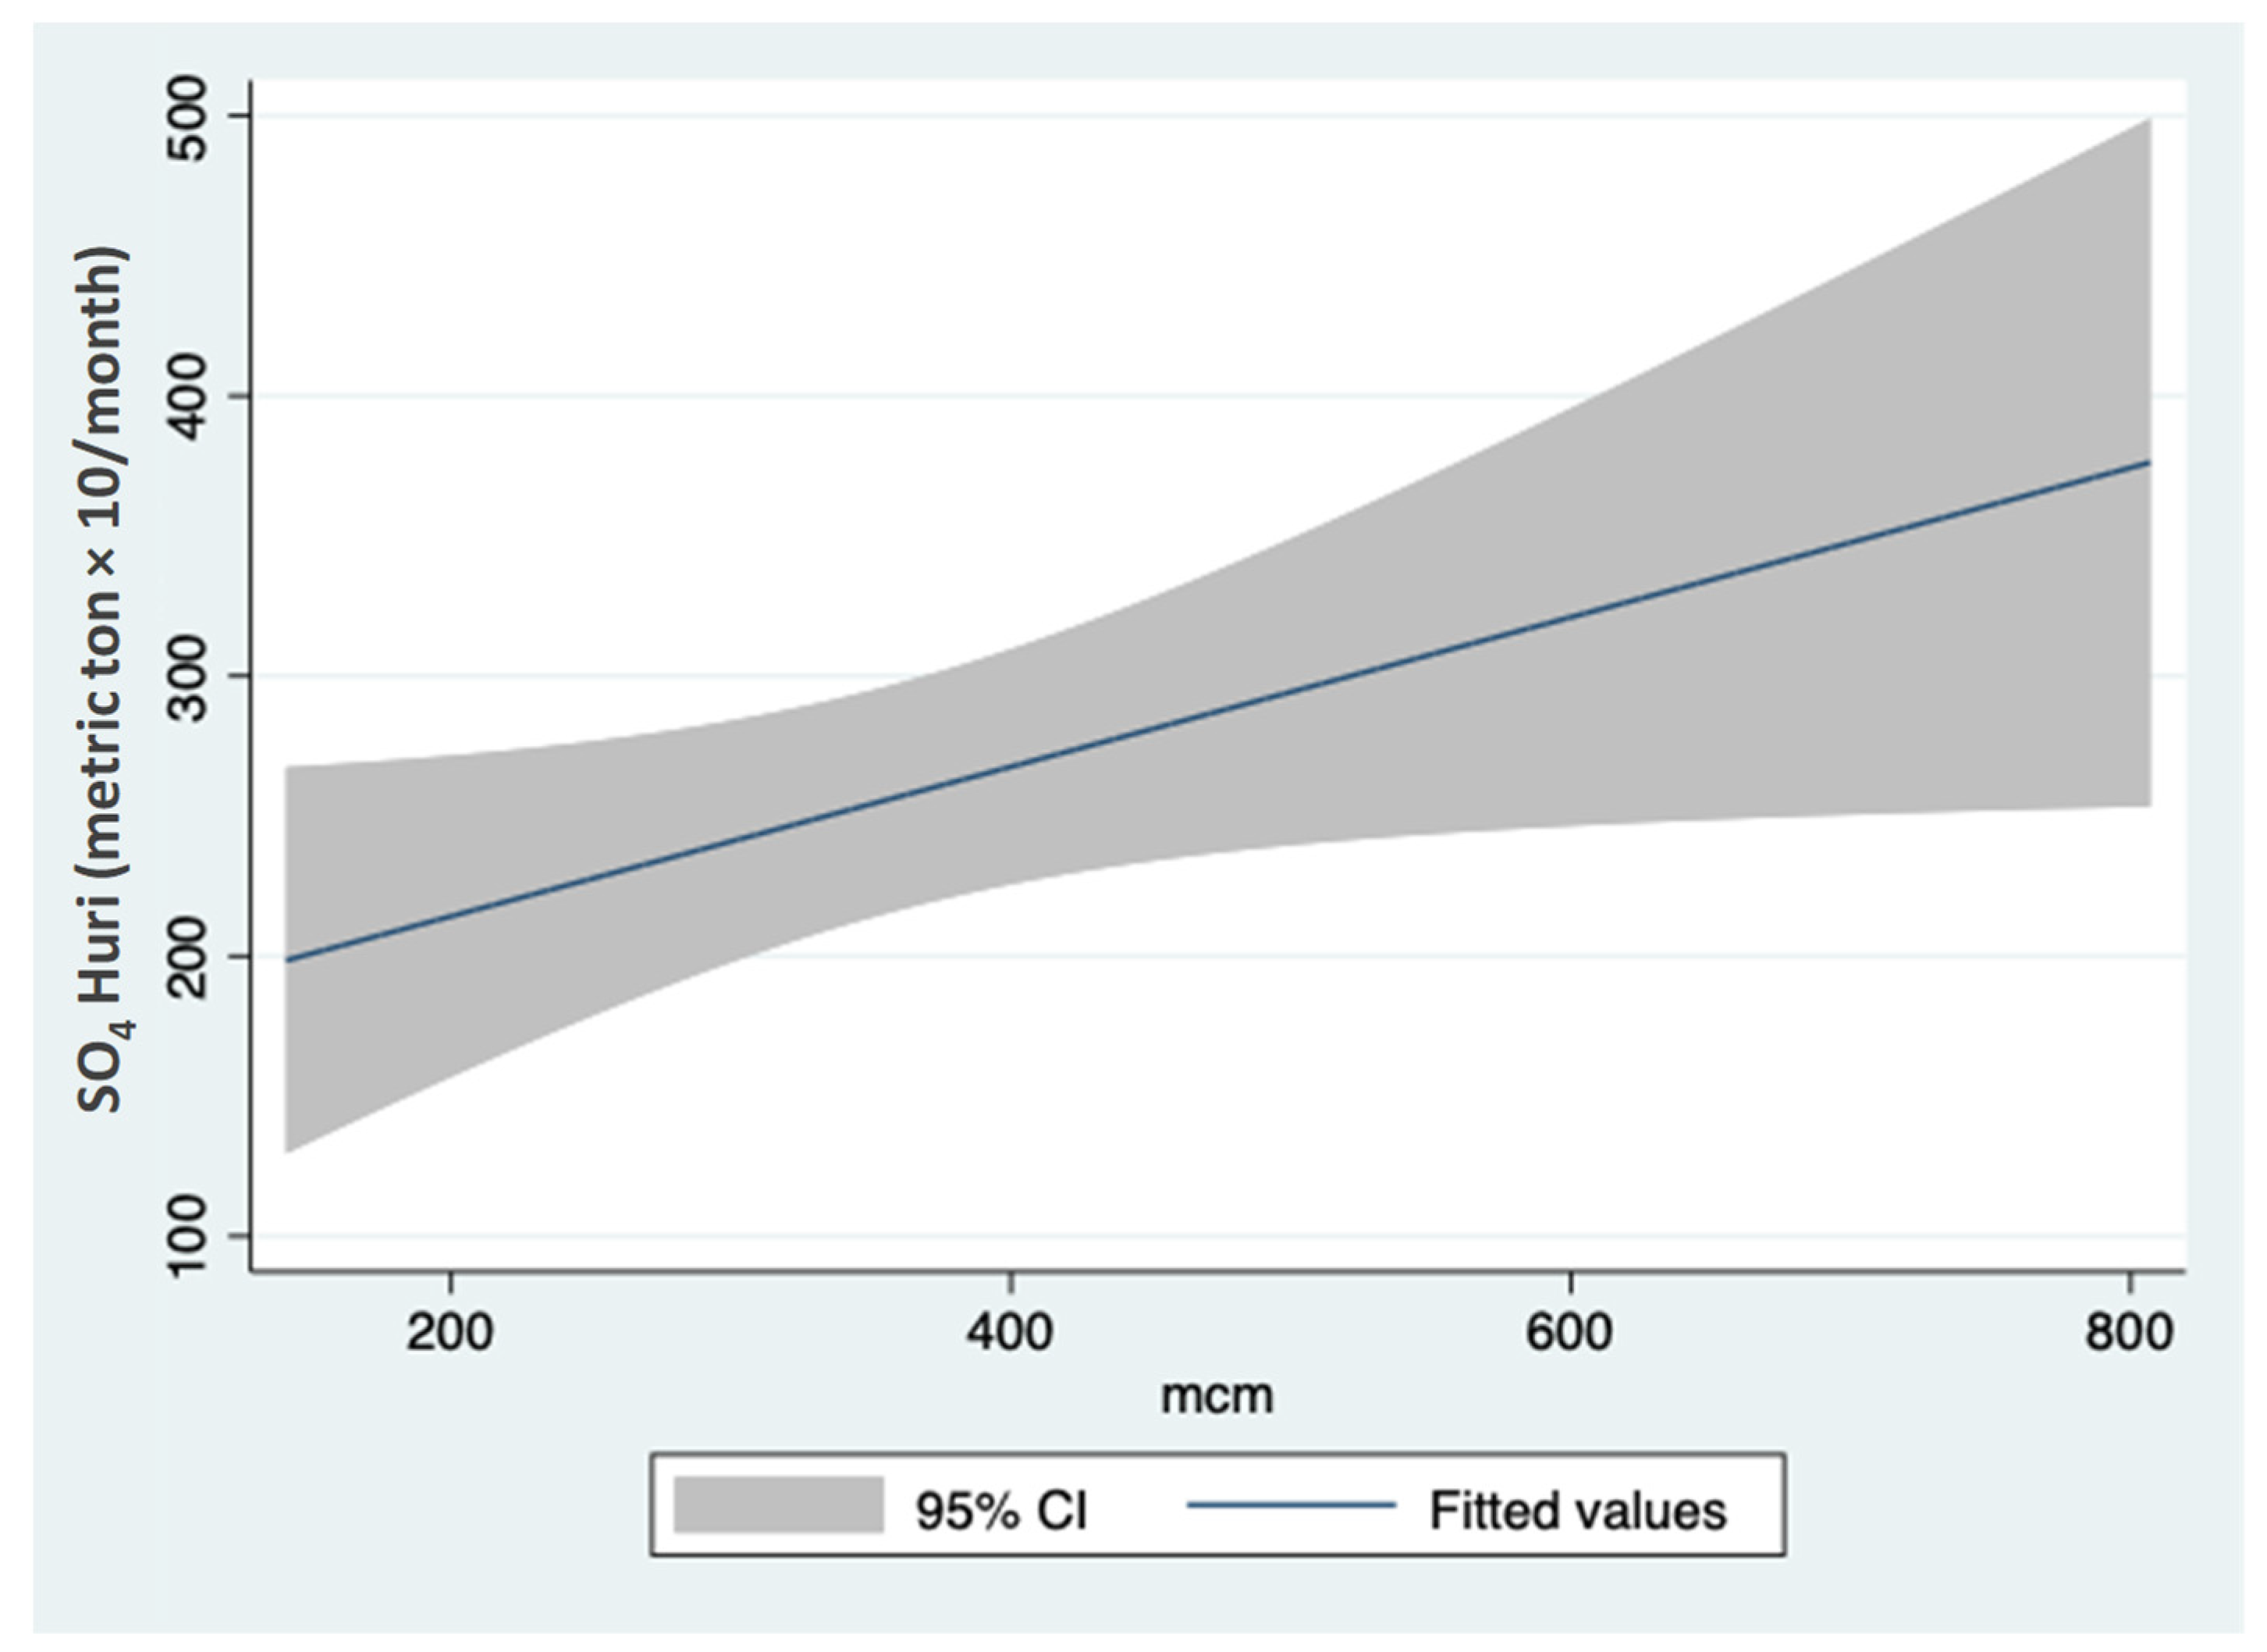
The significant linear regression between monthly values of SO42− input and River Jordan discharge is confirmed in Figure 8.
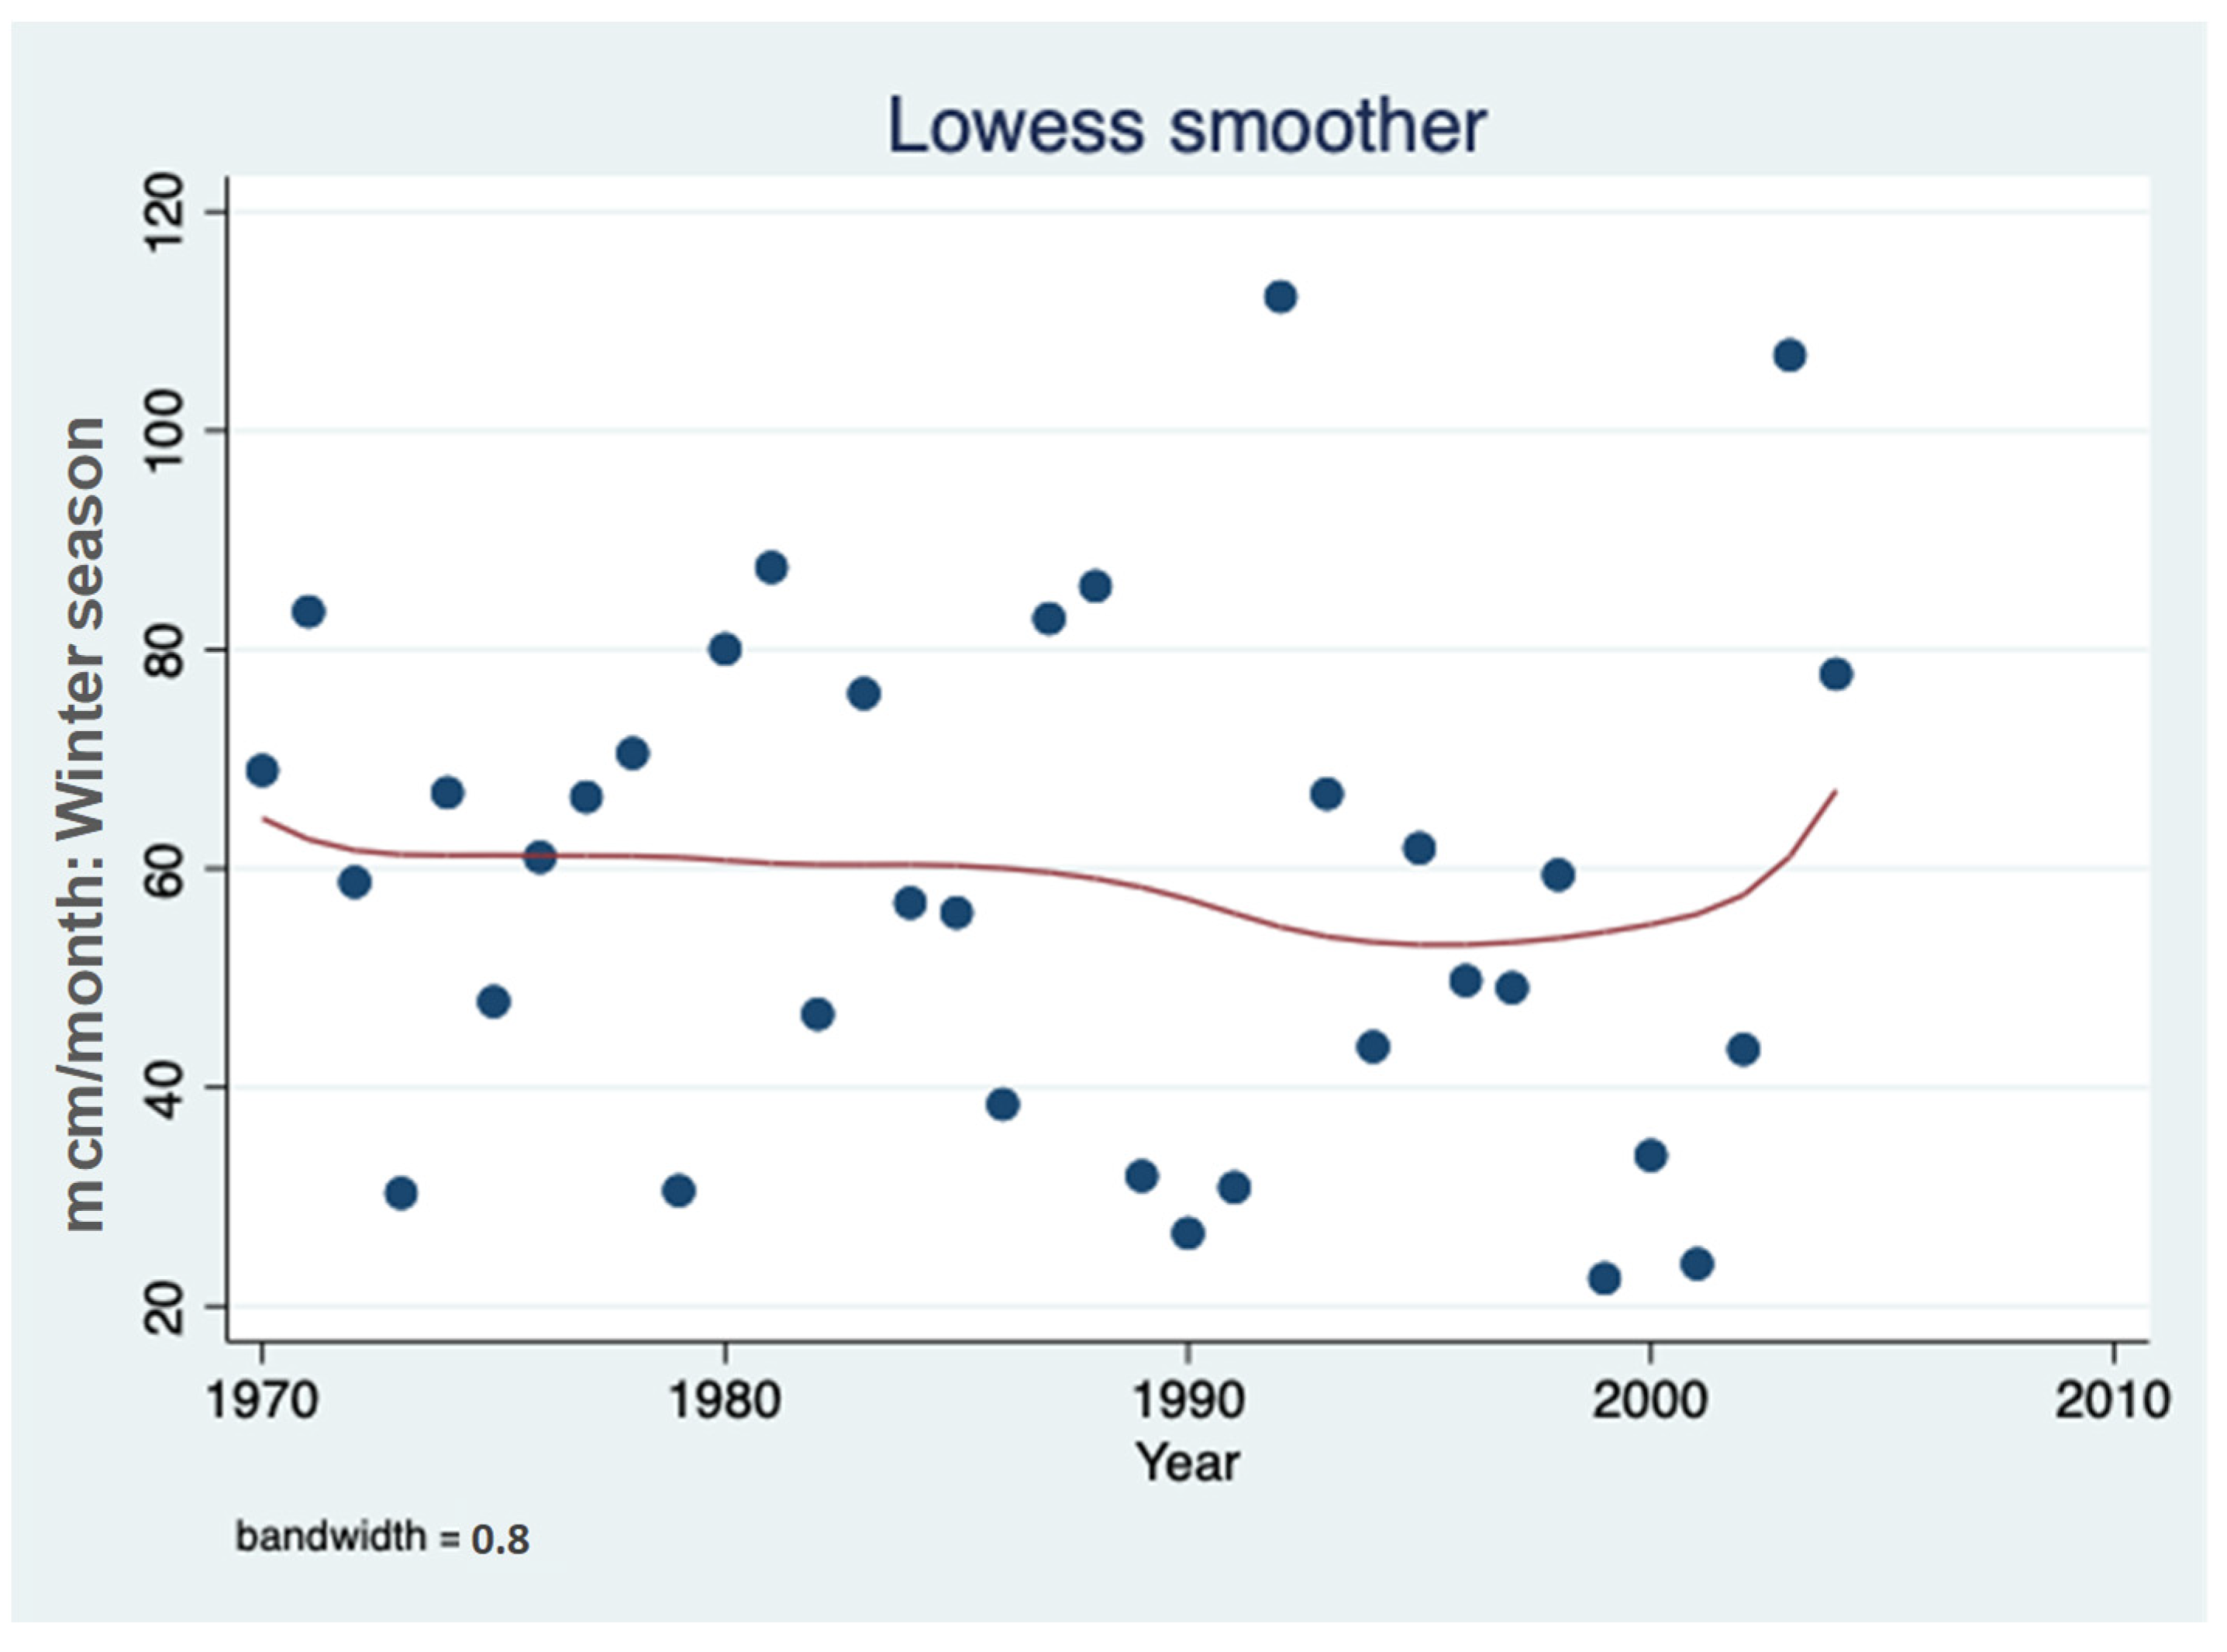
Results given in Figure 9 indicate that even in winter months (1–5), a long-term slight decline of River Jordan discharge was documented during 1970–1997, which then slightly elevated afterwards during early 2000s.
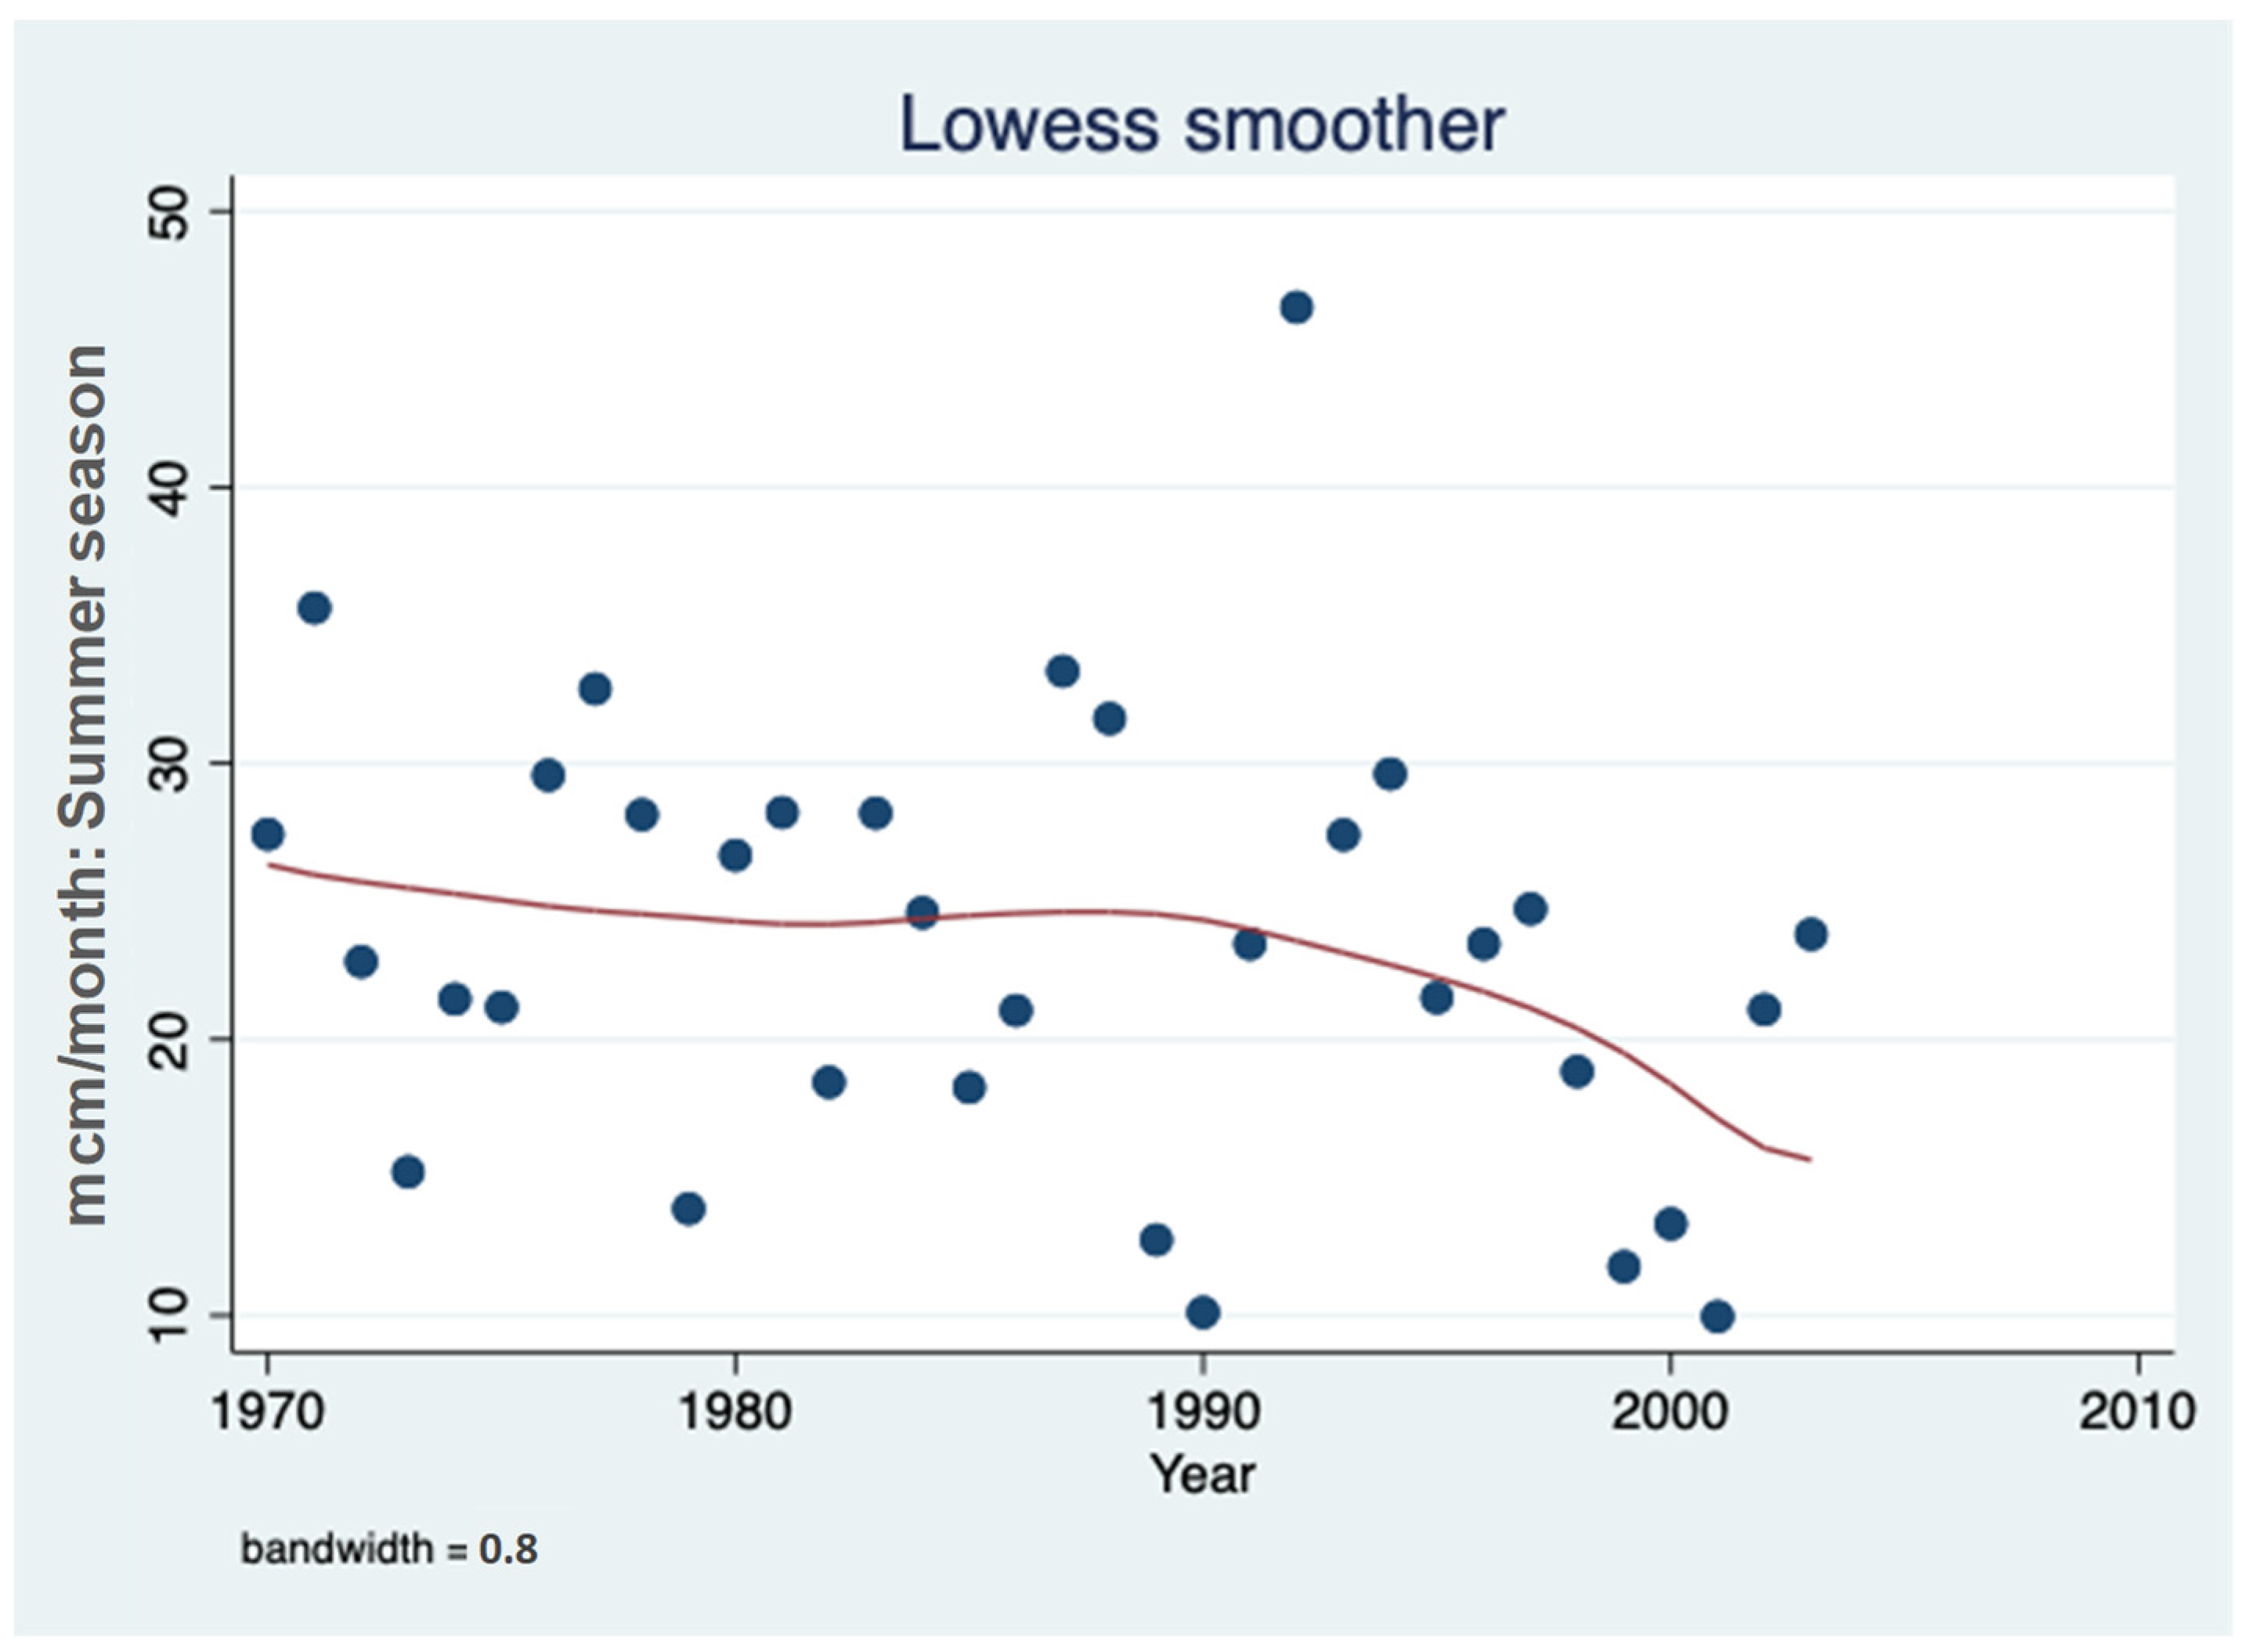
In continuity to Figure 9, the summer–fall (6–12) Jordan discharges also represent significant decline.
Figure 9 confirmed a slight decline of Jordan discharges in winter. Nevertheless, SO42− inputs through Jordan winter discharge very slightly fluctuated (1970–2004).
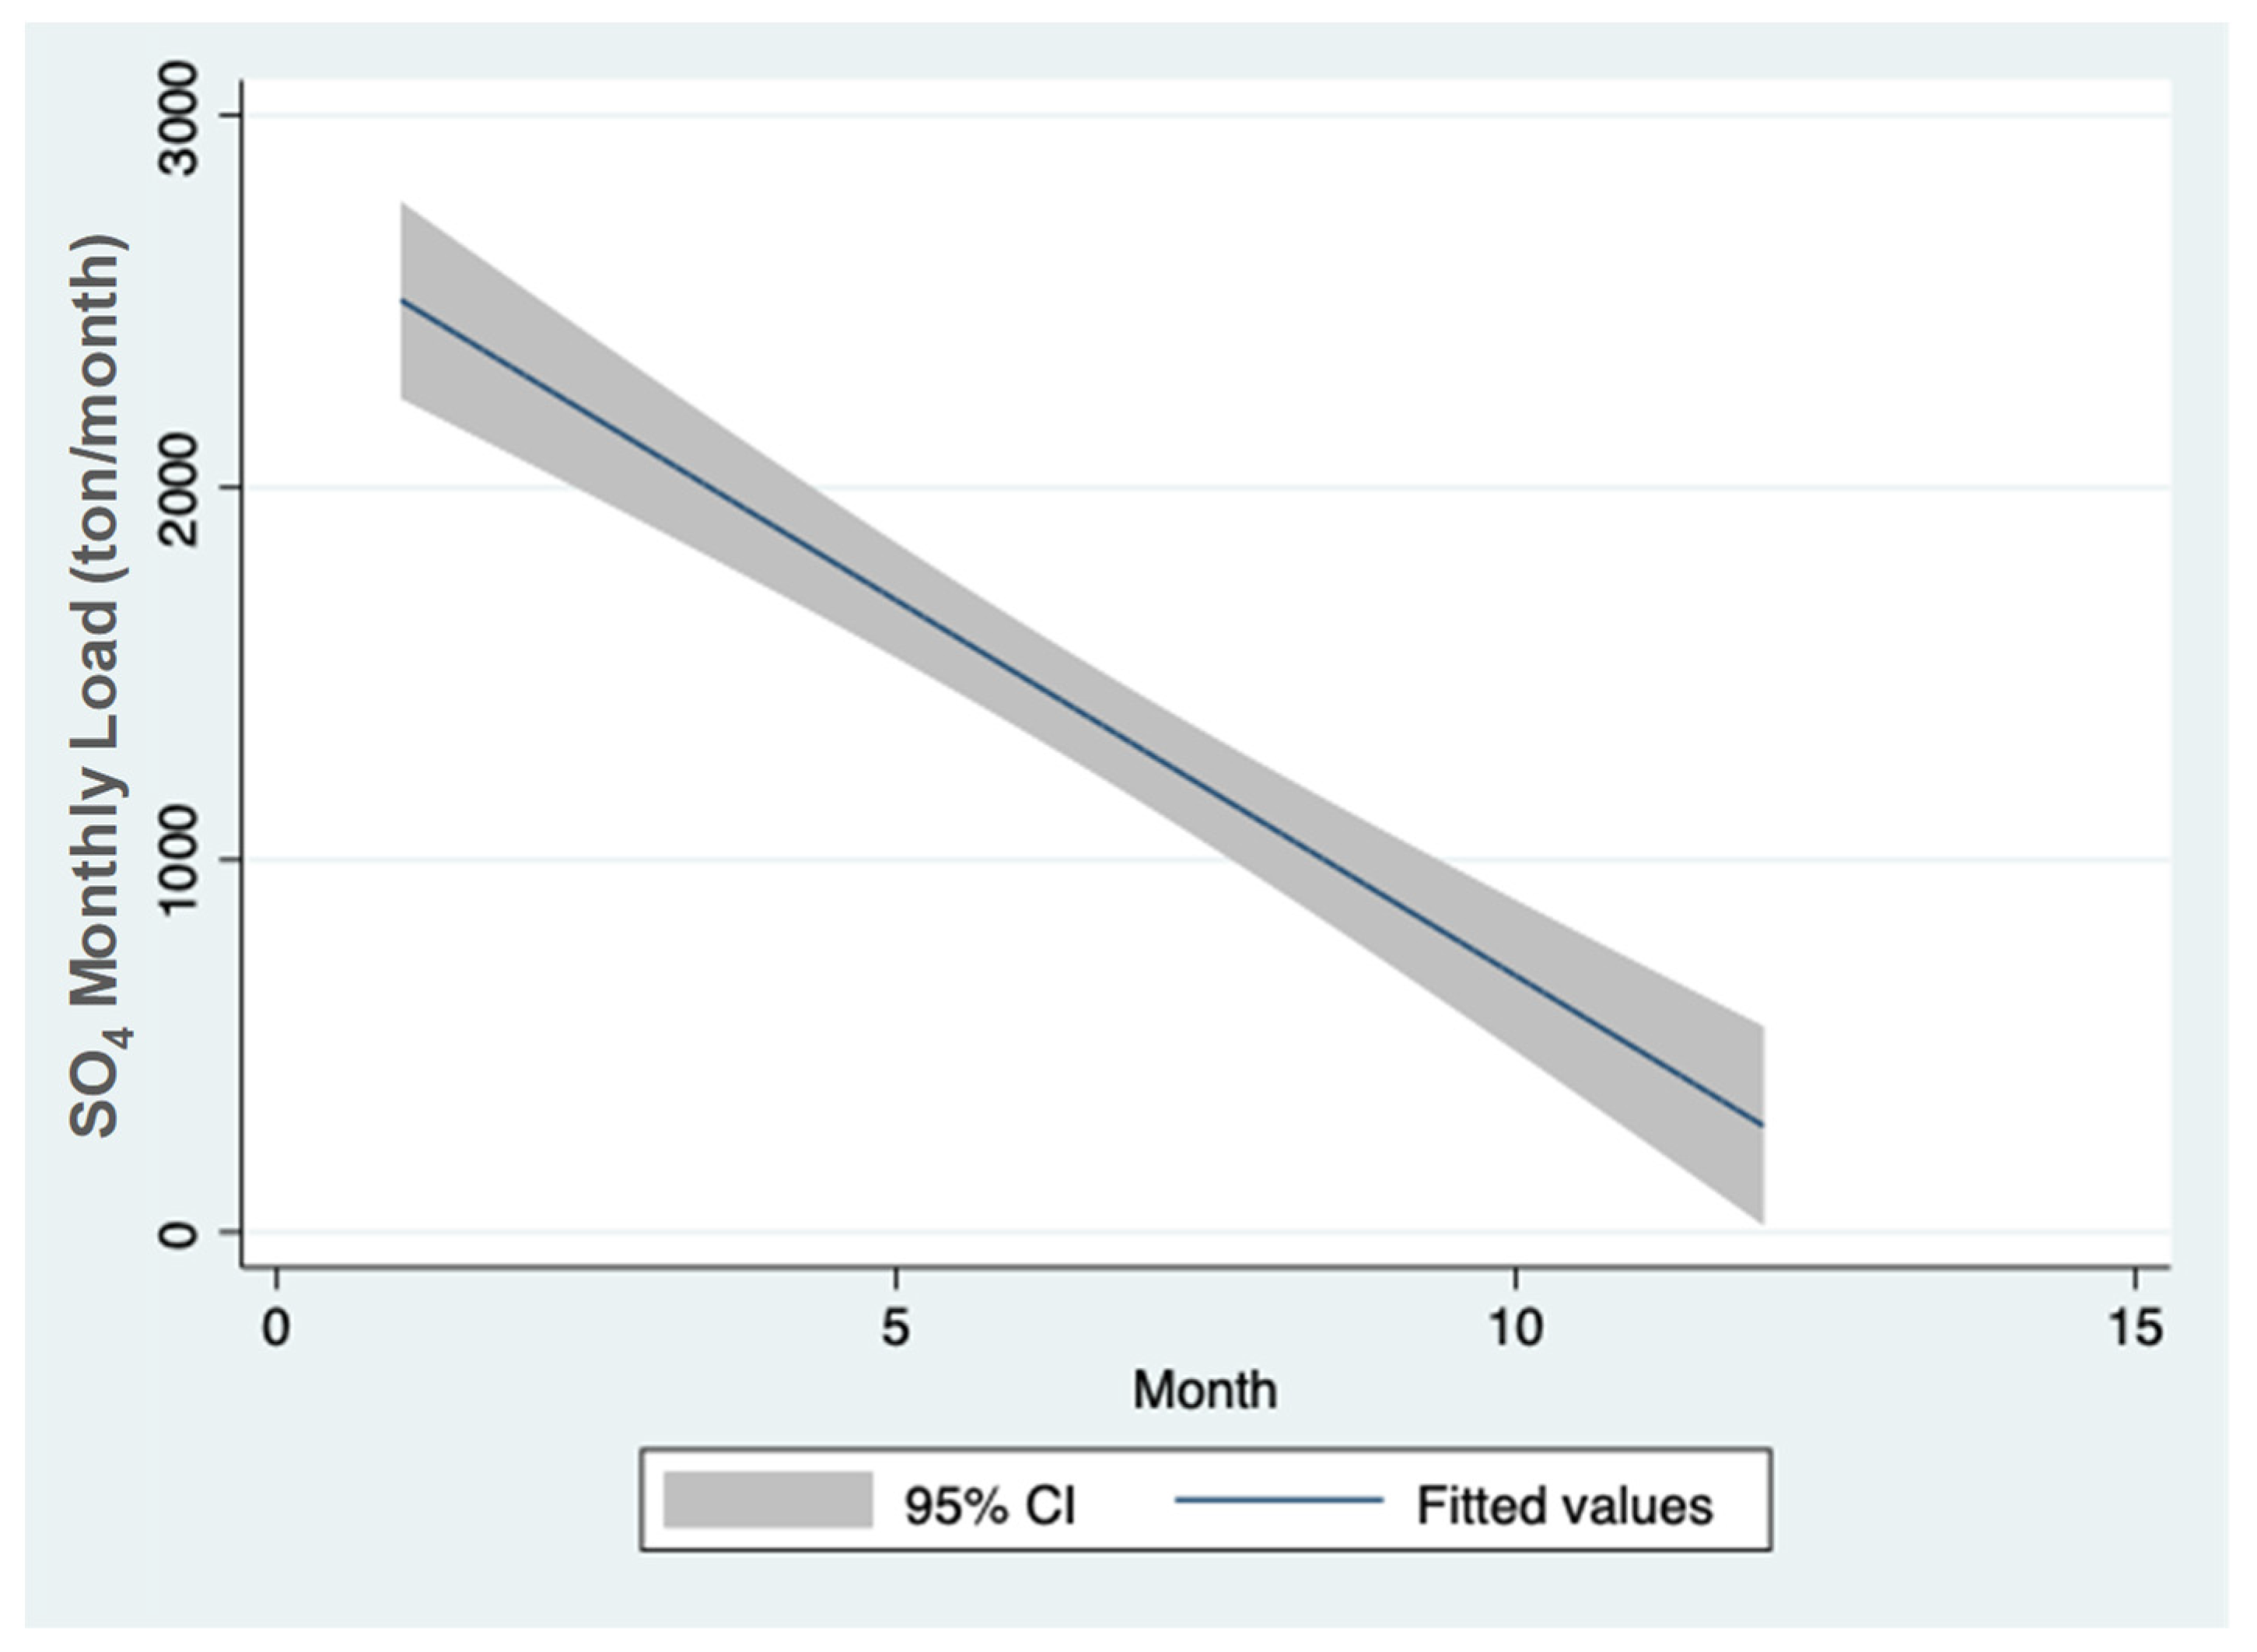
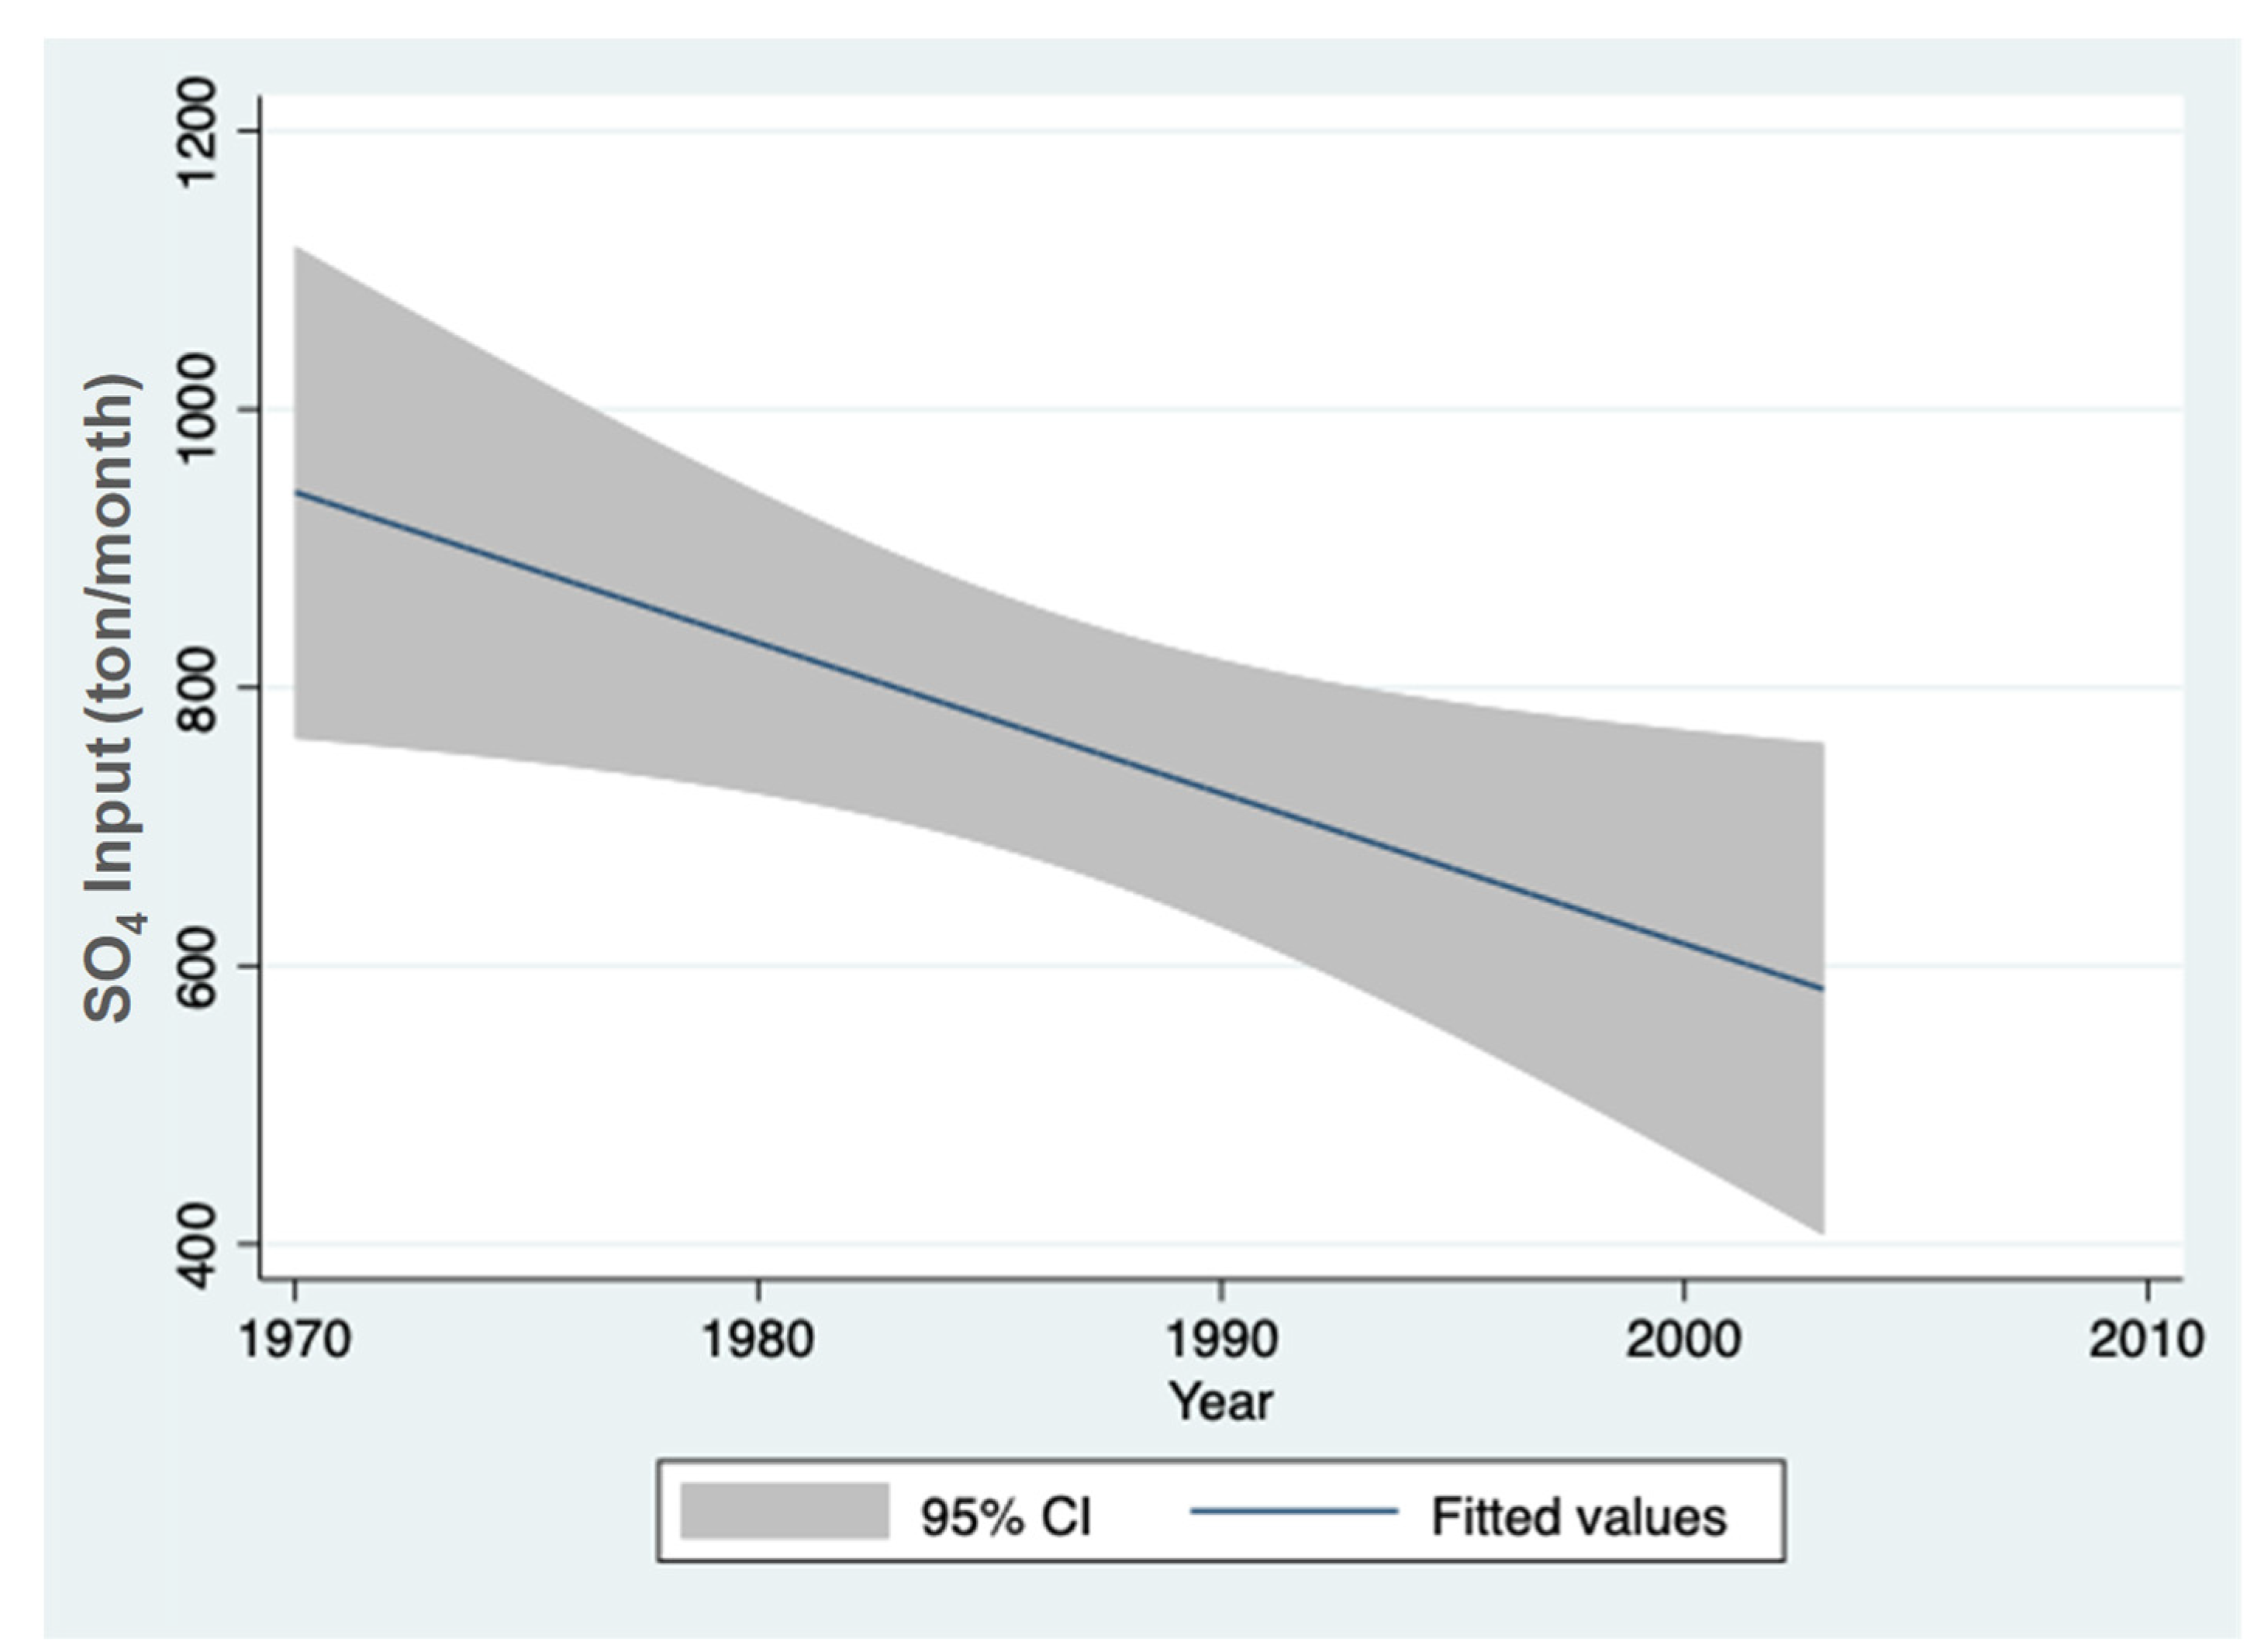
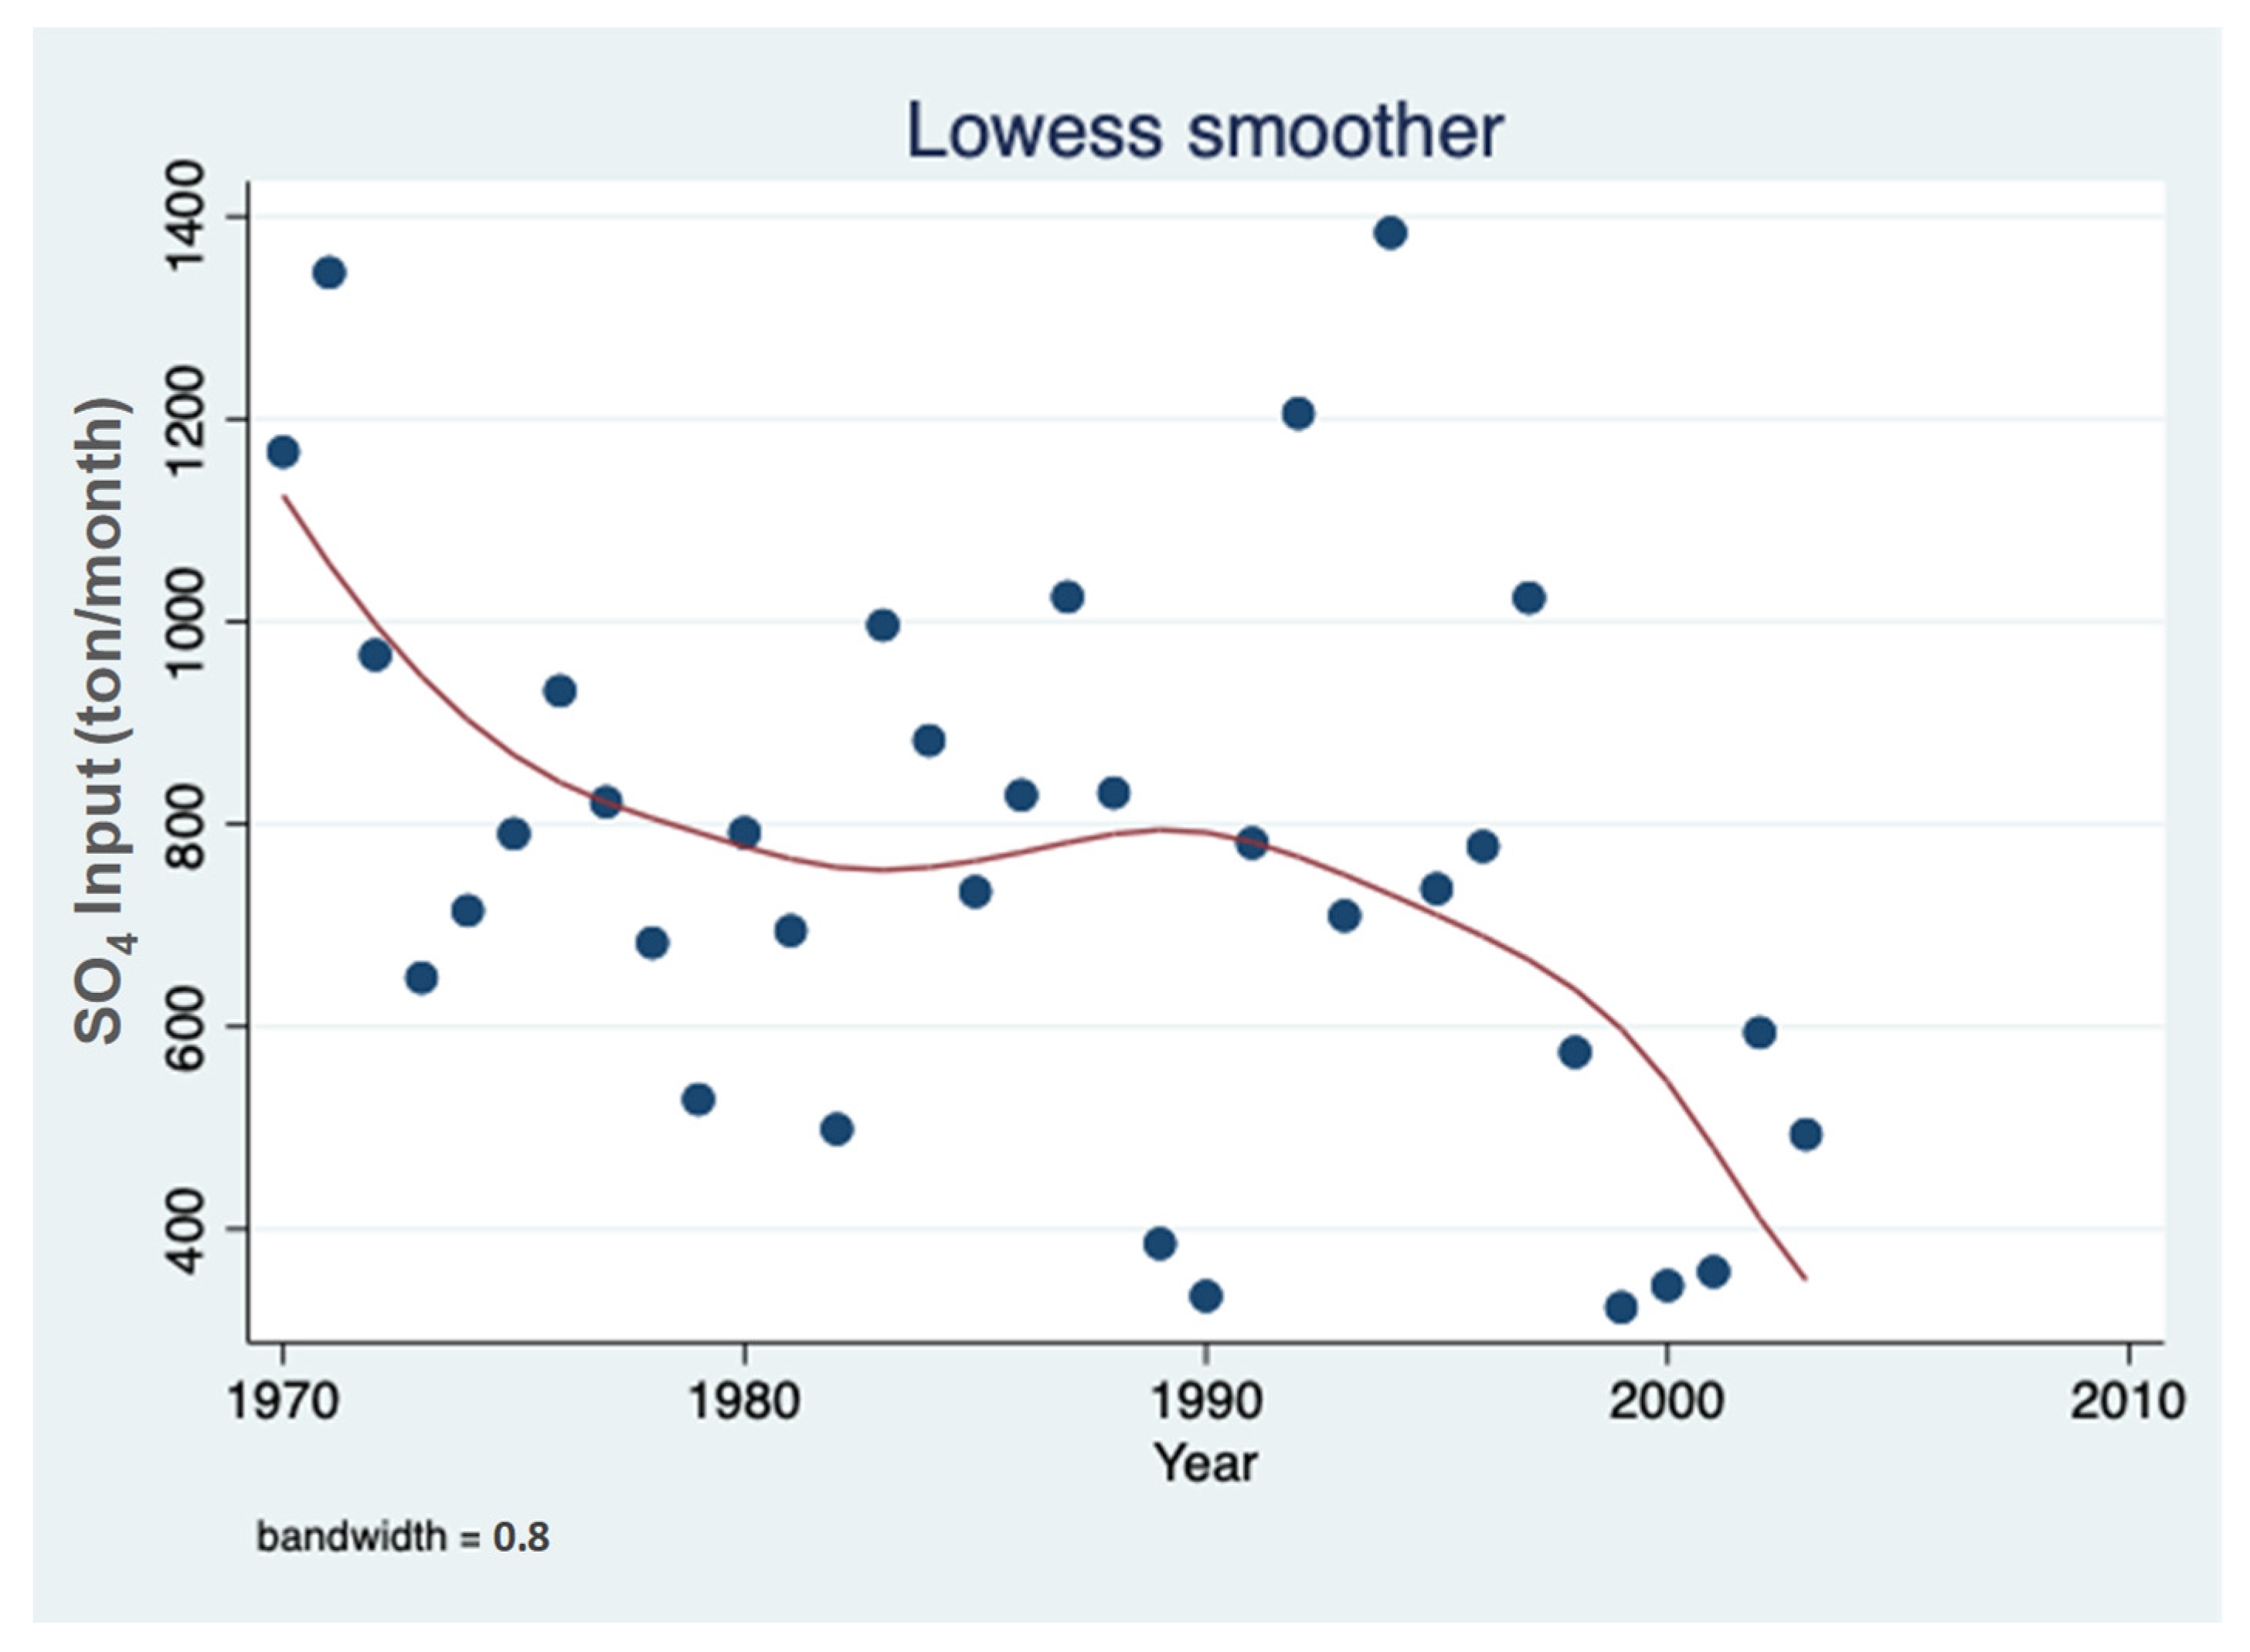
SO42− input capacities through the Jordan River discharge during summer–fall months (6–12) are shown in Figure 12, Figure 13 and Figure 14.
Lake Kinneret and its watershed are included within the tropical geographical global climate zone. Therefore, the winter is short, wet, and cold whilst the summer is long, dry, and hot. The results shown in Figure 12 support the geographical determination of significant (r2 = 0.7841; p < 0.0001) decline of the discharges of River Jordan during second half of the year. Conclusively, the summer inputs of SO42− through River Jordan into Lake Kinneret were reduced.
Figure 13 reinforces previous Figures showing the long-term (1970–2004) summer decline of SO42− input capacities into Lake Kinneret. Similar conclusions are also seen in Figure 14, as outlined by the LOWESS Smoother (0.8) plot.

4. Discussion

4.1. Sulfur Cycle in Lake Kinneret

Sulfur in lake waters exists mostly as an aerobic form of sulfate and un-aerobic form of Sulfide. Major outsourcing of sulfur to Lake Kinneret is through bedrock erosion and peat soil gypsum dissolution. Internal sourcing includes organic matter protein (amino acids) microbial degradation. Cycling conversion of sulfuric compounds is carried out by bacteria and highly correlated with the seasonal changes of thermal structure and external input [2,15]. External input rate is dependent on climate seasonality; it is heavier when river discharge is enhanced during the rainy season and sharply declines in the summer months. The chemical substance oxidation commonly starts during initiation of stratification when Dissolved Oxygen (DO) is utilized and continues through reduction of nitrate through de-nitrification to nitrite and further to ammonium as a DO source. Further chemical supply of DO originates from a reduction of SO42− to S2−. Consequently, S2− and SO42− exist in anaerobic and aerobic conditions, respectively. The SO42− reduction enriches the hypolimnion with S2−, and during the de-stratification process S2− is oxidized to SO42−. It must be considered that these chemical conversions are microbially operated, which is required to dissolve organic matter supply. The summer composition of the epilimnetic waters in Lake Kinneret was defined by nutrient (nitrogen, phosphorus) limitation resulting in both bacterial activity and sharp reduction of external nutrient import. Moreover, during the summer months the temperature was high and consequently, metabolic demands were elevated as well. Moreover, long- term records of the Kinneret Phytoplankton assemblage composition indicate a domination shift from the bloom-forming nitrogen consumer, Peridinium gatunenze, to N2-fixer cyanobacterium, Apahanizomenon ovalisporum. Apparently, the outbreak of A. ovalisporum in the summer of 1994 was predicted due to prolonged processing of nutrient regime modification indicated clearly in the early 1990s: The Kinneret ecosystem was modified from phosphorus to nitrogen limitation [1,7].

4.2. Molybdenum (MoO42−) in Lake Kinneret

Mo is sometimes described as a “heavy metal”, but its chemo-physical properties are very different from those of the typical heavy metals such as mercury, thallium, or lead. Mo is much less toxic than typical heavy metals. MoO42− is found in nature as an oxidation state in minerals. Most of MoO42− compounds have low solubility in water, but Mo minerals in contact with oxygen form soluble MoO42− [14,23,24,25,26,27]. The relevance of MoO42− to the present issue is due to the nitrogenase enzyme activity enabling N2-fixation by species of cyanobacteria. The catalytic property of nitrogenase of breaking the chemical bond of atmospheric nitrogen molecule enables its fixation into biological substances [11,13,28,29,30,31,32]. Very little is known about the distribution of MoO42− in Lake Kinneret and its drainage basin [17]. Results of an experimental study that was carried out with heavy metals (Zn, Cd, Pb, and Cu) indicated that the annual thermal structure changes, which also implies that oxic-anoxic cycling of heavy metals are fixed into the sediments during summae stagnation and might be released during winter turnover period [28,29,30]. A thorough survey of 24 metal (including MoO42−) concentrations (dissolved and particulate) was conducted in Lake Kinneret and Jordan and Meshushim (Golan Height) Rivers. The existence of MoO42− was documented in the epilimnion and the hypolimnion of Lake Kinneret and Jordan and Meshushim Rivers in all samples collected. Concentration ranges of Mo in Lake Kinneret varied between 0.5–1.5 µg/L (0.00521–0.0156 µM). The inventory of Mo was partly documented [14,23]. It was indicated in those reports that during stratification MoO42− concentrations in the hypolimnion were lower than those in the epilimnion, and temporal fluctuations were negligible. Common concentrations of Mo in Lake Kinneret varied between 0.5–1.5 µg/L (0.00521–0.0156 µM) [23]. Evaluation of the long-term fluctuation of the SO42−:Mo molecular (M) ratio was computed (Table 2).
The averaged periodical (1969–1978; 1985–1995) measured concentrations of Mo (µM), which is the dissolved form of MoO42− predominantly, the anion in the Kinneret epilimnetic oxic high pH [15,23] conditions, and the anion of SO42−, and the ratio between them is given in Table 2. Prominent differences of Mo concentrations between this oxic epilimnion and the anoxic hypolimnion were indicated, while no significant periodical differences were documented [23].
Results given in Table 2 indicate the SO42−:Mo (M Ratio) status in Lake Kinneret is of an intermediate position of salinity, probably brackish waters [11,12,13,15,27]. Nevertheless, prominent periodical decline of this ratio was seen during 1985–1995, as well as the outbreak of the N2-Fixer cyanobacterium, Aphanizomenon ovalisporum [1,7].

4.3. SO42− Flushing from the Peat Soil

The high content of gypsum (CaSO4) is widely documented [19,20,21,22]. The gypsum is significantly dissolved in water releasing free Ca2+ and SO42−:
CaSO4 → Ca2+ + SO42−.
Previous given results confirmed decline of rainfall, and consequently lower river discharge and suppression of SO42− concentrations and loads in the Hula valley runoffs, River Jordan, and Lake Kinneret waters. Consequently, the potential impact of peat–soil moisture (GWT depth) and SO42− drifting was evaluated. It has been suggested that the more wet peat–soil volume there is (higher GWT), the higher the SO42− flushing. The last summer–fall month shortly before rain starts, October, was documented during 2013–2021 when the foremost five years were drought, and then in the period of 2019–2020 heavy rainfall was documented. Results shown in Table 3 indicate that lower rain capacity during 2014 and 2016–2018 and to a lesser extent in 2021 induced lower GWT, causing higher volume of dry peat soil and probably initiating lower levels of SO42− drifting (Figure A1; Table 3 and Table 4). On the contrary, during 2019–2020, heavy rainfall enhanced GWT elevation as greater water covered the area, which increased the volume of highly wetted peat soil and possibly enhanced SO42− drifting (Table 3 and Table 4).
Considering 2418 ha (Table 3) as the total area of peat land (soil) and 5 m below surface as the lowest depth of GWT, a total volume of a block is formed by 120.9 × 10⁶ m3. Based on GWT depth and areal stretch mapping (total area 2418 × 103 ha), the peat soil area was divided into two layers: (1) Wet—from the top of GWT to 5 m depth, and (2) Dry—from the top of GWT to surface. The volume of each layer in October during 2013–2021 was computed, and the results (106 m3) are given in Table 4.
The higher volume of dry layer during low rainfall capacity (see Table 2) and vice versa is prominent. With the flushing of gypsum (CaSO4) derivate, the SO42− is moisture dependent and the soil moisture is higher, therefore the SO42− flushing capacity is higher and vice versa. Dryness conditions therefore initiate a decline of SO42− flushing from the Hula Valley.
Linear correlation between annual rainfall (Figure 3) and the volume of wet layer in the gypsum rich peat soil (total area 2418 × 103 ha) was found to be significant at r2 = 0.6837 and probability (p) = 0.0060, indicating prominent decline of gypsum dissolution and SO42− flush towards Lake Kinneret during the summer droughts.
The role of trace metals, particularly molybdenum, in aquatic and terrestrial ecosystems has been widely documented [31,32,33,34,35]. It was suggested [36] that the expansion of N2-fixing cyanibacteria (NFC) was delayed while the availability of bio-essential metals such as Molybdenum in the oceans was limited. An indication was made (Parnell et al. [36]) that the evolution of NFC during the Proteromesozoic Era may have been promoted also in lakes. Molybdenum availability is critical to life in lakes and oceans [11,13,31,32,33,34,35,36,37]. The presence of MoO42− in rainwater has also been documented [38]. The ecosystem implication of MoO42− is mostly bound to the nitrogen fixation process and general primary productivity, and particularly to the nitrogen fixation process [10,11,27,31,33,34,35,36,37,38,39,40]. The potential of limited control of N2 fixation and NO3 uptake in lakes was documented by Romero et al. [37]. Conclusively, the nitrogen cycle and primary productivity in aquatic (freshwater and marine) ecosystems are dependents of N2 fixation which is in turn controlled by the activity of the MoO42−-dependent nitrogenase enzyme. A reconciliation of the complexity of interaction was initiated through the SO42− factor. The sulfate (SO42−) ability to compete with molybdenum (MoO42−) on uptake sites resulted in the ions sharing similar charge-to-mass ratio and stereochemistry [13]. Suppression of cyanobacteria growth by low availability of MoO42− in coastal ecosystems has been documented [12]. Nevertheless, precise quantification of SO42−-Mo competition was confirmed, but not precisely indicated. The SO42− availability parameter within such a complex of interactions in Lake Kinneret might be a factor that accelerated the domination replacement of the bloom-forming Peridinium gatunenze by cyanobacteria. Evaluation of the long-term (1970–2020) Lake Kinneret data records confirm the following: Decline of nitrogen availability, slight increase of phosphorus concentrations, consequent decline of N/P mass ratio, nitrogen preferred P. gatunenze suppression, the biomass of nitrogen-fixing cyanobacteria enhancing, SO42− inputs diminishing and being accompanied by a decline of concentration and load in the lake. The Lake Kinneret ecosystem shifted from Phosphorus to Nitrogen limitation status.
The geo-chemical features of Lake Kinneret have been widely discussed [2,15], including the distinct separation between winter and summer climate conditions, the seasonal changes of the thermal structure, and the geochemical status of brackish water with a high level of salinity (including calcium), and pH and oxic epilimnion throughout full year cycle. Consequently, the availability of MnO42− was suggested [24]. Moreover, following the classification of bodies of water on the basis of SO42−/Mo ratio [31], Lake Kinneret ranked above freshwater and below seawater (Table 2). It is likely that Lake Kinneret ranked close to the lakes of Alberta [31]. The SO42−/Mo ratio in the oceanic environment is known to be very constant, while in brackish and freshwater ecosystems (such as Lake Kinneret) geochemical conditions probably initiate fluctuating ranges. These geochemicals include an alternate of wet-dry conditions as occurring in the Hula Valley peatland soil with a heavy load capacity of gypsum. Under moisture elevation resulting from changes in climatic conditions, SO42− is flushed downstream from the Hula into Lake Kinneret and controls the abundance of HFCB. That is a process impact that developed through the competitive interaction between SO42− with MoO42− resulting in inhibition of MoO42− assimilation by HFCB and the biomass reduction. The contrary was probably developed during the summer of 1994: After several years of lowering the N/P ratio [7], which stimulated HFCB enhancement of MoO42− assimilation, resulted in SO42− reduction supported HFCB growth rate. The increase of SO42− activity by its concentration elevation has been documented [31].
Documentation of the significant impact of the ratio SO42−/Mo but not each of their concentrations has also been reported [31].
The event of HFCB invasion or developed sporadic domination is a case where climate and other environmental conditions are involved. Nitrogen and phosphorus nutrient dynamics were modified: Nitrogen became insufficient and phosphorus remained sufficient (even slightly increased), and the ecosystem trophic status shifted from phosphorus to nitrogen limitation (lowering N/P mass ratio). Later on, as a result of Climate Condition Change (CCC) suppression of SO42−, inputs improved the assimilation capability of Mo by cyanophytes, and the eco-directions of the changes both improved the growth rate of HFCB.
The objective of the present study is aimed at evaluating the relevance of the information about MoO42− and SO42− impact on nitrogen fixation which were documented in Lake Kinneret and changes recorded its drainage basin.
The ecosystem structure of Lake Kinneret has undergone ecological modifications: During the 1970s–1980s, nitrogen declined and phosphorus slightly elevated. As a result of nitrogen deficiency, the dominance of the bloom-forming Peridinium spp. was replaced by harmful cyanobacteria (HFCB). Lake Kinneret shifted from phosphorus to nitrogen limitation. Moreover, since the mid 1980s, climate condition changes have become significant, and consequently the temperature has elevated while rainfall and river discharge diminished. The invasion of the N2-Fixer Cyanobacterium Aphanizomenon ovalisporum (HFCB) was attributed to the advanced simultaneous development of nitrogen deficiency and phosphorus sufficiency (decline of N/P mass ratio). Although reduction of N/P ratio supports a significant factor for HFCB enhancement, it was recently suggested to consider the MoO42− availability and its chemical relation with SO42− concentrations in the Kinneret ecosystem. Several key studies confirmed the competitiveness relation between MoO42− and SO42−.
Sulfate (SO42−) is very common in the Kinneret watershed, mostly released by dissolution of gypsum (CaSO4): CaSO4 → Ca2+ + SO42− in the peat soil in the Hula Valley. The linkage between sulfate transport into Lake Kinneret initiated the need to evaluate the potential impact of its effectivity on MoO42− uptake by HFCB. Results given in this paper confirmed a reduction of SO42− input into Lake Kinneret which followed the reduction of river discharge and dryness trend in the Hula peatland and lowered its concentration in the lake. Several studies confirmed enhancement and diminishment of MoO42− uptake by HFCB as correlated with SO42− availability. Increase of SO42− concentration might suppress MoO42− uptake and consequently slow down. Nitrogen fixation by HFCB is an ecological advantage. Reversibly, SO42− deficiency enables HFCB to maintain advantageous features of nitrogen fixation. It is suggested that these interaction complexities occurred in Lake Kinneret during the 1980s, together with nitrogen deficiency. Moreover, nitrogen deficiency, combined with the seasonal lowest availabilities of epilimnetic SO42− and its input range, are common in summer months, which was the timing of the HFCB outbreak. The lack of nitrogen damaged the Peridinium growth rate and nitrogen fixation, supplemented by the MoO42− competitor SO42− decline, enhanced HFCB. The complexity of the ecological interactions includes nitrogen, phosphorus, MoO42−, and sulfate availabilities, which encourage future management to design a wider consideration combined with previously considered nitrogen and phosphorus.

5. Future Perspectives

The tentative target suggestion is the renovation of Peridinium domination and reduction of HFCB. The concept given in this paper is aimed at the enhancement of nitrogen and SO42− input into Lake Kinneret during summer–fall season when nutrients supply by river discharges are minimal. An optional implementation is the transport of water rich with SO42− from Shamir drills into Lake Kinneret. Sulfate concentrations in Shamir drills vary between 600–650 ppm and annual discharge is about 20 mcm. Another optional suggestion is to enhance the wettability of the peat soil during summer in the Hula Valley, which requires more water supply allocation (under consideration presently).

Author Contributions

M.G. and V.L.-O. cooperatively implemented data analysis, conceptual evaluation; V.L.-O. carried out the field measurements of GWT and surface mapping of the underground water migration; M.G. directed water chemistry; presentation design, computerization, and the preparation of the original draft and final version was carried out cooperatively. All authors have read and agreed to the published version of the manuscript.

Funding

This research received no external funding.

Institutional Review Board Statement

Not applicable.

Informed Consent Statement

Not applicable as the study is not involving humans or animals.

Data Availability Statement

The data presented in this study are available on request from the corresponding author.

Acknowledgments

Sincere appreciation is given to Y. Laschinski, Kinneret Limnological Laboratory (IOLR) Lake Kinneret Database, for supporting the data of sulfate concentrations in Lake Kinneret.

Conflicts of Interest

The authors declare no conflict of interest.

Appendix A

Figure A1. Geographical maps of the Kinneret watershed (left) and the Hula Valley (right); bore-hole-GWT depth monitoring (black spots) are indicated.
Hydrobiology 01 00012 g0a1

References

  1. Hadas, O.; Pinkas, R.; Malinsky-Rushansky, N.; Nishri, A.; Kaplan, A.; Rimmer, A.; Sukenik, A. Appearance and establishment of diazotrophic cyanobacteria in Lake Kinneret, Israel. Freshw. Biol. 2012, 57, 1214–1227. [Google Scholar] [CrossRef]
  2. Zohary, T.; Sukenik, A.; Berman, T.; Nishri, A. (Eds.) Lake Kinneret-Ecology and Management; Springer: Berlin/Heidelberg, Germany, 2014; p. 683. [Google Scholar]
  3. Schindler, D.W.; Hecky, R.E.; Findlay, D.L.; Stainton, M.P.; Parker, B.R.; Peterson, M.J.; Beaty, K.L.G.; Lyng, M.; Kasian, S.E.M. Eutrophication of lakes cannot be controlled by reducing nitrogen input: Results of a 37-year whole-ecosystem experiment. Proc. Natl. Acad. Sci. USA 2008, 105, 11254–11258. [Google Scholar] [CrossRef] [PubMed] [Green Version]
  4. Schindler, D.W.; Carpenter, S.R.; Chapra, S.C.; Hecky, R.E.; Orihel, D.M. Reducing phosphorus to curb lake eutrophication is a success. Environ. Sci. Technol. 2016, 50, 8923–8929. [Google Scholar] [CrossRef] [PubMed]
  5. Rabalais, N.N. Nitrogen in aquatic ecosystems. Ambio 2002, 31, 102–112. [Google Scholar] [CrossRef]
  6. Cotner, J.B. Nitrogen is not a ‘house of cards’. Environ. Sci. Technol. 2017, 51, 3. [Google Scholar] [CrossRef] [Green Version]
  7. Gophen, M.; Smith, V.H.; Nishri, A.; Threlkeld, S.T. Nitrogen Deficiency, Phosphorus Sufficiency, and the Invasion of Lake Kinneret, Israel, by N2-Fixing Cyanobacterium Aphanizomenon ovalisporum. Aquat. Sci. 1999, 61, 293–306. [Google Scholar] [CrossRef]
  8. Smith, V.H. Low Nitrogen to Phosphorus Ratios Favor Dominance by Blue-Green Algae in Lake Phytoplankton. Science 1983, 221, 669–671. [Google Scholar] [CrossRef] [Green Version]
  9. Smith, V.H. The nitrogen and phosphorus dependence of algal biomass in lakes: An experimental and theoretical analysis. Limnol. Oceanogr. 1982, 27, 1101–1111. [Google Scholar] [CrossRef]
  10. Higgins, S.N.; Paterson, M.J.; Hecky, R.E.; Schindler, D.W.; Venkiteswaran, J.J.; Findlay, J.J. Biological nitrogen fixation prevents the response of a eutrophic lake to reduced loading of nitrogen: Evidence from a 46-year whole-lake experiment. Ecosystems 2017, 21, 1088–1100. [Google Scholar] [CrossRef]
  11. Haworth, R.W.; Cole, J.J. Molybdenum availability, nitrogen limitation, and phytoplankton growth in natural waters. Science 1985, 229, 653–655. [Google Scholar] [CrossRef]
  12. Marino, R.; Haworth, R.W. Why is Planktonic Nitrogen Fixation So Rare in Coastal Marine Ecosystems? Insight from a Cross-Systems Approach. In Aquatic Microbial Ecology and Biochemistry: A Dual Perspective; Gilbert, P., Kana, T., Eds.; Springer: Cham, Switzerland, 2016; pp. 127–139. [Google Scholar]
  13. Cole, J.J.; Lane, J.M.; Marino, R.; Haworth, R.W. Molybdenum assimilation by cyanobacteria and phytoplankton in freshwater and salt water. Limnol. Oceanogr. 1993, 38, 25–35. [Google Scholar] [CrossRef] [Green Version]
  14. LKDB 1970–2020; Annual Reports; Lake Kinneret Date Base, Kinneret Limnological Laboratory, IOLR: Haifa, Israel.
  15. Serruya, C. Lake Kinneret. In Monographgiae Biologcae; Springer: Berlin, Germany, 1978; Volume 32. [Google Scholar]
  16. Gophen, M. Ecological Research in the Lake Kinneret and Hula Valley (Israel) Ecosystems; Scientific Research Publishing, Inc.: USA, 2018; 335p, Available online: https://www.scirp.org/book/detailedinforofabook.aspx?bookid=2574 (accessed on 16 January 2022).
  17. Mazor, E. Mineral waters of the Kinneret basin and possible origin. In Lake Kinneret; Serruya, C., Ed.; Springer: Berlin, Germany, 1978; pp. 103–117. [Google Scholar]
  18. Meron, M.; Degani, G.; Lahav, U.; Dosoretz, C.; Shaviv, A. Suitability of Shamir Borehole Drillings for Agricultural Utilization. In Annual Report, Research Program No. 596-0382-08; Agriculture Ministry Foundation: Kiryat Shmone, Israel, 2010; 60p. (In Hebrew) [Google Scholar]
  19. Gophen, M.; Levanon, D. (Eds.) 1993-2006 Hula Project, Annual Reports; Jewish National Fund (Keren Kayemet LeIsrael), Migal-Scientific Research Institute, and Israeli Water Authority: Kiryat Shmone, Israel, 2006. [Google Scholar]
  20. Gonen, E. (Ed.) Hula Project Annual Report; Jewish National Fund (Keren Kayemet LeIsrael), Migal-Scientific Research Institute, and Israeli Water Authority: Kiryat Shmone, Israel, 2007; 133p. [Google Scholar]
  21. Barnea, I. (Ed.) Hula Project Annual Report; Jewish National Fund (Keren Kayemet LeIsrael) Migal-Scientific Research Institute and Israeli Water Authority: Kiryat Shmone, Israel, 2008; 159p. [Google Scholar]
  22. Barnea, I. (Ed.) 2008–2018 Hula Project Annual Report; Jewish National Fund (Keren Kayemet LeIsrael) Migal-Scientific Research Institute and Israeli Water Authority: Kiryat Shmone, Israel, 2022. [Google Scholar]
  23. Nishri, A.; Halitz, L.; Yofe, O. Metal Concentrations in Lake Knneret. In Kinneret Limnological Laboratory, IOLR-T16/20092 and Geological Survey of Israel- TR-GSI/17/2002; Interim Report; IOLR: Haifa, Israel, 2002; 9p. (In Hebrew) [Google Scholar]
  24. Manheim, F.T.; Landergren, S. Molybdenum 42. In Handbook of Geochemistry; Part 5; Springer: Berlin/Heidelberg, Germany, 1978; Volume 2. [Google Scholar]
  25. Dahl, T.W.; Anbar, D.A.; Gordon, G.; Rosing, M.T.; Frei, R.; Canfield, D. The behaviour of molybdenum and its iso-topes across the chemocline and in the sediments of sulfidic Lake Cadagno, Switzerland. Geochim. Cosmochim. Acta 2010, 74, 144–163. [Google Scholar] [CrossRef]
  26. Magyar, B.; Moorand, H.C.; Sigg, L. Vertical Distribution and Transport of Molybdenum in a Lake with Seasonally Anoxic Hypolimnion. Limnol. Oceanogr. 1993, 38, 521–531. [Google Scholar] [CrossRef]
  27. Howarth, R.W.; Marino, R.; Lane, J.; Cole, D.R. Nitrogen Fixation in Freshwater, Estuarine and Marine Ecosystems. 1. Rates and Importance. Limnol. Oceanogr. 1988, 33, 669–687. [Google Scholar] [CrossRef]
  28. Frevert, T. Heavy metals in Lake Kinneret Israel, II, Hydrogen sulfide dependent precipitation of copper cadmium lead and zinc. Arch. Fuer Hydrobiol. 1987, 109, 1–24. [Google Scholar]
  29. Frevert, T.; Sollman, C. Heavy metals in Lake Kinneret Israel, III, Lead and Copper in interstitial water and sediment dry weights. Arch. Fuer Hydrobiol. 1987, 109, 191–205. [Google Scholar]
  30. Shaked, Y.; Erel, Y.; Sukenik, A. The Biochemical cycle of Iron and Associated Elements in Lake Kinneret. Geochim. Cosmochim. Acta 2004, 68, 1439–1451. [Google Scholar] [CrossRef]
  31. Marino, R.; Howarth, R.W.; Shamess, J.; Prepas, E. Molybdenum and sulfate as controls on the abundance of nitro-gen-fixing cyanobacteria in saline lakes in Alberta. Limnol. Oceanogr. 1990, 35, 245–259. [Google Scholar] [CrossRef]
  32. Marino, R.; Howarth, R.W.; Chan, F.; Cole, J.J.; Likens, G.E. Sulfate inhibition of molybdenum-dependent nitrogen fixation by planktonic cyanobacteria under sea water conditions: A non-reversible effect. In Aquatic Biodiversity; Springer: Dordrecht, The Netherlands, 2003; pp. 277–293. [Google Scholar]
  33. Glass, J.B.; Axler, R.P.; Chandra, S.; Goldman, C.R. Molybdenum limitation of microbial nitrogen fixation in aquatic ecosystems and pure cultures. Front. Microbiol. 2012, 3, 331. [Google Scholar] [CrossRef] [Green Version]
  34. Williams, R.J.P.; da Silva, J.F. The Involvement of Molybdenum in Life. Biochem. Biophys. Res. Commun. 2002, 292, 293–299. [Google Scholar] [CrossRef]
  35. Schwarz, G.; Mendel, R.R.; Ribbe, M.W. Molybdenum cofactors, enzymes and pathways. Nature 2009, 460, 839–847. [Google Scholar] [CrossRef] [PubMed]
  36. Parnell, J.; Spinks, S.; Andrews, S.; Thayalan, W.; Bowden, S. High Molybdenum availability for evolution in a Mesoproterozoic lacustrine environment. Nat. Commun. 2015, 6, 6996. [Google Scholar] [CrossRef] [Green Version]
  37. Romero, I.C.; Klein, N.J.; Sanudo, S.A.; Capone, D.G. Potential trace metal co-limitation controls on N2 fixation and NO3 uptake in lakes with varying trophic status. Front. Microbiol. 2013, 4, 54. [Google Scholar] [CrossRef] [Green Version]
  38. Kawakubo, S.; Hashi, S.; Iwatsuki, M. Physicochemical speciation of molybdenum in rain water. Water Res. 2001, 35, 2489–2495. [Google Scholar] [CrossRef]
  39. Goldman, C.R. Molybdenum as a Factor Limiting Primary Productivity in Castle Lake, California. Science 1960, 132, 1016–1017. [Google Scholar] [CrossRef] [PubMed]
  40. Kroneck, P.M.H.; Abt, D.J. Molybdenum in Nitrate Reductase and Nitrate Oxidoreductase. In Metal Ions in Biological Systems; Sigel, H., Sigel, A.R., Eds.; Marcell Dekker, Inc.: New York, NY, USA, 2002; pp. 369–403. [Google Scholar]
Figure 1. Temporal distribution of SO42− concentrations (ppm) in Lake Kinneret: Linear regression (95% CI) between annual concentrations of SO42− and years (2003–2020).
Hydrobiology 01 00012 g001
Figure 2. Temporal distribution of SO42− concentrations (ppm; mM) in Lake Kinneret: Linear regression (95% CI) between annual concentrations of SO42− and years (1970–2010).
Hydrobiology 01 00012 g002
Figure 3. Temporal fluctuations of SO42− concentrations (ppm; mM) in in Lake Kinneret during 1970–2020: Annual averages are plotted vs. years as LOWESS Smoother (0.8 bandwidth).
Hydrobiology 01 00012 g003
Figure 4. Grand total average of monthly mean concentrations of SO42− (ppm; mM) of all sampling stations within the Hula Project zone in the Hula Valley during 1994–2010.
Hydrobiology 01 00012 g004
Figure 5. River Jordan (Huri Station) annual discharge (mcm/year) during 1970–2010.
Hydrobiology 01 00012 g005
Figure 6. Trend of changes (LOWEESS Smoother 0.8 bandwidth) of annual SO42− input into Lake Kinneret (metric ton × 10/year) during 1970–2004.
Hydrobiology 01 00012 g006
Figure 7. LOWESS Smoother (bandwidth 0.8) plot of monthly inputs of SO42− (metric ton × 10/month) through River Jordan discharge into Lake Kinneret during 1970–2004 in relation to the discharge capacities.
Hydrobiology 01 00012 g007
Figure 8. Linear regression (95% CI) plot of monthly inputs of SO42− (metric ton × 10/month) through River Jordan discharge into Lake Kinneret during 1970–2004 in relation to the discharge capacities.
Hydrobiology 01 00012 g008
Figure 9. Annual mean of monthly winter months (1–5) discharges (mcm/m) of the River Jordan during 1970–2004, LOWESS Smoother (0.8) plot.
Hydrobiology 01 00012 g009
Figure 10. Annual mean of monthly summer–fall (6–12) discharges (mcm/month) of the River Jordan during 1970–2004 LOWESS Smoother (0.8) plot.
Hydrobiology 01 00012 g010
Figure 11. Annual mean of monthly winter months (1–5) SO42− input (metric ton/month) through the River Jordan flow during 1970–2004, LOWESS Smoother (0.8) plot.
Hydrobiology 01 00012 g011
Figure 12. Linear regression (CI 95%) plot of monthly SO42− input (ton/month) into Lake Kinneret through the River Jordan discharge during 1970–2004.
Hydrobiology 01 00012 g012
Figure 13. Linear regression (CI 95%) plot between annual (1970–2004) means of monthly values of SO42− input (ton/month) into Lake Kinneret during summer–fall (months 6–12).
Hydrobiology 01 00012 g013
Figure 14. LOWESS (0.8) Smoother plot of annual (1970–2004) means of monthly values of SO42− input (ton/month) into Lake Kinneret during summer–fall (months (6–12).
Hydrobiology 01 00012 g014
Table 1. Lake Agmon outlet: mass balance of annual SO42− (metric tons/year) dynamics (2008–2018) [19,20,21,22].
SourceSO4 (ton/year)
InputReconstructed Jordan40
Input“Canal Z”1564
InputHula East105
Total Input 1709
OutputAgmon Outlet1302
OutputIrrigation135
Total Output 1437
Table 2. Periodical (1969–1978, 1985–1995) averages of mass (ppm, ppb) and molar (mM, µM) concentrations of Mo and SO42— and molar ratio in between.
1969–19781985–1995
SO42− (ppm)
Mo (ppb)
56
0.5–1.5
46
0.5–1.5
SO42− (mM)
Mo (µM)
0.583
0.00521–0.0156
0.479
0.00521–0.0156
SO42− (mM)/Mo (µm) ratio1.11–0.37 × 1050.91–0.31 × 10⁵
Marino and Haworth [31]; Howarth et al. [27] reported 2.6 × 10⁵ for Sea Water, and 0.22 × 10⁵ for Freshwater.
Table 3. Water covered area (ha) of peat soil in relation to discrete depths of Ground Water Table (GWT) in October during 2013–2021; annual rainfall data are given (mm/year).
GWT (m)201320142015201620172018201920202021
0.5000000030
1268136349121
1.5393266528507495494461319154
21303159615558261488111814091098979
2.5682450321639369660526919765
32777536355991361481
3.57120615110635
4460803003
4.5040000000
5010000000
Total241824182417241724182419241824182418
Rain671352607467477474848798535
Table 4. Volume of dry and wet layers (total 120.9 × 10⁶ m3) in October during 2013–2021, and percentage of wet layer from the total.
YearDry Layer
(106 m3)
Wet Layer
(106 m3) (%)
201350.270.7 (58.5)
201470.550.4 (41.7)
201547.373.6 (60.9)
201667.353.6 (44.3)
201772.648.3 (40.0)
201870.950.0 (41.4)
201948.772.2 (59.7)
202051.969.0 (57.1)
202156.864.1 (53.0)
Publisher’s Note: MDPI stays neutral with regard to jurisdictional claims in published maps and institutional affiliations.