Complex Network Analysis for Characterizing River Networks: A Case Study of Leyte Island, Philippines



Abstract
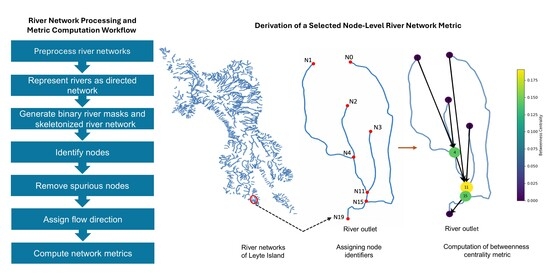
1. Introduction
2. Methodology
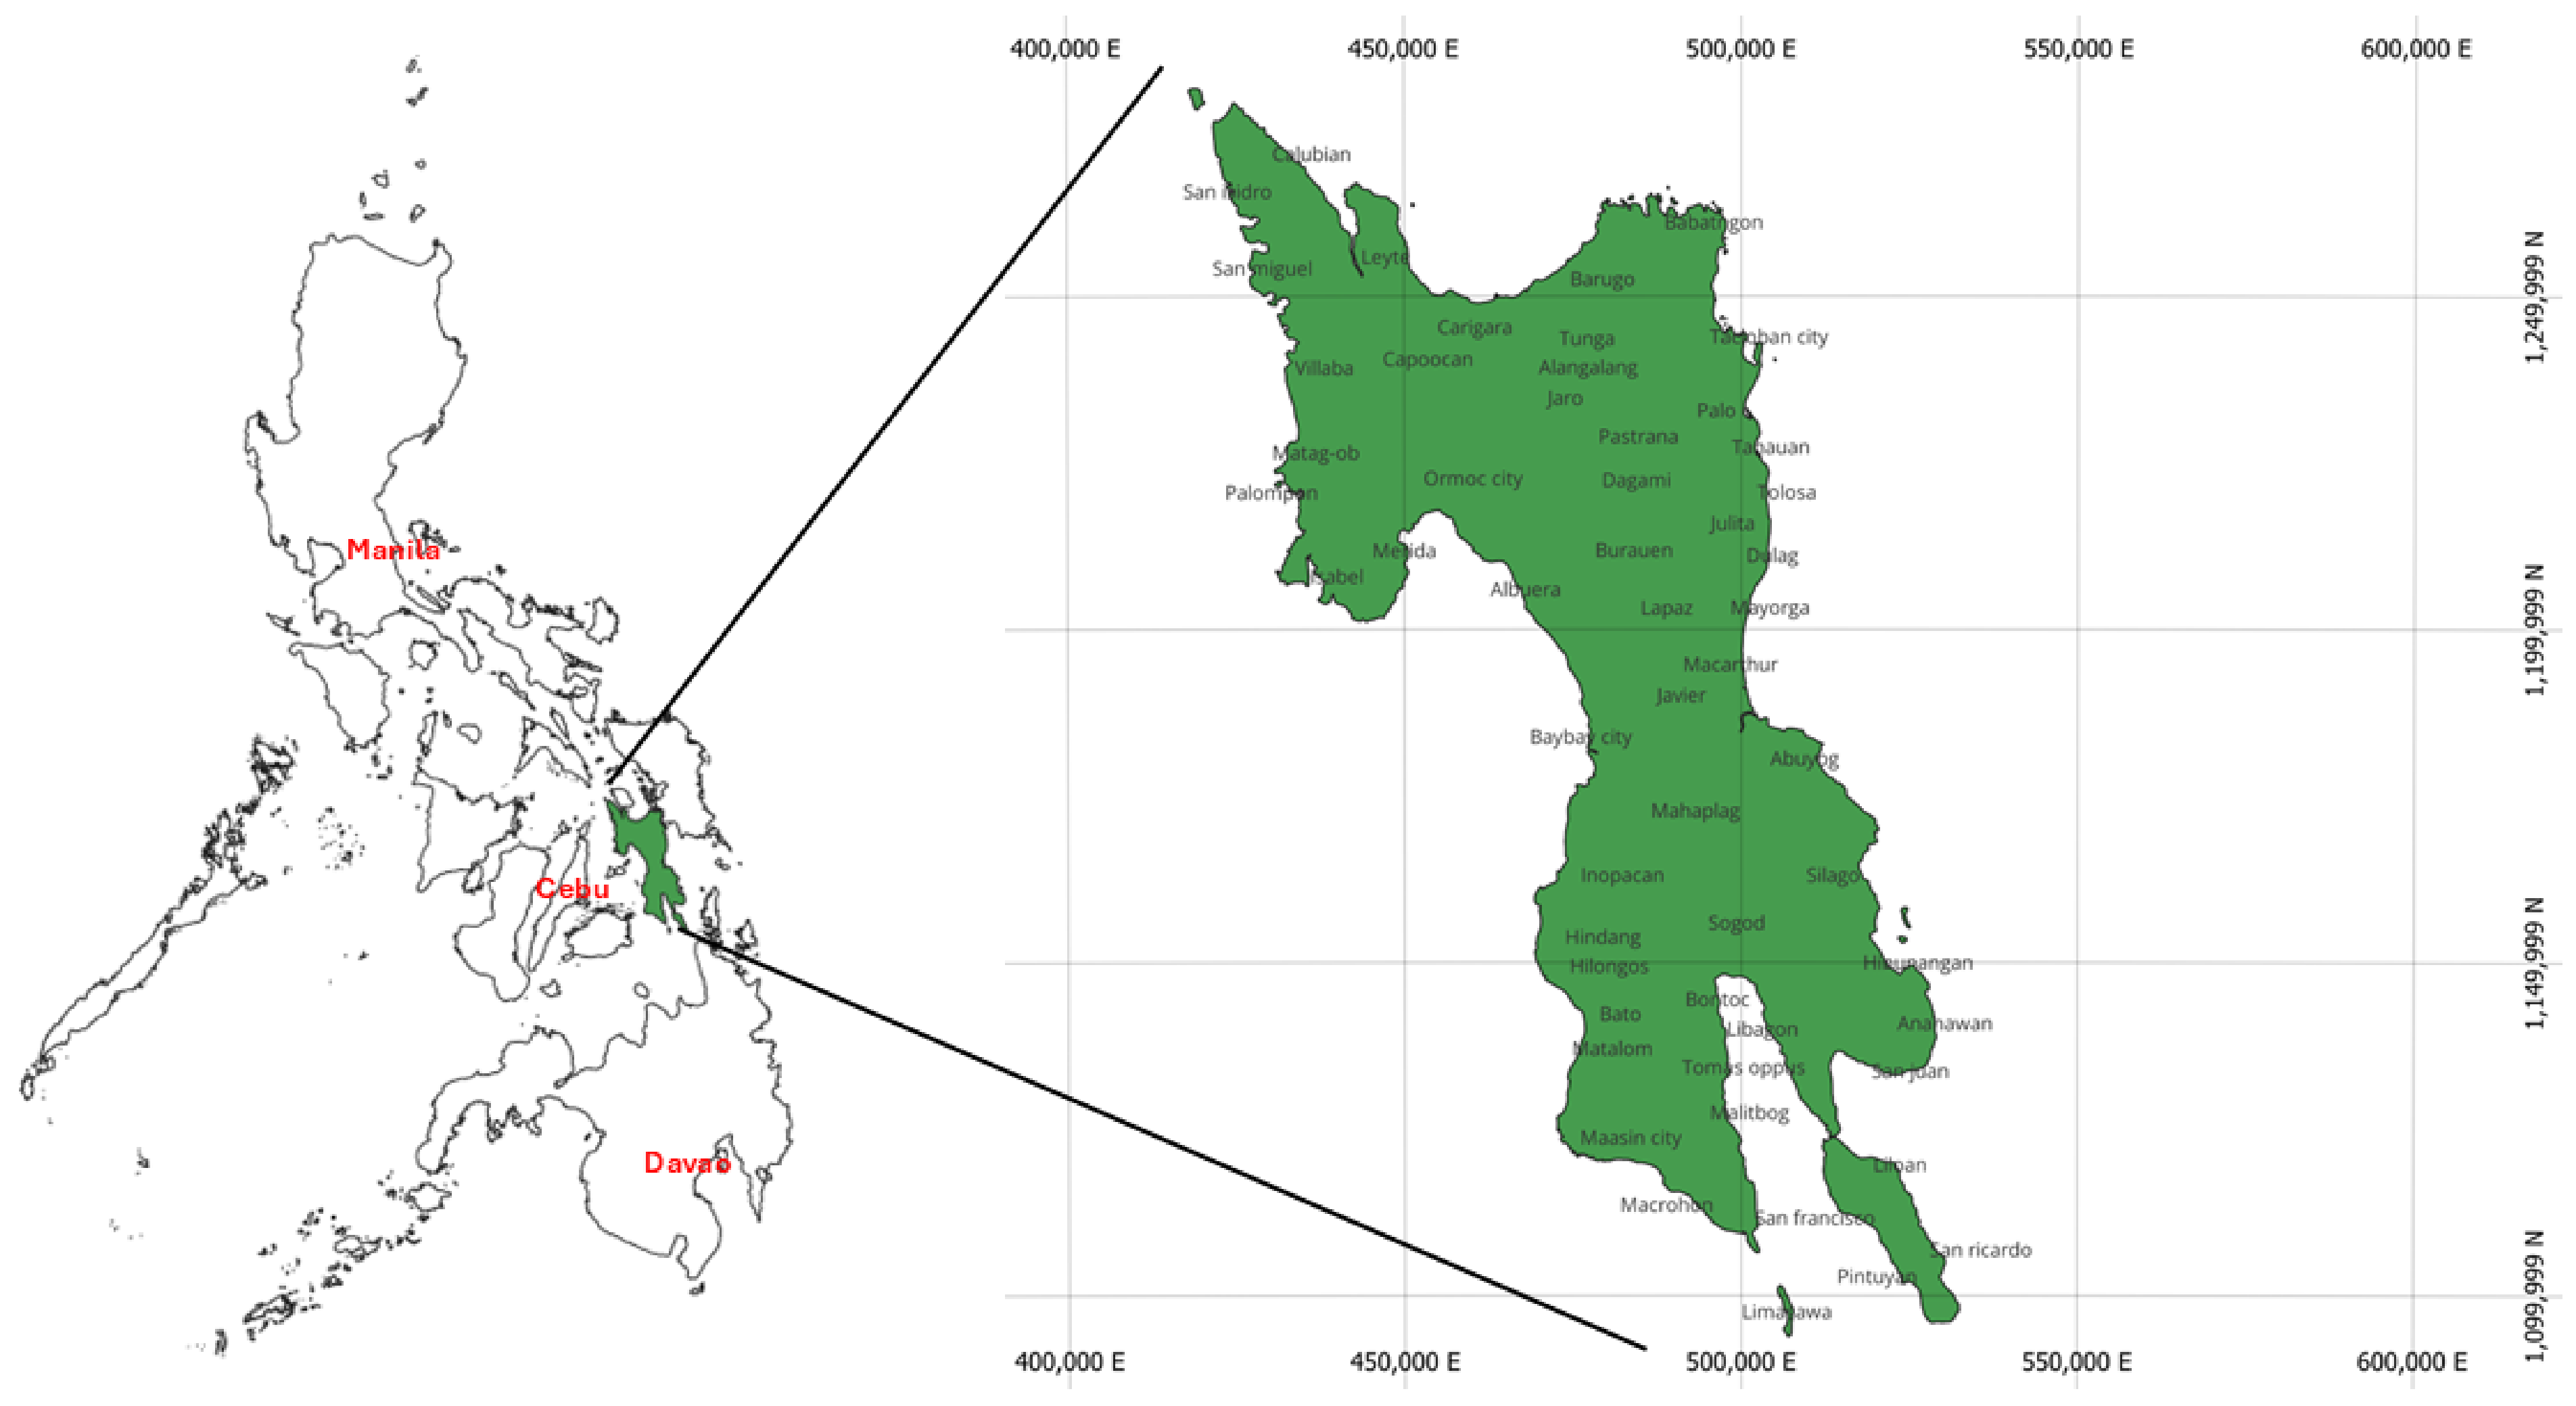
2.1. Study Area
2.2. Open Street Map and DEM-Derived River Networks Comparison
2.2.1. River Network Derived from Open Street Map
2.2.2. DEM-Derived River Network
2.2.3. Comparison Methodology
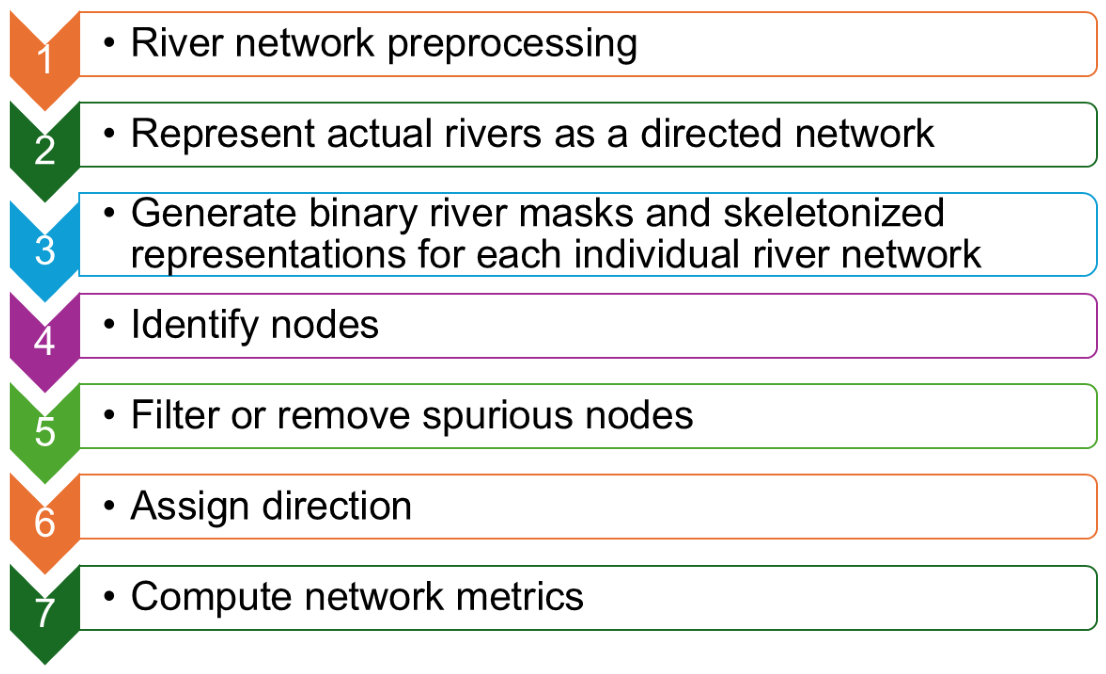
2.3. River Network Processing
2.3.1. River Network Preprocessing
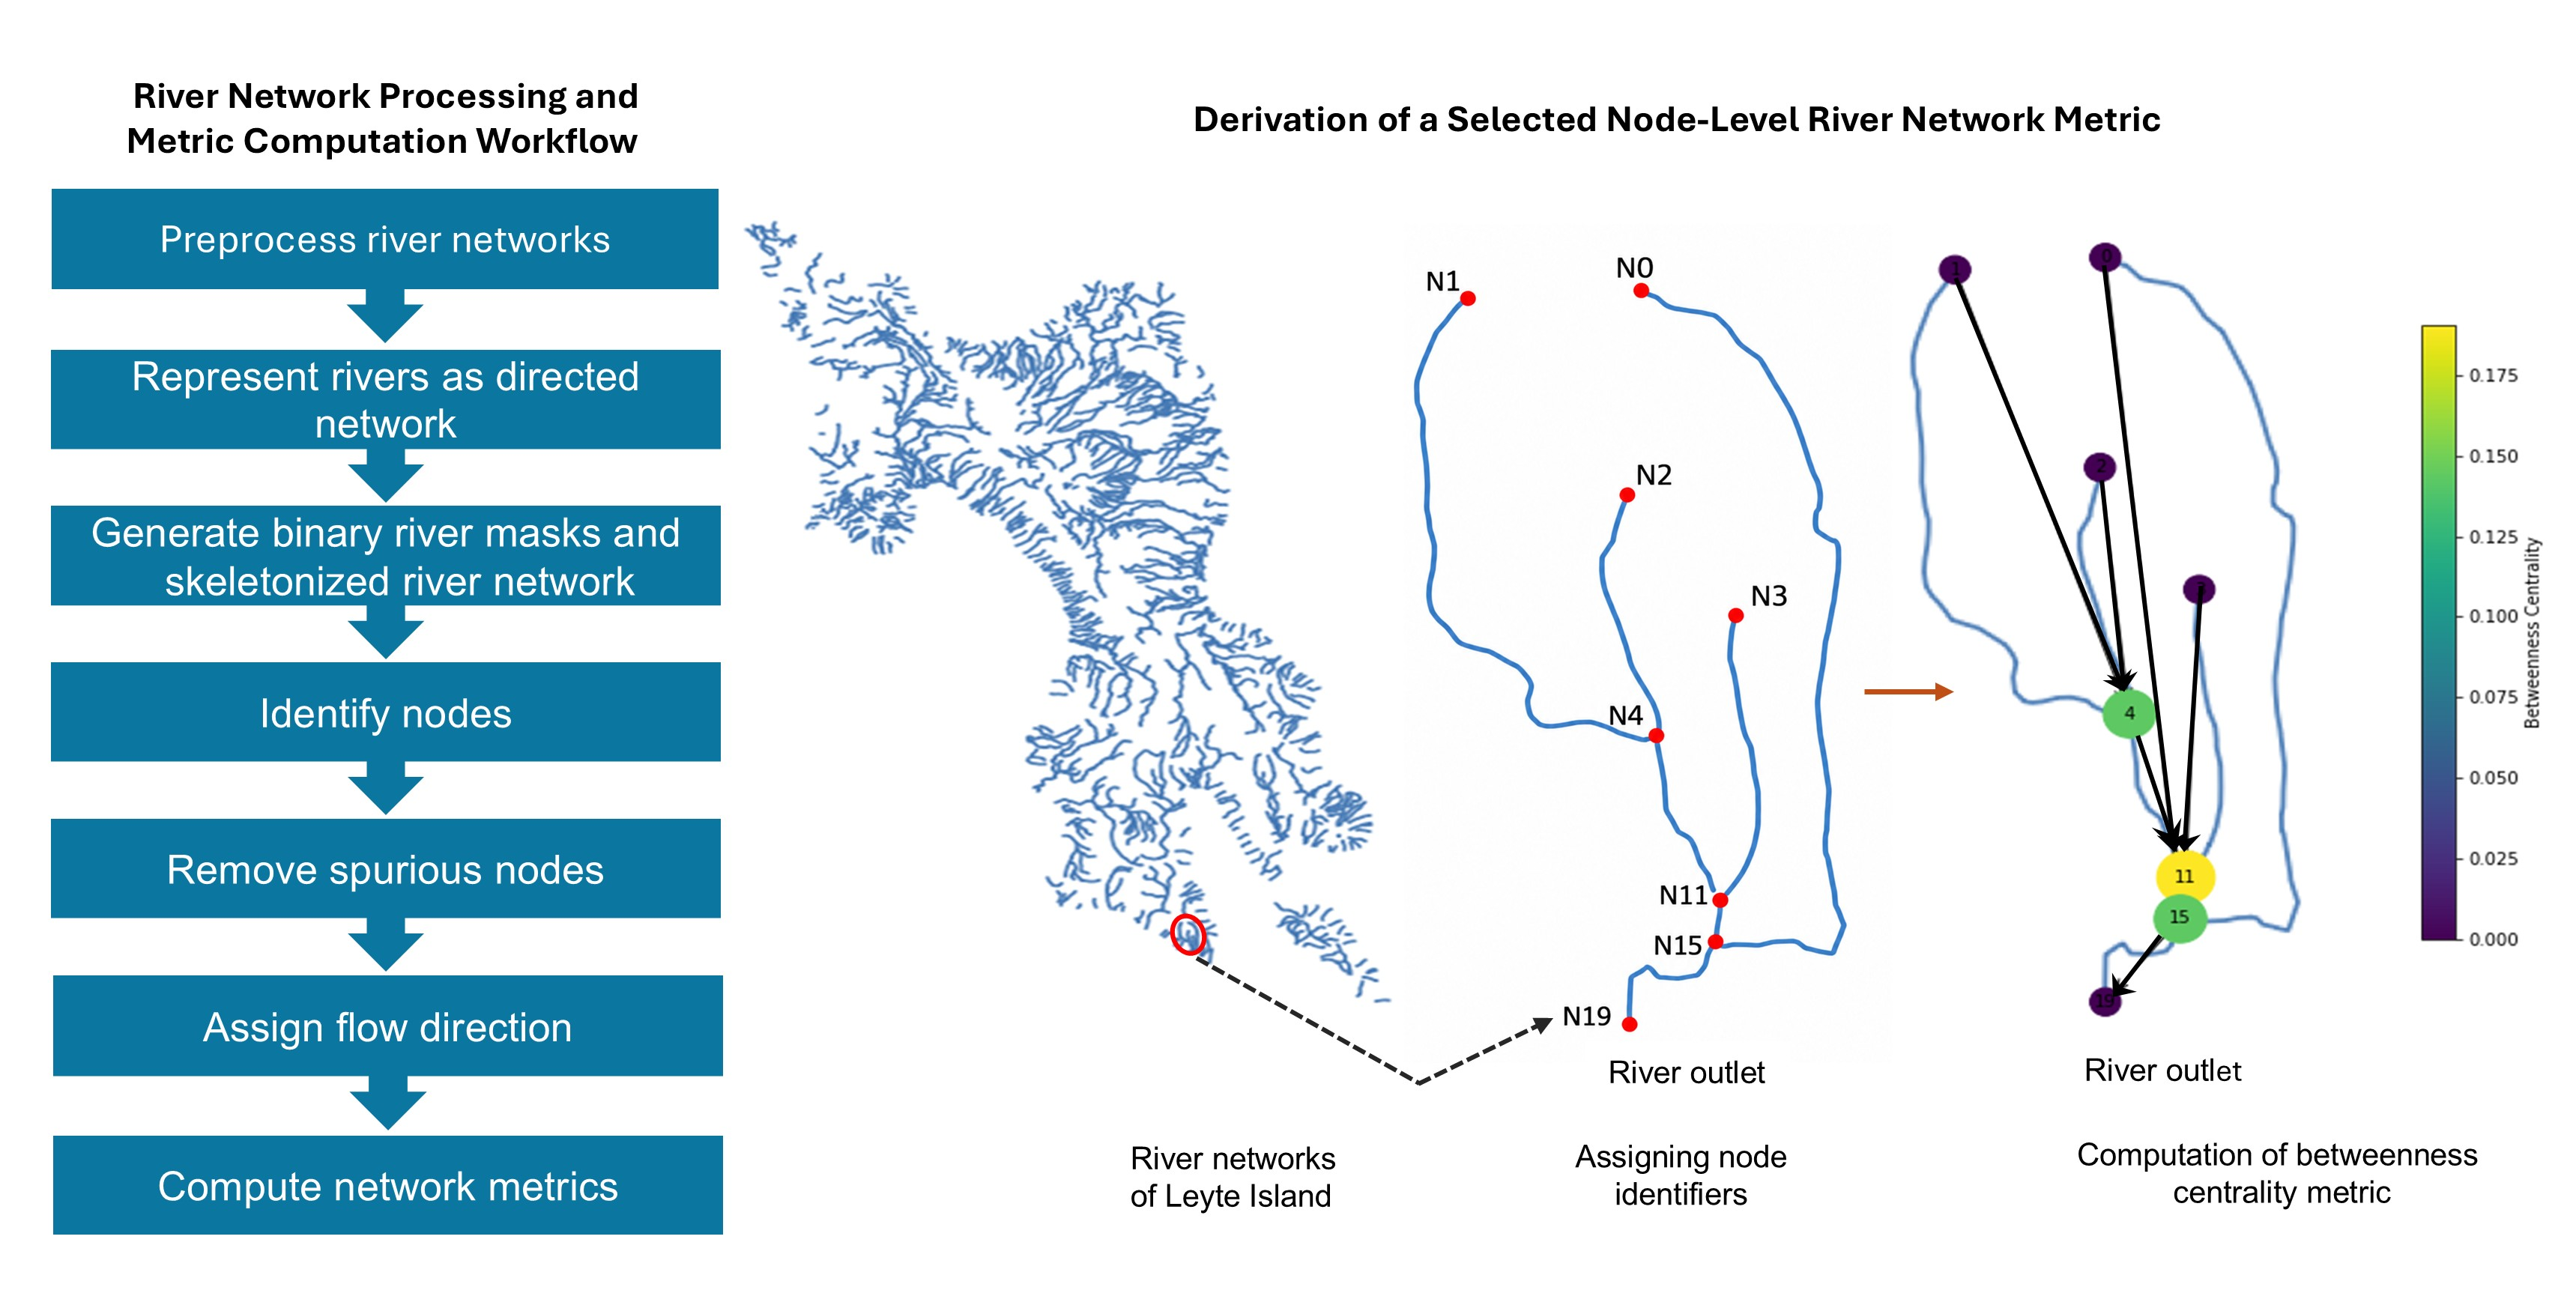
2.3.2. River Network Data Processing
2.4. River Network Metrics
Python NetworkX Implementation
2.5. River Network Slope Analysis
3. Results
3.1. Comparison of DEM-Derived and OSM-Derived River Networks
3.1.1. Total Length Ratio
3.1.2. Assessment of River Channel Positional Agreement, Omission, and Addition
3.2. River Network Preprocessing Results
3.3. Network Metric Results for the Analyzed River Network
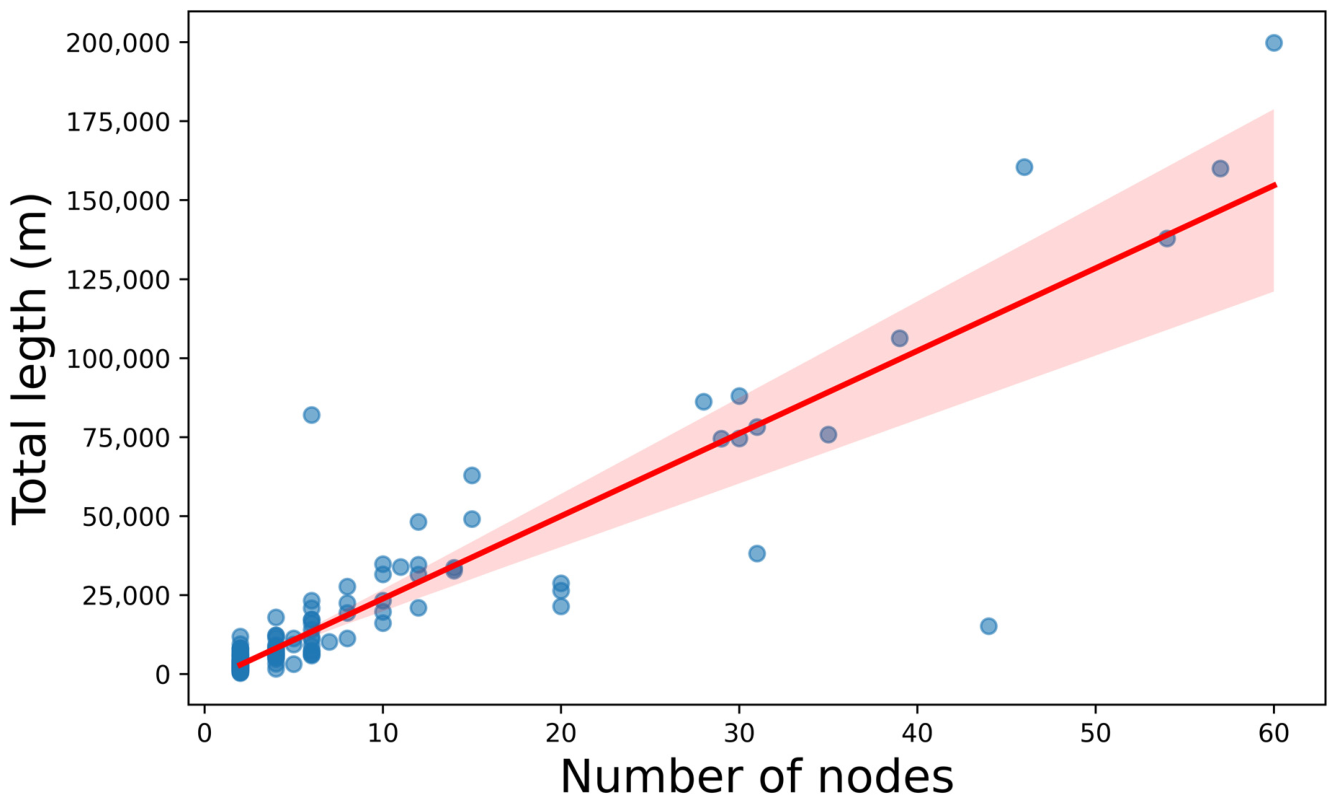
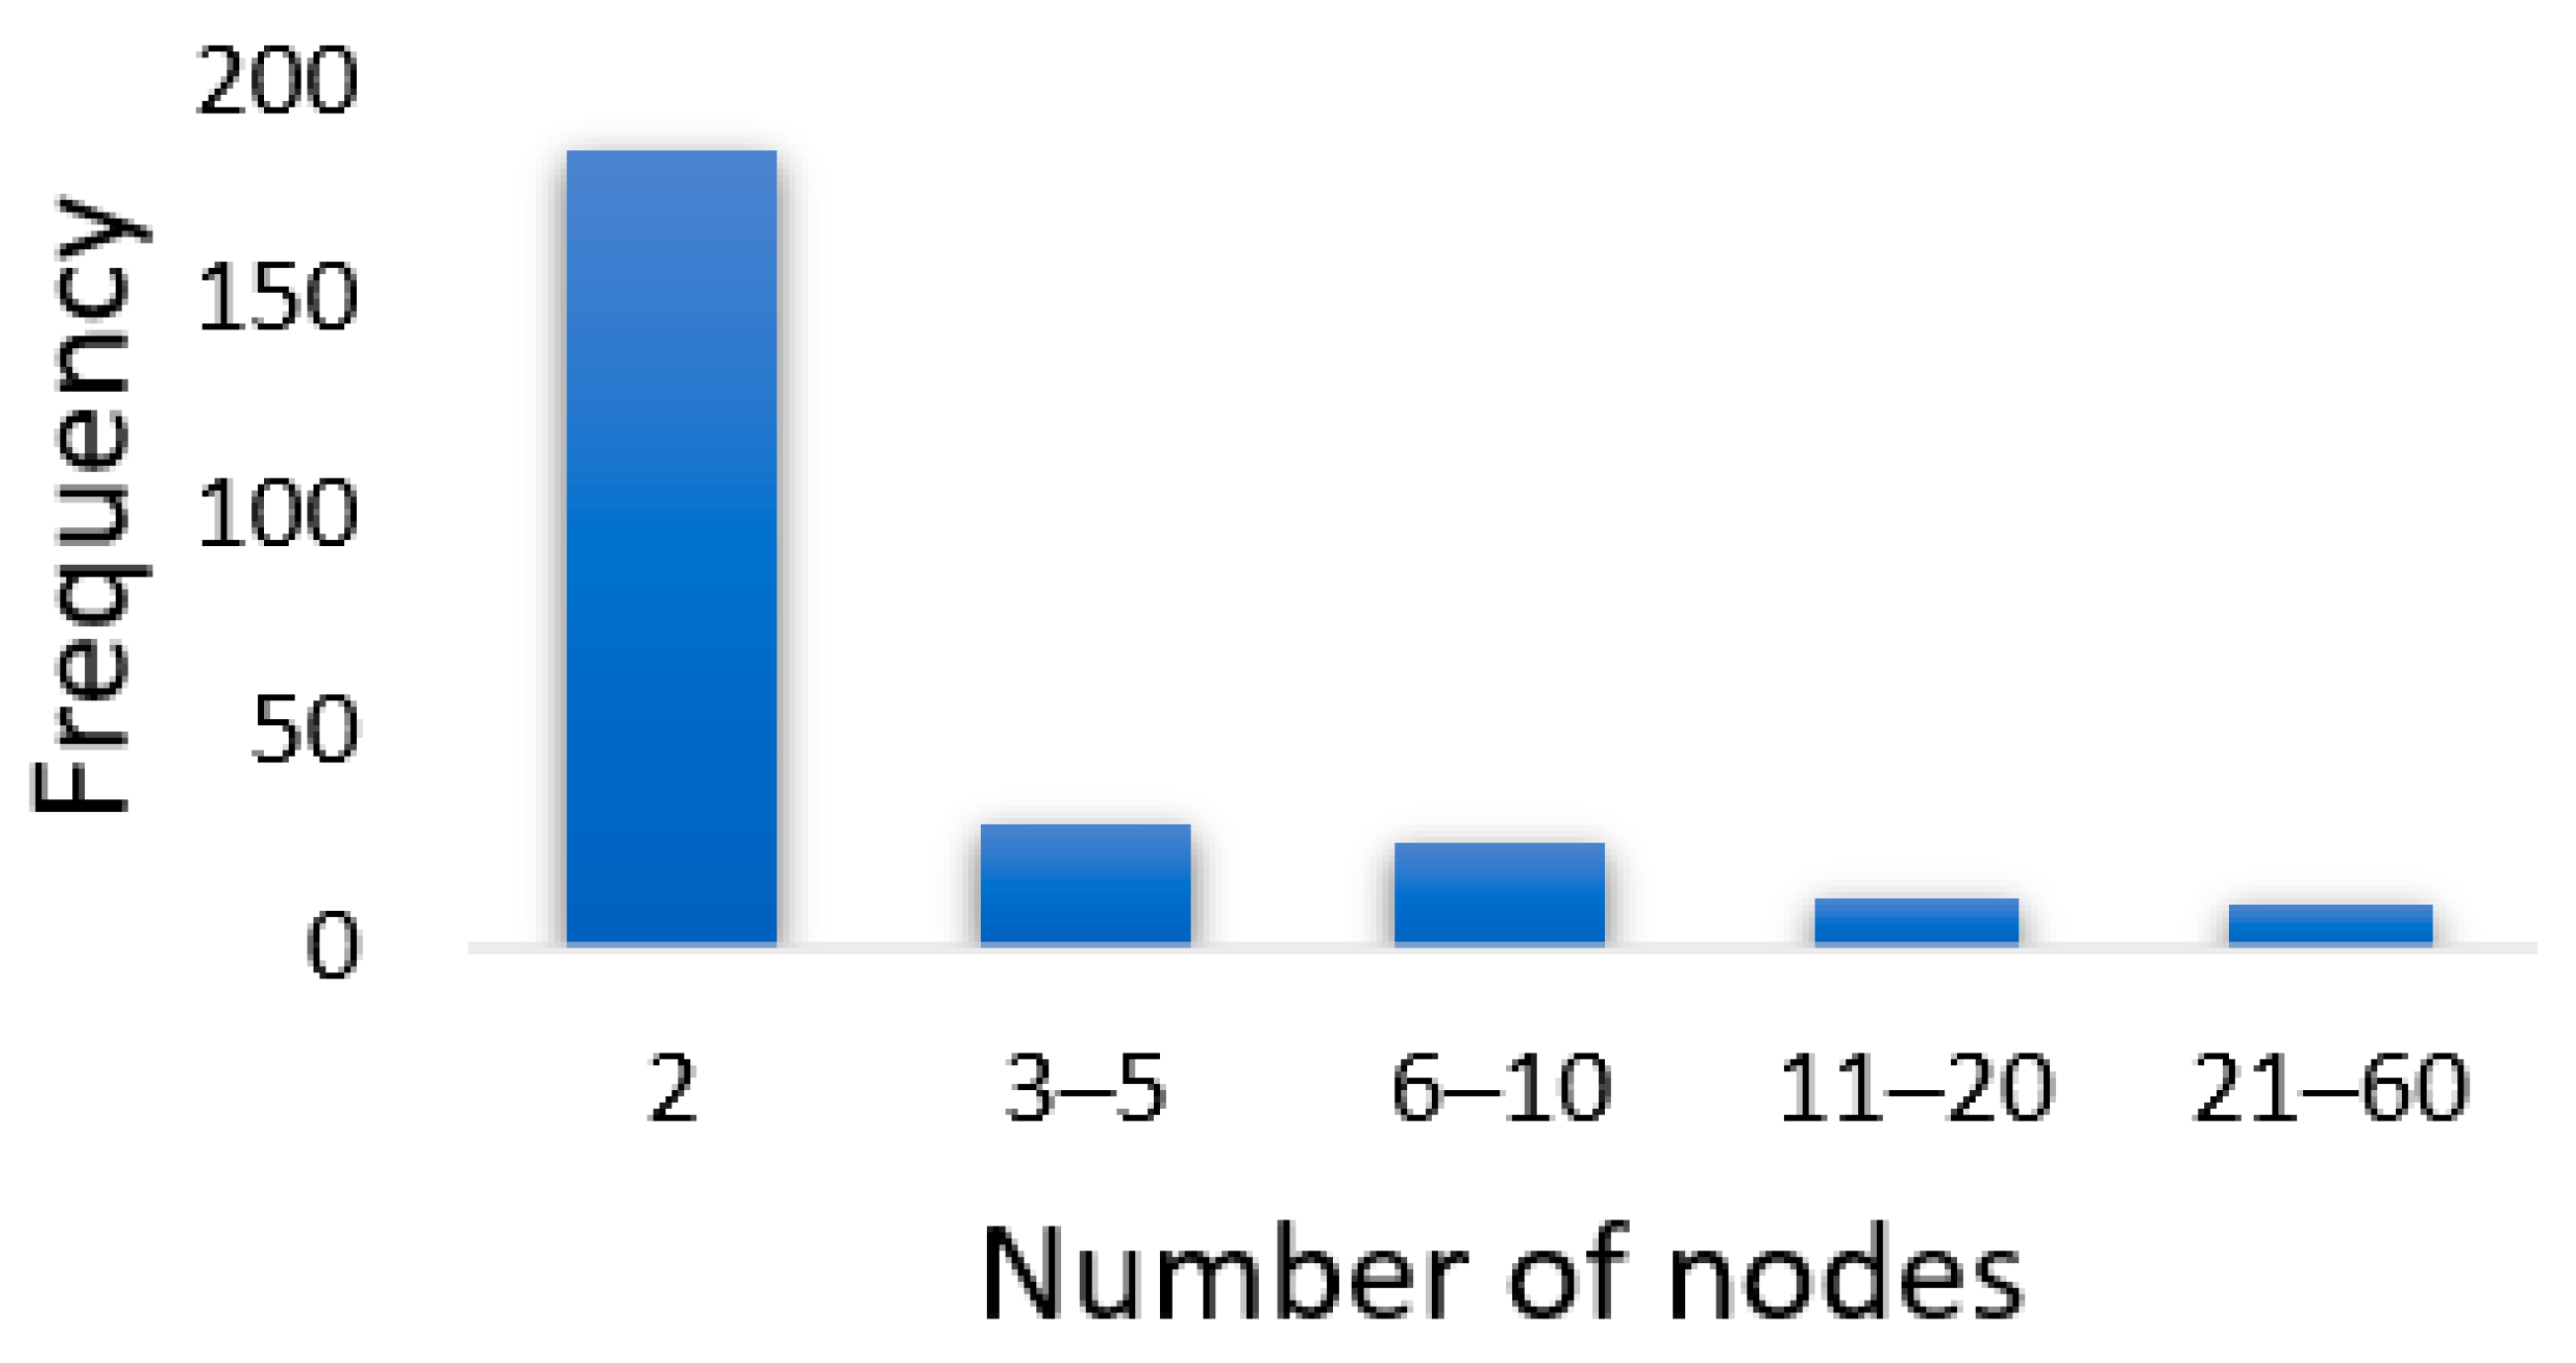
3.3.1. Number of Nodes, Average in and out Degree
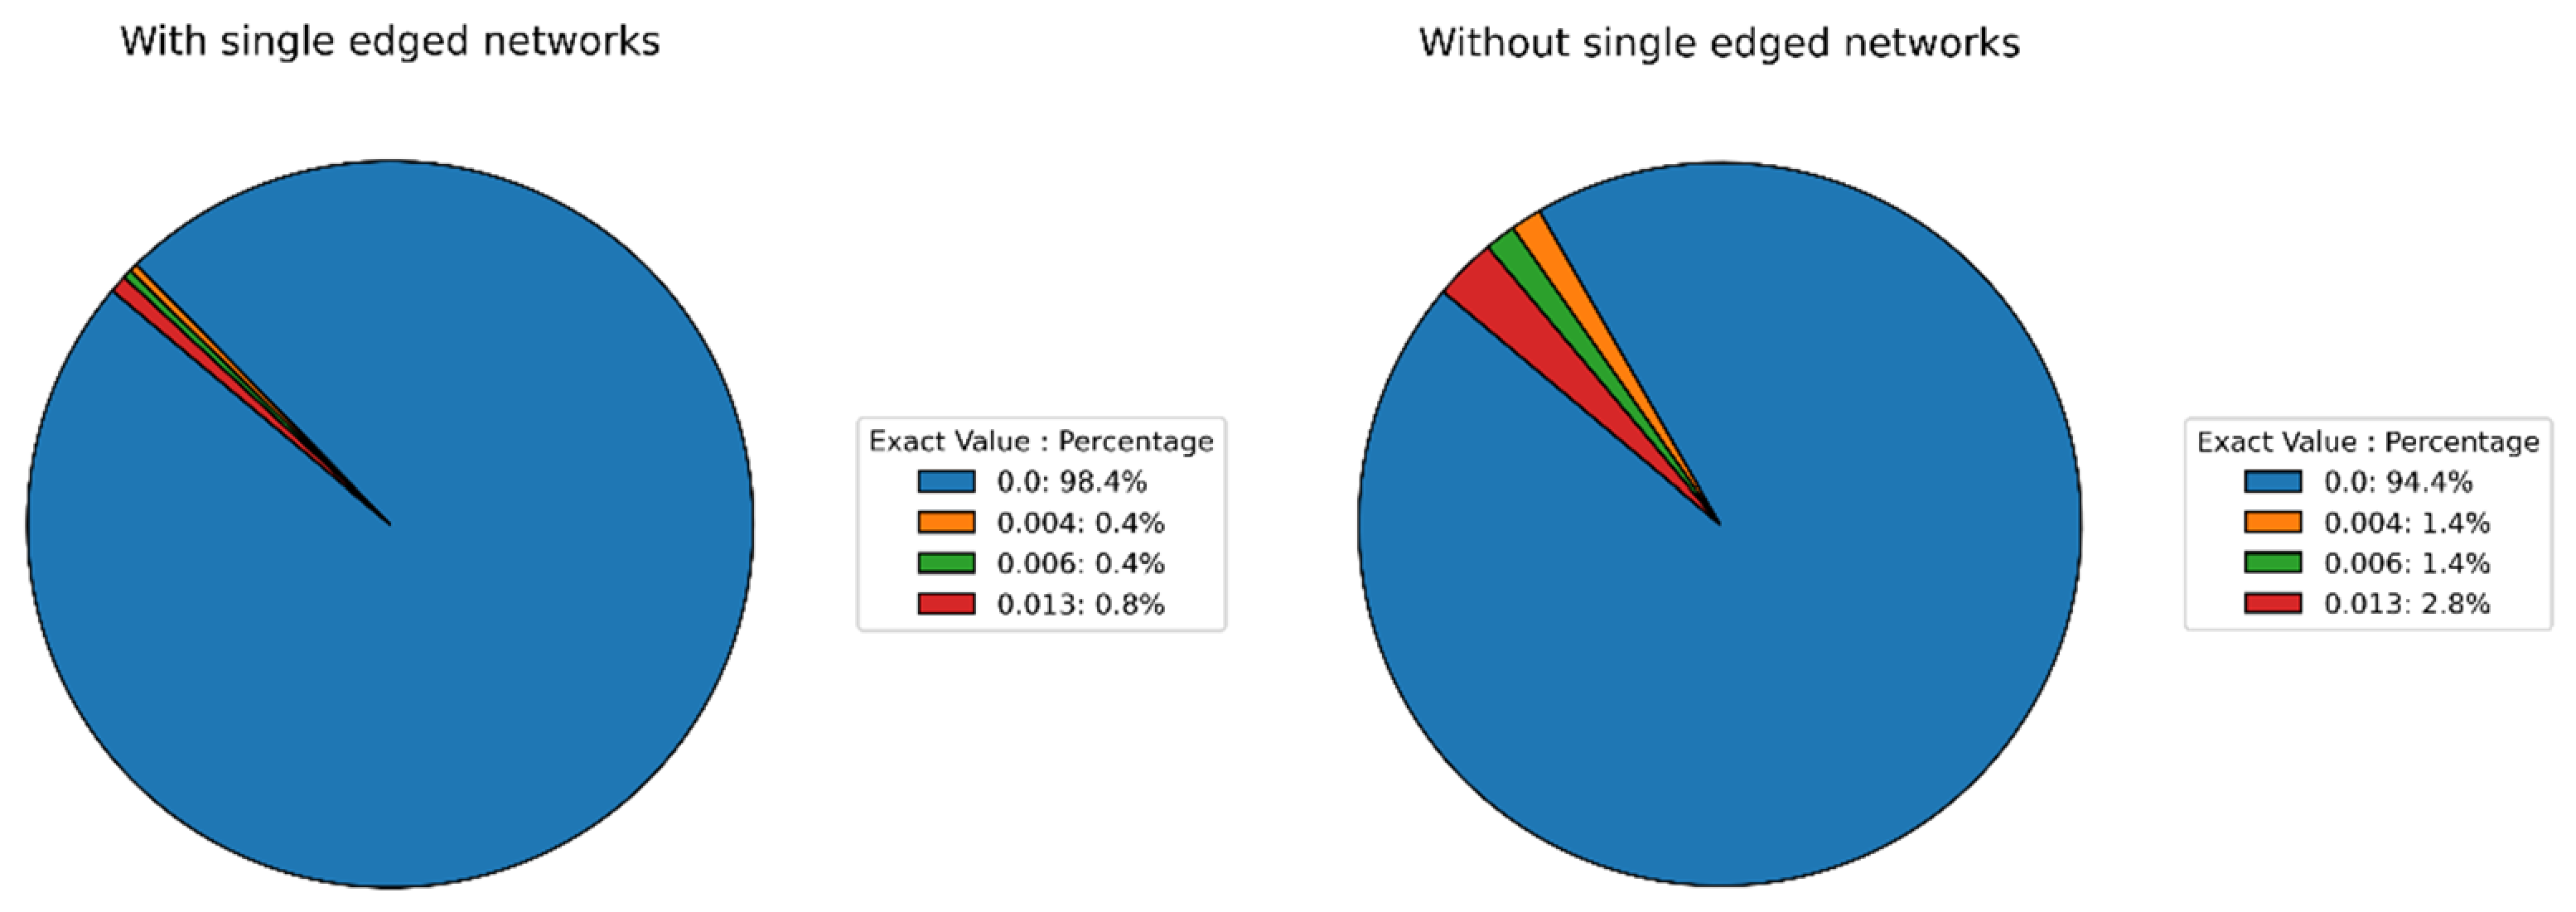
3.3.2. Average Clustering Coefficient
3.3.3. Average Closeness Centrality
3.3.4. Average Betweenness Centrality
3.3.5. Comparison of River Network Metrics with Random Tree Networks
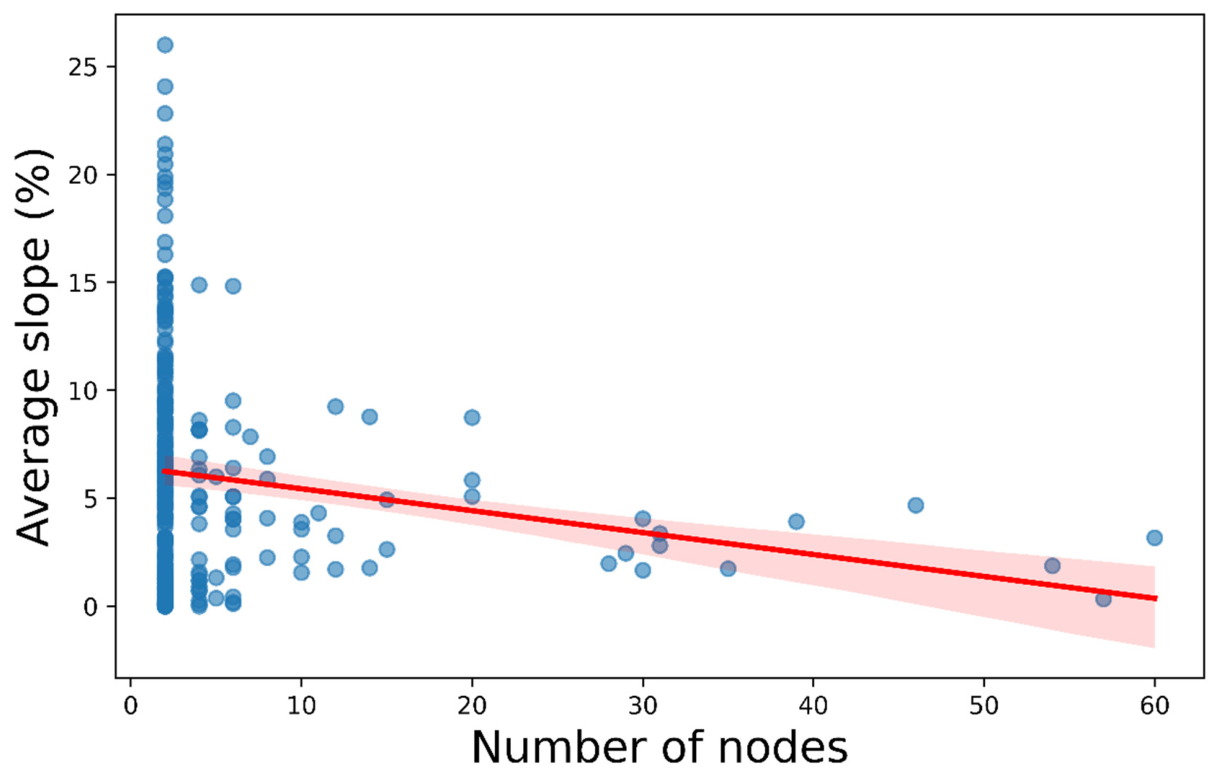
3.4. Relationship Between River Slope and Network Structure
4. Discussion
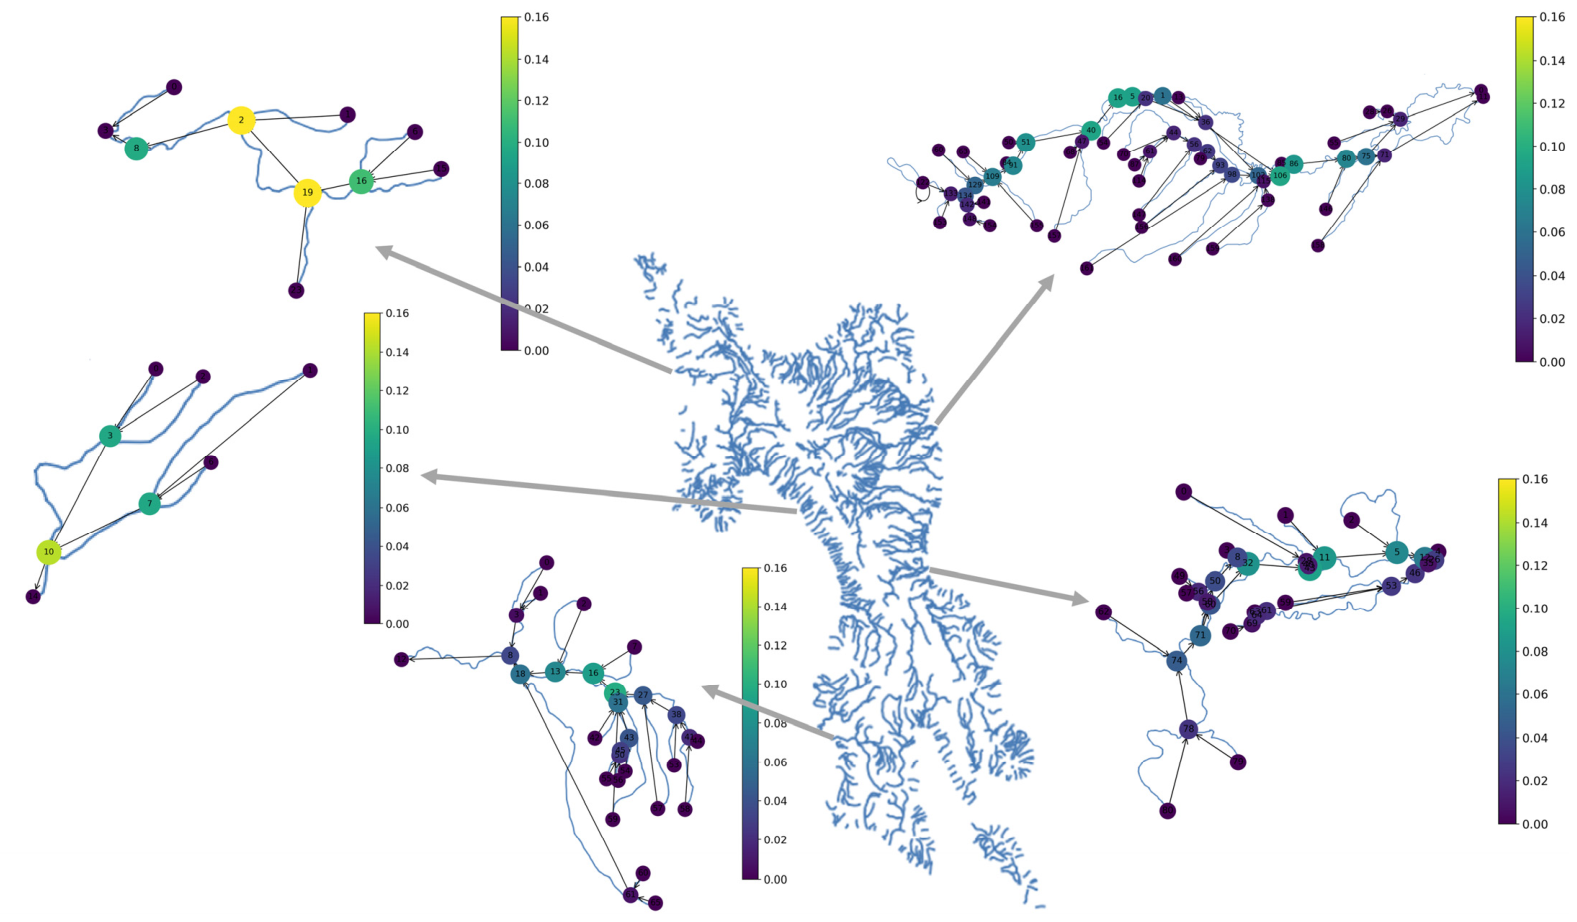
4.1. Main Topological Characteristics of Leyte River Networks
4.2. Comparison of CNA with Other River Network Analysis Approaches
4.3. Limitations, Uncertainty, and Practical Implications
4.4. Potential Applications and Future Directions
5. Conclusions
Supplementary Materials
Author Contributions
Funding
Data Availability Statement
Acknowledgments
Conflicts of Interest
References
- Décamps, H. River networks as biodiversity hotlines. C. R. Biol. 2011, 334, 420–434. [Google Scholar] [CrossRef] [Scilit] [PubMed]
- Dong, Y.; Wang, P.; Hua, Z.; Liu, X. River networks evolution under multiple stresses: A geometric and structural fractal perspective. J. Clean. Prod. 2024, 448, 141411. [Google Scholar] [CrossRef] [Scilit]
- Dwivedi, D.; Poeppl, R.E.; Wohl, E. Hydrological connectivity: A review and emerging strategies for integrating measurement, modeling, and management. Front. Water 2025, 7, 1496199. [Google Scholar] [CrossRef] [Scilit]
- Rodríguez-Alarcón, R.; Lozano, S. Complex network modeling of a river basin: An application to the Guadalquivir River in Southern Spain. J. Hydroinform. 2022, 24, 559–573. [Google Scholar] [CrossRef] [Scilit]
- Fawen, L.; Qingyang, L.; Yong, Z. Characterization and Classification of River Network Types. Water Resour. Manag. 2023, 37, 6219–6236. [Google Scholar] [CrossRef] [Scilit]
- Jung, K.; Lee, M.; An, H.; Um, M.-J.; Park, D. Characterization and classification of river networks in South Korea. Environ. Model. Softw. 2022, 156, 105495. [Google Scholar] [CrossRef] [Scilit]
- Yu, Z.; Wang, Q.; Xu, Y.; Lu, M.; Lin, Z.; Gao, B. Dynamic impacts of changes in river structure and connectivity on water quality under urbanization in the Yangtze River Delta plain. Ecol. Indic. 2022, 135, 108582. [Google Scholar] [CrossRef] [Scilit]
- Li, X.; Mo, X.; Zhang, C.; Wang, Q.; Xu, L.; Ren, Z.; McCarty, G.W.; Cui, B. Unraveling the Impacts of River Network Connectivity on Ecological Quality Dynamics at a Basin Scale. Remote Sens. 2024, 16, 2370. [Google Scholar] [CrossRef] [Scilit]
- Shao, X.; Fang, Y.; Jawitz, J.W.; Yan, J.; Cui, B. River network connectivity and fish diversity. Sci. Total Environ. 2019, 689, 21–30. [Google Scholar] [CrossRef] [Scilit] [PubMed]
- Tonkin, J.D.; Heino, J.; Altermatt, F. Metacommunities in river networks: The importance of network structure and connectivity on patterns and processes. Freshw. Biol. 2018, 63, 1–5. [Google Scholar] [CrossRef] [Scilit]
- Carrara, F.; Altermatt, F.; Rodriguez-Iturbe, I.; Rinaldo, A. Dendritic connectivity controls biodiversity patterns in experimental metacommunities. Proc. Natl. Acad. Sci. USA 2012, 109, 5761–5766. [Google Scholar] [CrossRef] [Scilit] [PubMed]
- Terui, A.; Ishiyama, N.; Urabe, H.; Ono, S.; Finlay, J.C.; Nakamura, F. Metapopulation stability in branching river networks. Proc. Natl. Acad. Sci. USA 2018, 115, E5963–E5969. [Google Scholar] [CrossRef] [Scilit] [PubMed]
- Sanchirico, A.; Fiorentino, M. River networks in the framework of complex network theory. Phys. Rev. E 2025, 112, 014307. [Google Scholar] [CrossRef] [Scilit] [PubMed]
- Rodriguez-Iturbe, I.; Muneepeerakul, R.; Bertuzzo, E.; Levin, S.A.; Rinaldo, A. River networks as ecological corridors: A complex systems perspective for integrating hydrologic, geomorphologic, and ecologic dynamics. Water Resour. Res. 2009, 45, 2008WR007124. [Google Scholar] [CrossRef] [Scilit]
- Wu, X.; Li, L.; Qu, Y. Modelling and analysis of river networks based on complex networks theory. In Proceedings of the 2012 2nd International Conference on Computer and Information Applications (ICCIA 2012); Atlantis Press: Beijing, China, 2014. [Google Scholar] [CrossRef] [Scilit]
- Tejedor, A.; Longjas, A.; Zaliapin, I.; Foufoula-Georgiou, E. Delta channel networks: 1. A graph-theoretic approach for studying connectivity and steady state transport on deltaic surfaces. Water Resour. Res. 2015, 51, 3998–4018. [Google Scholar] [CrossRef] [Scilit]
- Lee, F.; Simon, K.S.; Perry, G.L.W. River networks: An analysis of simulating algorithms and graph metrics used to quantify topology. Methods Ecol. Evol. 2022, 13, 1374–1387. [Google Scholar] [CrossRef] [Scilit]
- Xingyuan, Z.; Fawen, L.; Shuhui, S. Study on the consistency of evaluation methods for river network connectivity in data-scarce watersheds. J. Hydrol. 2024, 645, 132267. [Google Scholar] [CrossRef] [Scilit]
- Thoms, M.; Scown, M.; Flotemersch, J. Characterization of River Networks: A GIS Approach and Its Applications. JAWRA J. Am. Water Resour. Assoc. 2018, 54, 899–913. [Google Scholar] [CrossRef] [Scilit] [PubMed]
- Allen, G.H.; Pavelsky, T.M. Global extent of rivers and streams. Science 2018, 361, 585–588. [Google Scholar] [CrossRef] [Scilit] [PubMed]
- Allen, G.H.; Pavelsky, T.M. Patterns of river width and surface area revealed by the satellite-derived North American River Width data set. Geophys. Res. Lett. 2015, 42, 395–402. [Google Scholar] [CrossRef] [Scilit]
- Scherelis, V.; Doering, M.; Laube, P. HydroWidth: A small-scale approach to calculate river width and its variability. Trans. GIS 2023, 27, 1503–1525. [Google Scholar] [CrossRef] [Scilit]
- Forio, M.A.E.; Lock, K.; Radam, E.D.; Bande, M.; Asio, V.; Goethals, P.L.M. Assessment and analysis of ecological quality, macroinvertebrate communities and diversity in rivers of a multifunctional tropical island. Ecol. Indic. 2017, 77, 228–238. [Google Scholar] [CrossRef] [Scilit]
- Philippine Statistics Authority. PSGC Classification: Province of Leyte. Available online: https://psa.gov.ph/classification/psgc/citimuni/0803700000 (accessed on 12 May 2026).
- Philippine Statistics Authority. Table A—Population and PGR by Region and Provinces/HUC. 2024 Census of Population (POPCEN) Population Counts Declared Official by the President. Available online: https://psa.gov.ph/content/2024-census-population-popcen-population-counts-declared-official-president (accessed on 10 April 2026).
- Philippine Statistics Authority. PSGC Classification: Province of Southern Leyte. Available online: https://psa.gov.ph/classification/psgc/citimuni/0806400000 (accessed on 12 May 2026).
- Department of Environment and Natural Resources, Environmental Management Bureau Region 8, “Region 8, List of Water Bodies.”. Available online: https://water.emb.gov.ph (accessed on 17 March 2026).
- OpenStreetMap Contributors, “Planet Dump.” OpenStreetMap Foundation. 2026. Available online: https://www.openstreetmap.org (accessed on 3 August 2026).
- QGIS Development Team. QGIS Geographic Information System QGIS Association; QGIS Association: Zurich, Switzerland, 2026; Available online: https://www.qgis.org/ (accessed on 15 January 2026).
- Blanco, A.C.; Tamondong, A.M.; Perez, A.M.C.; Ang, M.R.C.O.; Paringit, E.C. The PHIL-LIDAR 2 program: National resource inventory of the Philippines using Lidar and other remotely sensed data. Int. Arch. Photogramm. Remote Sens. Spat. Inf. Sci. 2015, XL-7/W3, 1123–1127. [Google Scholar] [CrossRef] [Scilit]
- Pedregosa, F.; Varoquaux, G.; Gramfort, A.; Michel, V.; Thirion, B.; Grisel, O.; Blondel, M.; Prettenhofer, P.; Weiss, R.; Dubourg, V.; et al. Scikit-learn: Machine Learning in Python. J. Mach. Learn. Res. 2011, 12, 2825–2830. [Google Scholar]
- Python Core Team. Python: A Dynamic, Open Source Programming Language Python Software Foundation; Python Software Foundation: Beaverton, OR, USA, 2024; Available online: https://www.python.org/ (accessed on 20 January 2025).
- Ridler, T.; Calvard, S. Picture thresholding using an iterative selection method. IEEE Trans. Syst. Man Cybern. 1978, 8, 630–632. [Google Scholar] [CrossRef] [Scilit]
- Li, C.H.; Lee, H.-J. Minimum cross entropy thresholding. Pattern Recognit. 1993, 26, 617–625. [Google Scholar] [CrossRef] [Scilit]
- Chow, C.K.; Kaneko, T. Automatic boundary detection of the left ventricle from cineangiograms. Comput. Biomed. Res. 1972, 5, 388–410. [Google Scholar] [CrossRef] [Scilit] [PubMed]
- Gonzalez, R.C.; Woods, R.E. Digital Image Processing, 4th ed.; Pearson: Hong Kong, China, 2018. [Google Scholar]
- Prewitt, J.M.; Mendelsohn, M.L. The analysis of cell images. Ann. N. Y. Acad. Sci. 1966, 128, 1035–1053. [Google Scholar] [CrossRef] [Scilit] [PubMed]
- Niblack, W. An Introduction to Digital Image Processing; Prentice-Hall International: Hoboken, NJ, USA, 1986. [Google Scholar]
- Sauvola, J.; Pietikäinen, M. Adaptive document image binarization. Pattern Recognit. 2000, 33, 225–236. [Google Scholar] [CrossRef] [Scilit]
- Zack, G.; Rogers, W.; Latt, S. Automatic measurement of sister chromatid exchange frequency. J. Histochem. Cytochem. 1977, 25, 741–753. [Google Scholar] [CrossRef] [Scilit] [PubMed]
- Yen, J.-C.; Chang, F.-J.; Chang, S. A new criterion for automatic threshold selection. IEEE Trans. Image Process. 1995, 4, 370–378. [Google Scholar] [CrossRef] [Scilit] [PubMed]
- Otsu, N. A threshold selection method from gray-level histograms. IEEE Trans. Syst. Man Cybern. 1979, 9, 62–66. [Google Scholar] [CrossRef] [Scilit]
- Hagberg, A.A.; Schult, D.A.; Swart, P.J. Exploring Network Structure, Dynamics, and Function using NetworkX. In Proceedings of the Python in Science Conference, Pasadena, CA, USA, 19–24 August 2008; pp. 11–15. [Google Scholar] [CrossRef] [Scilit]
- Moolna, A. Ocean inspiration for a sustainable future: Rivers to Seas engagement and a UN Ocean Agency? Ambio 2026, 55, 775–782. [Google Scholar] [CrossRef] [Scilit] [PubMed]
- Sandin, S.A.; Becker, P.A.; Becker, C.; Brown, K.; Erazo, G.E.; Figuerola, C.; Fisher, R.N.; Friedlander, A.M.; Fukami, T.; Graham, N.A.J.; et al. Harnessing island–ocean connections to maximize marine benefits of island conservation. Proc. Natl. Acad. Sci. USA 2022, 119, e2122354119. [Google Scholar] [CrossRef] [Scilit] [PubMed]
- Matte, P.; Wilkin, J.; Staneva, J. The Representation of Rivers in Operational Ocean Forecasting Systems: A Review. State Planet 2025, 5, 1–21. [Google Scholar] [CrossRef] [Scilit]
- Hagberg, A.A.; Schult, D.A.; Swart, P.J.; NetworkX Developers. NetworkX: Network Analysis in Python; Zenodo: Geneva, Switzerland, 2024; Available online: https://github.com/networkx/networkx (accessed on 1 September 2026).
- Chen, D.-B.; Lü, L.; Shang, M.-S.; Zhang, Y.-C.; Zhou, T. Identifying influential nodes in complex networks. Phys. Stat. Mech. Appl. 2012, 391, 1777–1787. [Google Scholar] [CrossRef] [Scilit]
- Fagiolo, G. Clustering in complex directed networks. Phys. Rev. E 2007, 76, 026107. [Google Scholar] [CrossRef] [Scilit] [PubMed]
- Hahriz. Hahriz/River-Networks-Processing: Version 1.0.0—Initial Release; Zenodo: Geneva, Switzerland, 2026. [Google Scholar] [CrossRef]
- Sha, C.; Hou, J.; Cui, H. A robust 2D Otsu’s thresholding method in image segmentation. J. Vis. Commun. Image Represent. 2016, 41, 339–351. [Google Scholar] [CrossRef] [Scilit]
- Boothroyd, R.J.; Williams, R.D.; Hoey, T.B.; MacDonell, C.; Tolentino, P.L.M.; Quick, L.; Guardian, E.L.; Reyes, J.C.M.O.; Sabillo, C.J.; Perez, J.E.G.; et al. National-scale geodatabase of catchment characteristics in the Philippines for river management applications. PLoS ONE 2023, 18, e0281933. [Google Scholar] [CrossRef] [Scilit] [PubMed]
- Twidale, C. River patterns and their meaning. Earth-Sci. Rev. 2004, 67, 159–218. [Google Scholar] [CrossRef]
- Tolentino, P.L.M.; Perez, J.E.G.; Guardian, E.L.; Boothroyd, R.J.; Hoey, T.B.; Williams, R.D.; Fryirs, K.A.; Brierley, G.J.; David, C.P.C. River Styles and stream power analysis reveal the diversity of fluvial morphology in a Philippine tropical catchment. Geosci. Lett. 2022, 9, 6. [Google Scholar] [CrossRef] [Scilit]
- Liu, F.; Qin, T.; Wang, H.; Liu, S.; Nie, H.; Wang, J. Scale Effect of Sloping Landscape Characteristics on River Water Quality in the Upper Reaches of the Si River in East-Central China. Land 2023, 12, 457. [Google Scholar] [CrossRef] [Scilit]
- Kostynick, R.; Prata, J.; Bower, J.; Masteller, C. Slope-dependent riverbed strengthening and the evolution of the threshold for motion in gravel-bed rivers. Geology 2026. [Google Scholar] [CrossRef] [Scilit]
- Sassolas-Serrayet, T.; Cattin, R.; Ferry, M. The shape of watersheds. Nat. Commun. 2018, 9, 3791. [Google Scholar] [CrossRef] [Scilit] [PubMed]
- Pradhan, M.P. Automatic Association of Stream Order for Vector Hydrograph using Spiral Traversal Technique. IOSR J. Comput. Eng. 2012, 1, 9–12. [Google Scholar] [CrossRef] [Scilit]
- Kovchegov, Y.; Zaliapin, I.; Foufoula-Georgiou, E. Critical Tokunaga model for river networks. Phys. Rev. E 2022, 105, 014301. [Google Scholar] [CrossRef] [Scilit] [PubMed]
- Funk, A.; Baldan, D.; Bondar-Kunze, E.; Brizuela, S.R.; Kowal, J.; Hein, T. Connectivity as a driver of river-floodplain functioning: A dynamic, graph theoretic approach. Ecol. Indic. 2023, 154, 110877. [Google Scholar] [CrossRef] [Scilit]
- Willett, S.D.; McCoy, S.W.; Perron, J.T.; Goren, L.; Chen, C.-Y. Dynamic Reorganization of River Basins. Science 2014, 343, 1248765. [Google Scholar] [CrossRef] [Scilit] [PubMed]
- Nile, B.K.; Al-Saadi, R.J.M.; Abdulameer, L.; Al Maimuri, N.M.L.; Al-Dujaili, A.N. Climate Change Impacts on River Hydraulics: A Global Synthesis of Hydrological Shifts, Ecological Consequences, and Adaptive Strategies. Water Conserv. Sci. Eng. 2025, 10, 48. [Google Scholar] [CrossRef] [Scilit]
- Wang, J.; Qin, Z.; Shi, Y.; Yao, J. Multifractal Analysis of River Networks under the Background of Urbanization in the Yellow River Basin, China. Water 2021, 13, 2347. [Google Scholar] [CrossRef] [Scilit]
- Vaze, J.; Teng, J.; Spencer, G. Impact of DEM accuracy and resolution on topographic indices. Environ. Model. Softw. 2010, 25, 1086–1098. [Google Scholar] [CrossRef] [Scilit]
- Rivera, A.T.; Dela Vega, J.B.G. From vulnerability to resilience: Addressing the causes, impacts, and solutions for recurrent flash floods in the Philippines. Trop. Cyclone Res. Rev. 2025, 14, 301–310. [Google Scholar] [CrossRef] [Scilit]
- Park, J.; Hong, I. Innovative Solutions for Climate-Resilient Flood Management in the Poorer and Vulnerable Province of Leyte, The Philippines. In Advances in Hydroinformatics; Gourbesville, P., Caignaert, G., Eds.; Springer: Singapore, 2020; pp. 593–605. [Google Scholar] [CrossRef] [Scilit]
- Takagi, H.; Leon, M.D.; Esteban, M.; Mikami, T.; Nakamura, R. Storm Surge Due to 2013 Typhoon Yolanda (Haiyan) in Leyte Gulf, the Philippines. In Handbook of Coastal Disaster Mitigation for Engineers and Planners; Elsevier: Amsterdam, The Netherlands, 2015; pp. 133–144. [Google Scholar] [CrossRef] [Scilit]
- Santos, C.T.; Toda, L.; Orduña, J.R.; Santos, F.D.; Ferrão, J. The impacts of Typhoon Haiyan in the Philippines: Implications to land use planning. Clim. Disaster Dev. J. 2015, 1, 57–66. [Google Scholar] [CrossRef] [Scilit]
- Pallard, B.; Castellarin, A.; Montanari, A. A look at the links between drainage density and flood statistics. Hydrol. Earth Syst. Sci. 2009, 13, 1019–1029. [Google Scholar] [CrossRef] [Scilit]
- Lu, M.; Wan, B.; Zhang, X.; Yu, Z.; Peng, Z.; Fu, X.; Xu, P.; Yao, Q. Impacts of River Network Connectivity on Flood Signatures and Severity Regulated by Flood Control Projects. Water 2024, 16, 2390. [Google Scholar] [CrossRef] [Scilit]
- Barabási, A.-L. Network Science. Available online: https://networksciencebook.com/ (accessed on 25 August 2026).








| Network Metrics | Equation | Implication/Definition |
|---|---|---|
| Degree Centrality | In-Degree Centrality: Out-Degree Centrality: where degin(u): Number of edges directed into node u degout(u): Number of edges directed out of node u N − 1: Maximum possible incoming or outgoing edges for a single node | Degree centrality represents the total number of connections of a node, while in-degree and out-degree provide a directional breakdown of these connections, indicating incoming and outgoing flows in a directed network. |
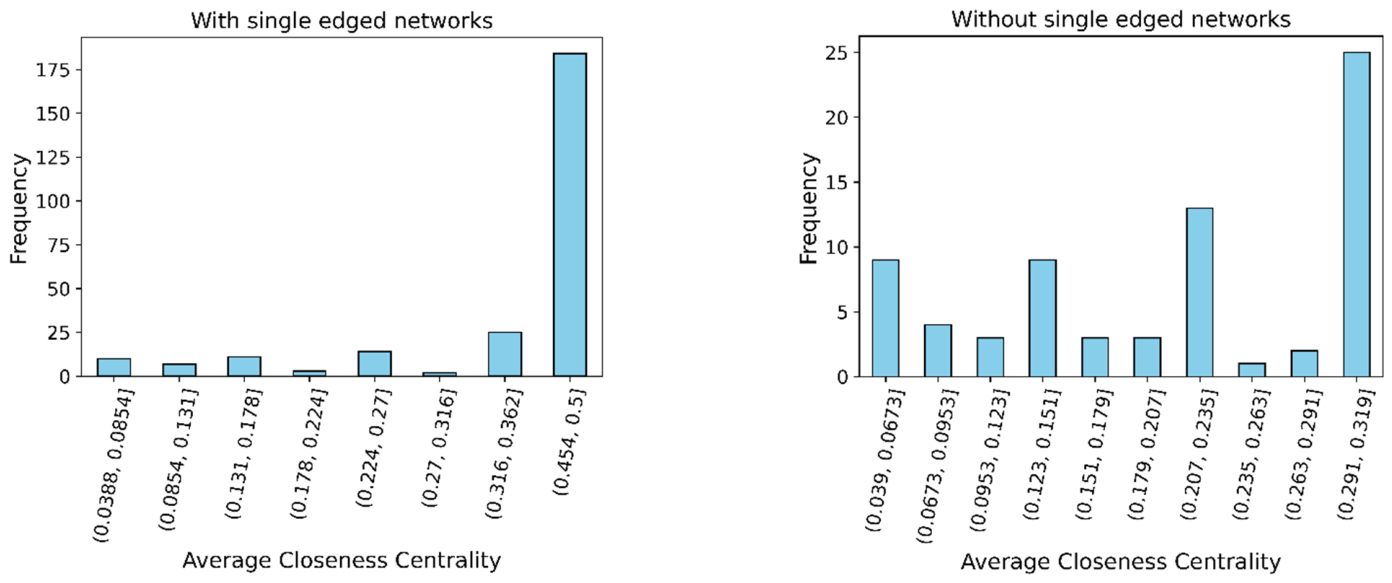
| Closeness Centrality | NetworkX [47] computes inward closeness centrality using the Wasserman and Faust formulation (wf_improved = True by default): where d(v,u): Shortest path distance from node v to node u (inward distance) nu: Number of nodes reachable to node u (including u itself) : Wasserman–Faust scaling factor for handling disconnected/unreachable components | Closeness centrality [48] quantifies how close a node is to all other nodes in the network, providing a global indicator of connectivity and transport efficiency. High closeness centrality reflects nodes that are centrally located and can quickly interact with other parts of the network, while low closeness centrality reflects nodes that are more isolated or peripheral, such as upstream sources or downstream outlets, where connectivity to the rest is limited. |
| Clustering Coefficient | For directed graphs, NetworkX [47] computes local clustering based on Fagiolo’s formulation: where T(u): Number of directed triangle through node u degtot(u): Sum of in-degree and out-degree (degin(u) + degout(u)) deg↔(u): Reciprocal degree of u (number of double-directed/bidirectional edges connected to u) | The clustering coefficient [46,49] measures the degree to which nodes in a network tend to cluster together, indicating how closely connected a node’s neighbors are to one another. |
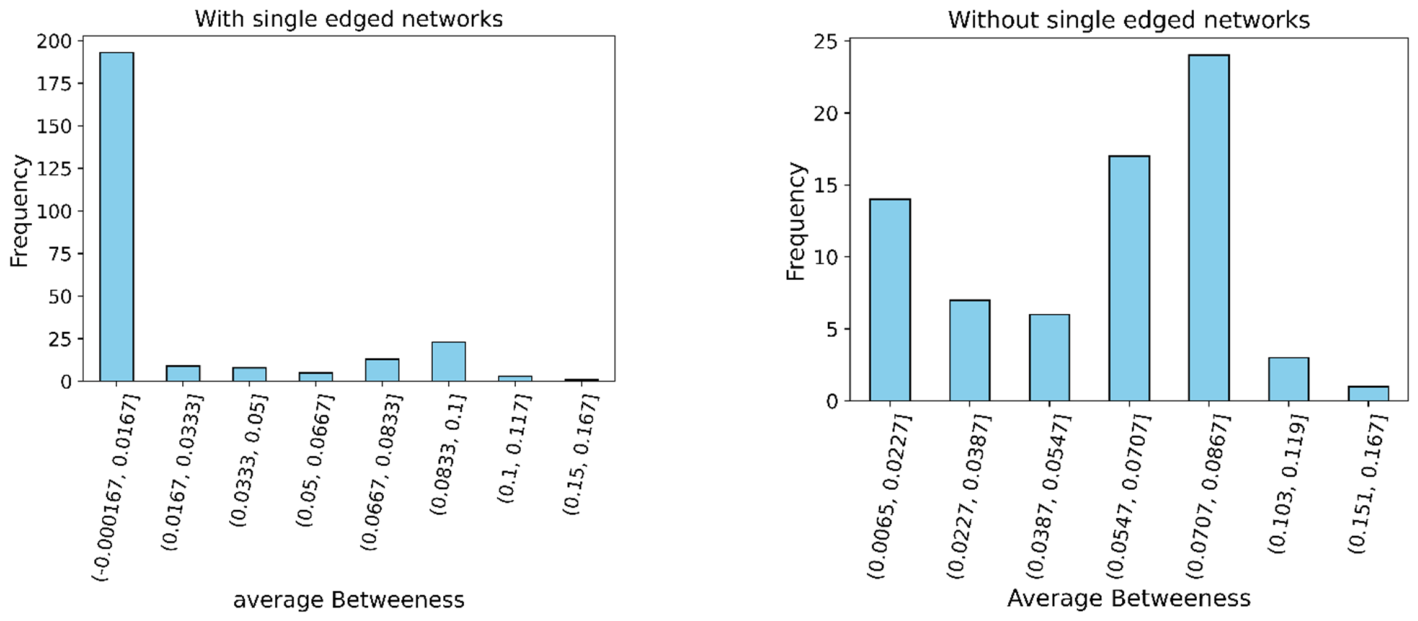
| Betweenness Centrality | For node v, betweenness centrality sums the fraction of all pair-shortest paths passing through v: When normalized (normalized = True, default), NetworkX divides by the total possible ordered pairs in a directed graph, excluding v: where σ(s,t): Total number of shortest directed paths from source s to target t σ(s,t|v): Number of those shortest directed paths that pass through node v (N − 1)(N − 2): Maximum number of directed pairs (s,t) in a graph of N nodes where s ≠ v and t ≠ v. | Betweenness centrality measures the extent to which a node lies on the shortest path between other pairs of nodes in a network. It quantifies the role as an intermediate or bridge, indicating its importance in facilitating connectivity and flow across the network. |
| Metric | NetworkX Code |
|---|---|
| Average degree | nx.degree_centrality(G) |
| Average in-degree | nx.in_degree_centrality(G) |
| Average out-degree | nx.out_degree_centrality(G) |
| Closeness | nx.closeness_centrality(G) |
| Clustering coefficient | nx.clustering(G) |
| Betweenness | nx.betweenness_centrality(G) |
| Number of Nodes | Samples | DEM Total Length (m) | OSM Total Length (m) | Total Length Ratio | Average | Standard Deviation |
|---|---|---|---|---|---|---|
| 2 | 1 | 3303.45 | 4516.01 | 0.73 | 0.92 | 0.23 |
| 2 | 6809.59 | 5787.78 | 1.18 | |||
| 3 | 4777.94 | 5587.17 | 0.86 | |||
| 10–15 | 1 | 33,897.33 | 40,307.73 | 0.84 | 0.99 | 0.29 |
| 2 | 31,495.18 | 23,838.22 | 1.32 | |||
| 3 | 27,018.07 | 33,661.16 | 0.80 | |||
| >40 | 1 | 171,023.19 | 196,643.64 | 0.87 | 0.74 | 0.23 |
| 2 | 158,882.83 | 179,755.08 | 0.88 | |||
| 3 | 218,163.80 | 454,903.72 | 0.48 |
| Thresholding Method | Reference Number of Node | Node Count (Before Node Filtering Procedure) | Node Count (After Node Filtering Procedure | Relative Difference DN (Before Node Filtering Procedure) | Relative Difference DN (After node Filtering Procedure) |
|---|---|---|---|---|---|
| Otsu | 14 | 30 | 14 | 114.29 | 0.00 |
| Isodata | 14 | 27 | 14 | 92.86 | 0.00 |
| Li | 14 | 29 | 14 | 107.14 | 0.00 |
| Local | 14 | 36 | 15 | 157.14 | 7.14 |
| Mean | 14 | 31 | 15 | 121.43 | 7.14 |
| Minimum | 14 | 29 | 14 | 107.14 | 0.00 |
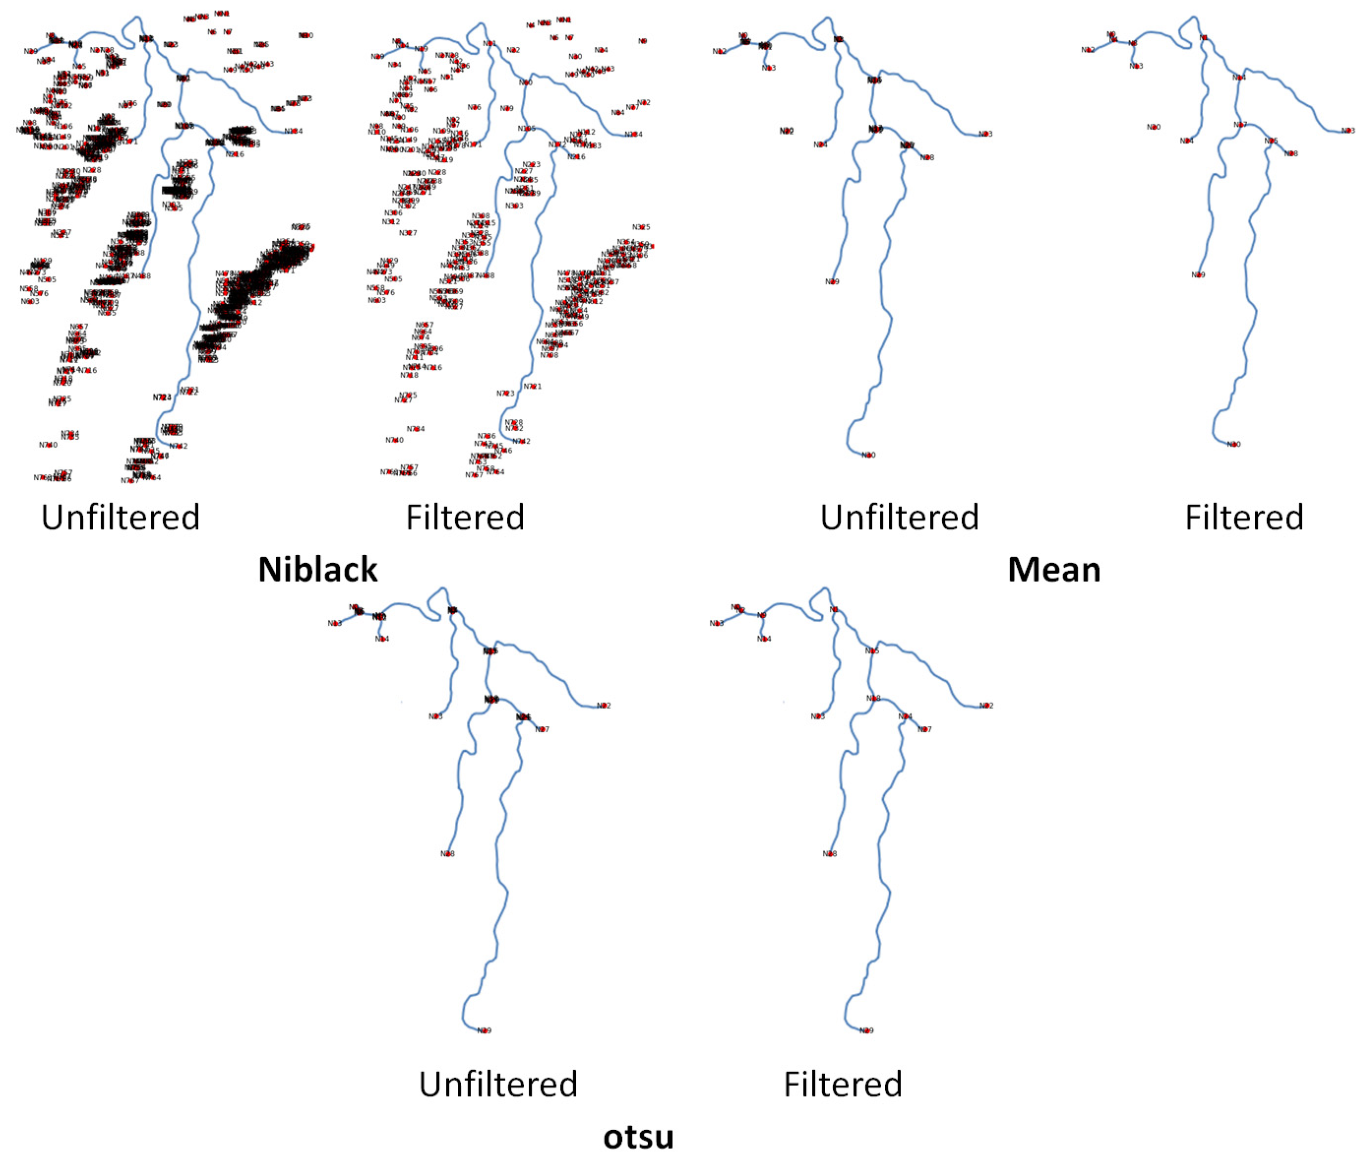
| Niblack | 14 | 768 | 254 | 5385.71 | 1714.29 |
| Sauvola | 14 | 29 | 14 | 107.14 | 0.00 |
| Triangle | 14 | 31 | 15 | 121.43 | 7.14 |
| Yen | 14 | 31 | 15 | 121.43 | 7.14 |
| Number of Nodes | Ave Slope (%) | Total Length (m) | Total In/Out Degree | Ave In/Out Degree | Ave In/Out Deg Centrality | Ave Betweenness | Ave Closeness | Ave Clustering | |
|---|---|---|---|---|---|---|---|---|---|
| Average | 4.70 | 5.97 | 10,460.42 | 3.73 | 0.48 | 0.40 | 0.02 | 0.42 | 0.00 |
| Median | 2.00 | 4.94 | 3191.00 | 1.00 | 0.50 | 0.50 | 0.00 | 0.50 | 0.00 |
| Mode | 2.00 | 0.00 | 1026.00 | 1.00 | 0.50 | 0.50 | 0.00 | 0.50 | 0.00 |
| Max | 60.00 | 26.00 | 199,798.00 | 63.00 | 0.75 | 0.50 | 0.17 | 0.50 | 0.01 |
| Min | 2.00 | 0.00 | 309.00 | 1.00 | 0.26 | 0.02 | 0.00 | 0.04 | 0.00 |
| Q1: 25% | 2.00 | 1.64 | 1943.50 | 1.00 | 0.50 | 0.25 | 0.00 | 0.32 | 0.00 |
| Q2: 50% | 2.00 | 4.94 | 3191.00 | 1.00 | 0.50 | 0.50 | 0.00 | 0.50 | 0.00 |
| Q3: 75% | 4.00 | 8.65 | 6634.75 | 3.00 | 0.50 | 0.50 | 0.02 | 0.50 | 0.00 |
| Q4: 90% | 8.00 | 13.68 | 22,835.00 | 7.00 | 0.50 | 0.50 | 0.08 | 0.50 | 0.00 |
| Nodes | Ave In Degree Centrality | Ave Out Degree Centrality | Ave Betweenness | Ave Closeness | Ave Clustering |
|---|---|---|---|---|---|
| 2 | 0.500 | 0.500 | 0.000 | 0.500 | 0.000 |
| 5 | 0.200 | 0.200 | 0.055 | 0.236 | 0.000 |
| 10 | 0.100 | 0.100 | 0.017 | 0.129 | 0.000 |
| 15 | 0.067 | 0.067 | 0.010 | 0.089 | 0.000 |
| 20 | 0.050 | 0.050 | 0.010 | 0.071 | 0.000 |
| 30 | 0.040 | 0.040 | 0.007 | 0.058 | 0.000 |
| 35 | 0.033 | 0.033 | 0.005 | 0.049 | 0.000 |
| Nodes | Ave In Degree Centrality | Ave Out Degree Centrality | Ave Betweenness | Ave Closeness | Ave Clustering |
|---|---|---|---|---|---|
| 2 | 0.500 | 0.500 | 0.000 | 0.500 | 0.000 |
| 5 | 0.411 | 0.411 | 0.089 | 0.264 | 0.000 |
| 10 | 0.100 | 0.100 | 0.047 | 0.147 | 0.000 |
| 15 | 0.069 | 0.069 | 0.040 | 0.115 | 0.000 |
| 20 | 0.050 | 0.050 | 0.032 | 0.088 | 0.000 |
| 30 | 0.031 | 0.032 | 0.020 | 0.590 | 0.000 |
| 35 | 0.030 | 0.030 | 0.023 | 0.060 | 0.024 |
Disclaimer/Publisher’s Note: The statements, opinions and data contained in all publications are solely those of the individual author(s) and contributor(s) and not of MDPI and/or the editor(s). MDPI and/or the editor(s) disclaim responsibility for any injury to people or property resulting from any ideas, methods, instructions or products referred to in the content. |
© 2026 by the authors. Licensee MDPI, Basel, Switzerland. This article is an open access article distributed under the terms and conditions of the Creative Commons Attribution (CC BY) license.
Share and Cite
Abad, H.R.; Liponhay, M.; Forio, M.A.E. Complex Network Analysis for Characterizing River Networks: A Case Study of Leyte Island, Philippines. AppliedMath 2026, 6, 159. https://doi.org/10.3390/appliedmath6090159
Abad HR, Liponhay M, Forio MAE. Complex Network Analysis for Characterizing River Networks: A Case Study of Leyte Island, Philippines. AppliedMath. 2026; 6(9):159. https://doi.org/10.3390/appliedmath6090159
Chicago/Turabian StyleAbad, Hannah Rissah, Marissa Liponhay, and Marie Anne Eurie Forio. 2026. "Complex Network Analysis for Characterizing River Networks: A Case Study of Leyte Island, Philippines" AppliedMath 6, no. 9: 159. https://doi.org/10.3390/appliedmath6090159
APA StyleAbad, H. R., Liponhay, M., & Forio, M. A. E. (2026). Complex Network Analysis for Characterizing River Networks: A Case Study of Leyte Island, Philippines. AppliedMath, 6(9), 159. https://doi.org/10.3390/appliedmath6090159