1. Introduction
Consider a continuous random variable
Y with probability density function (PDF)
. The mean of
Y is
which is the expected value under
. That is,
is the weighted average of all possible values the random variable
Y can take, where the weights are determined by the PDF
. It is often interpreted as the center of mass of the distribution.
The variance of
Y is
which quantifies the spread or dispersion of
Y about its mean.
In information theory, Shannon entropy measures the uncertainty represented by a probability distribution. The continuous (i.e., differential) entropy is defined as [
1].
Recently, Huang [
2] introduced informity theory, in which, informity measures the certainty represented by a probability distribution and acts as the complementary dual of entropy [
3]. The continuous informity is defined as [
2].
In many practical applications, a PDF describes a system comprising a signal component and a noise component. The mean naturally quantifies signal strength (or systematic effect), whereas variance , entropy , and informity each characterize different aspects of noise or uncertainty. However, these measures have limitations for assessing the overall performance or informational power of a system. Mean is outlier-sensitive and undefined for some distributions (e.g., Cauchy distribution); variance, entropy, and informity are translation-invariant, ignoring signal magnitude shifts. Importantly, although these measures separately quantify signal strength and noise level (or uncertainty), they do not capture their interaction, which is often critical for assessing the overall performance or informational power of a system.
This paper introduces a new measure termed inforpower that explicitly incorporates the interplay between signal and noise, thereby providing a more comprehensive quantification of a distribution’s informational power. The remainder of the paper is organized as follows:
Section 2 formally defines inforpower;
Section 3 interprets its meaning and properties;
Section 4 presents inforpower for ten well known continuous distributions;
Section 5 develops an inforpower-based metric and illustrates its use in practical applications;
Section 6 offers discussion and conclusions.
2. Definition and Basic Properties of Inforpower
From an information-theoretic perspective [
4], a realized value
y of a continuous random variable represents information (signal), while the probability density
quantifies the certainty (inverse of local noise or uncertainty) associated with that value. The product
therefore captures effective information after accounting for certainty weighting.
Definition 1 (Effective information).
Let Z be the random variable representing effective informationFor any realized value y, the corresponding effective information is
.
Definition 2 (Inforpower).
Let denote inforpower of a continuous probability distribution. It is defined as the expected value of the effective information Z The definition of inforpower reflects the interaction between signal and noise. The product is the signal y weighted by its local certainty , and squaring quadratically amplifies contributions of high-certainty (low-noise) regions. Thus, inforpower directly measures the effective signal strength after noise interference: it rewards distributions where strong signals (large |y|) coincide with high certainty (large ), while penalizing cases where signal is diluted by uncertainty or spread across low-certainty regions. In this way, explicitly captures the interaction between signal magnitude and noise level.
The following theorems reveal important structural properties of inforpower.
Theorem 1. Ifis a location-scale family of distributions and is symmetric about its location parameter a (e.g., the mean μ or the location of symmetry), then,where
is the continuous informity. Proof of Theorem 1. The PDF for a generalized location-scale family of distributions is
where
a is the location parameter;
b is the scale parameter.
Make the change in variable
, then
. Substituting yields
When the distribution is symmetric about
a, the standardized density
is symmetric about zero. Consequently,
is even, and
is odd, so
This establishes Theorem 1. □
Theorem 2. If
is a scale-shape family of distributions supported on
, where
, then
is scale-invariant.
Proof of Theorem 2. The PDF of a generalized scale-shape family of non-negative distributions is
where
c is the shape parameter.
Make the change in variable
, then
. Substituting yields
which depends only on the shape parameter
c and is independent of the scale parameter
b. If the distribution has no shape parameter (e.g., standard exponential distribution),
is an absolute constant. This proves scale invariance and establishes Theorem 2. □
4. Inforpower for Ten Well-Known Continuous Distributions
Table 1 presents the PDF, informity
, inforpower
, ordinary mean (center of mass)
, and center of information energy
for ten widely used continuous distributions. The first four (normal, Laplace, logistic, and Cauchy) have support on (−∞, ∞). The next five (exponential, Gamma, Rayleigh, Weibull, and lognormal) have support on [0, ∞). The Pareto distribution has support
, where
> 0 is the minimum possible value.
As
Table 1 shows, for the symmetric normal, Laplace, and logistic distributions,
. For the symmetric Cauchy distribution (location parameter
),
. These results confirm Theorem 1: when the distribution is symmetric about its location parameter
a, inforpower reduces to
.
For the remaining six distributions, which are asymmetric and supported on [0, ∞) or , the expressions for contain no scale parameter. Specifically, for the exponential and Rayleigh distributions (one-parameter families with fixed shape), is a numerical constant; for the Gamma, Weibull, lognormal, and Pareto distributions, depends solely on the shape parameter and is invariant to scale parameter. These observations fully confirm Theorem 2.
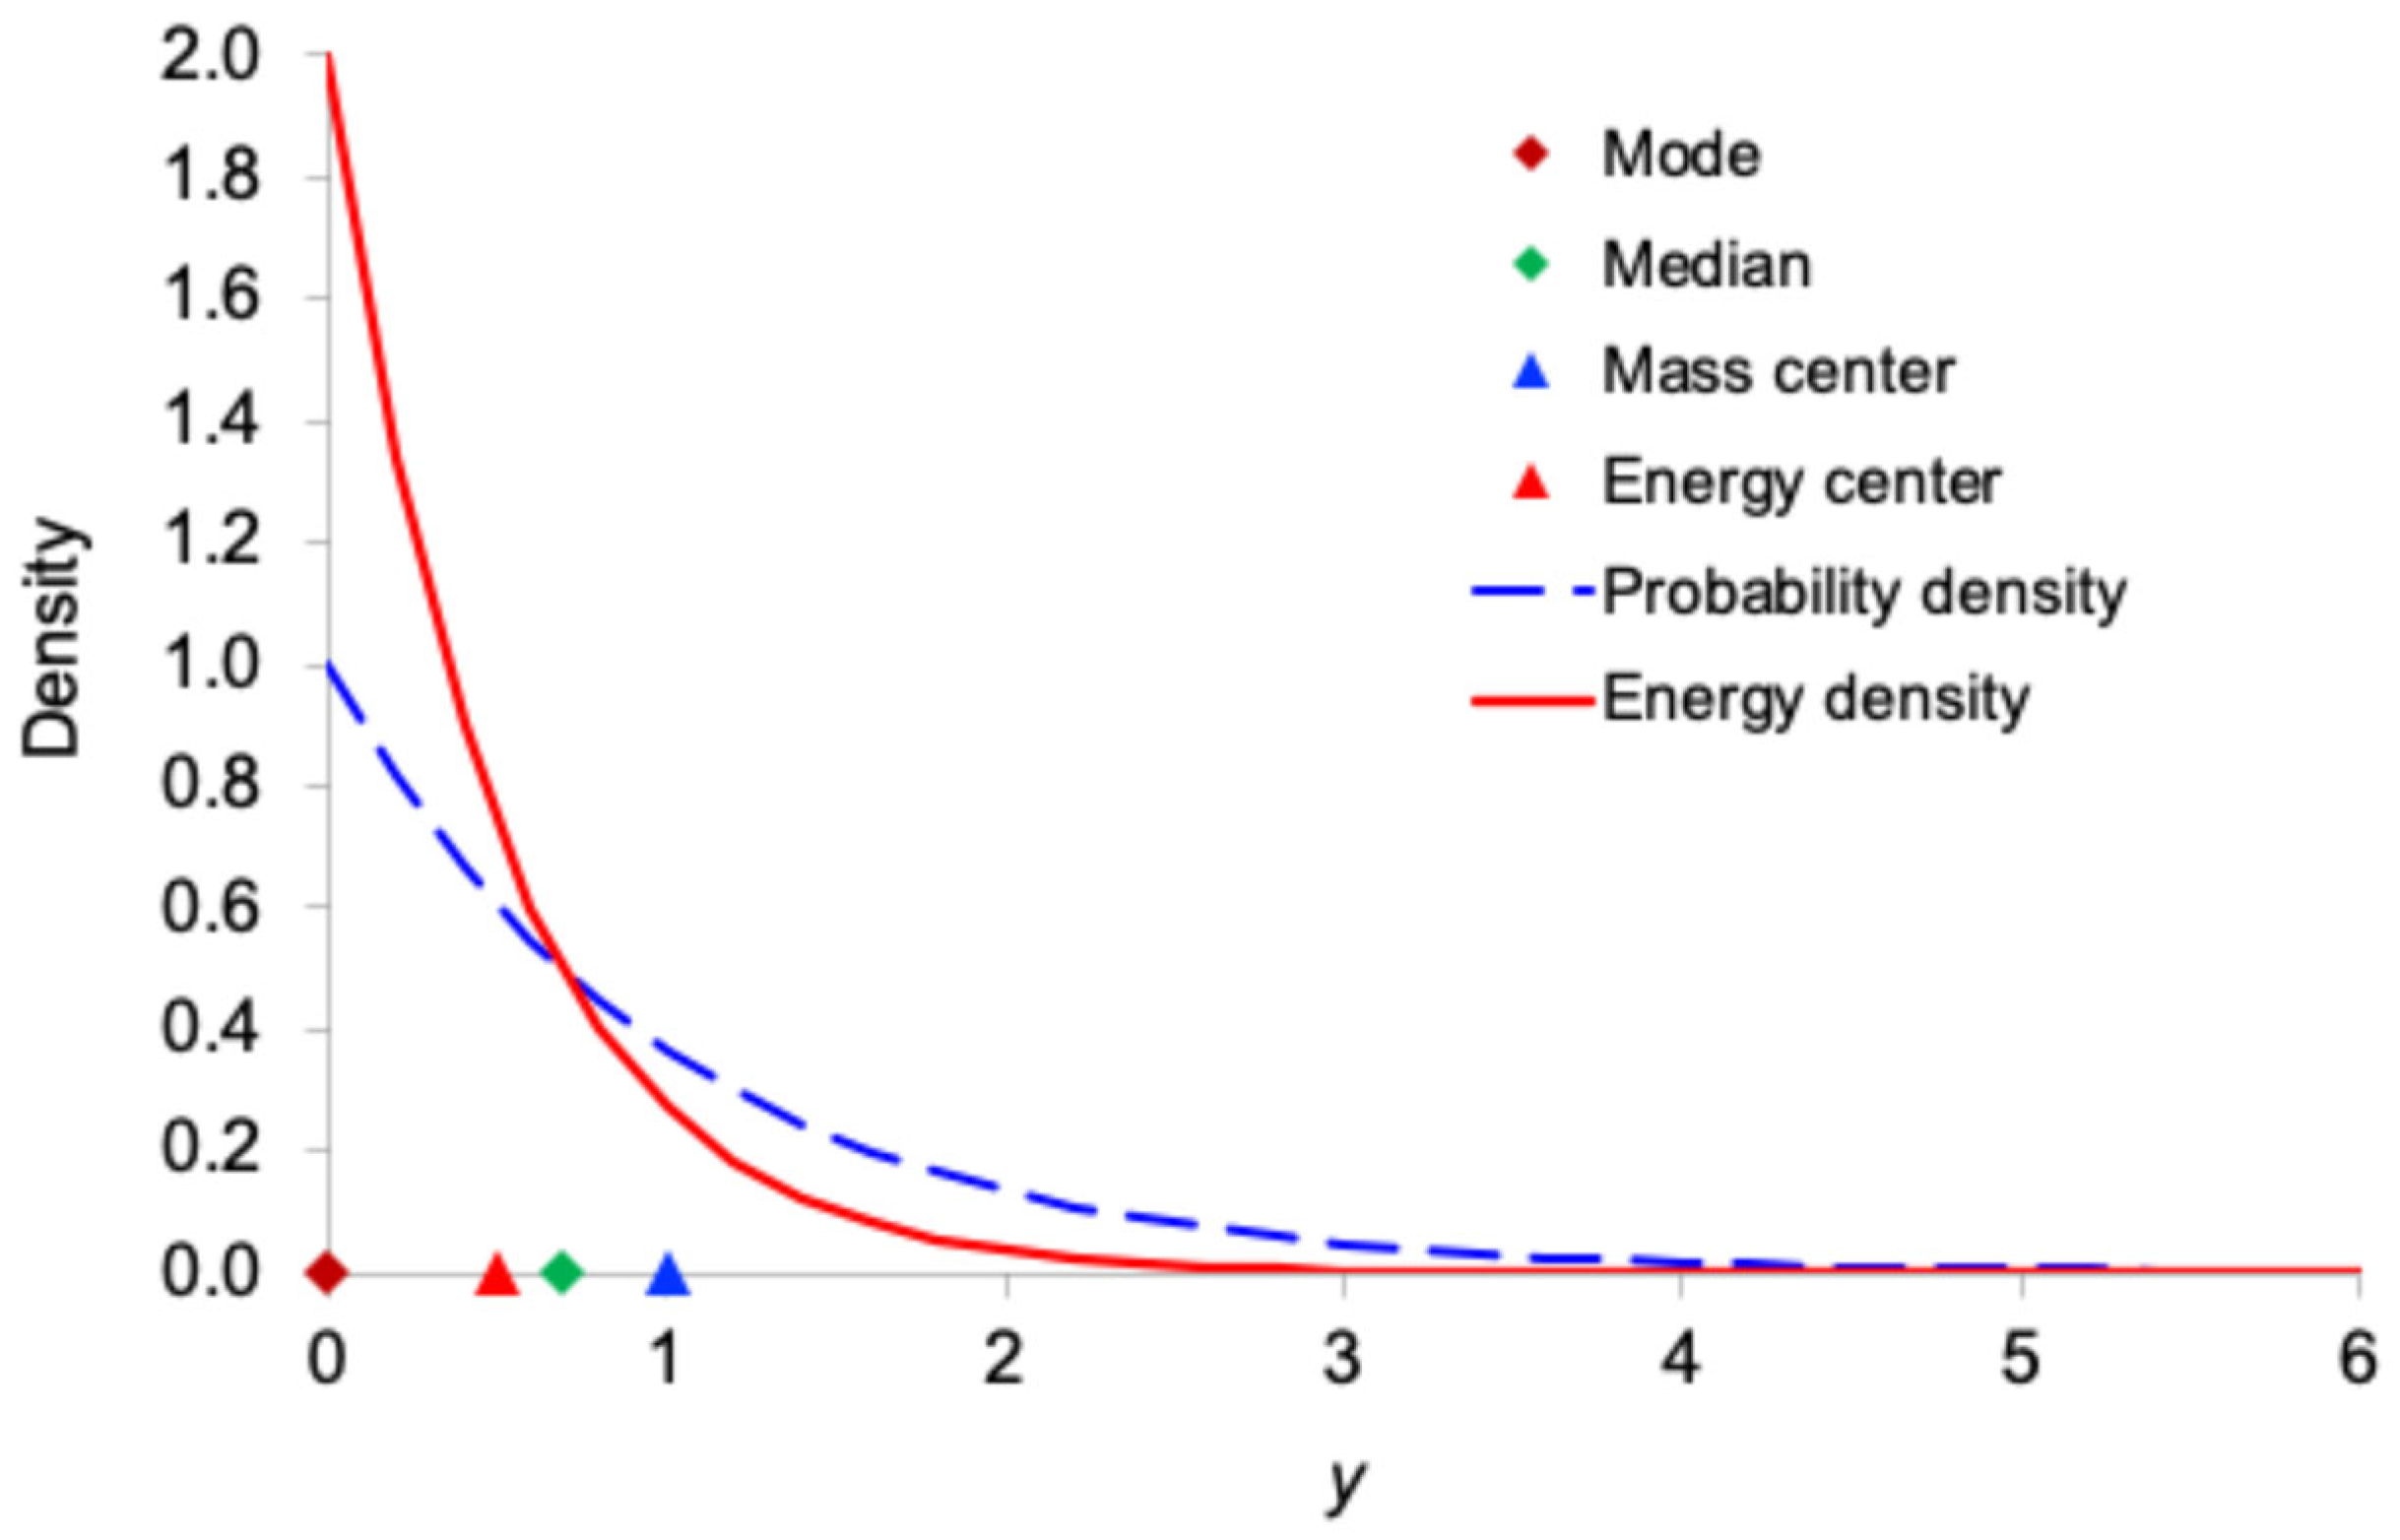
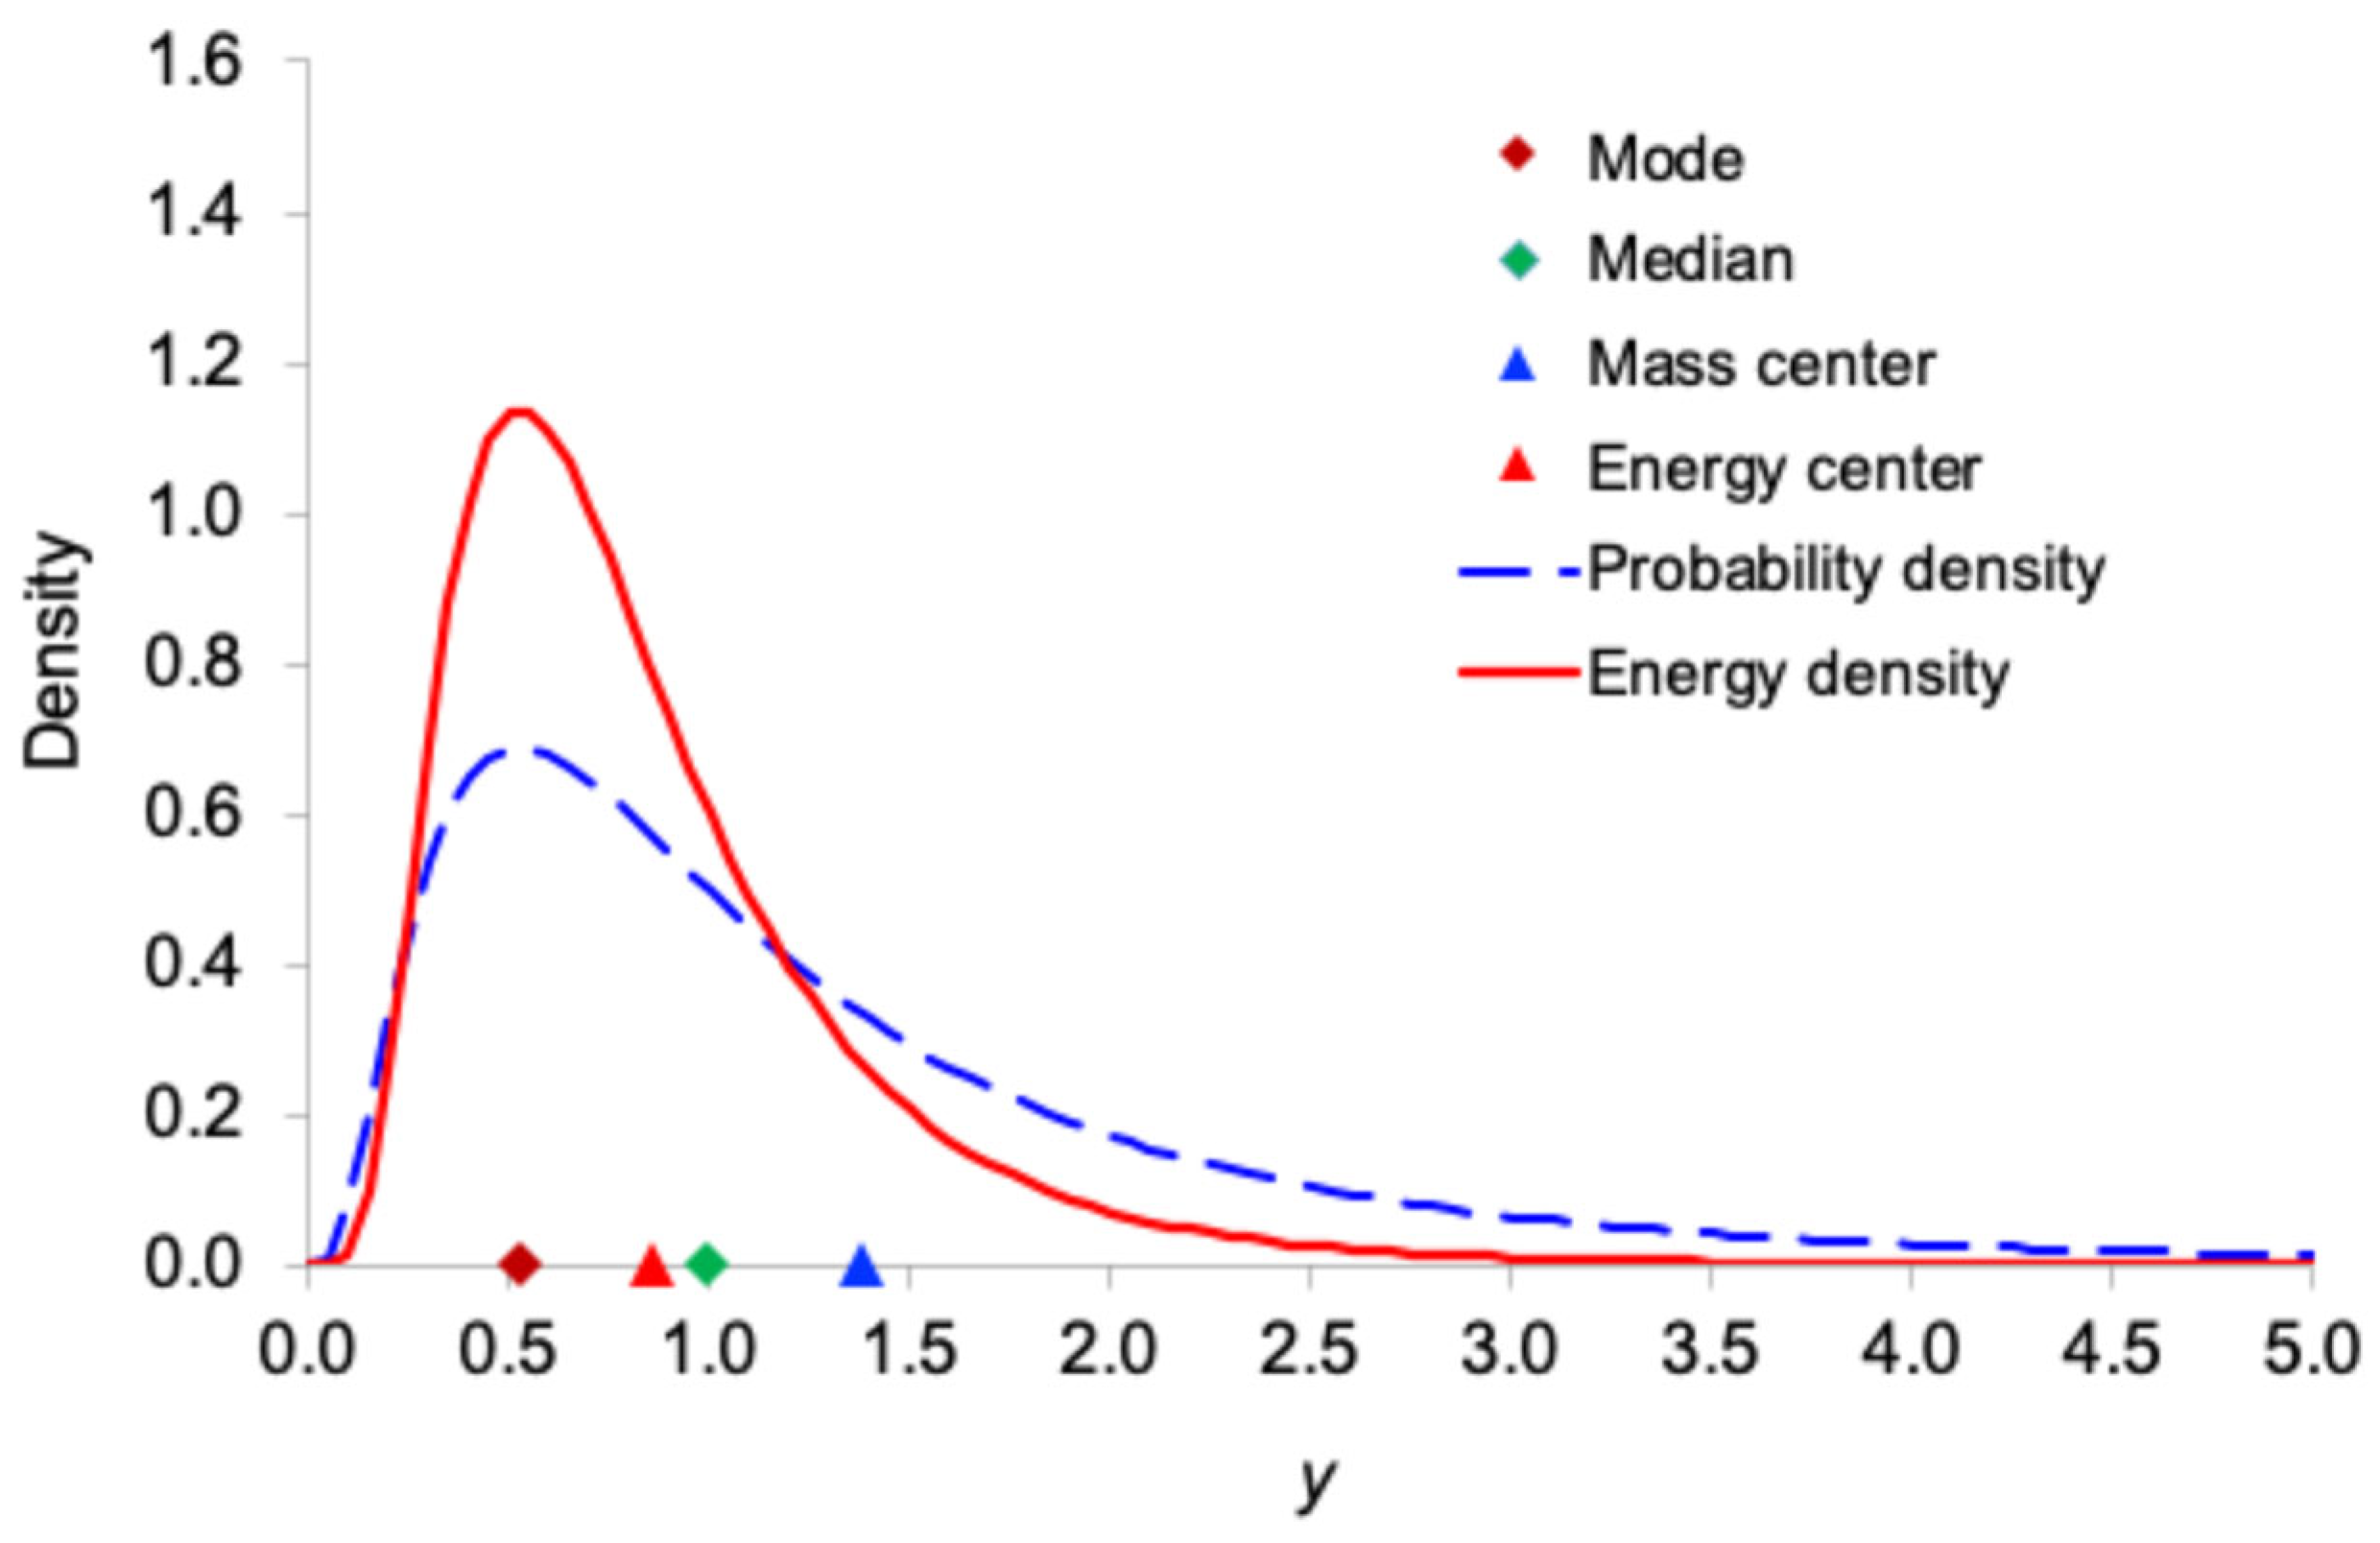
Figure 1,
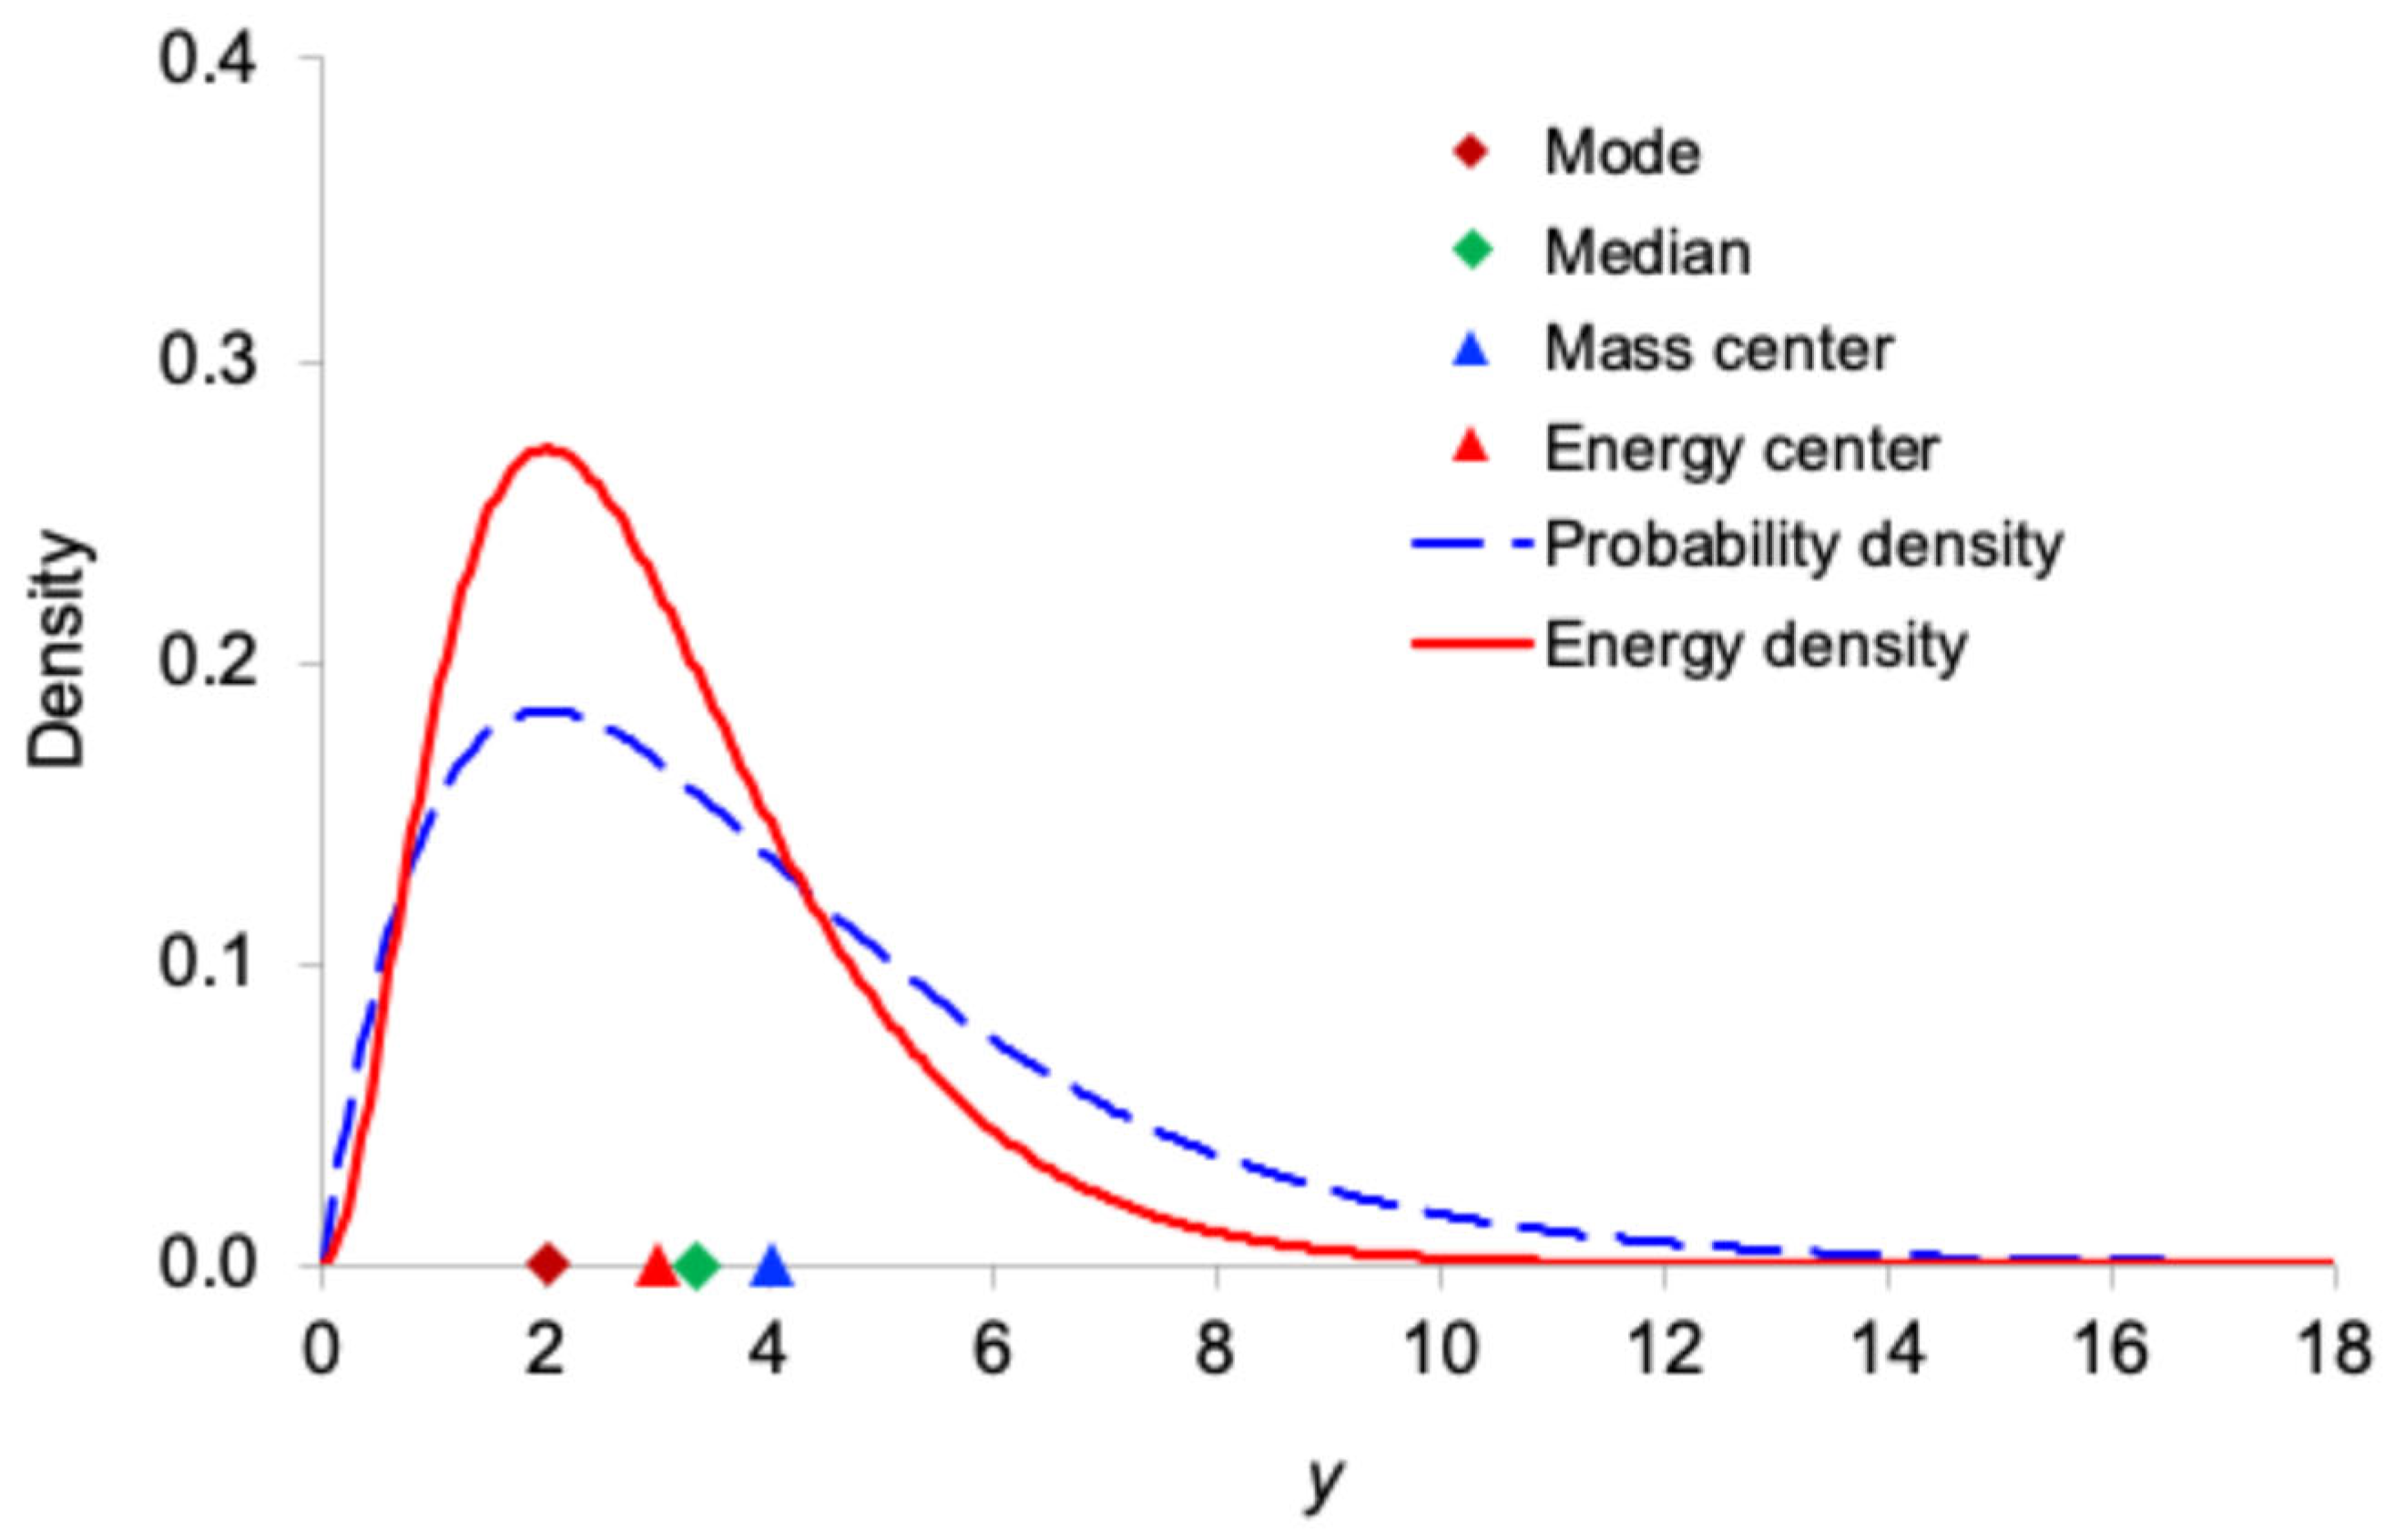
Figure 2,
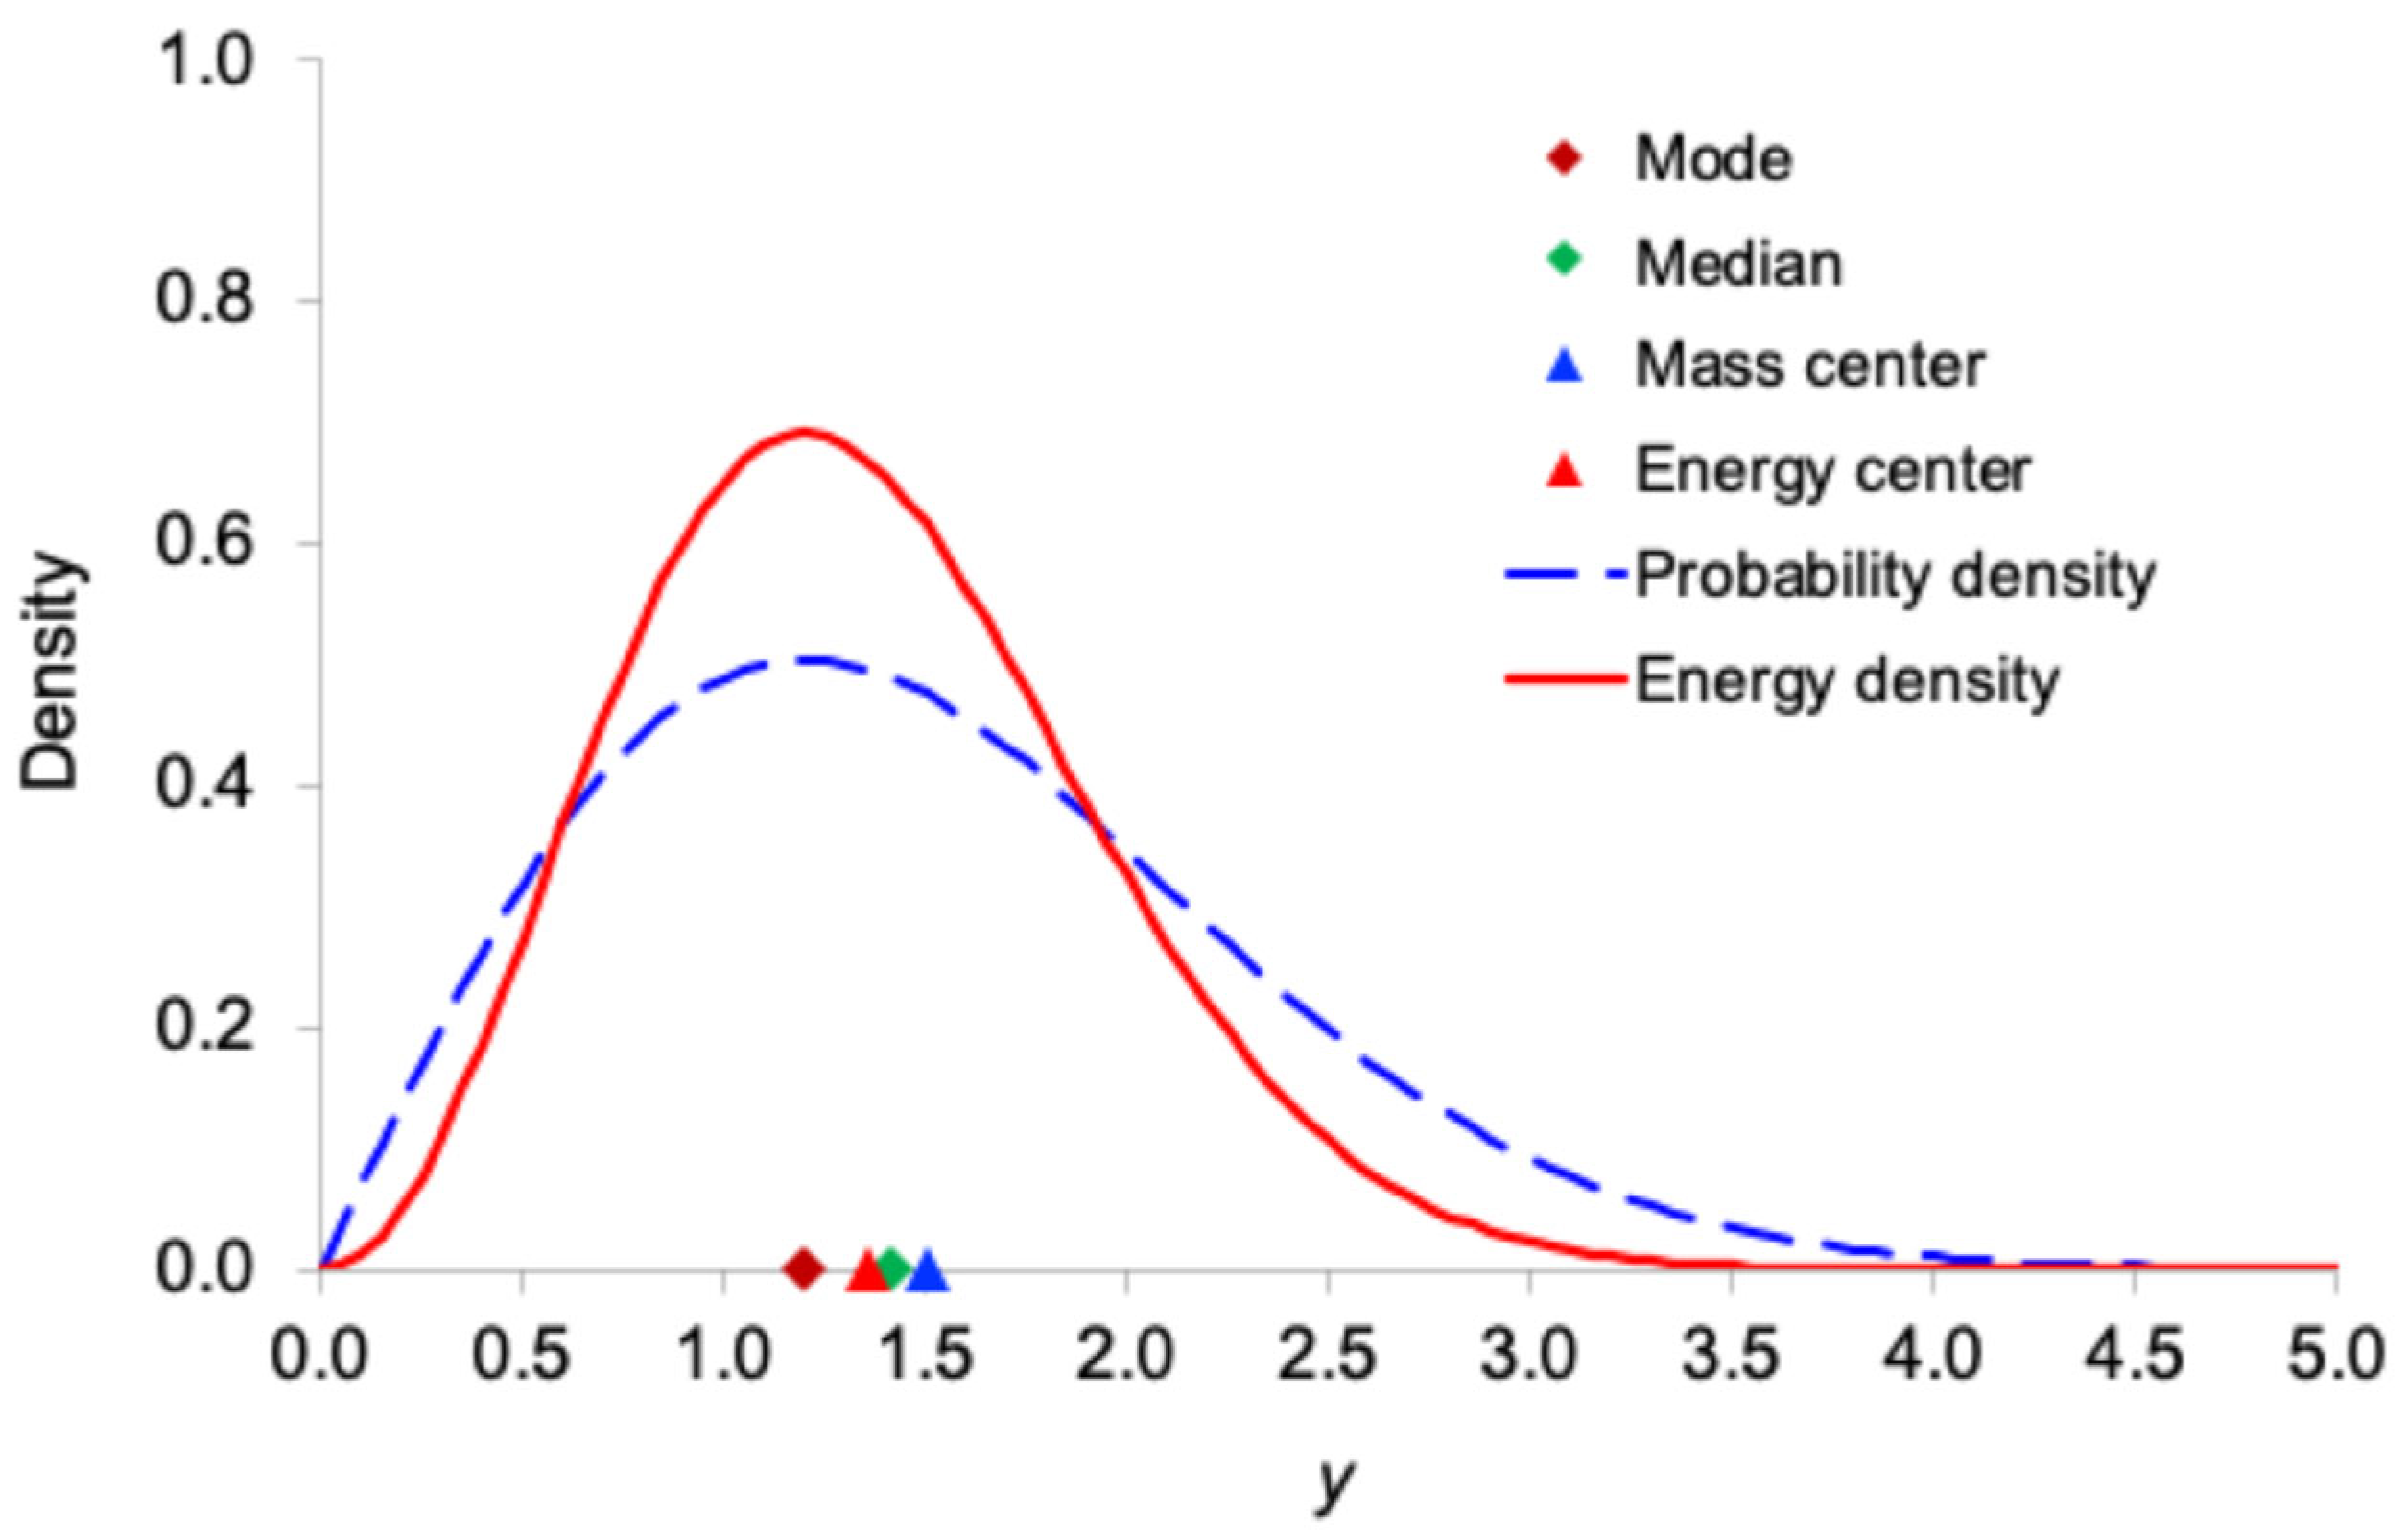
Figure 3,
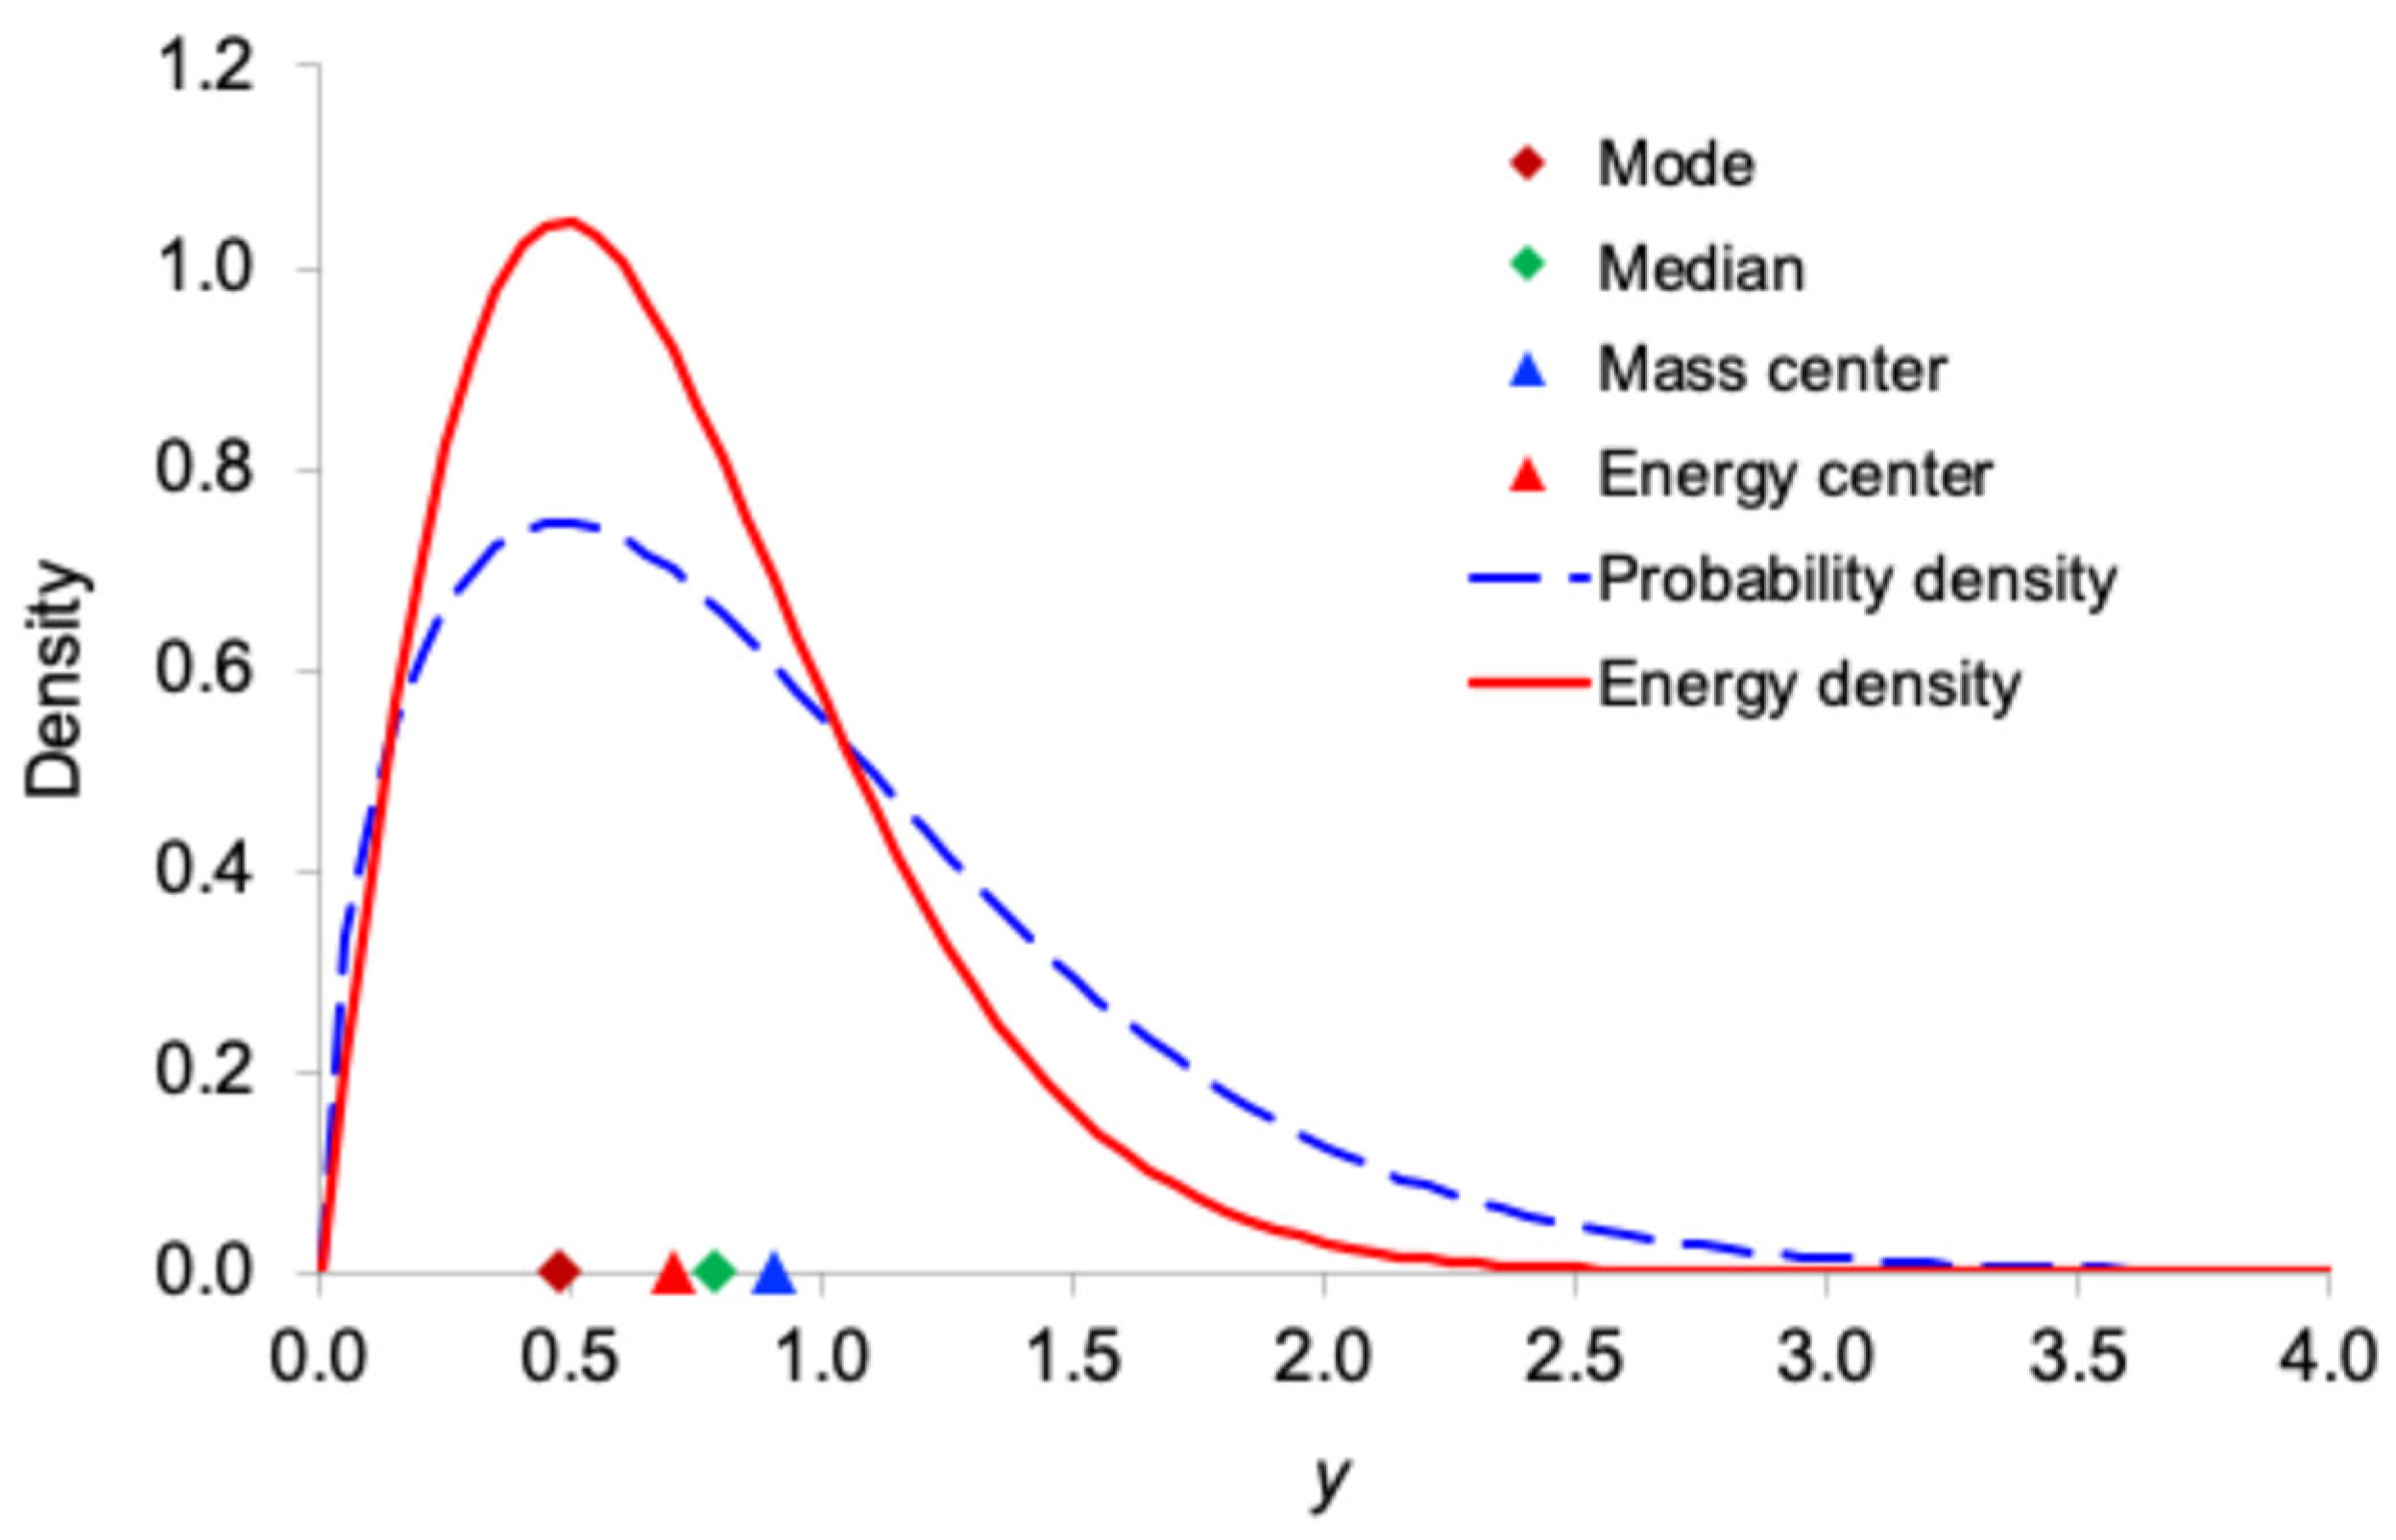
Figure 4 and
Figure 5 display, for the exponential, Gamma, Rayleigh, Weibull, and lognormal distributions, respectively, both the probability density function
and the corresponding information-energy density function
. The figures also mark the mode, median, ordinary mean
(center of mass), and energy center
.
As expected, the information-energy density function is visibly sharper and more concentrated around regions of high probability density than itself, because squaring the density amplifies peaks and suppresses tails.
In all five right-skewed distributions, the locations satisfy the following consistent ordering:
This systematic shift demonstrates that the center of information energy lies closer to the region of highest certainty (the mode) than does the ordinary mean. This provides further intuitive support for interpreting as the effective, certainty-weighted signal location and as a robust measure of the system’s informational power.
5. The Inforpower Metric and Application Examples
Inforpower provides a metric to compare and select probability distributions that model the same data.
Maximum Inforpower Criterion. We propose the following model-selection rule, termed the maximum inforpower criterion: given a dataset and
M candidate distributions
(
k = 1, …,
M) from the same family (i.e., sharing the same support), the preferred model is the one that maximizes inforpower
where
is the inforpower of the
k-th candidate distribution. Here, the ‘preferred’ model or ‘best’ distribution is understood as the one providing the highest informational power under this criterion, analogous to minimizing AIC or entropy.
Example 1. Synthetic Weibull distribution data.
A sample of
n = 200 observations was generated from a Weibull distribution with true parameters
and
[
6]. Xie [
6] fitted exponential, Weibull, Gamma, and normal distributions and compared them using the Akaike information criterion (AIC) and Pearson’s Q-statistic. Huang [
2,
7] compared these candidate distributions using the maximum informity criterion and the minimum entropy criterion, respectively. Normal distribution was excluded from our analysis because its support differs from the other three (positive-support) candidates. The estimated parameters are as follows [
6]: exponential distribution:
; Weibull distribution:
and
; and Gamma distribution:
and
.
Table 2 reports the performance of each distribution under five criteria.
As shown in
Table 2, the Weibull distribution ranks first under the AIC, minimum entropy, and maximum inforpower criteria, confirming that the true generating distribution is correctly identified by the inforpower metric. Although the Q-statistic and maximum informity criteria favor the Gamma distribution, Xie [
6] noted that ΔAIC = 4.7 between the Weibull and Gamma distributions is small and that the AIC “selects a good model which is not necessarily the true model.” Overall, the five criteria yield highly consistent conclusions.
Example 2. Annual maximum streamflow of the Tana River, Kenya.
Langat et al. [
8] analyzed the historical flow data collected from the Tana River (one of the longest rivers in Kenya) between 1941 and 2016. One of their goals was to find the best statistical distribution to model annual maximum streamflow. They considered six candidate distributions and used the Akaike information criterion (AIC) for selection. We focused on the following three best-performing candidates they identified: the Gamma (Pearson Type III), lognormal, and Weibull distributions.
Table 3 shows the estimated parameters and AIC values, and our analysis results for the entropy, informity, and inforpower metrics.
As shown in
Table 3, among these three distributions, the lognormal distribution is the best according to all four goodness-of-fit metrics (minimum AIC, minimum entropy, maximum informity, and maximum inforpower). The Gamma distribution is the second best, while the Weibull is the worst.
Table 4 shows the percentage differences in metrics between the Weibull and lognormal distributions, computed as (Weibull − Lognormal)/Lognormal × 100%.
Although the AIC and entropy metric detect only tiny differences (0.157% and 0.369%), the informity and inforpower metrics reveal substantially larger separations (−6.730% and −1.968%, respectively). This demonstrates that inforpower (and informity) can be considerably more sensitive than the traditional information criteria when distinguishing competing heavy-tailed distributions in hydrological and other positive-skewed applications.
These examples illustrate that the maximum inforpower criterion is intuitive, easy to compute, and either agrees with or usefully complements established model-selection tools such as the AIC, minimum entropy criterion, and maximum informity criterion.
6. Discussion and Conclusions
A distinctive and desirable feature of inforpower
is its sensitivity to location shifts. Adding a constant
a to the random variable
changes
, reflecting an actual change in signal strength or systematic effect. In contrast, variance, differential entropy
, and informity
are all translation-invariant. For example, in the normal distribution
, the entropy
and informity
depend only on
σ, not on the location
μ. While translation invariance is useful when one wishes to measure pure spread or uncertainty, it is considered as a drawback in applications where it is necessary to take into account the values of the random variable along with their probabilities (or densities) [
9].
Attempts to remedy the translation-invariance problem in related quantities have appeared in the literature. Belis and Guiasu [
10] introduced weighted entropy:
More recently, several authors [
9,
11,
12] defined extropy for continuous distributions as
and proposed a weighted extropy (restricted to nonnegative random variables)
Although weighted extropy is formally −½ times informity, the two measures arise from fundamentally different conceptual foundations. Extropy was originally motivated as a “complementary dual” of entropy, a claim that has been critiqued on both theoretical and interpretative grounds [
4]. Consequently, weighted extropy inherits these conceptual difficulties, whereas inforpower—defined directly as the expected effective information
—possesses clear probabilistic, informational, and physical interpretations (
Section 3 and
Section 4) without requiring an intermediate appeal to extropy.
Inforpower
and the information-energy center
are both robust statistics. They exist even when ordinary moments fail: for the Cauchy distribution, the mean and variance are undefined, but
and
remain well defined, and
equals the location parameter times
. For right-skewed distributions on [0, ∞), empirical evidence (
Section 4) consistently places the energy center in the order: mode <
< median < mean, highlighting
as an effective signal strength that lies closer to the region of highest probability density.
Computation of
and
requires an explicit PDF. In empirical studies, this is not a significant limitation: simply fit candidate distributions to the observed data (using maximum likelihood estimation or other estimation methods) and then evaluate
on the fitted models. The maximum inforpower criterion (
Section 5) thereby provides a simple model-selection rule that complements or even outperforms traditional tools (such as AIC). In addition to parametric approaches, non-parametric approaches such as kernel density estimation are possible but may introduce sensitivity to bandwidth selection.
When comparing symmetric distributions with the same estimated location
(e.g., normal, Laplace, logistic, and Student’s
t distributions), the maximum inforpower criterion reduces to the maximum informity criterion. In this sense, the maximum informity criterion can be considered a special case of the maximum inforpower criterion. The maximum informity criterion (and the maximum inforpower criterion) can be used in measurement uncertainty analysis. For example, it has been used to select the best distribution from five candidate distributions (uniform, triangular, quadratic, raised cosine, and half-cosine distributions) to describe the calibration error of a measuring instrument [
2].
The two examples presented represent two key scenarios: (i) recovery of a known ground-truth distribution (synthetic data) and (ii) discrimination among plausible but closely competing models in a real-world heavy-tailed dataset. They demonstrate the effectiveness of the maximum inforpower criterion in both controlled and practical settings. The synthetic Weibull distribution sample (
Section 5, Example 1) demonstrates correct identification of the true underlying distribution among competing candidates, with the inforpower metric outperforming or matching existing metrics (AIC, entropy, informity). The real-world case of Tana River annual maximum streamflow (
Section 5, Example 2) demonstrates the practical value of the method in hydrological extreme value modeling, where the inforpower metric exhibits higher sensitivity than the AIC when distinguishing nearly tied models (lognormal distribution versus Weibull distribution).
In summary, inforpower constitutes a principled, robust, and effective measure of informational power that naturally integrates signal strength and noise level. Unlike the traditional uncertainty measures such as variance and entropy, inforpower ϕ is sensitive to location shifts, exhibits scale invariance for non-negative distributions, and is well defined even when moments do not exist. The maximum inforpower criterion is easy to implement and provides a valuable new tool for distribution selection and performance assessment. Although current work primarily focuses on unimodal continuous distributions, inforpower and information-energy center can be easily extended to mixed distributions simply by performing calculations on the composite probability density function. Future research should explore these extensions, their behavior in multivariate settings, finite sample properties, potential bias correction, and their applications in machine learning, finance, and measurement science.