
Tennis Game Dynamic Prediction Model Based on Players’ Momentum


Abstract
1. Introduction
2. Data and Methods
2.1. Data Collection
2.2. Methods
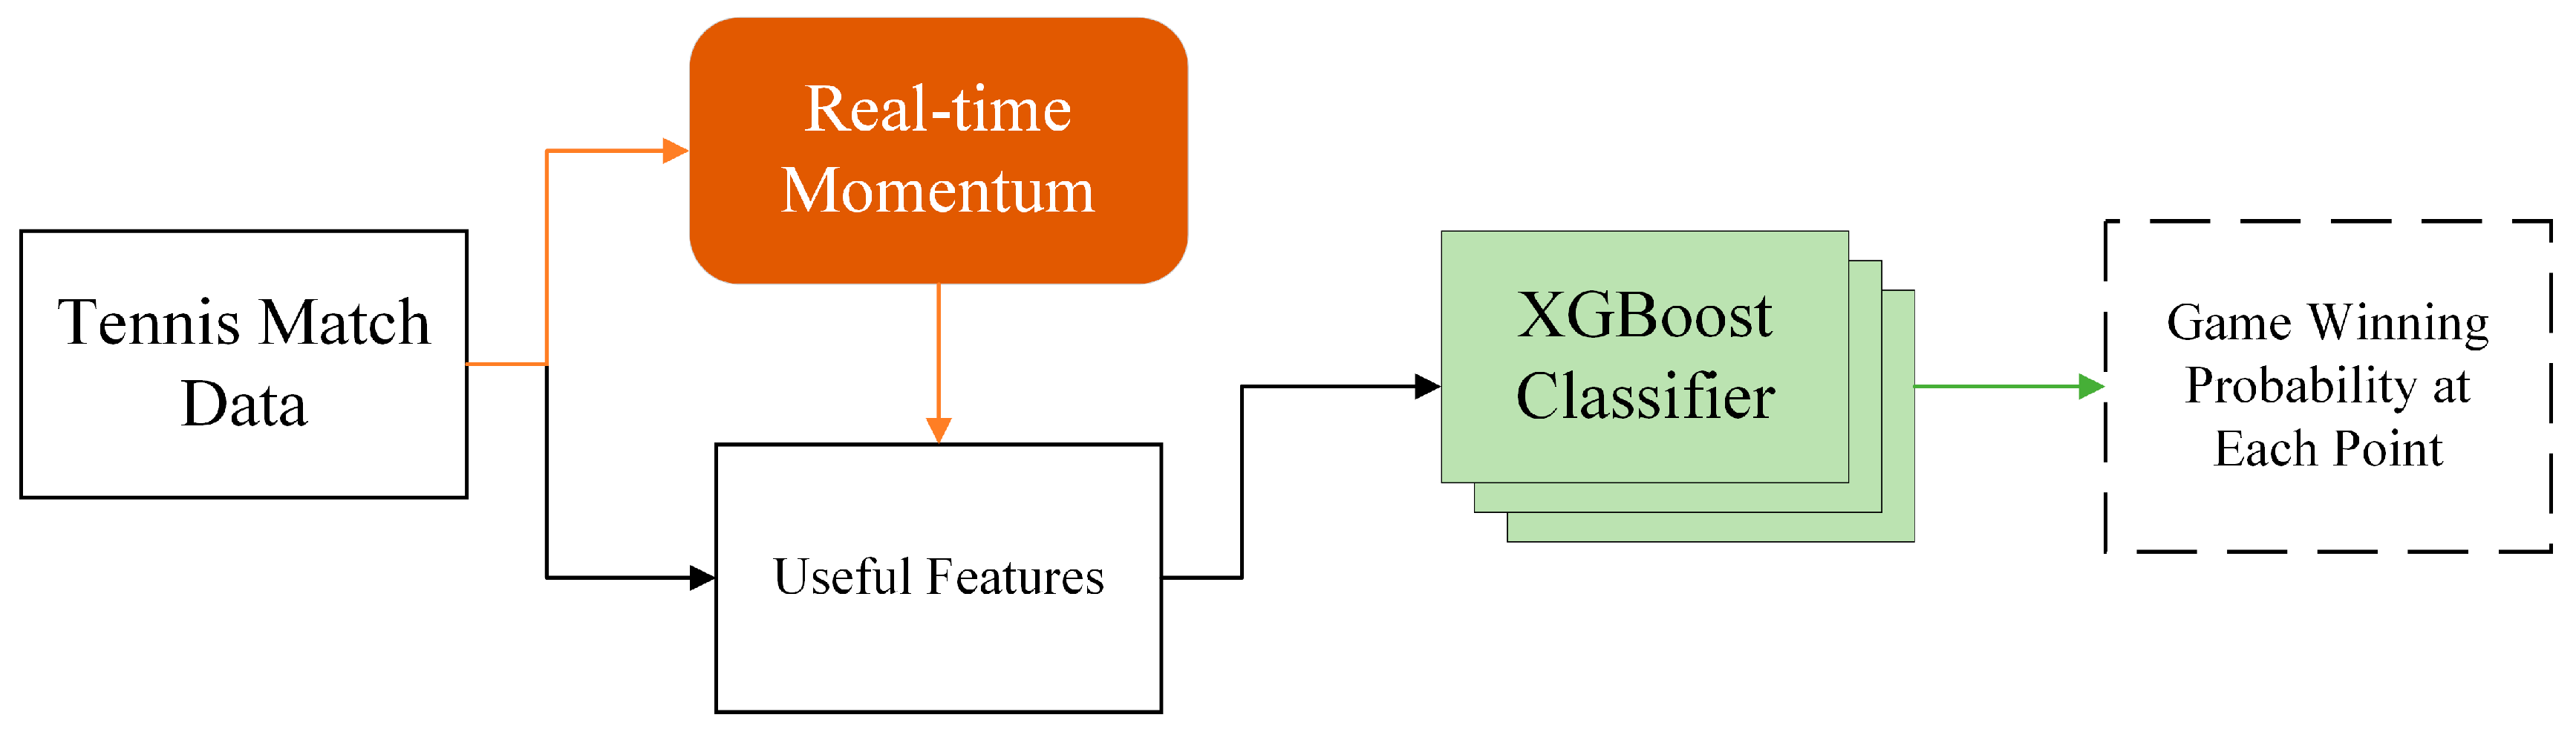
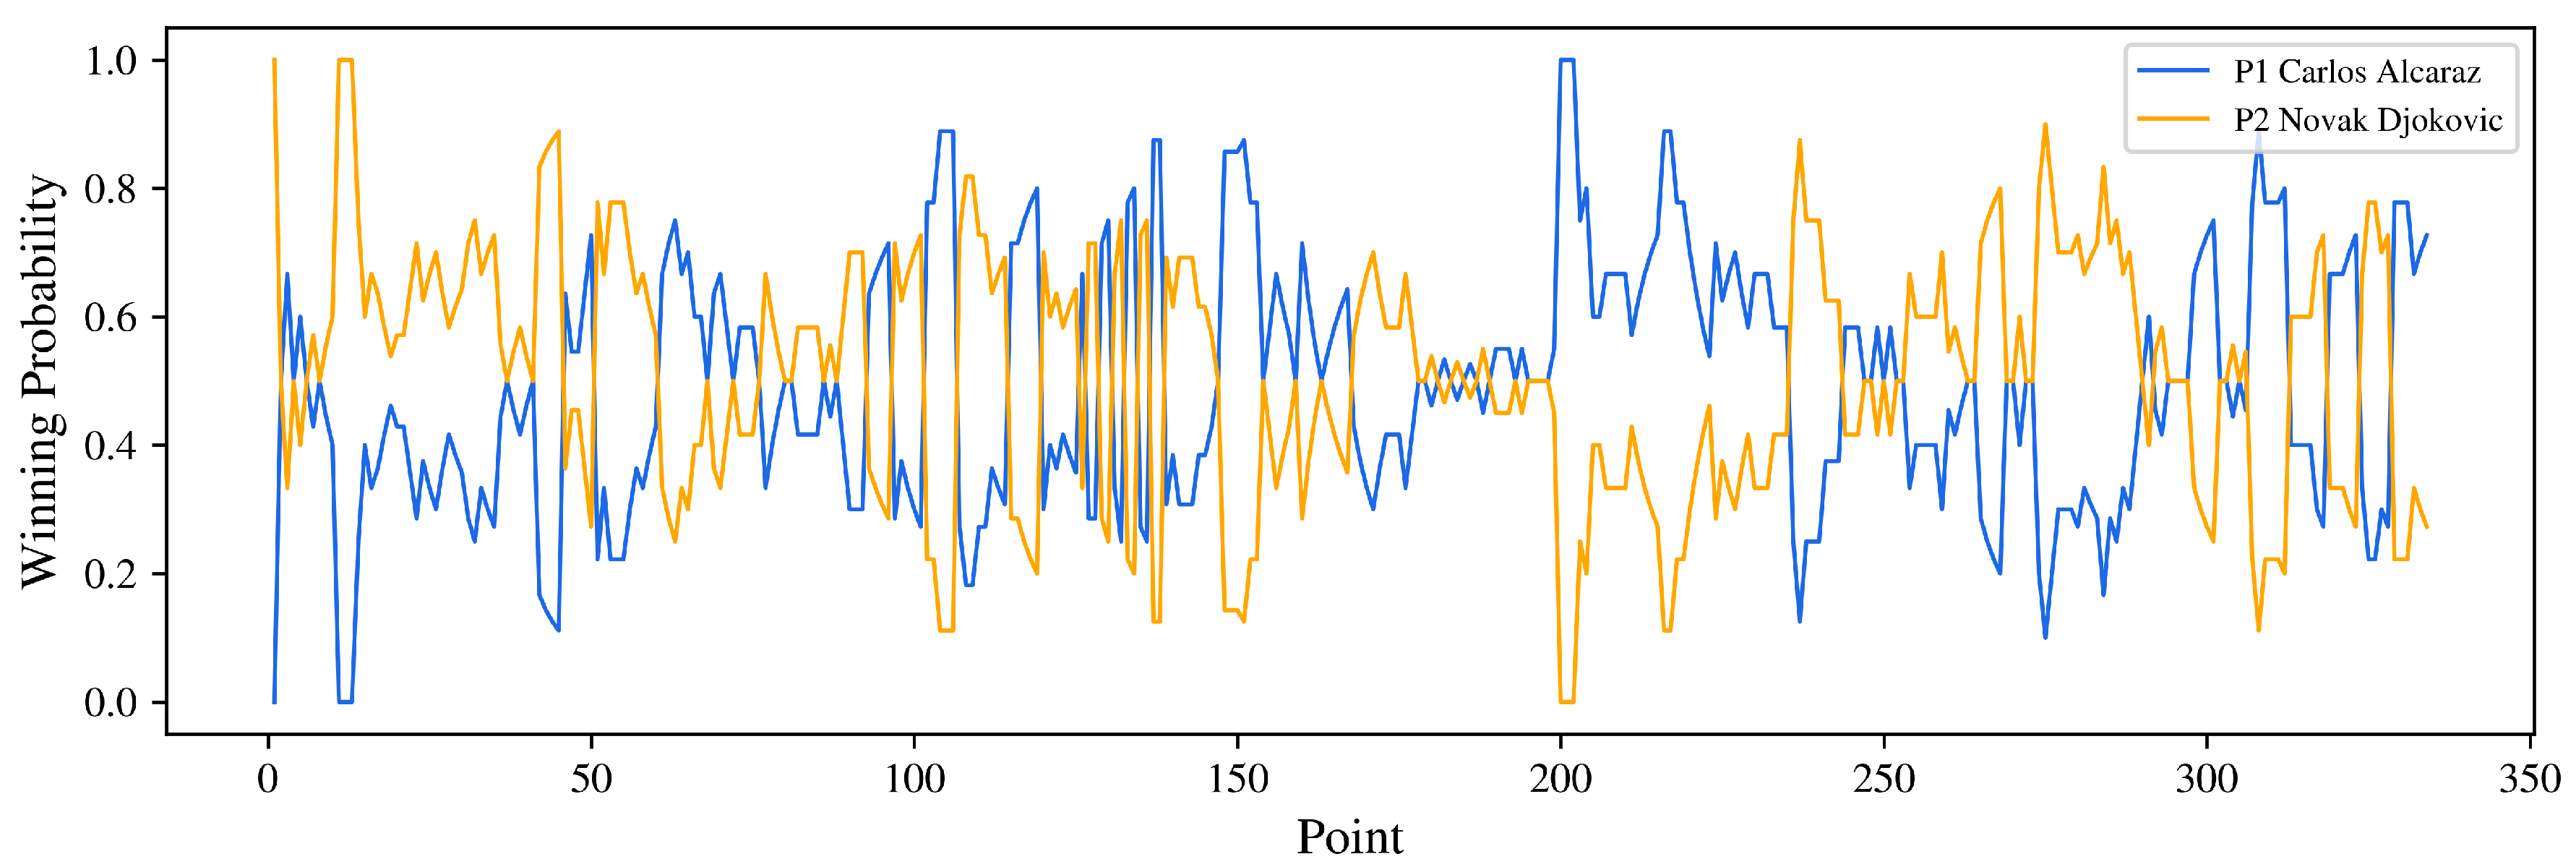
2.2.1. Real-Time Winning Probability
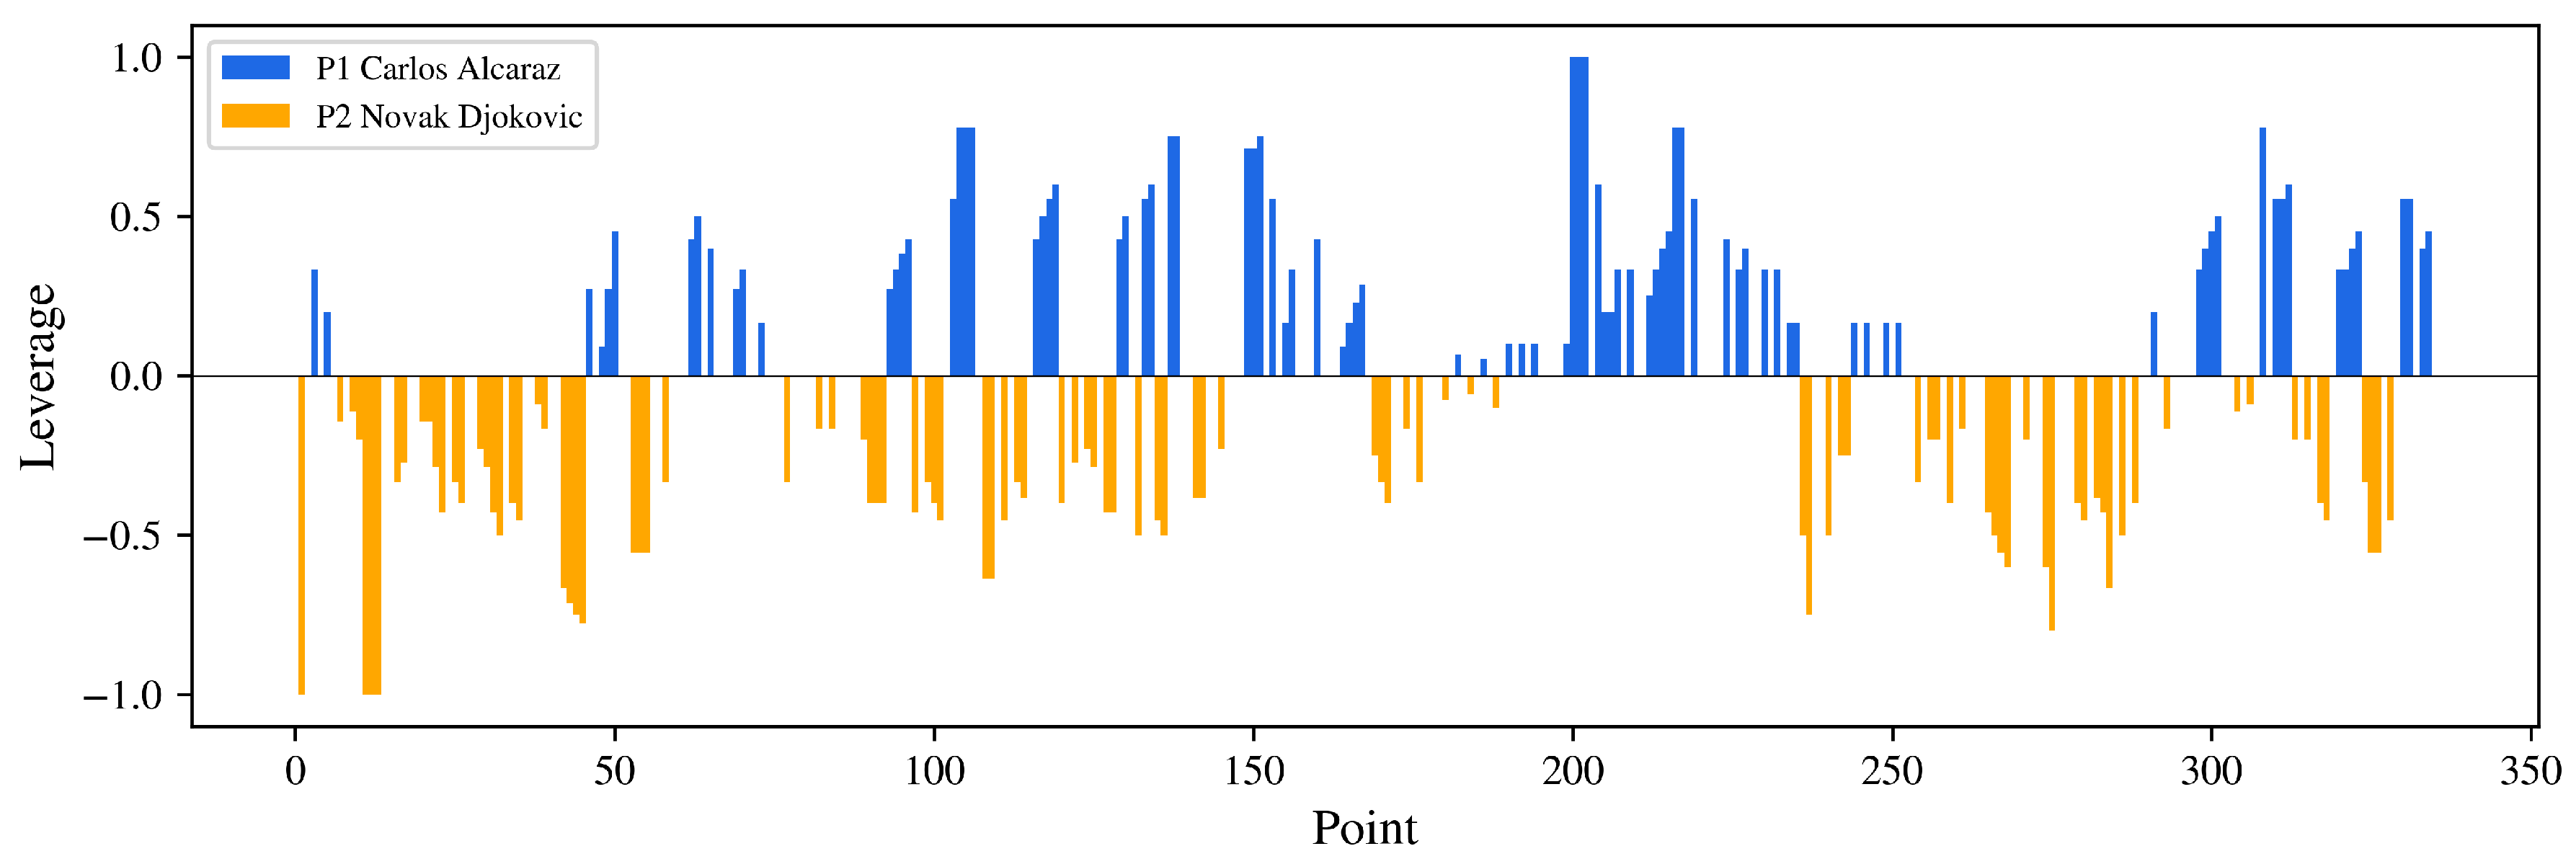
2.2.2. Leverage Based on Counterfactual Prediction Framework
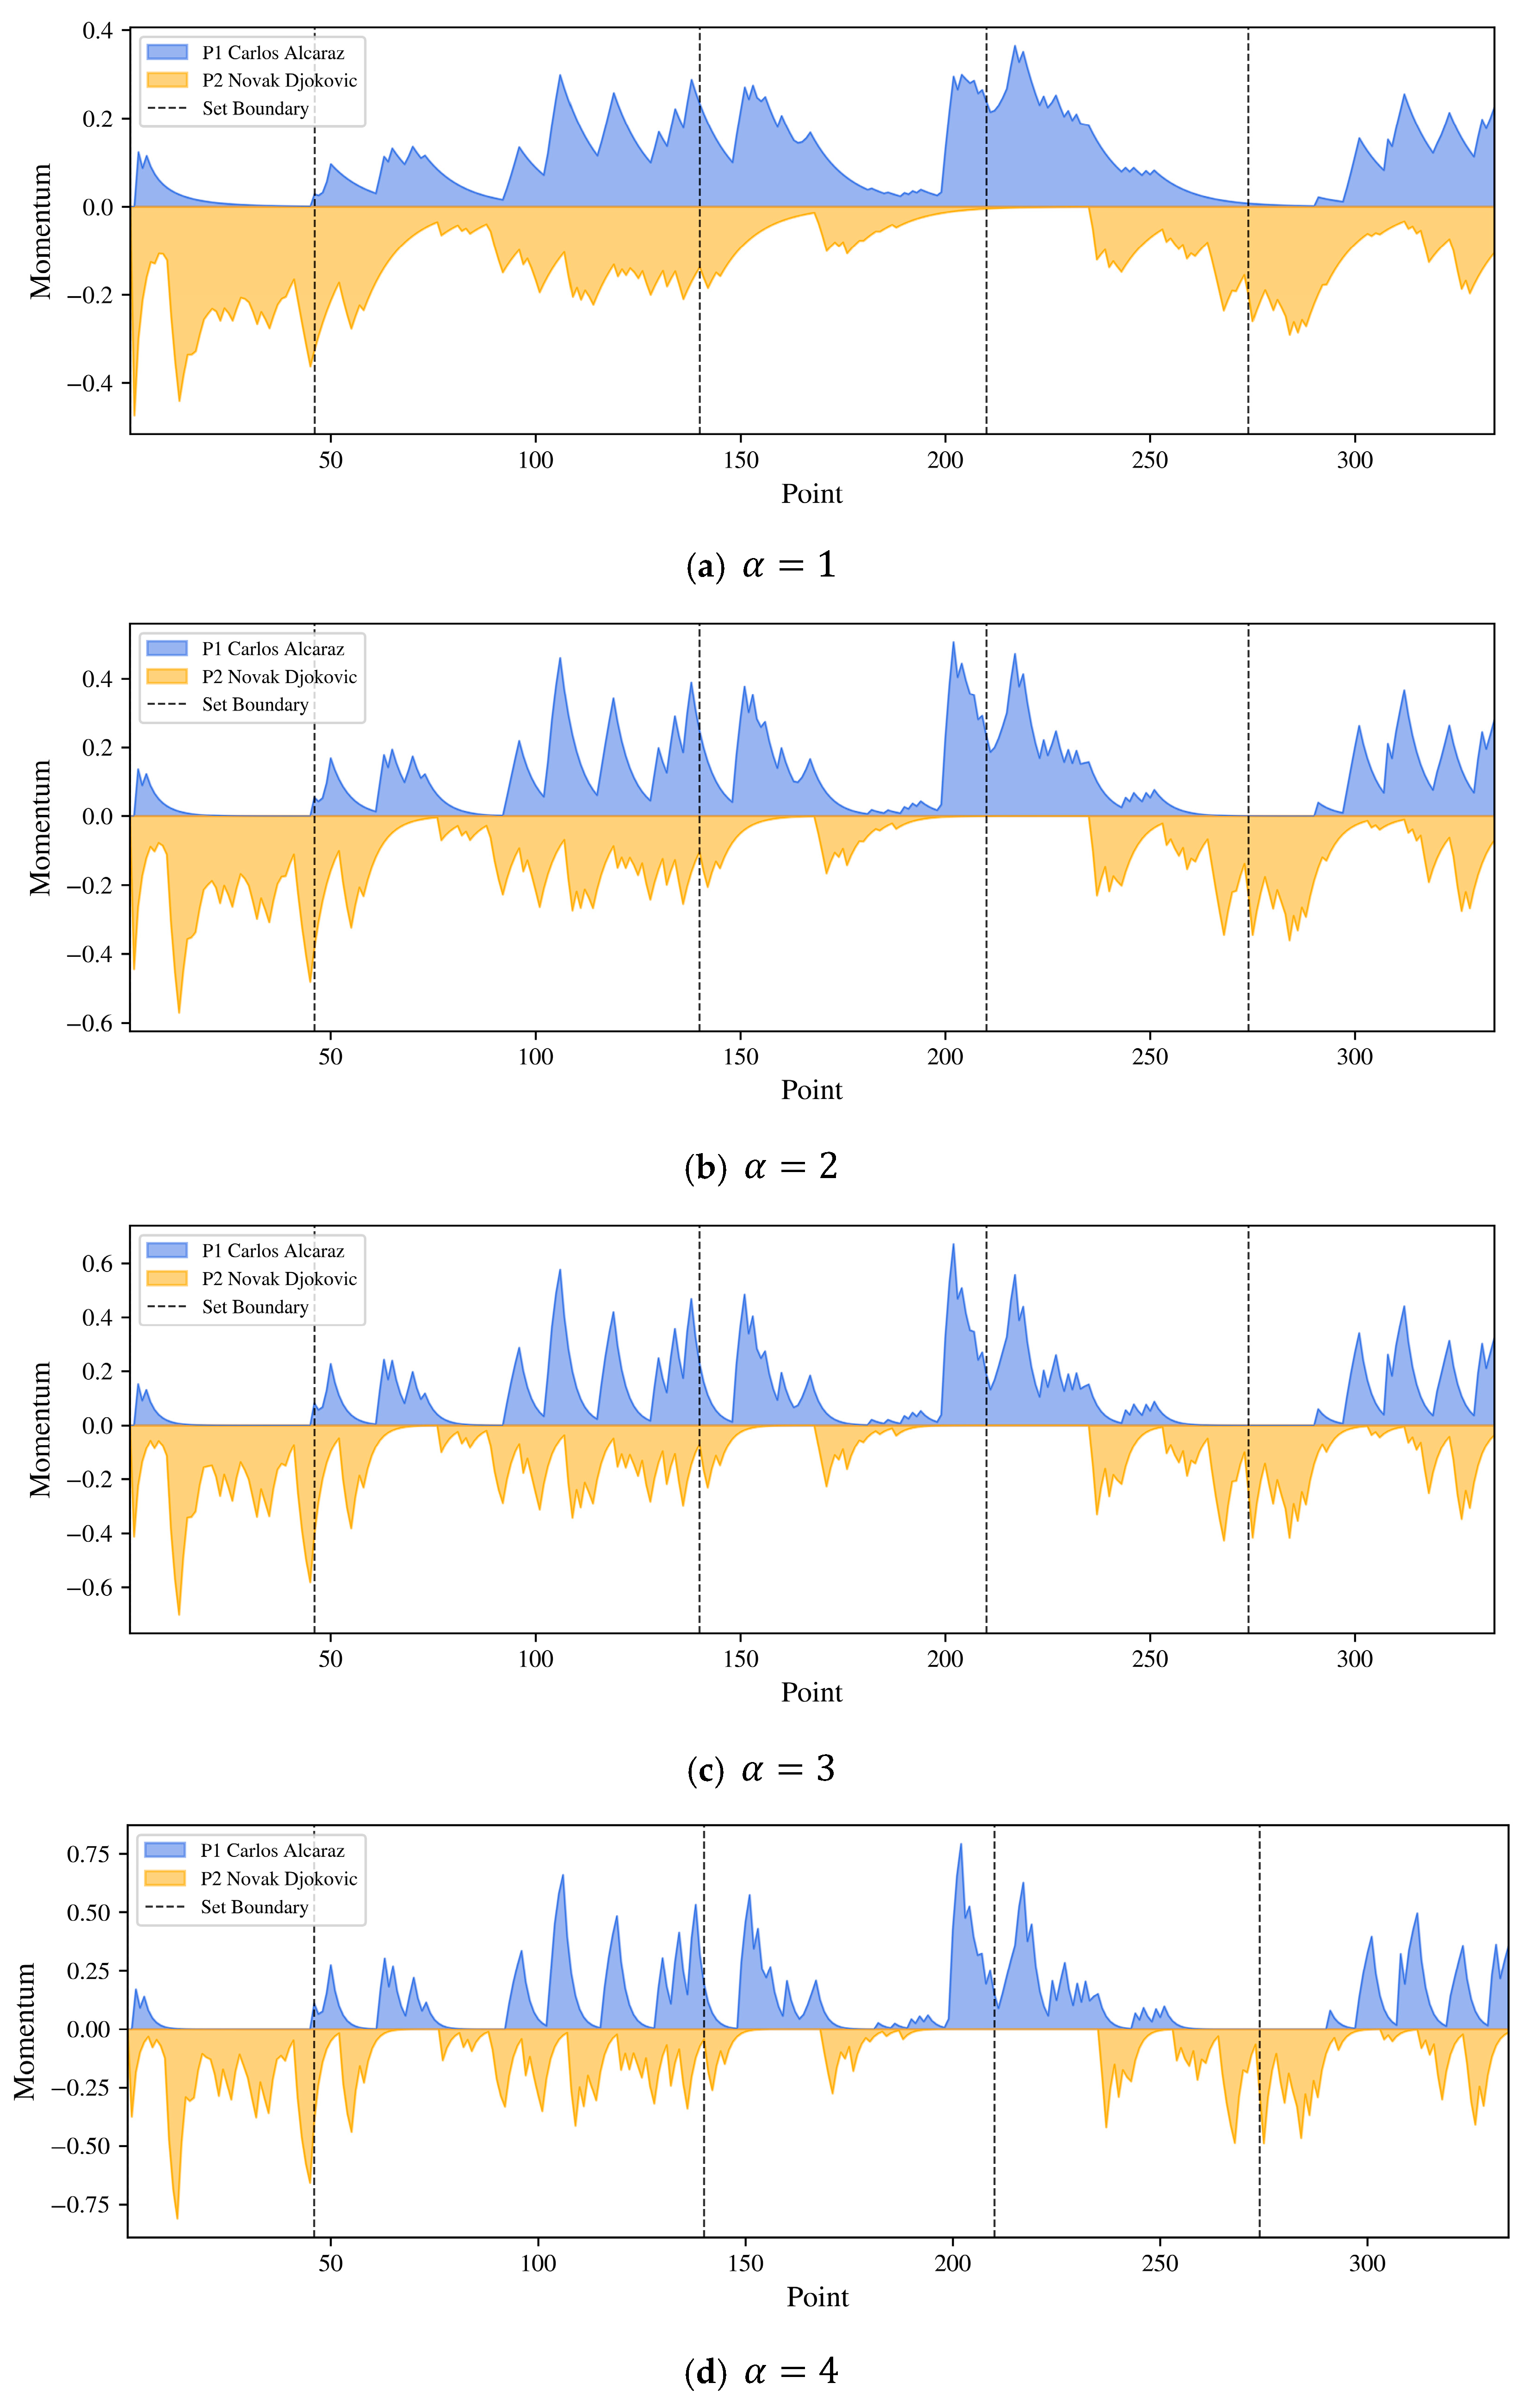
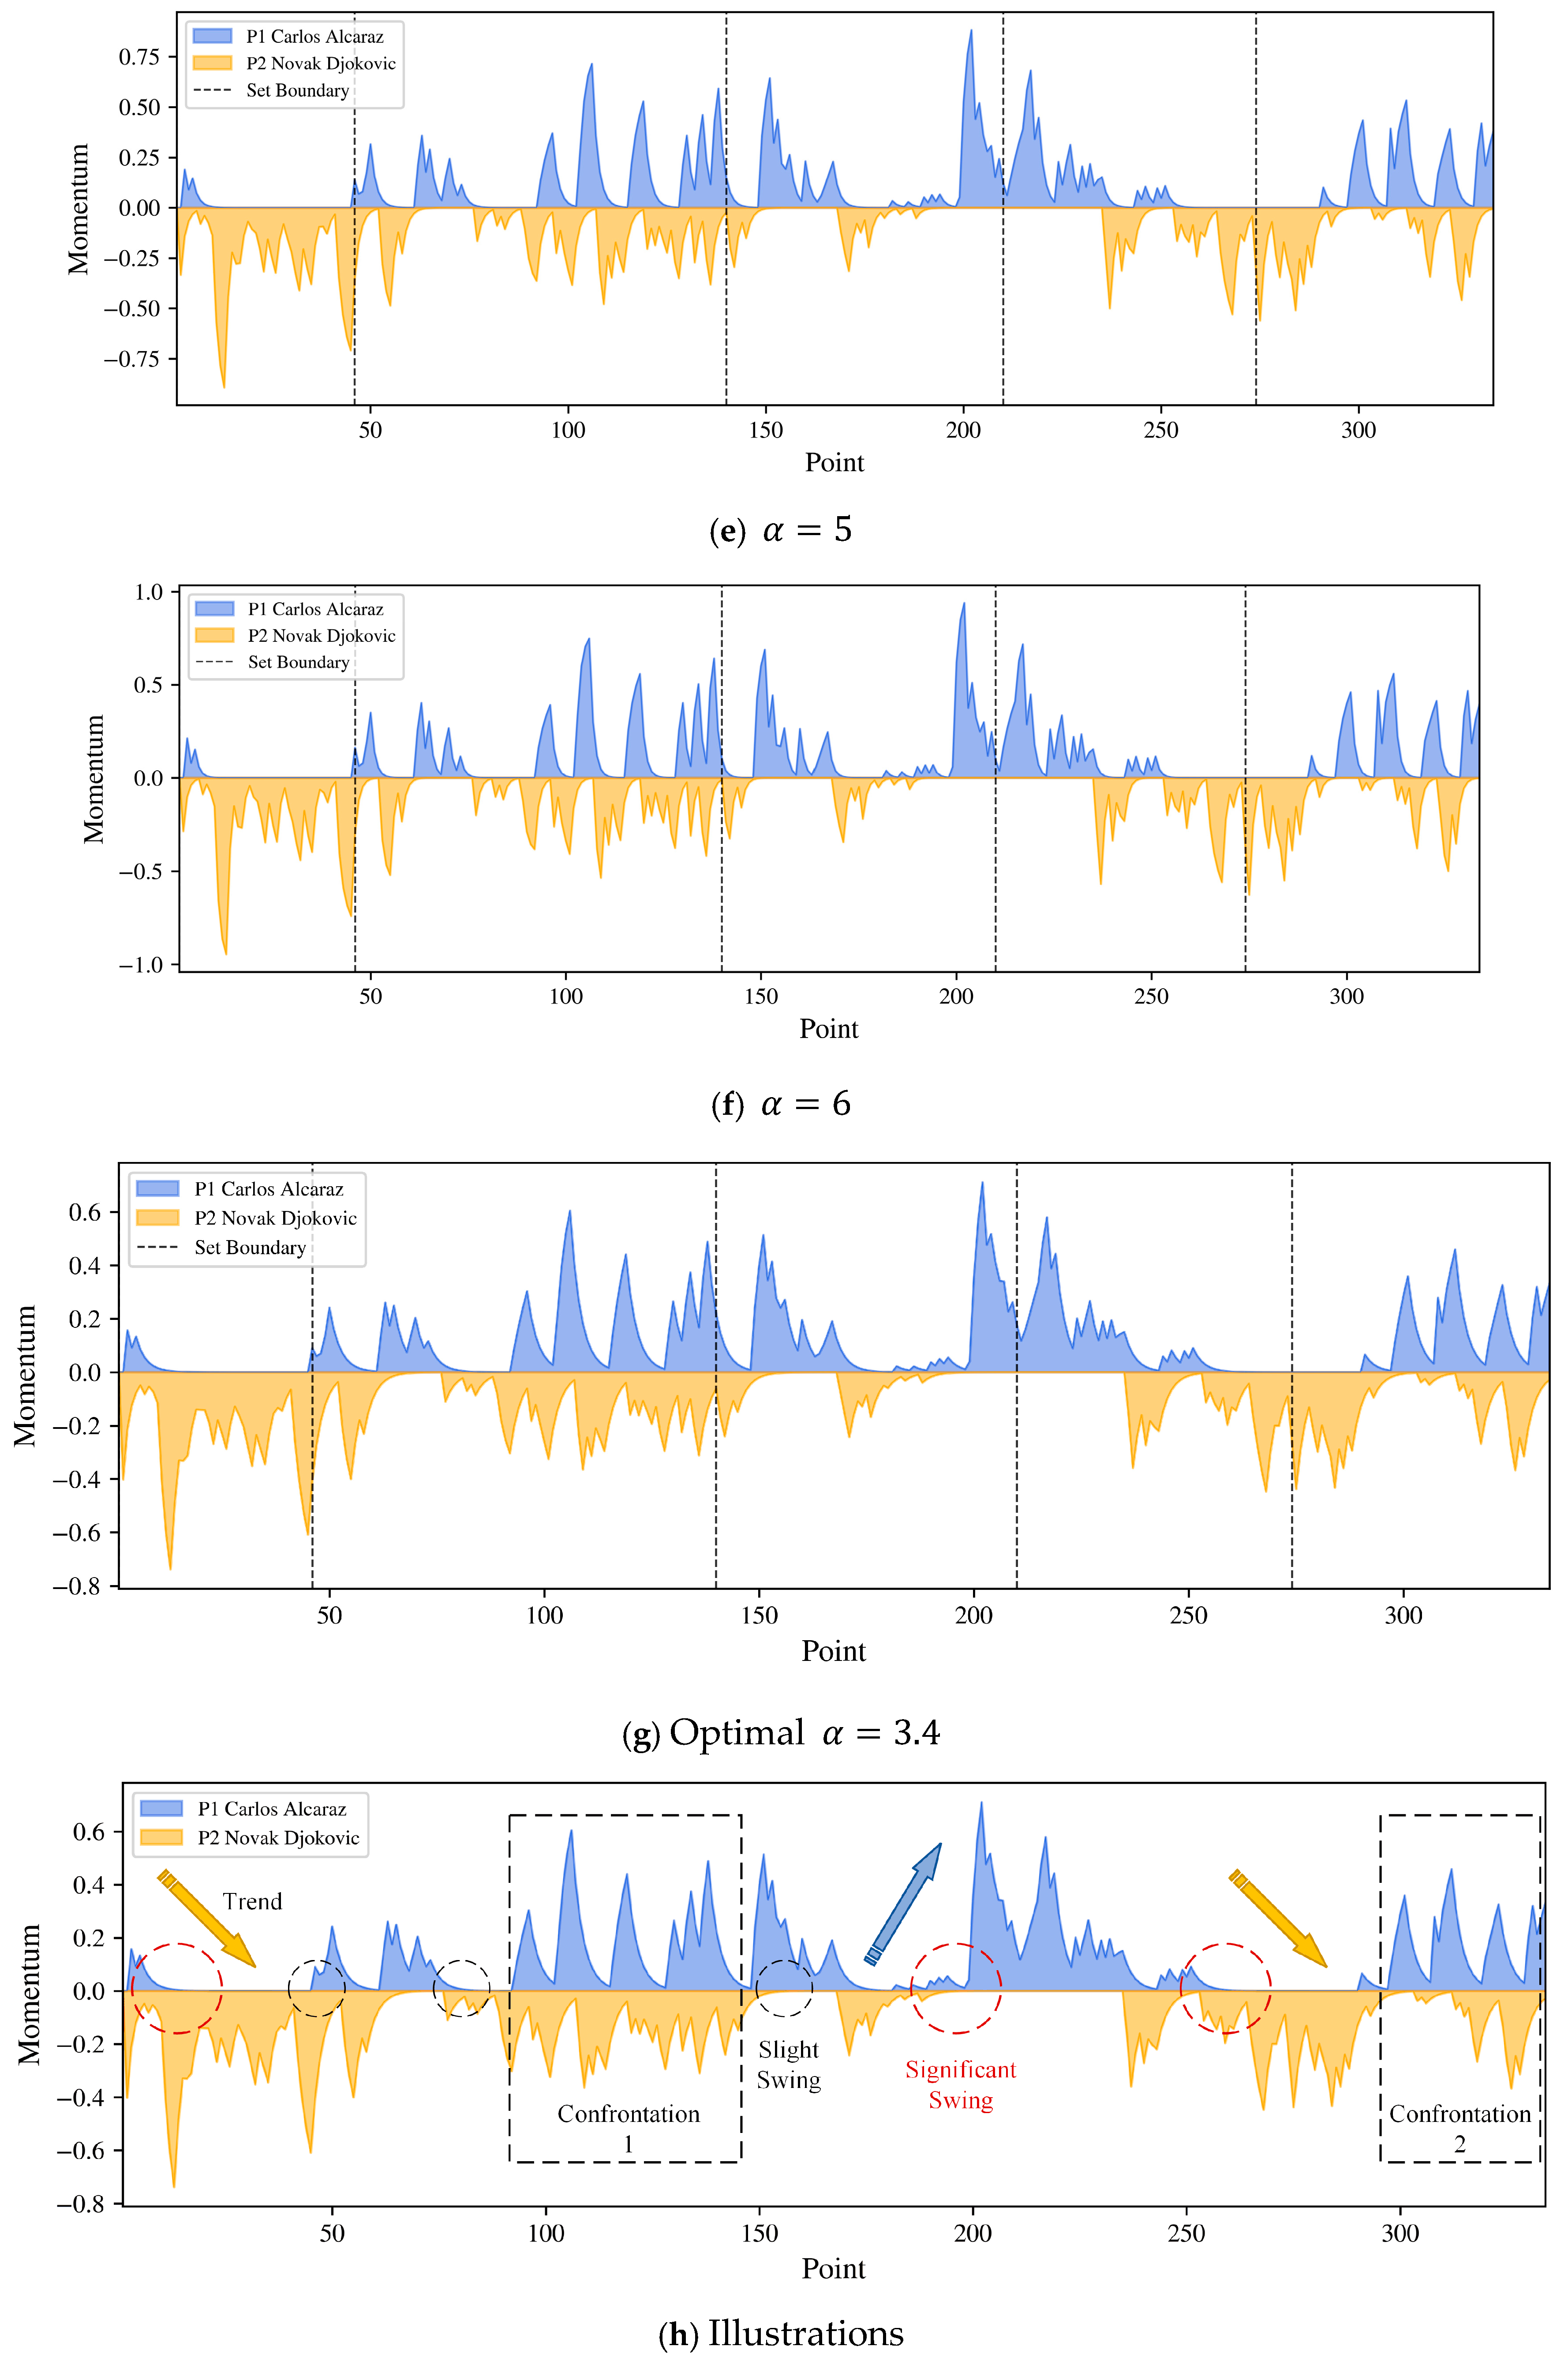
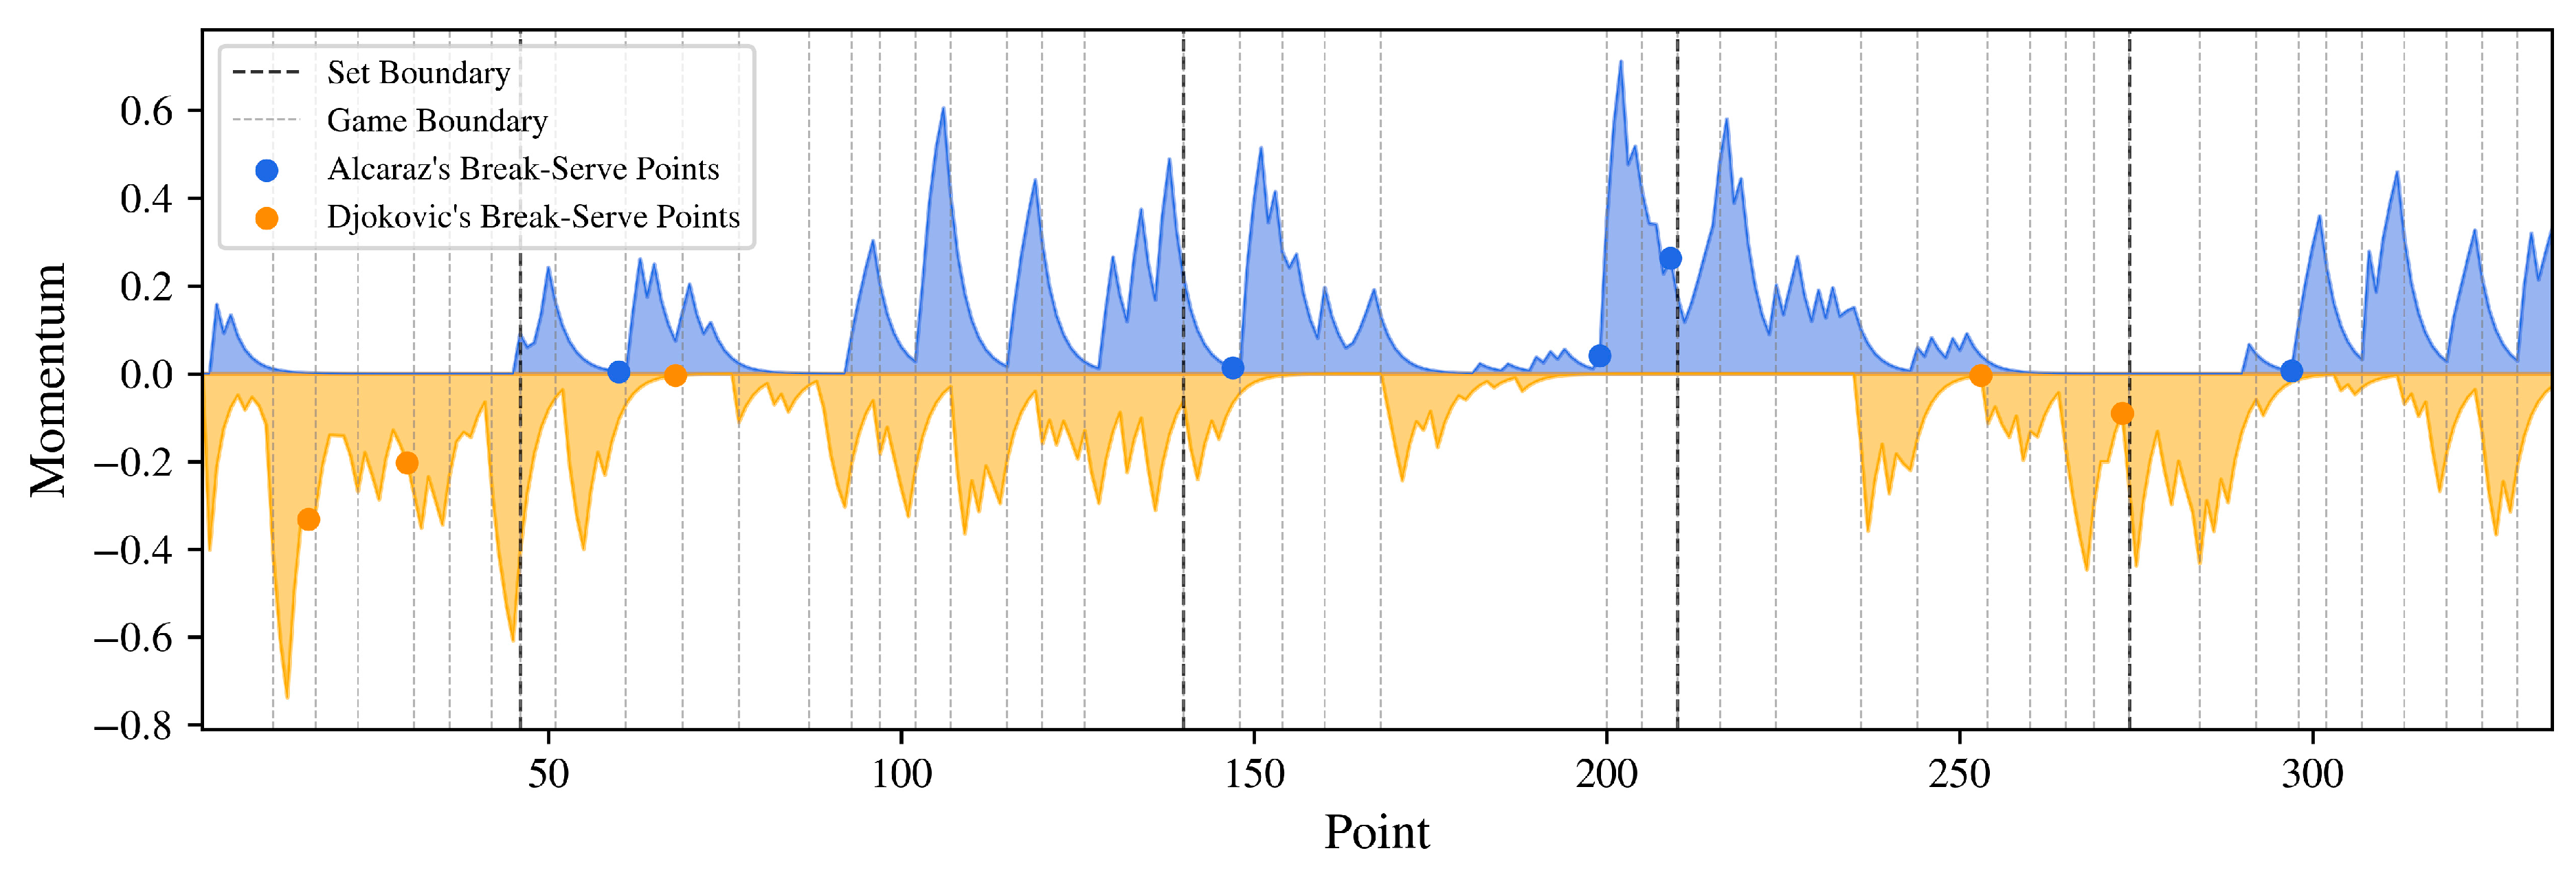
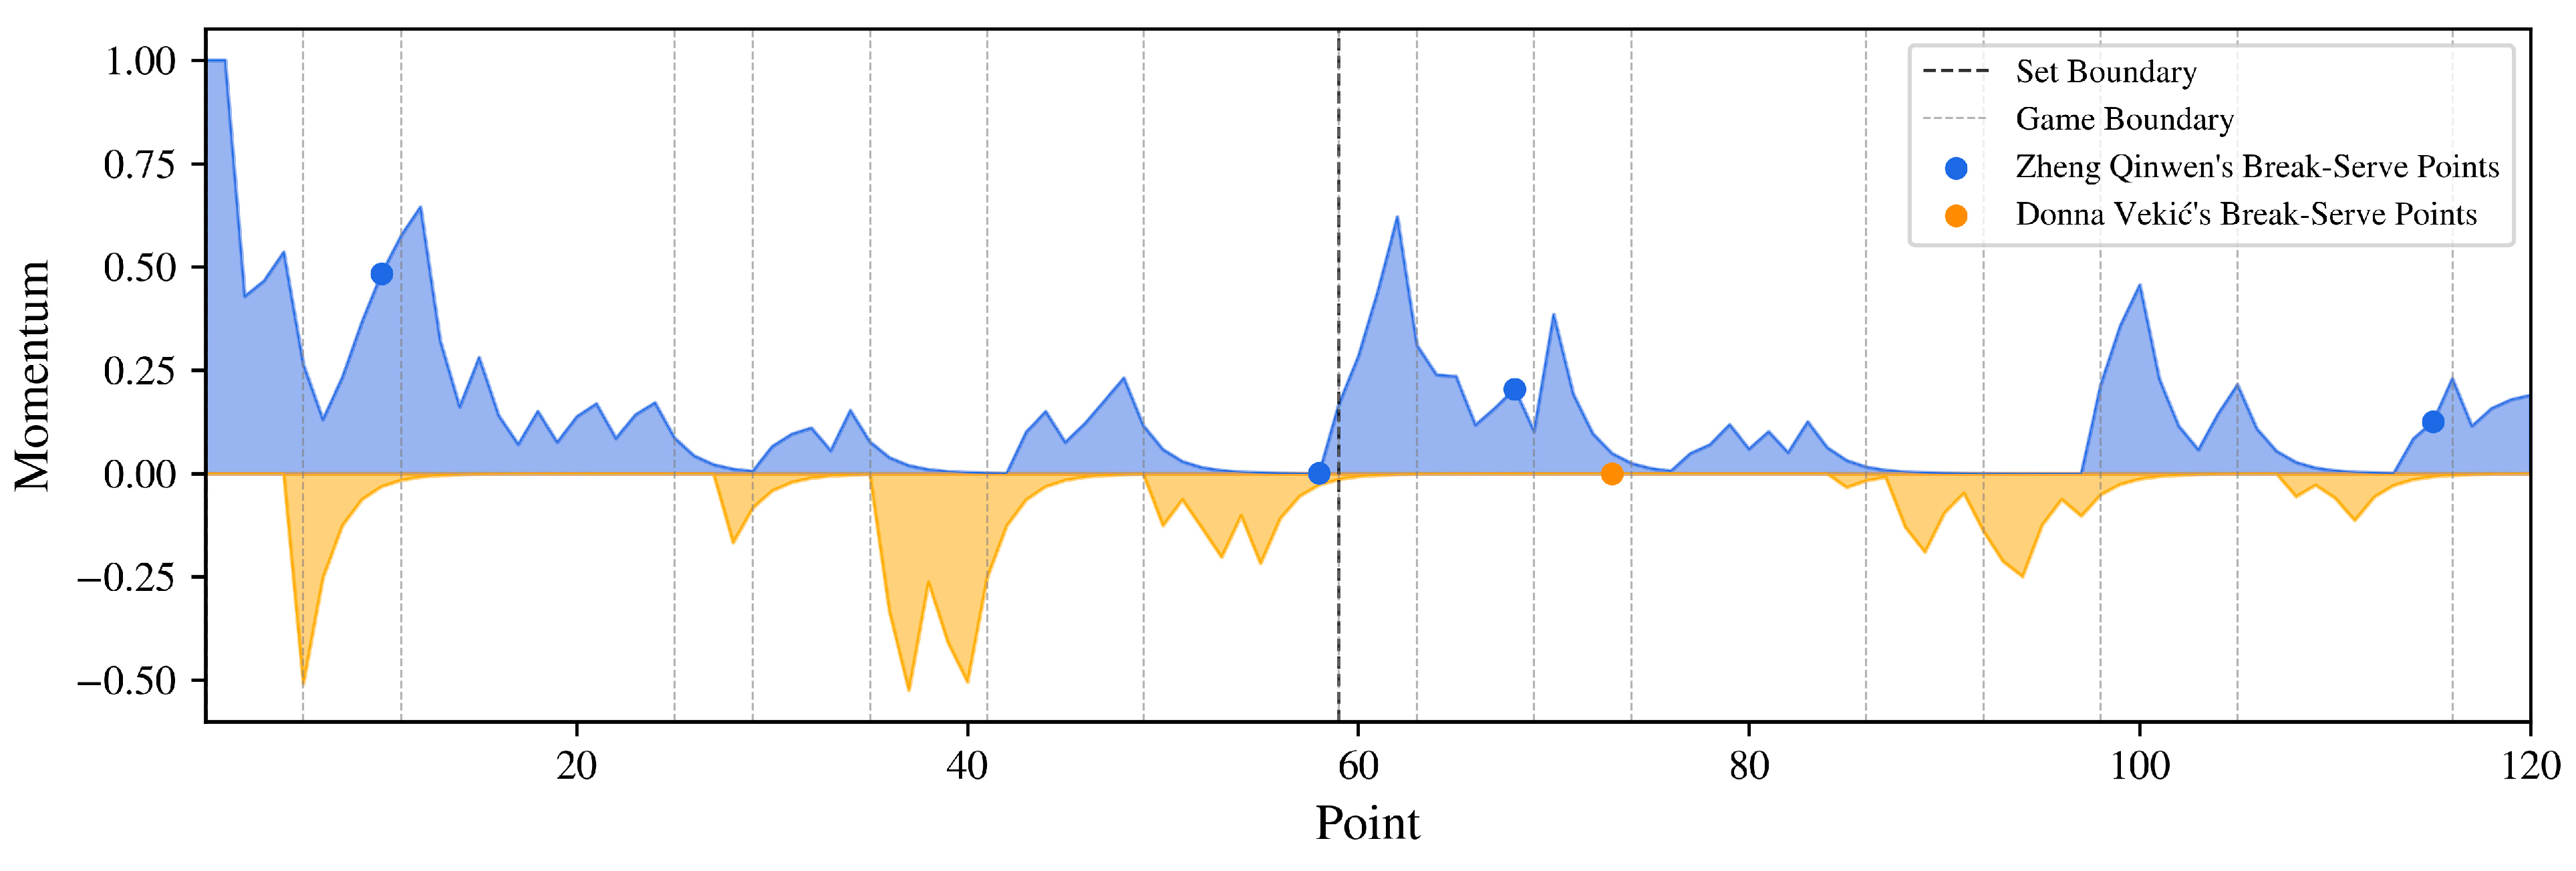
2.2.3. Momentum and Visualization
3. Momentum Quantification Results
3.1. Wimbledon 2023 Final
3.2. 2024 Paris Olympics Tennis Women’s Single
4. Game Winner Prediction
4.1. Model Training
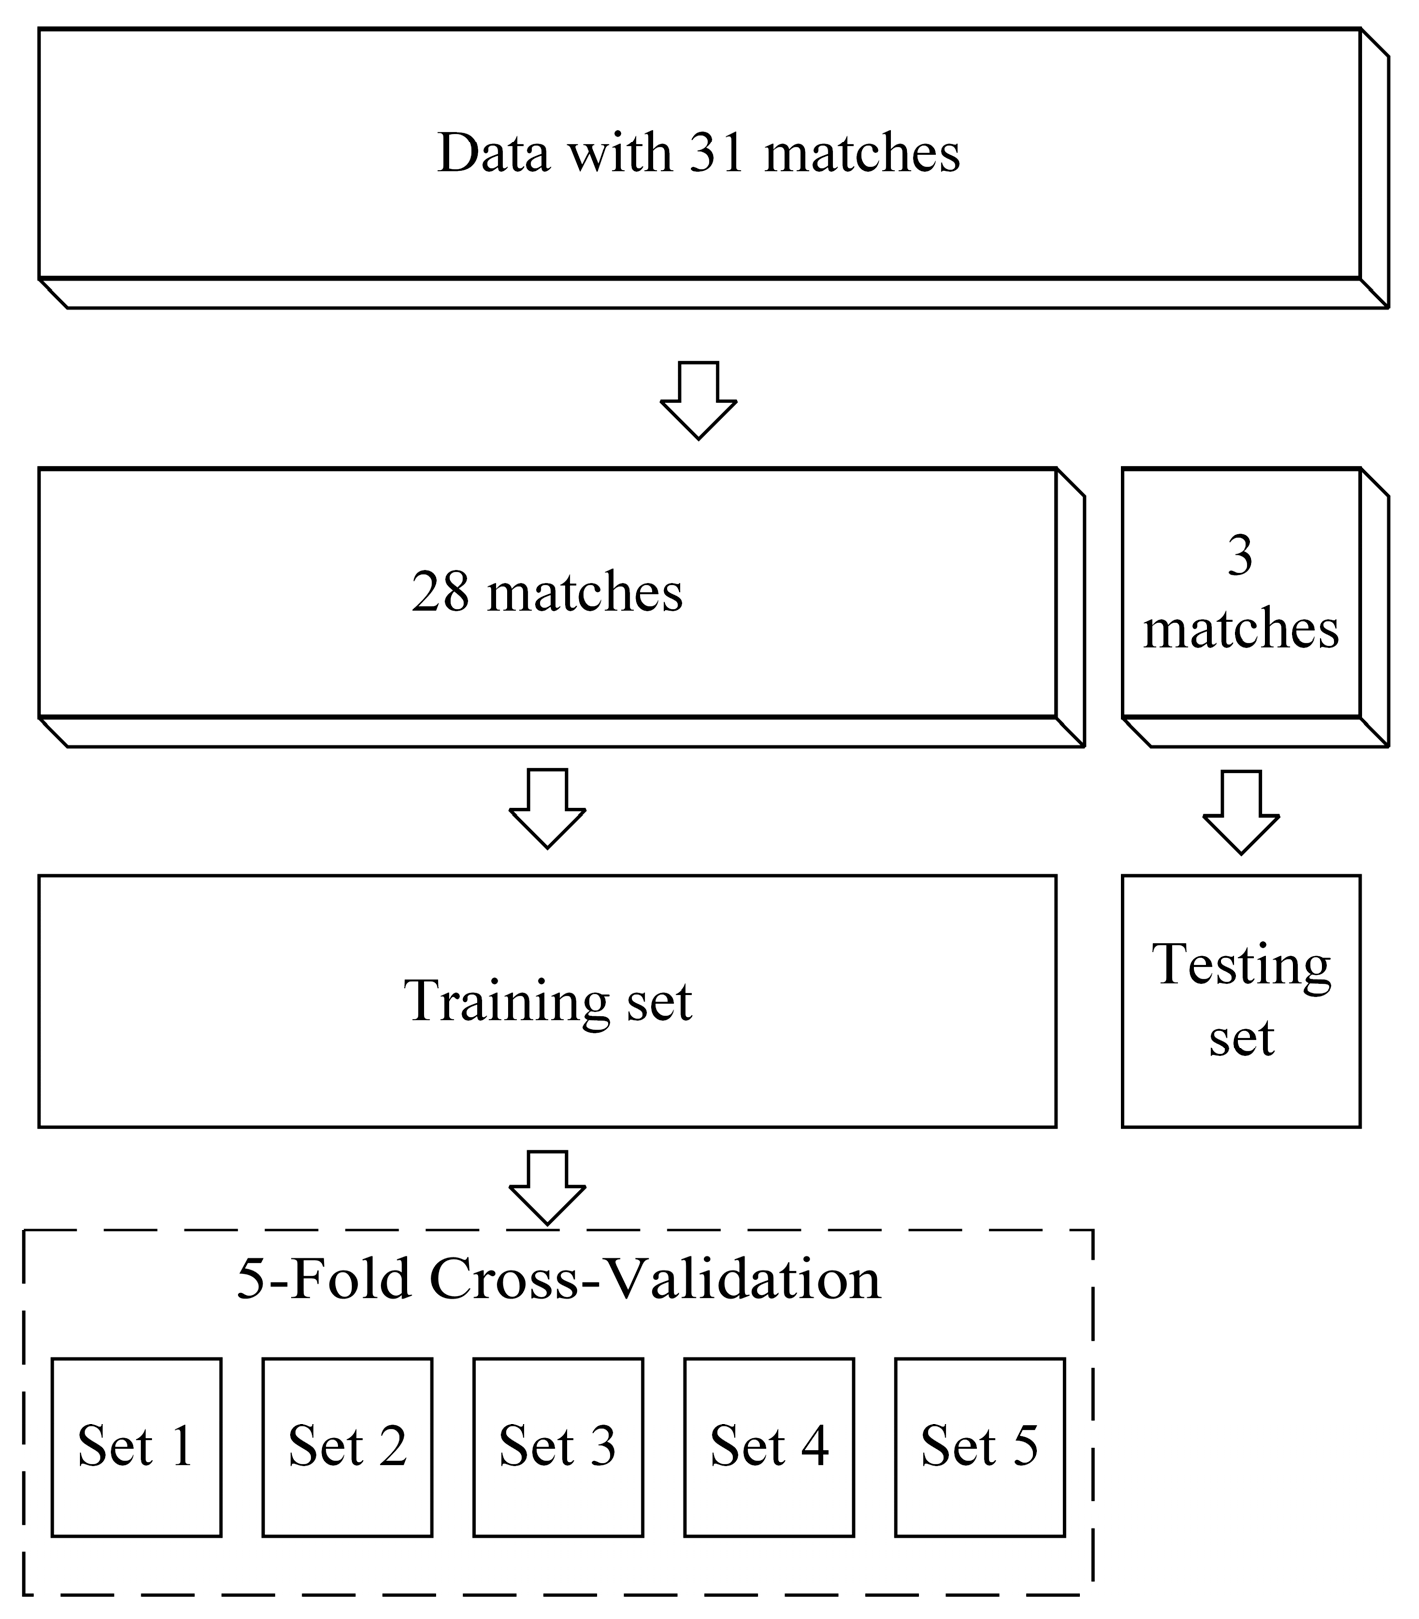
4.1.1. Training and Testing Set Splitting
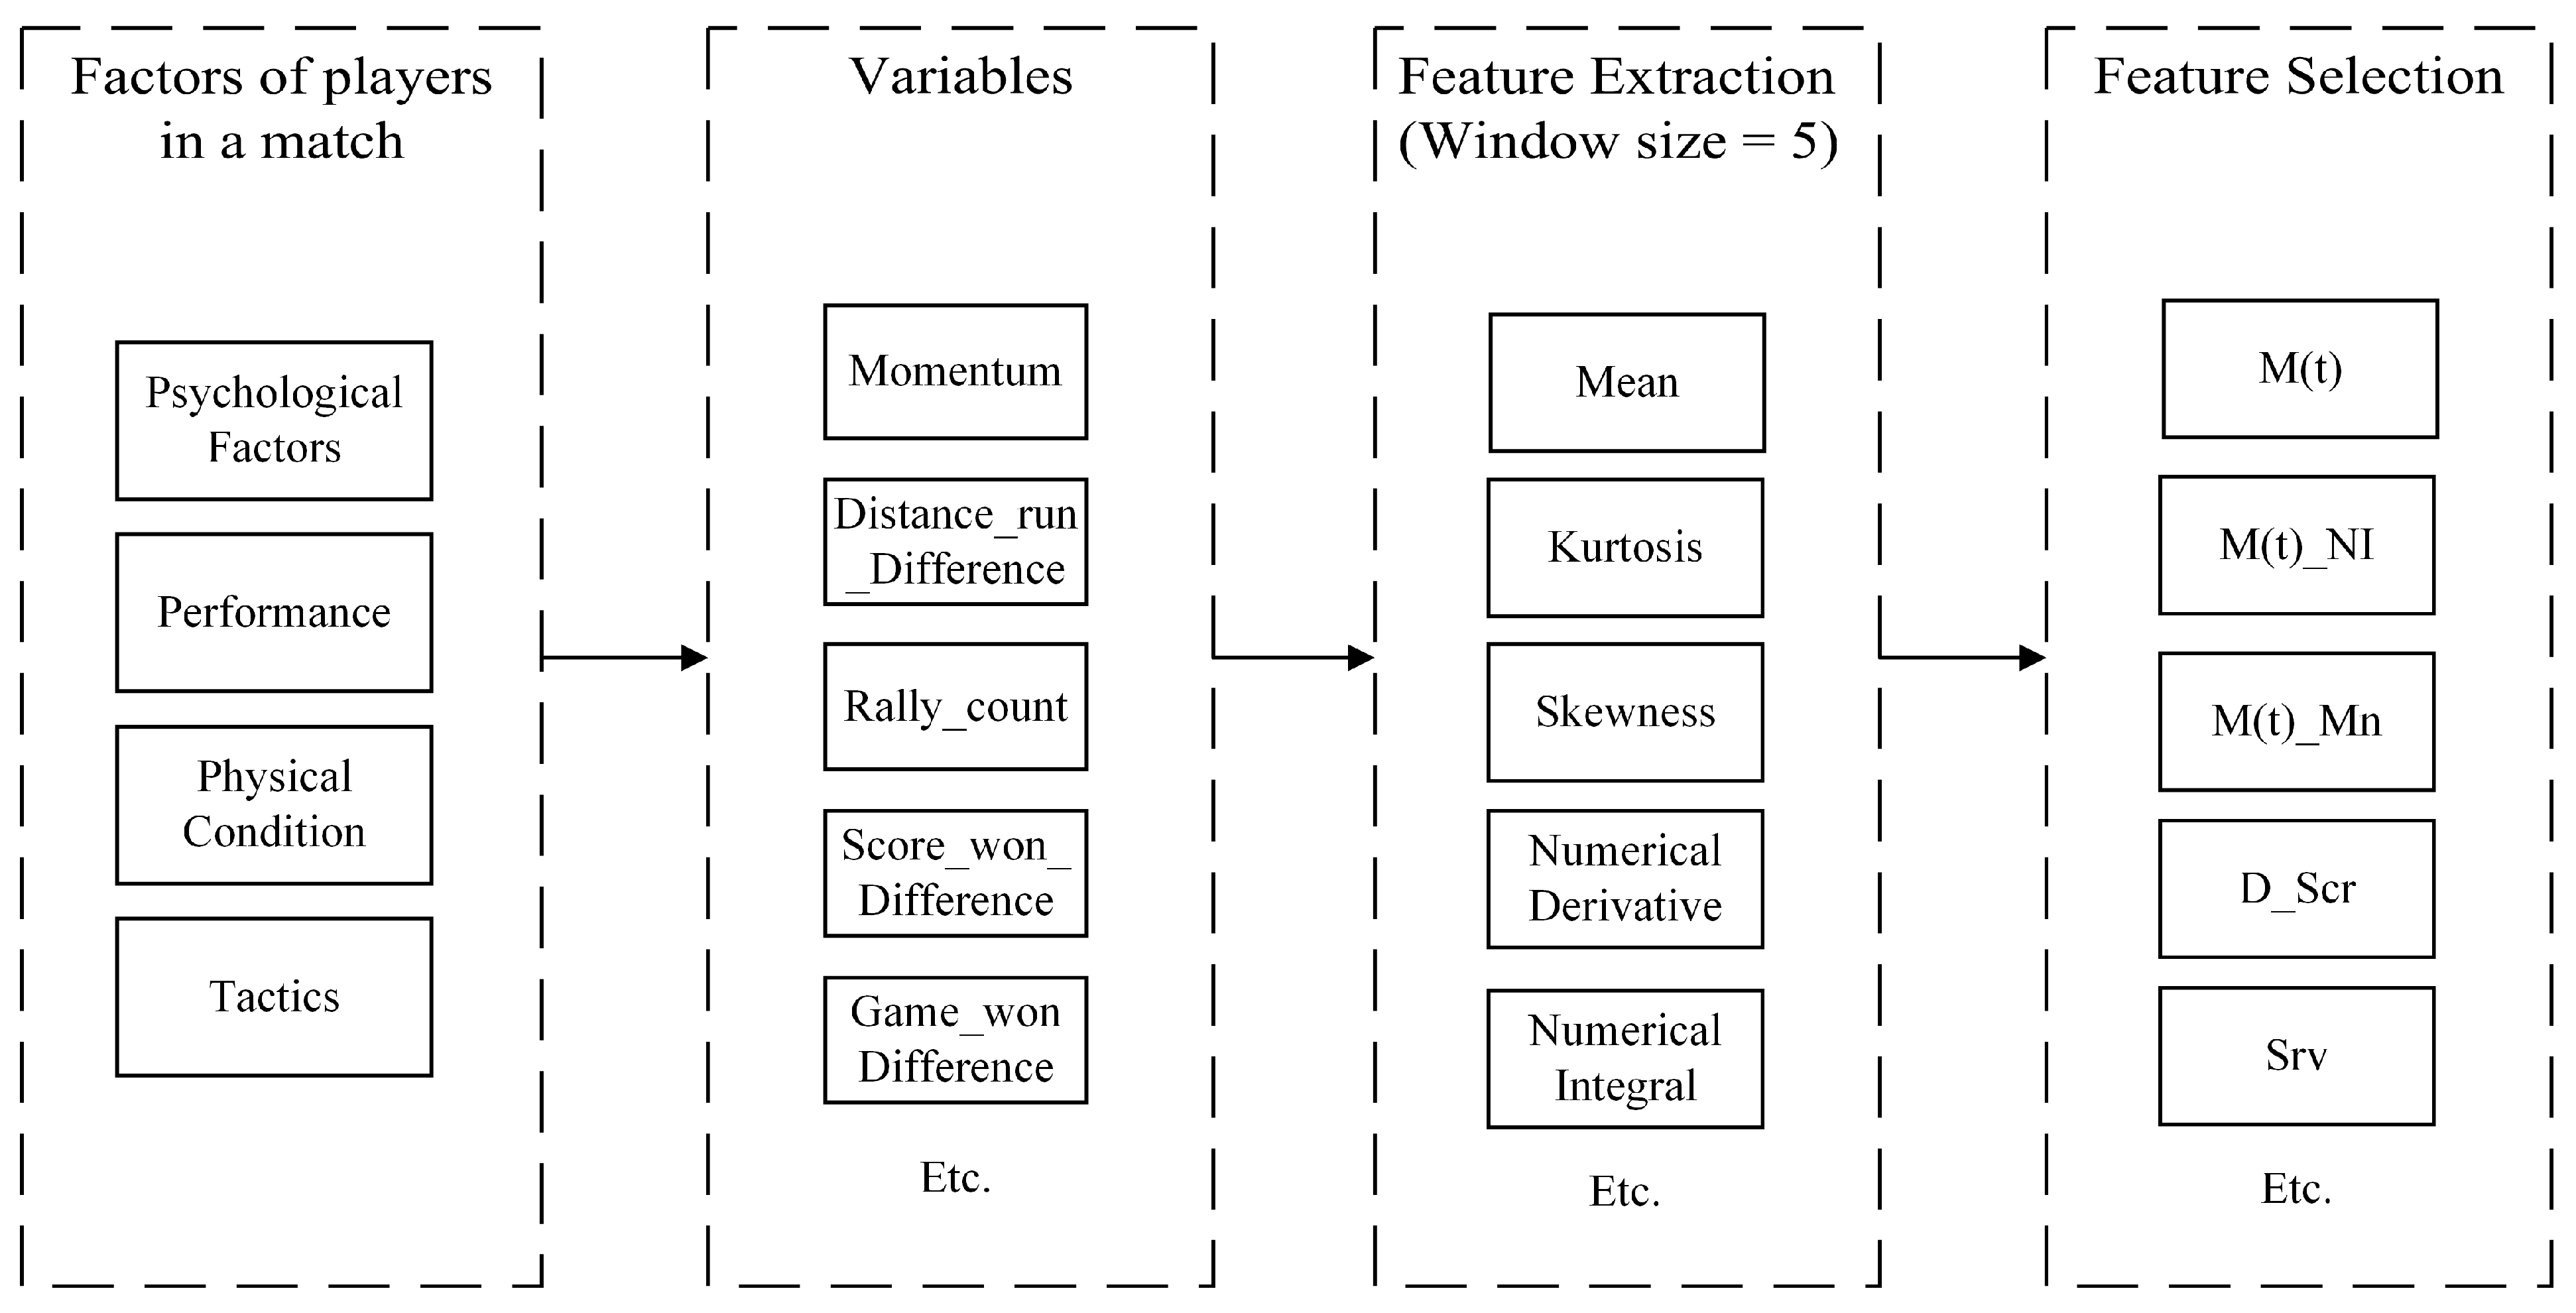
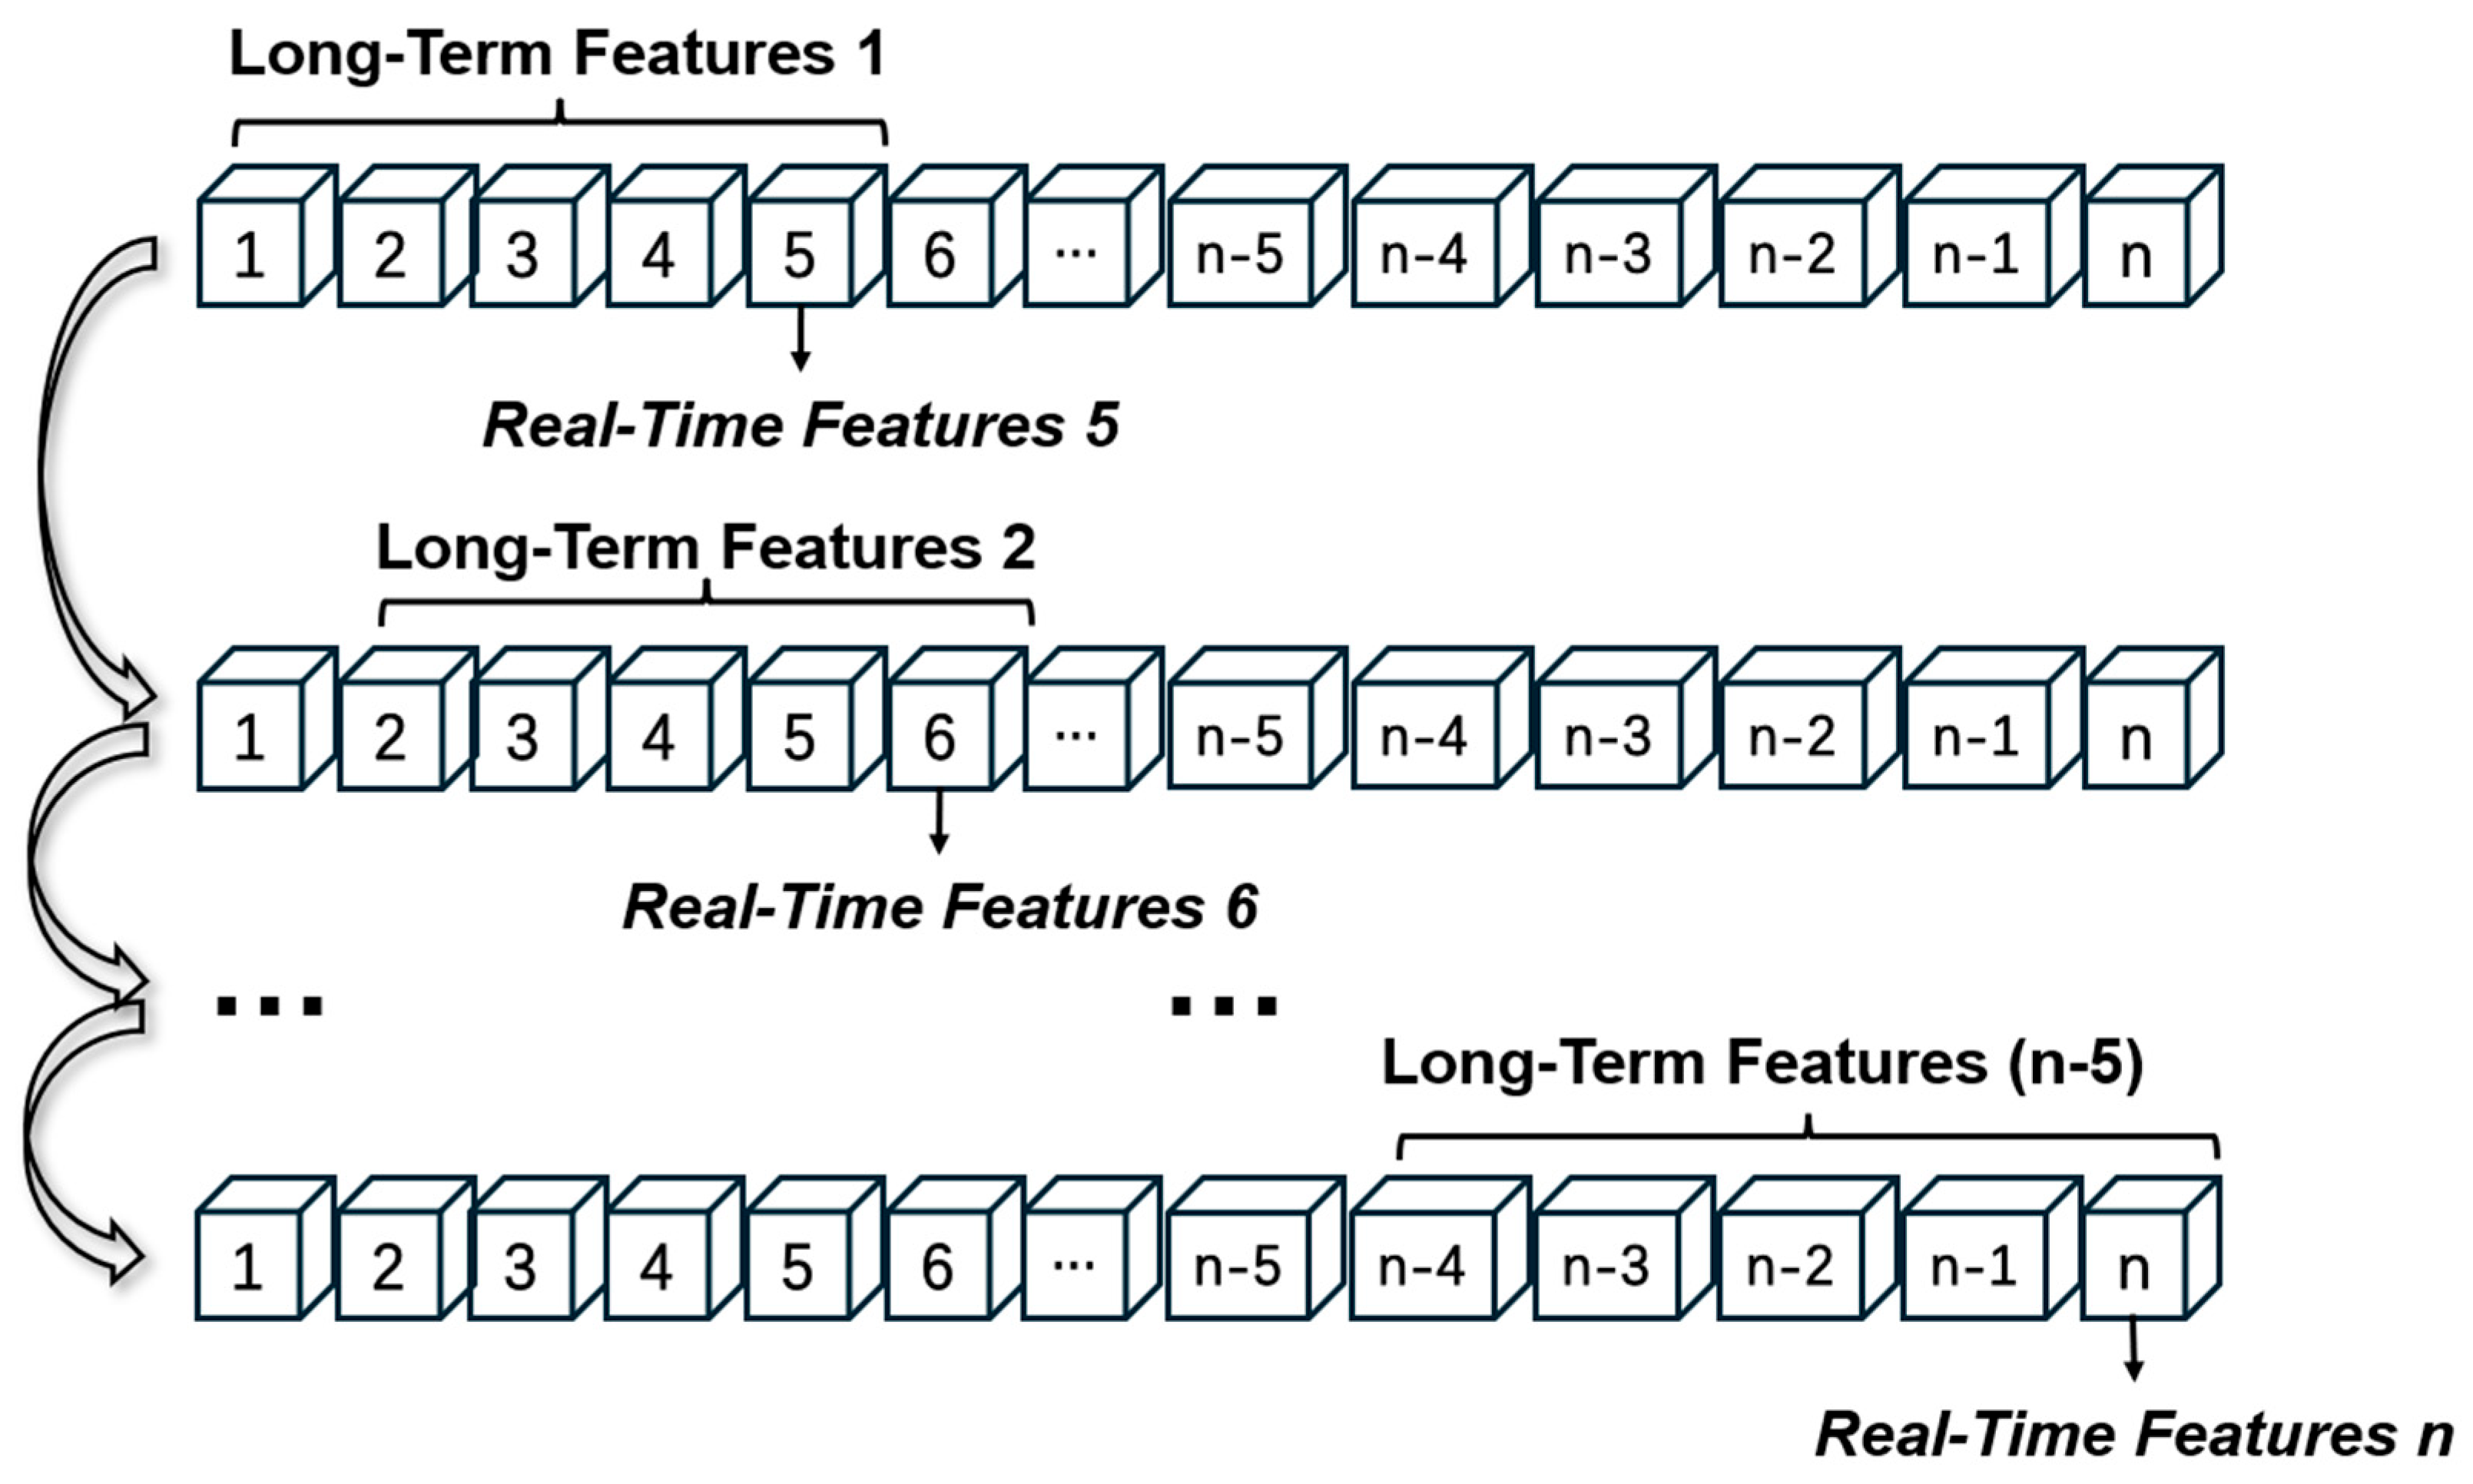
4.1.2. Feature Engineering
- Momentum: M(t) = M1(t) − M2(t);
- Distance Run Difference (D_DR): p1_distance_run–p2_distance_run;
- Served Score (SrvScr): the cumulative points won when p1 served in the game;
- Received Score (RcvScr): the cumulative points won when p1 received in the game;
- Score Difference (D_Scr): p1_score–p2_score;
- Game won Difference (D_Gm): p1_game–p2_game;
- Others: Serve (Srv), Set number (St), Game number (Gm), Point number (Pt), and Point Victor (PtVct).
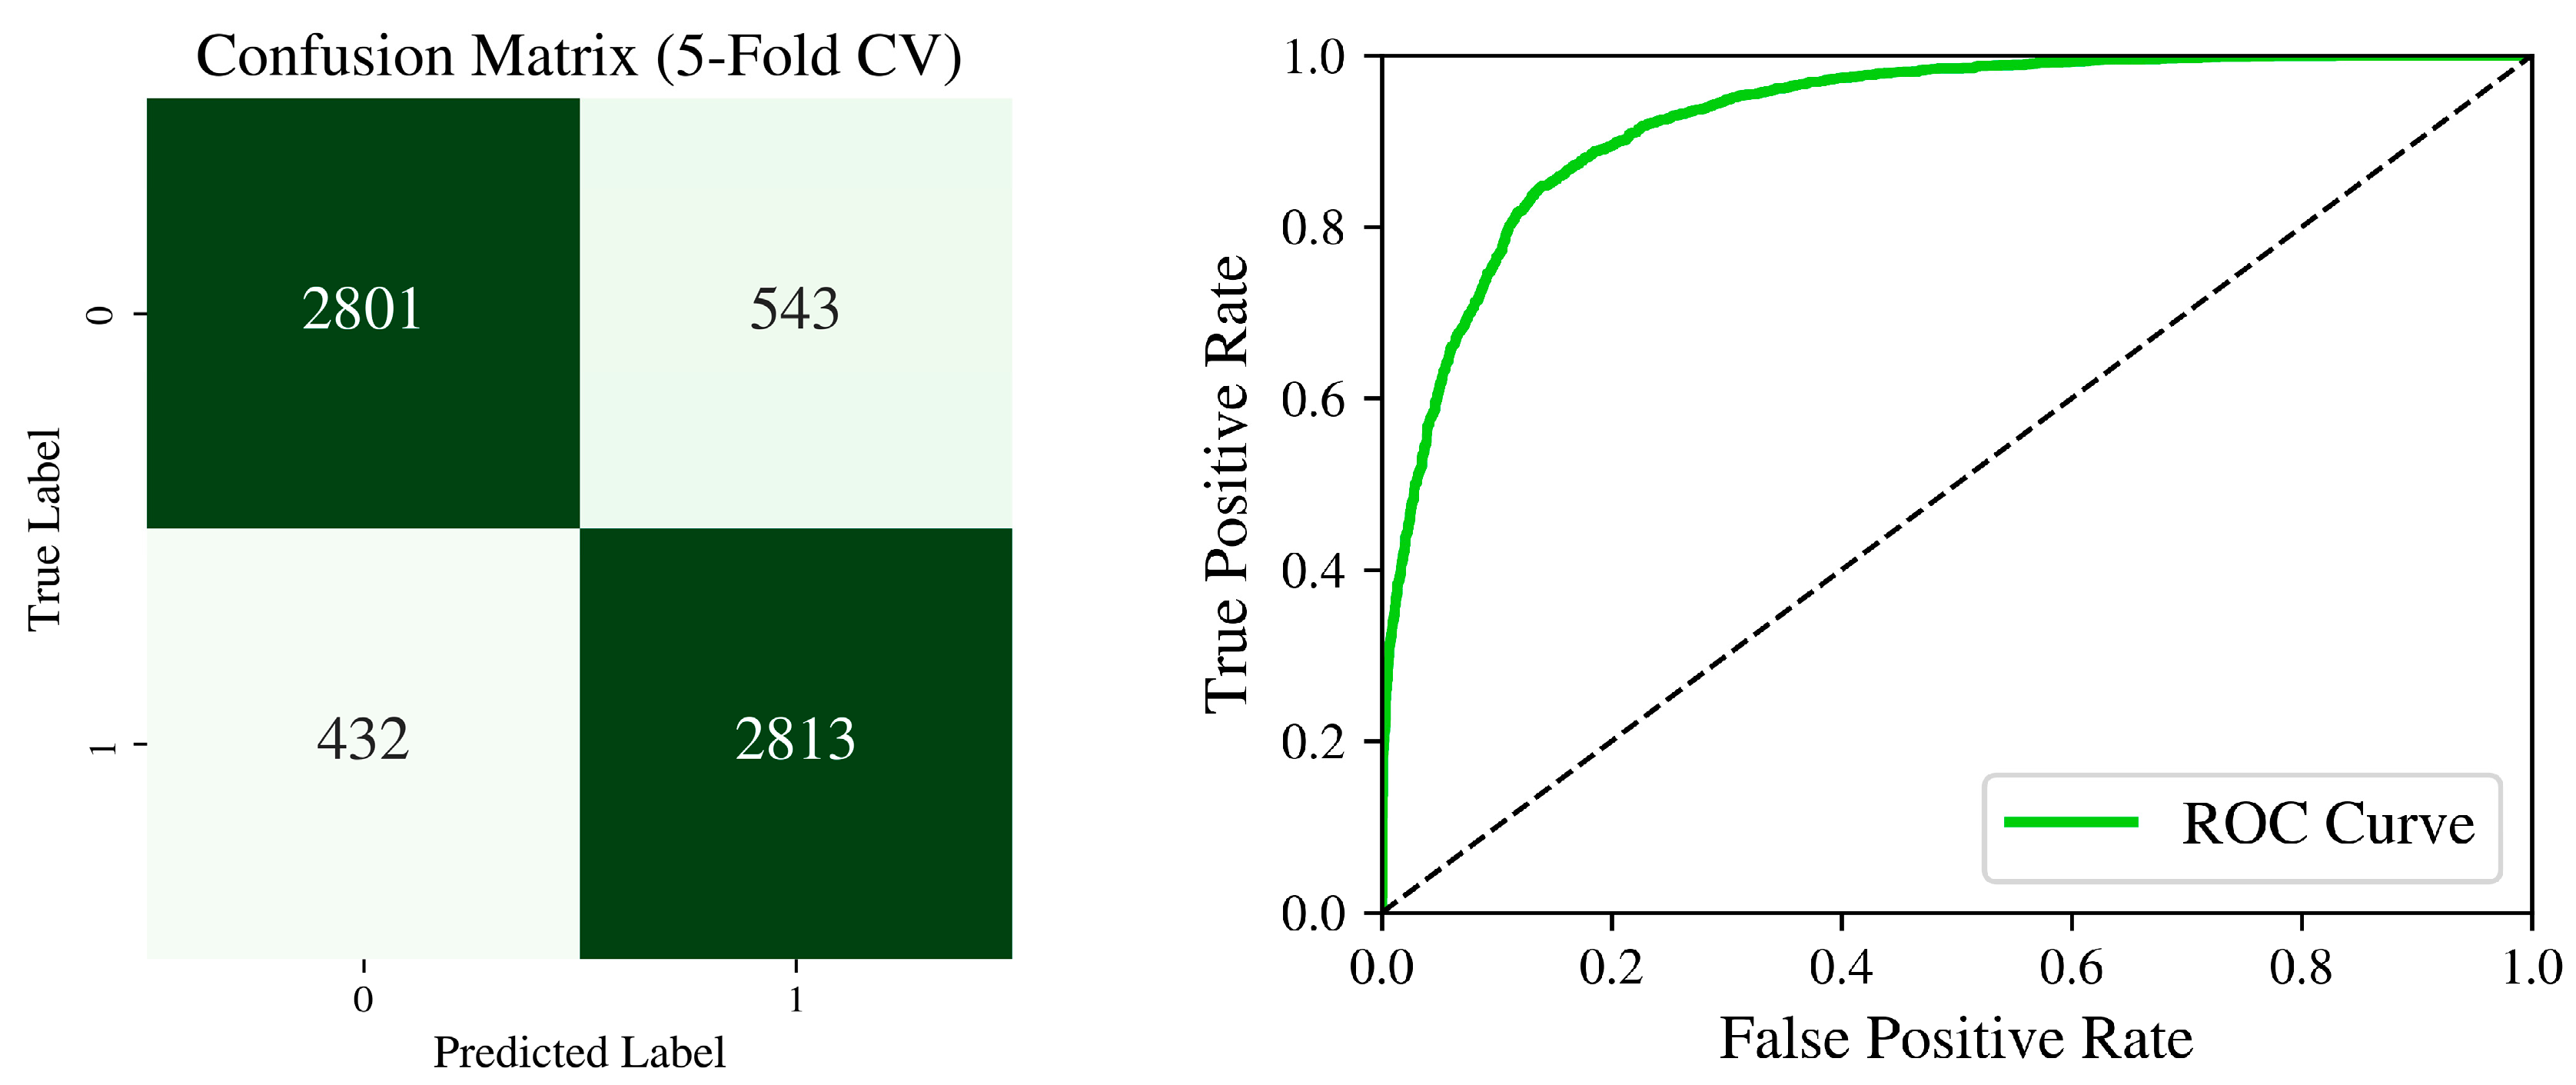
4.2. Model Accuracy
4.2.1. Training Set Accuracy
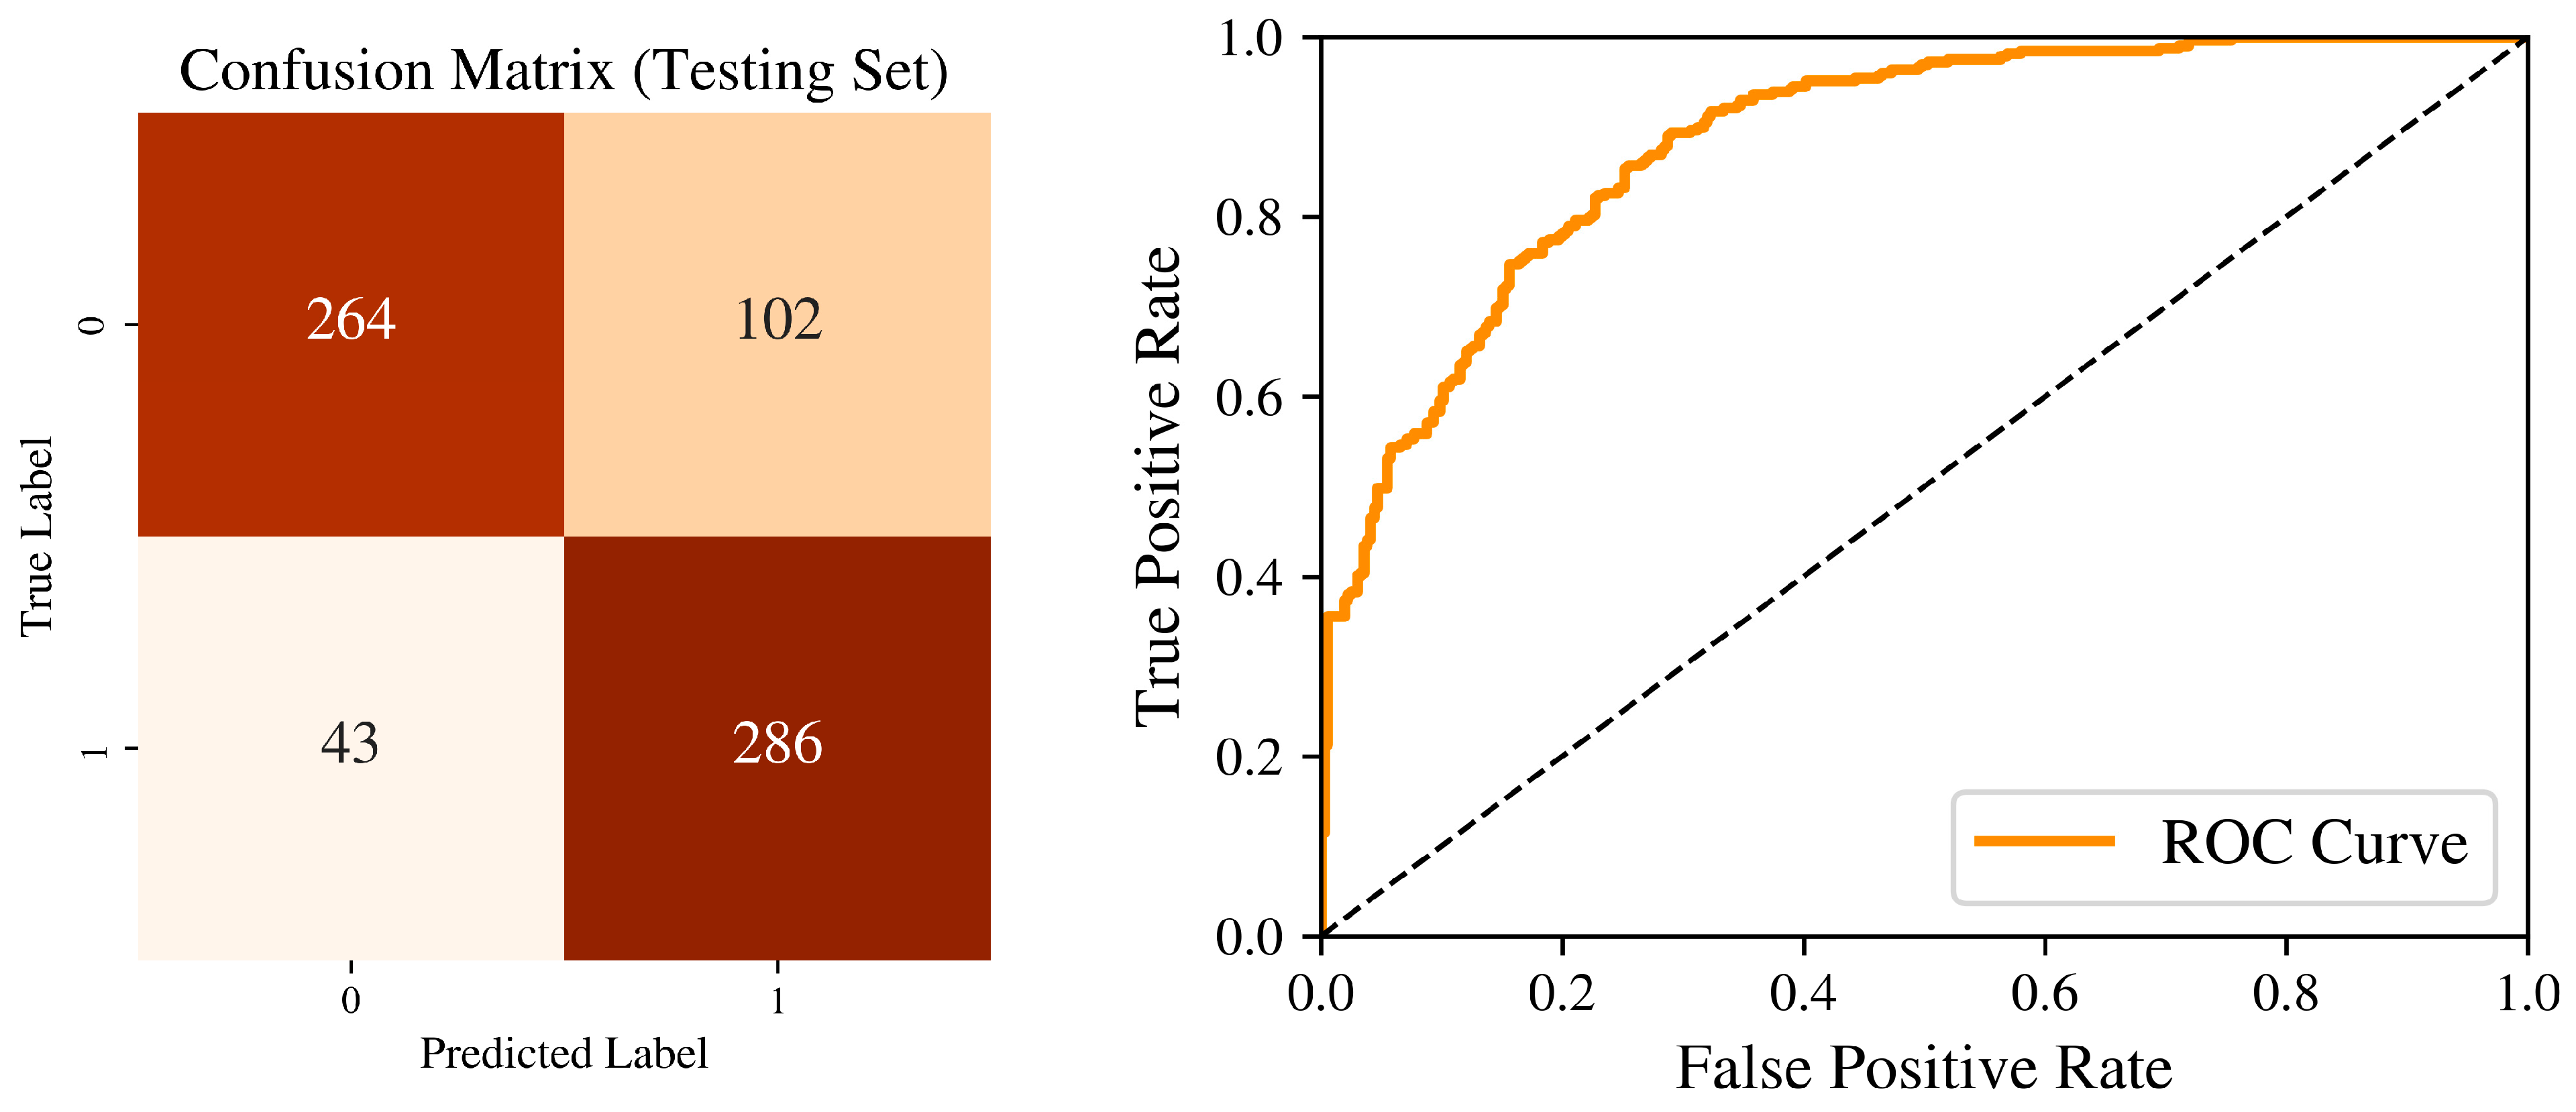
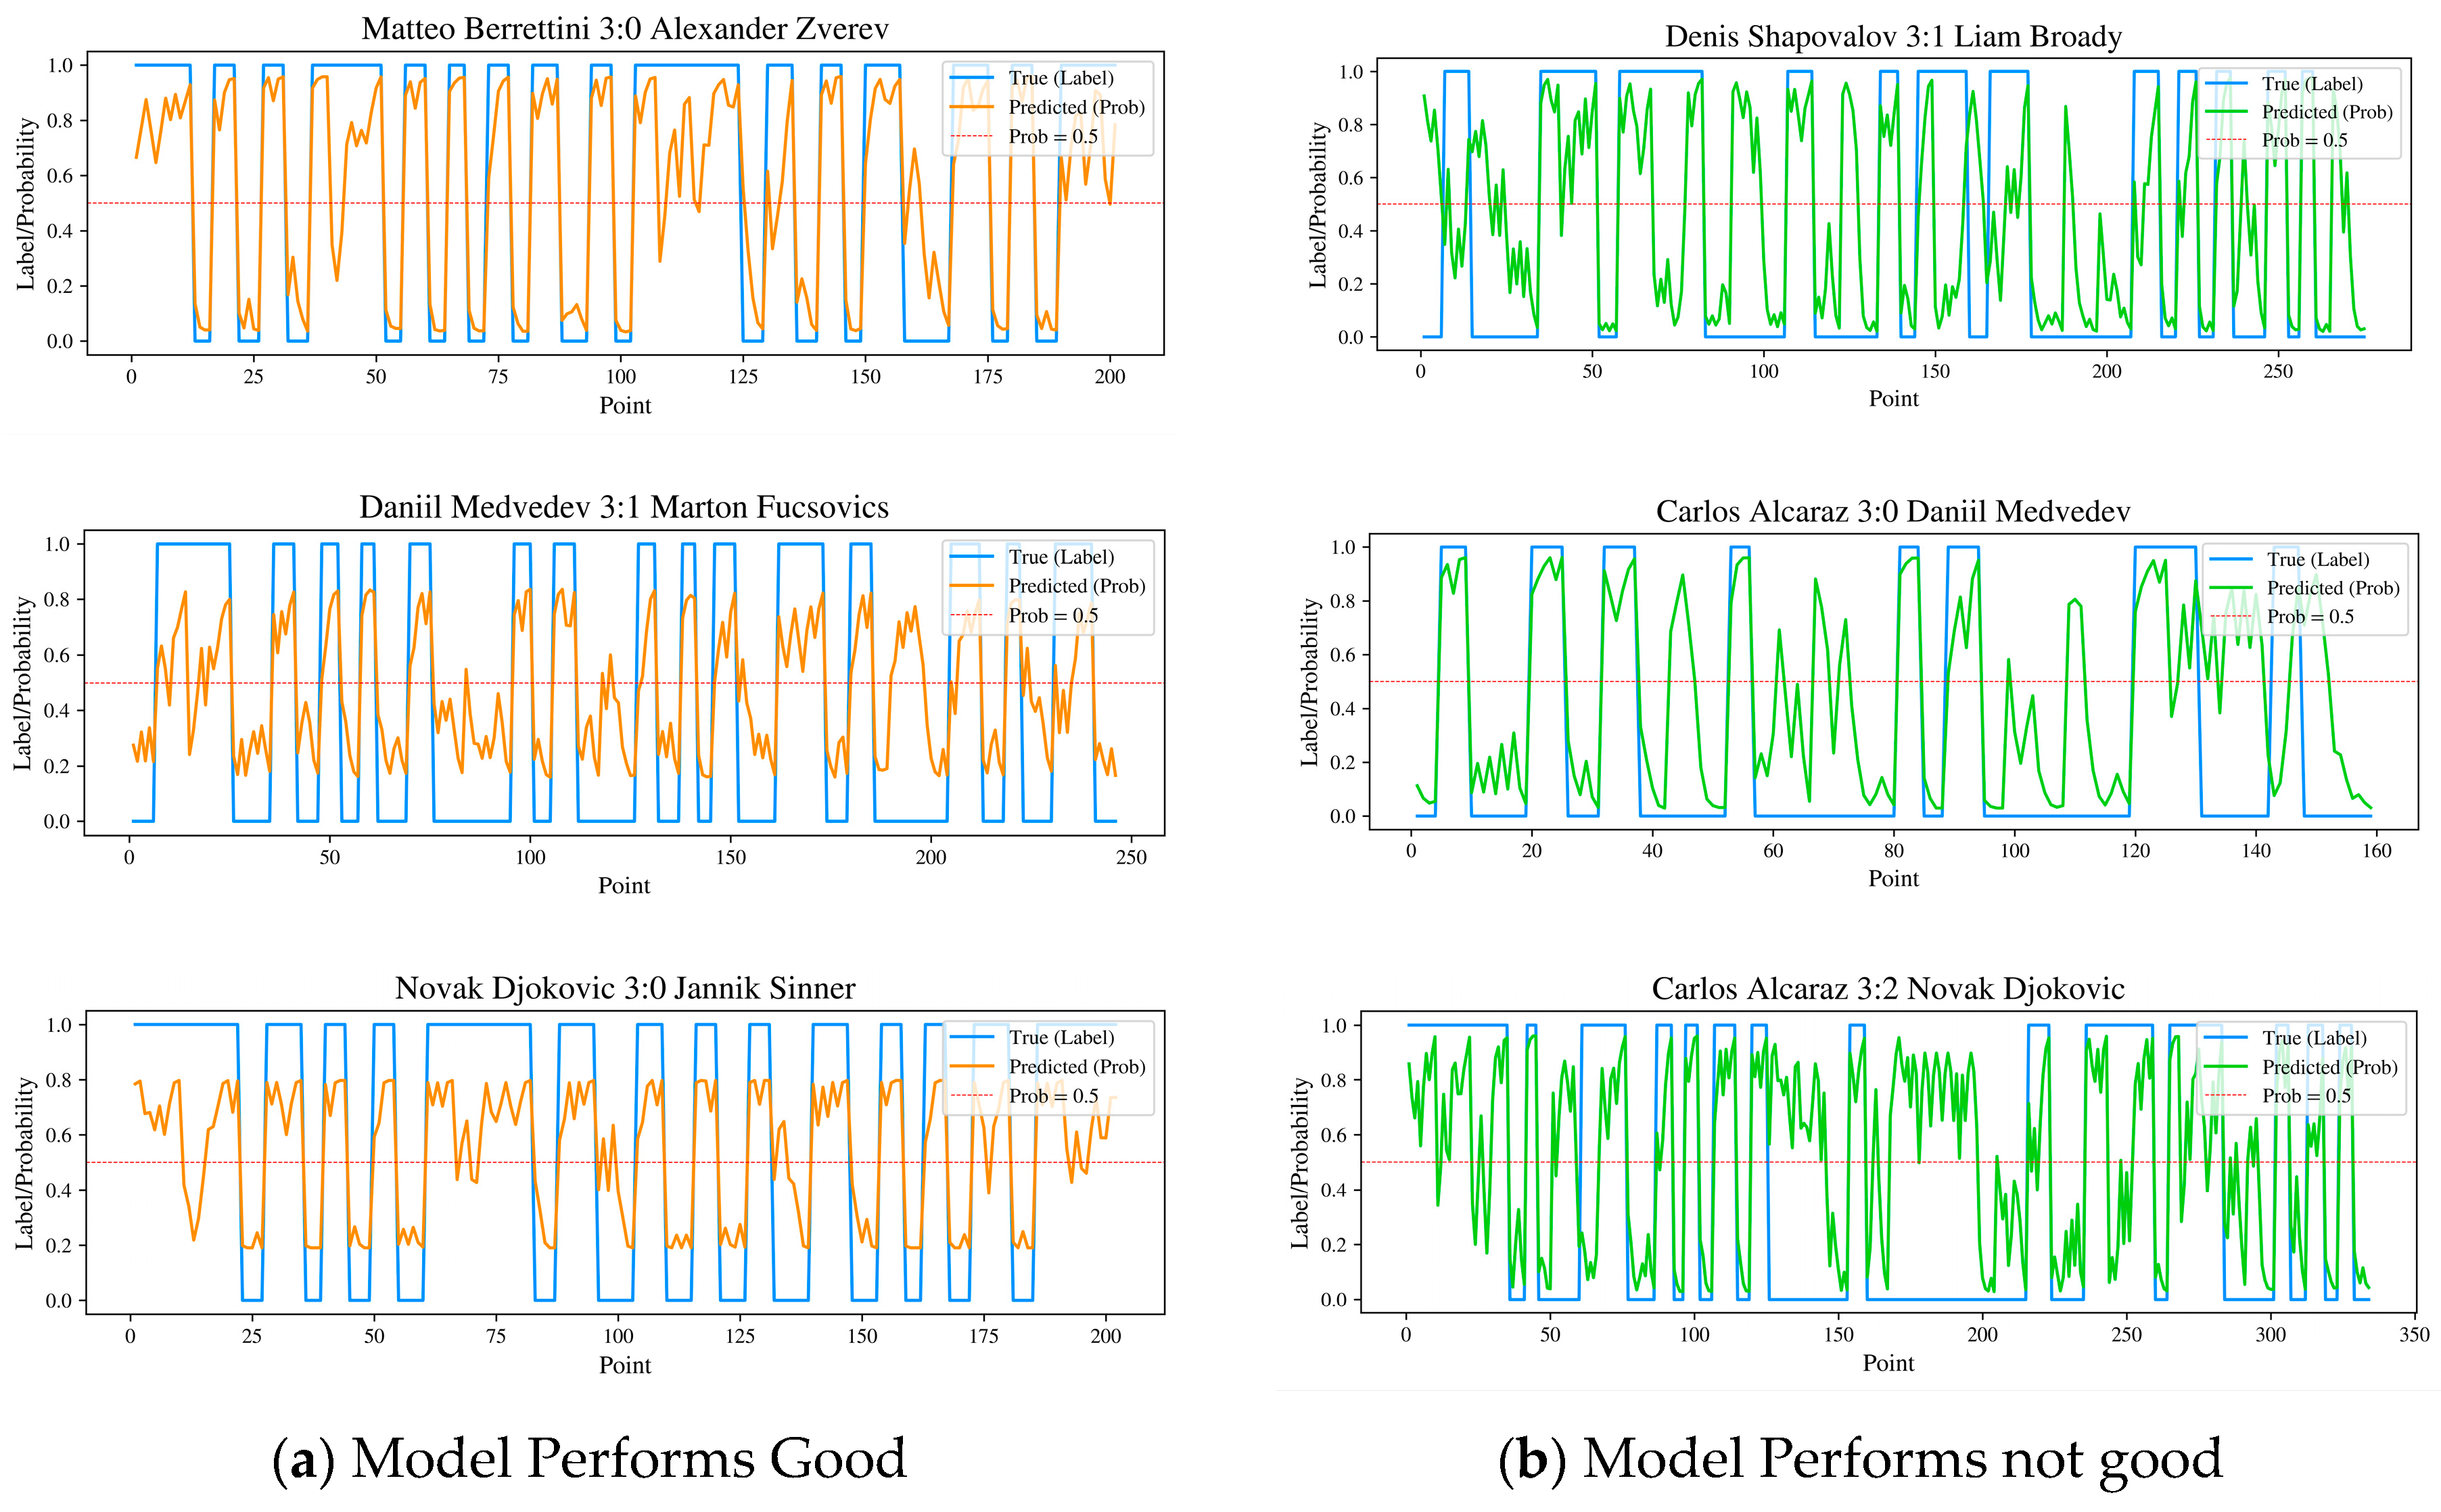
4.2.2. Testing Set Accuracy
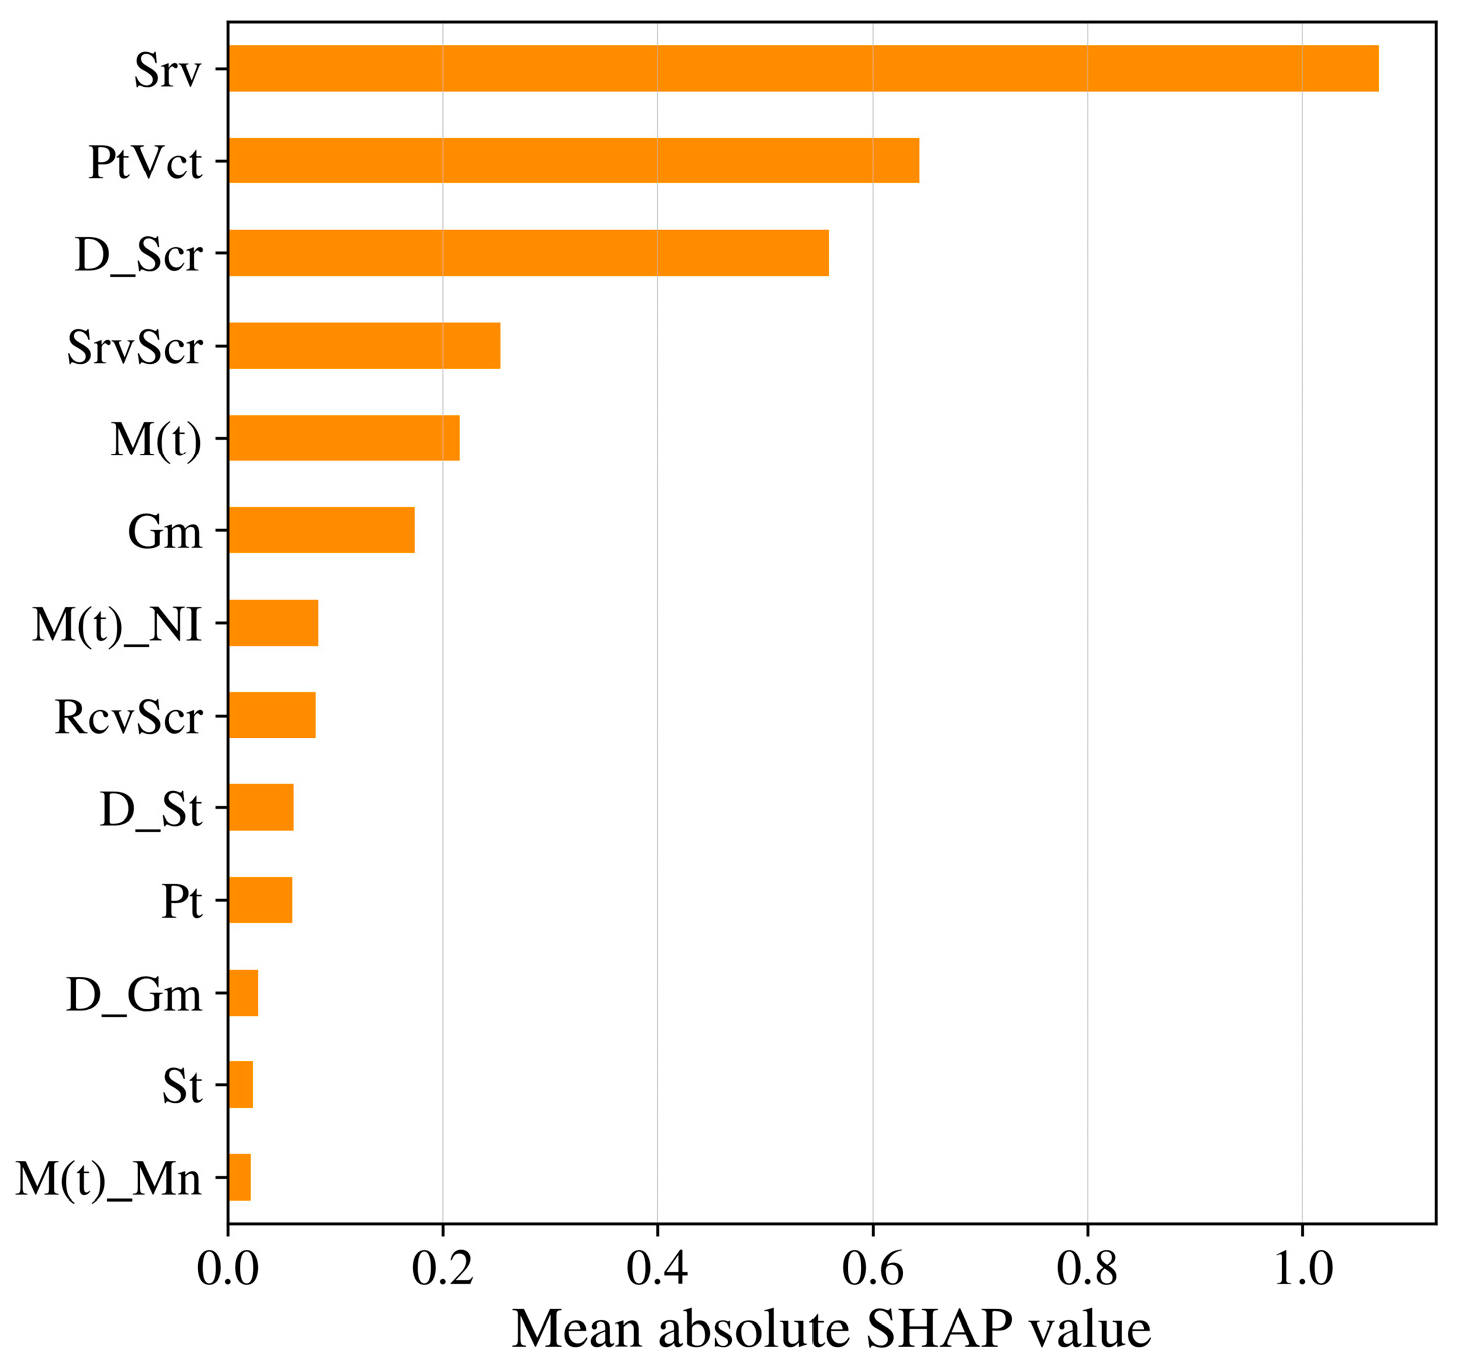
5. Discussion
6. Conclusions
Author Contributions
Funding
Data Availability Statement
Acknowledgments
Conflicts of Interest
References
- Crust, L.; Nesti, M. A review of psychological momentum in sports: Why qualitative research is needed. Athl. Insight 2006, 8, 1–15. [Google Scholar]
- Dietl, H.; Nesseler, C. Momentum in Tennis: Controlling the Match; UZH Business Working Paper Series 365; Department of Business Administration at the University of Zurich: Zürich, Switzerland, 2017. [Google Scholar]
- Meier, P.; Flepp, R.; Ruedisser, M.; Franck, E. Separating psychological momentum from strategic momentum: Evidence from men’s professional tennis. J. Econ. Psychol. 2020, 78, 102269. [Google Scholar] [CrossRef]
- Moss, B.; O’Donoghue, P. Momentum in US Open men’s singles tennis. Int. J. Perform. Anal. Sport 2015, 15, 884–896. [Google Scholar] [CrossRef]
- Depken, C.A.; Gandar, J.M.; Shapiro, D.A. Set-level strategic and psychological momentum in best-of-three-set professional tennis matches. J. Sports Econ. 2022, 23, 598–623. [Google Scholar] [CrossRef]
- Gu, W.; Saaty, T.L. Predicting the outcome of a tennis tournament: Based on both data and judgments. J. Syst. Sci. Syst. Eng. 2019, 28, 317–343. [Google Scholar] [CrossRef]
- Wimbledon. Wimbledon Official Website. 2024. Available online: https://www.wimbledon.com/index.html (accessed on 24 May 2025).
- Colino, E.; García-Unanue, J.; Felipe, J.L.; Quintana-García-Milla, I. Mechanical properties influencing athlete–surface interaction on tennis court surfaces. Sports Eng. 2024, 27, 18. [Google Scholar] [CrossRef]
- Paris 2024 Olympics. 2024 Paris Olympics Tennis Women Single. 2024. Available online: https://olympics.com/en/paris-2024 (accessed on 24 May 2025).
- Seidl, R.; Lucey, P. Live counter-factual analysis in women’s tennis using automatic key-moment detection. In Proceedings of the MIT Sloan Sports Analytics Conference, Boston, MA, USA, 4–5 March 2022. [Google Scholar]
- Chen, T.; Guestrin, C. XGBoost: A scalable tree boosting system. In Proceedings of the 22nd ACM SIGKDD International Conference on Knowledge Discovery and Data Mining (KDD ’16), San Francisco, CA, USA, 13–17 August 2016; pp. 785–794. [Google Scholar]
- Gillet, E.; Leroy, D.; Thouvarecq, R.; Stein, J.F. A notational analysis of elite tennis serve and serve-return strategies on slow surface. J. Strength Cond. Res. 2009, 23, 532–539. [Google Scholar] [CrossRef] [PubMed]
- Hunter, J.S. The Exponentially Weighted Moving Average. J. Qual. Technol. 1986, 18, 203–210. [Google Scholar] [CrossRef]
- Snoek, J.; Larochelle, H.; Adams, R.P. Practical Bayesian optimization of machine learning algorithms. Adv. Neural Inf. Process. Syst. 2012, 25, 2951–2959. [Google Scholar]
- Goutte, C.; Gaussier, E. A probabilistic interpretation of precision, recall, and F-score, with implications for evaluation. In Advances in Information Retrieval; Springer: Berlin/Heidelberg, Germany, 2005; Volume 3408. [Google Scholar]
- Huang, J.; Ling, C.X. Using AUC and accuracy in evaluating learning algorithms. IEEE Trans. Knowl. Data Eng. 2005, 17, 299–310. [Google Scholar] [CrossRef]
- Browne, M.W. Cross-validation methods. J. Math. Psychol. 2000, 44, 108–132. [Google Scholar] [CrossRef] [PubMed]
- SHAP. SHAP Documentation. 2024. Available online: https://shap.readthedocs.io/en/latest/api.html (accessed on 24 May 2025).

| Variable | Symbol | Description |
|---|---|---|
| sets | St | Number of sets won by Player 1/2 |
| games | Gm | Number of games won by Player 1/2 |
| score | Scr | Scores of Player 1/2 |
| serve | Srv | Serve by Player 1/2 |
| points | Pt | Number of points won by Player 1/2 |
| point_victor | PtVct | Point victor is Player 1/2 |
| ace | Ace | Ace by Player 1/2 |
| break_pt_won | BPtW | Break points won by Player 1/2 |
| double_fault | DF | Double fault made by Player 1/2 |
| rally_count | Ra | The number of rallies |
| distance_run | DR | The meters of running distance for Player 1/2 |
| Set | Accuracy | Precision | Recall | F1 | AUC |
|---|---|---|---|---|---|
| Training | 0.852026 | 0.838200 | 0.866872 | 0.852295 | 0.852246 |
| Testing | 0.791367 | 0.737113 | 0.869301 | 0.797768 | 0.795306 |
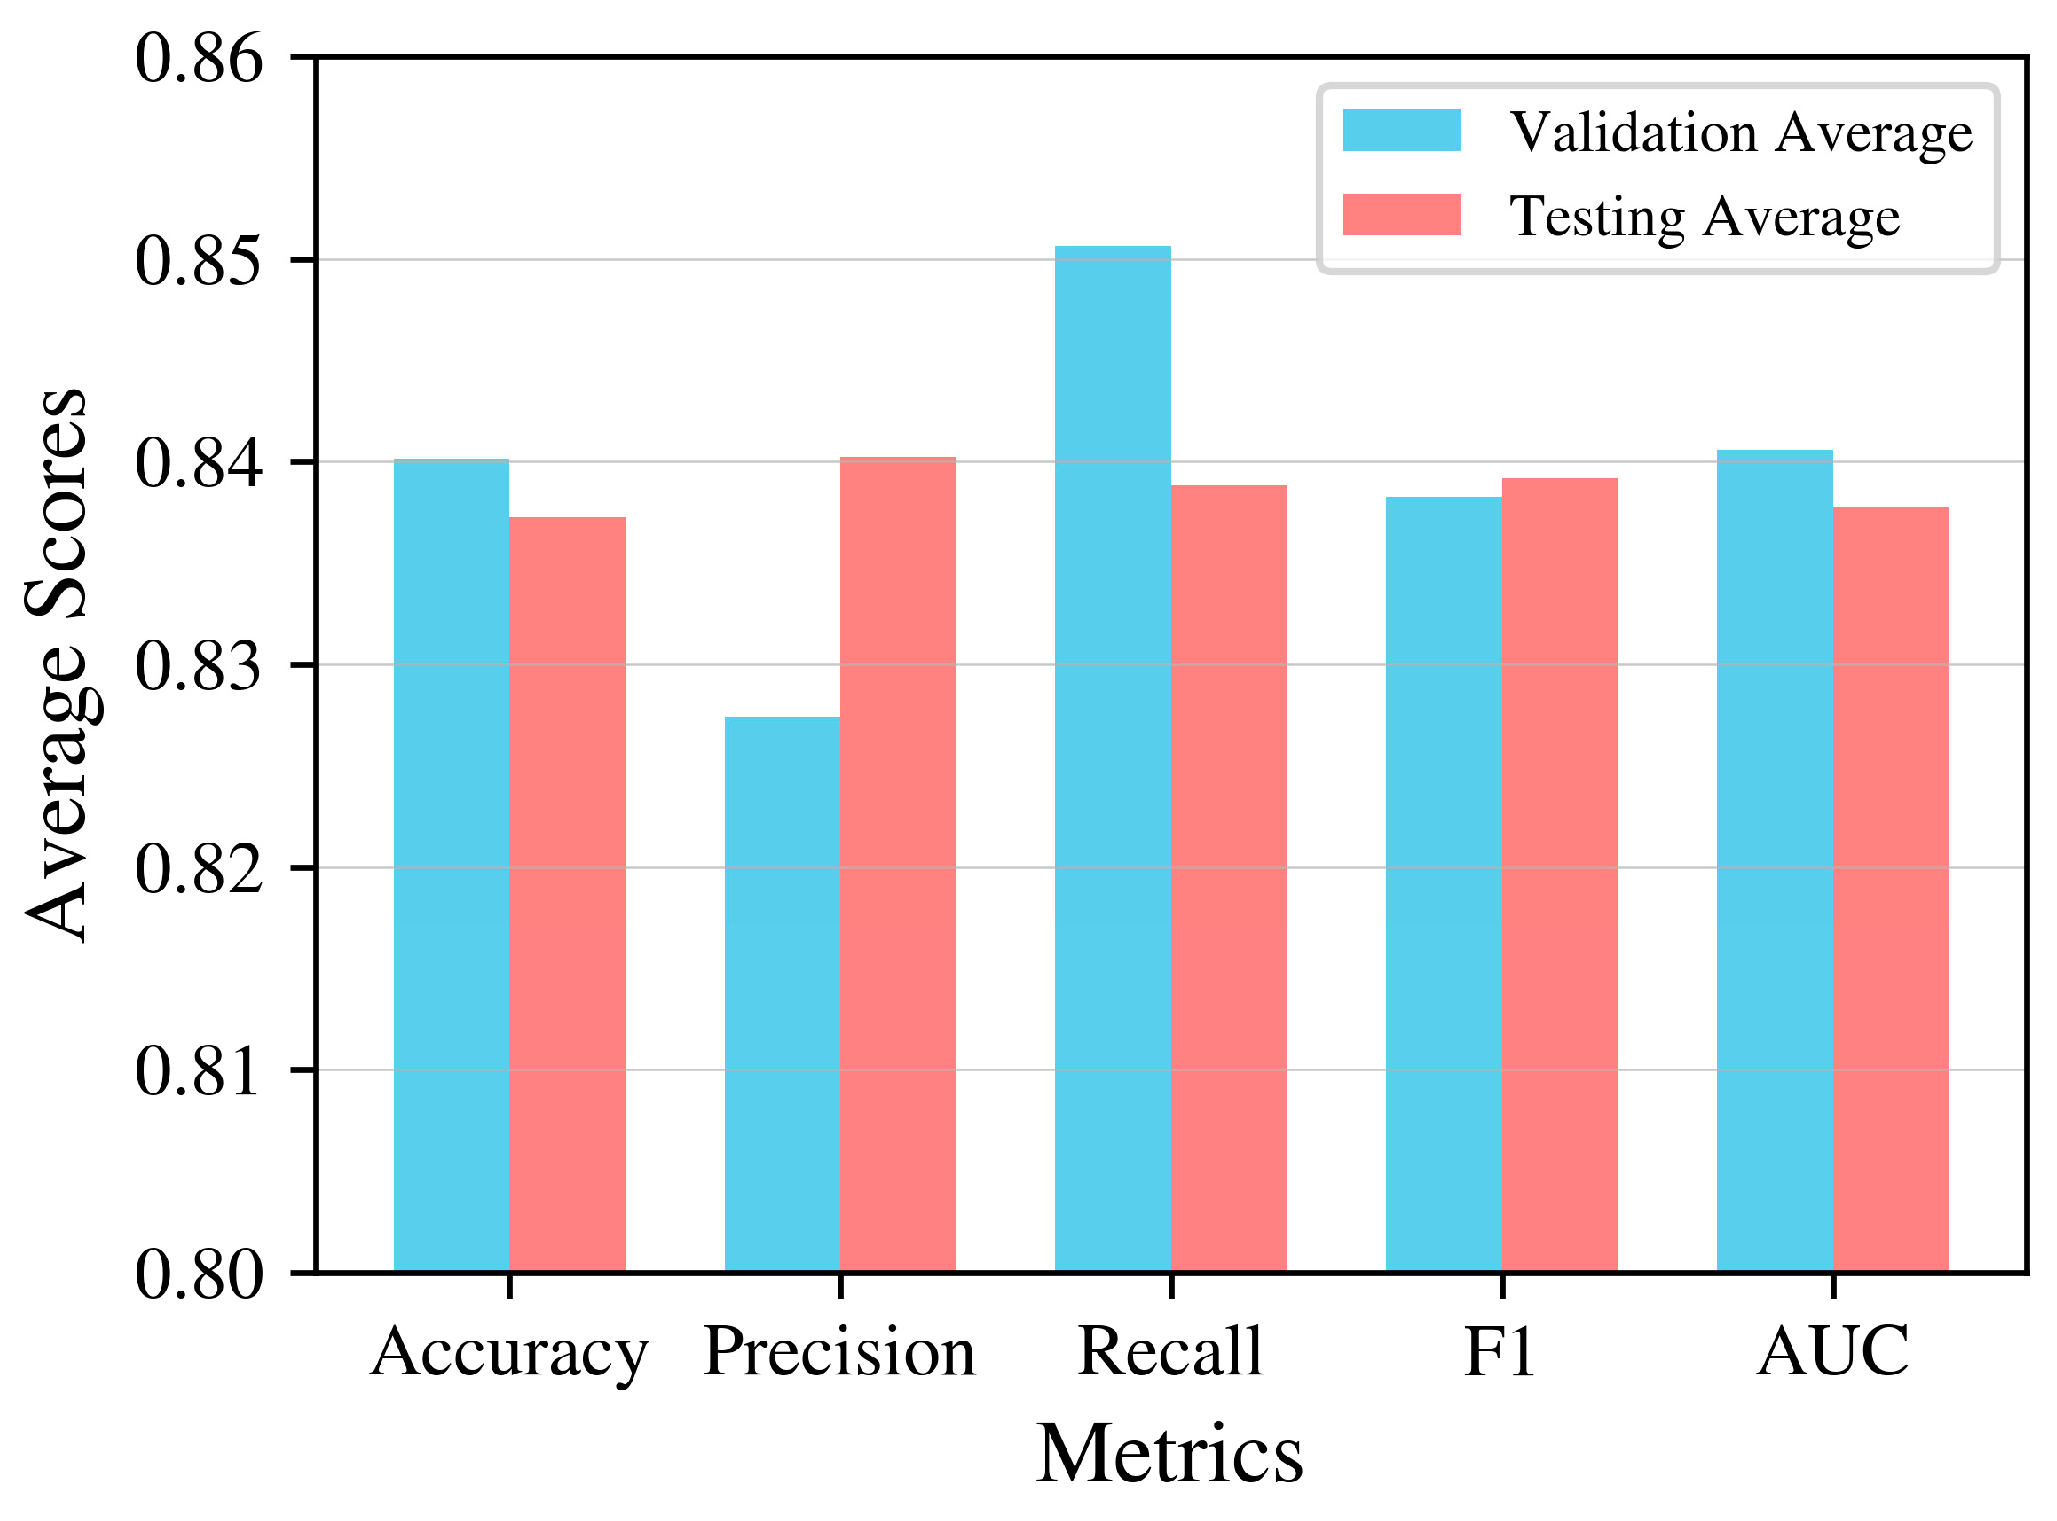
| Multiple Splitting | Accuracy | Precision | Recall | F1 | AUC | |
|---|---|---|---|---|---|---|
| Set 1 | Training | 0.831157 | 0.819723 | 0.838059 | 0.82879 | 0.831323 |
| Testing | 0.876129 | 0.878109 | 0.882500 | 0.880299 | 0.875917 | |
| Set 2 | Training | 0.843791 | 0.829513 | 0.858286 | 0.843654 | 0.844046 |
| Testing | 0.812048 | 0.794258 | 0.825871 | 0.809756 | 0.812468 | |
| Set 3 | Training | 0.840432 | 0.825561 | 0.851446 | 0.838304 | 0.840736 |
| Testing | 0.818008 | 0.848921 | 0.816609 | 0.832451 | 0.818176 | |
| Set 4 | Training | 0.835654 | 0.827597 | 0.842481 | 0.834972 | 0.835742 |
| Testing | 0.893191 | 0.881020 | 0.891117 | 0.886040 | 0.893059 | |
| Set 5 | Training | 0.848803 | 0.834629 | 0.860853 | 0.847538 | 0.849081 |
| Testing | 0.788827 | 0.800905 | 0.778022 | 0.789298 | 0.789011 | |
Disclaimer/Publisher’s Note: The statements, opinions and data contained in all publications are solely those of the individual author(s) and contributor(s) and not of MDPI and/or the editor(s). MDPI and/or the editor(s) disclaim responsibility for any injury to people or property resulting from any ideas, methods, instructions or products referred to in the content. |
© 2025 by the authors. Licensee MDPI, Basel, Switzerland. This article is an open access article distributed under the terms and conditions of the Creative Commons Attribution (CC BY) license (https://creativecommons.org/licenses/by/4.0/).
Share and Cite
Wang, L.; Chen, P.; Sabir, Q.U.A. Tennis Game Dynamic Prediction Model Based on Players’ Momentum. AppliedMath 2025, 5, 77. https://doi.org/10.3390/appliedmath5030077
Wang L, Chen P, Sabir QUA. Tennis Game Dynamic Prediction Model Based on Players’ Momentum. AppliedMath. 2025; 5(3):77. https://doi.org/10.3390/appliedmath5030077
Chicago/Turabian StyleWang, Lechuan, Puning Chen, and Qurat Ul An Sabir. 2025. "Tennis Game Dynamic Prediction Model Based on Players’ Momentum" AppliedMath 5, no. 3: 77. https://doi.org/10.3390/appliedmath5030077
APA StyleWang, L., Chen, P., & Sabir, Q. U. A. (2025). Tennis Game Dynamic Prediction Model Based on Players’ Momentum. AppliedMath, 5(3), 77. https://doi.org/10.3390/appliedmath5030077