Article

How Babies Learn to Move: An Applied Riemannian Geometry Theory of the Development of Visually-Guided Movement Synergies

by
Peter D. Neilson
1,* and
Megan D. Neilson
2
1
School of Electrical Engineering and Telecommunications, University of New South Wales, Sydney, NSW 2052, Australia
2
Independent Researcher, Late School of Electrical Engineering and Telecommunications, University of New South Wales, Sydney, NSW 2052, Australia
*
Author to whom correspondence should be addressed.
AppliedMath 2025, 5(2), 52; https://doi.org/10.3390/appliedmath5020052
Submission received: 23 February 2025 / Revised: 23 April 2025 / Accepted: 27 April 2025 / Published: 6 May 2025

Abstract

:
Planning a multi-joint minimum-effort coordinated human movement to achieve a visual goal is computationally difficult: (i) The number of anatomical elemental movements of the human body greatly exceeds the number of degrees of freedom specified by visual goals; and (ii) the mass–inertia mechanical load about each elemental movement varies not only with the posture of the body but also with the mechanical interactions between the body and the environment. Given these complications, the amount of nonlinear dynamical computation needed to plan visually-guided movement is far too large for it to be carried out within the reaction time needed to initiate an appropriate response. Consequently, we propose that, as part of motor and visual development, starting with bootstrapping by fetal and neonatal pattern-generator movements and continuing adaptively from infancy to adulthood, most of the computation is carried out in advance and stored in a motor association memory network. From there it can be quickly retrieved by a selection process that provides the appropriate movement synergy compatible with the particular visual goal. We use theorems of Riemannian geometry to describe the large amount of nonlinear dynamical data that have to be pre-computed and stored for retrieval. Based on that geometry, we argue that the logical mathematical sequence for the acquisition of these data parallels the natural development of visually- guided human movement.

1. Introduction

Within a single reaction time, the mature nervous system is able to plan and initiate a multi-joint coordinated movement to achieve a visual goal such as reaching to grasp a glass, pressing a doorbell or putting pen to paper. To illustrate further, think of a baseball player or a cricketer hitting a ball. This coordinated movement has to take into account the fact that the mass–inertia loads about elemental movements change not only with changes in posture but also with changes in the distribution of support forces across the surface of the body and with other mechanical interactions between the body and the environment. We claim that the amount of nonlinear dynamical computation needed to plan such a movement (taking these complications into account) is so large there is no way it can be carried out within the reaction time interval actually required to initiate such a response.
Complicating the problem further is the fact that the neuromusculoskeletal system is redundant with more descending motor commands than functional muscles, more functional muscles than elemental movements and more elemental movements than the degrees of freedom in the visual task space. This means there is no unique set of motor commands, muscle tensions and elemental movement trajectories able to achieve the required visuomotor response. Rather, there is an infinite number of possible trajectories capable of achieving the visual goal. So, how does the nervous system select a particular coordinated pattern of elemental movements to achieve a specific visual goal? Specifying a movement to be a synergy per se, as proposed seminally by Bernstein [1], does not solve the problem because an infinite number of possible movement synergies can achieve the same goal. However, given that a synergy is a multi-joint coordinated movement, optimization can provide a unique solution [2,3,4,5]. The debate then becomes which cost function should be maximized or minimized.
We propose that nervous systems able to select goal-directed coordinated movements that minimize metabolic energy have achieved an evolutionary advantage over nervous systems that do not do so. It is in the interest of both predator and prey to be able to move quickly and for sustained intervals of time with minimum net demand by the muscles for metabolic energy. We suggest, therefore, that the selection of a minimum-effort movement synergy with the same number of controlled degrees of freedom (CDOFs) as the number of degrees of freedom in the specified visual task space provides an optimal solution to the redundancy problem. But how does the nervous system generate visual goal-directed minimum-effort movement synergies able to compensate for changing mass–inertia loads?
Riemannian geometry provides a possible answer because a minimum-effort trajectory in a curved manifold is a geodesic trajectory. In the absence of all external forces (including gravitational and muscle forces), a geodesic trajectory in joint-angle space corresponds to the natural free motion of the body due to its mass–inertia properties. Consequently, a submanifold spanned by geodesic coordinate axes embedded in the curved configuration manifold of the body with dimension equal to the number of degrees of freedom of the visual task space will correspond to a low-dimensional minimum-effort movement synergy.
The fact that mass–inertia loads about the elemental movements of the body change with posture renders the selection of an appropriate minimum-effort movement synergy to be a nonlinear dynamical problem. The difference between linear and nonlinear dynamical systems is that, unlike for linear systems, the parameters of nonlinear systems change with changes in configuration and the rate of change of configuration of the body. This means that to initiate a visual goal-directed coordinated movement within a single reaction time, a large amount of data has to be pre-computed and stored in motor memory for every configuration and rate of change of configuration of the body. Acquired over time and through experience, from spontaneous fetal movement onward through to skilled movement of the adult, these pre-computations and the accumulation of data allow for adaptation and recalibration during body growth and for change and exposure to novel configurations and tasks.
In this paper we will set out (i) a mathematical solution to the problem of generating minimum-effort coordinated movements to achieve visual goals, taking into account the redundancy in the neuromusculoskeletal system and the variation in mass–inertia loads with posture and changes in the distribution of support forces and other external forces and (ii) a neurally-feasible way of developing and adaptively maintaining the means to implement that solution. In doing so, we will show not only that theorems from Riemannian geometry provide a mathematical description of motor and visual development of movement synergies, but also that the required order of the mathematical calculations describes the natural sequence of motor and visual development.

2. Preliminaries and Definitions

This paper is primarily intended for mathematicians who are already familiar with Riemannian geometry and who may be curious about its application to a computational theory of skilled human movement and its acquisition. Nevertheless, we also trust that the proposals will be accessible to human movement researchers and to cognitive scientists who have mathematical interest and training but who are not necessarily conversant with the geometric concepts drawn on here. For that reason, the mathematics are given in some detail. The tutorial appendix in an earlier paper [6] may also serve to bridge any gap.
For those not familiar with neuroscience, it seems reasonable to point out that the facts from neuroanatomy and neurophysiology mentioned in this paper are well known with thorough accounts readily available in the neuroscience literature. What is new here is the use of theorems from Riemannian geometry to describe the computations performed by the brain and the data that must be accumulated over time during visual and motor development to account for the ability of the mature nervous system to plan and initiate, within a reaction time interval, a multi-joint, minimum effort, coordinated movement confined to the visual task space for a visual goal. We refer to this as our proposed geometric theory for the development of visuomotor synergies.
In this section, we define important links between mathematical objects in Riemannian geometry and movement of the human body in a 3 D local environment. But first, at the request of a reviewer, we briefly address the relationship between this geometry and classical mechanics.

2.1. Classical Mechanics vs. Riemannian Geometry

In previous work, we have detailed the application of classical mechanics vs. Riemannian geometry for the analysis of multilinked mechanical systems such the human body or a humanoid robot [7]. Here, we give a brief recap.
Lagrangian mechanics plays out on the 2 n -dimensional tangent bundle (i.e., velocity phase space) of an n -dimensional Riemannian configuration manifold whereas Hamiltonian mechanics plays out on the 2 n -dimensional cotangent bundle (i.e., momentum phase space) of the same Riemannian configuration manifold. Nonlinearity due to the mass–inertia load about each joint in a n -jointed system changing as a function of configuration is taken into account by the kinetic energy Riemannian metric tensor changing from one configuration to another on the configuration manifold [8].
The characteristic property of Lagrangian mechanical systems is that the contraction of a second-order Lagrangian differential form ω L by a Lagrangian vector field Z on the velocity phase space gives an exact differential one-form equal to d E where E is the total energy of the system expressed as a function of position and velocity on the velocity phase space. The integral flow of the Lagrangian vector field given on the configuration manifold gives the natural energy preserving free motion of the mechanical system in the configuration manifold.
The characteristic property of Hamiltonian mechanical systems is that the contraction of a second-order symplectic differential form ω by a Hamiltonian vector field X H gives an exact differential one-form d H where H is the Hamiltonian function equal to the total energy E of the system expressed as a function of position and momentum on the momentum phase space. The integral flow of the Hamiltonian vector field on the configuration manifold gives the natural Hamiltonian-preserving free motion of the mechanical system in the configuration manifold. Providing the mechanical system is regular with no singularities, critical points or degeneracies, the free motion trajectory for the Lagrangian system equals the free motion trajectory for the Hamiltonian system. In both cases, in the absence of any external force, the total energy of the system is preserved.
But how might we define the configuration manifold of the human body as a mechanical system? Our proposal is as follows.

2.2. The Configuration Manifold

The configuration manifold is defined to be the 116 D space C = Θ × P × O representing the configuration of the human body moving in a local 3 D Euclidean environment [7]. It is the Cartesian product of (i) a 110 D posture space Θ spanned by the 110 elemental movements of the body (ball-park estimate of the number of elemental movements), (ii) a 3 D Euclidean space P spanned by coordinates X , Y , Z giving the place of the head in the 3 D Euclidean environment relative to a fixed internally-generated reference point anchored to the outside world and a fixed internally-generated reference direction (i.e., compass heading) and (iii) a 3 D orientation space O giving the rotation of the head in the environment relative to the innate coordinates X , Y , Z encoded in the hippocampus. These 116 variables uniquely specify the configuration of the body as it moves about in the outside 3 D Euclidean environment.
The place and orientation of the head in the local 3 D Euclidean environment have to be included because changes in the place and/or orientation of the head profoundly alter centrally-encoded visual images of objects in the environment. Not only do the positions of objects in 3 D egocentric visual space change with the place and orientation of the head but also their size, outline, shape, curvature, rotations, occlusions, velocities and accelerations are all changed [6,9].
The 116 D configuration manifold C plays a central role in our geometric theory of motor development. According to the theory, the configuration manifold is represented by a large association memory network distributed throughout the cortex involving many hundreds of thousands of neurons and many millions of adaptive synaptic connections. The neurons are connected both vertically, forming cortical columns, and horizontally, via association fibers. Both excitatory and inhibitory synapses are involved in loops with varying time delays. By modifying synaptic strengths, the pattern of neural activity within the network converges to an attractor state, thereby forming associations between input and output temporospatial patterns of activity. In this way, data encoded by temporospatial patterns of neural activity acquired over time during motor development are stored in the cortical memory network in association with temporospatial patterns of neural activity encoding the sensed configuration c C and rate of change of configuration c T c C of the body moving in the outside world. For simplicity, in what follows, we will refer to this cortical association memory network as motor memory.
It is proposed that the hippocampal formation of the brain has an innate representation of 3 D Euclidean space anchored to horizontal and vertical directions in the outside world via the vestibular–labyrinthine system and by the establishment of objects in the local environment as visual landmarks [6,9]. The proprioceptive positions and angles of the 110 elemental movements of the body are encoded in the somatosensory cortex while the place and orientation of the head in the 3 D environment are encoded in the hippocampus and entorhinal cortex [10,11,12,13]. Thus, as a person moves about in a local environment, the nervous system senses and encodes a representation of the 116 variables that specify the changing configuration of the body. Geometrically, this can be thought of as a point c C moving in the 116 D configuration manifold C and velocity vectors c T c C in the tangent spaces.

2.3. A Metric for the Configuration Manifold

A 116 × 116 matrix G c representing the Riemannian metric matrix at every point on the 116 D configuration manifold C = Θ × P × O is partitioned into three submatrices G 1 c , G 2 , G 3 c corresponding to Θ , P and O , respectively, as shown in Equation (1):
G c = G 1 c 0 0 0 G 2 0 0 0 G 3 c
The kinetic energy KE about each elemental movement of the body moving in the environment can be obtained from Equation (2):
K E = 1 2 m v 2 + 1 2 I ω 2
where m is the mass, v is the velocity, I is the moment of inertia and ω is the angular velocity about each elemental movement. Both translation and rotation are included because, for most of the synovial joints of the body, the center of rotation changes with the angle of rotation. Thus, the muscles moving an elemental movement encounter both a mass load for translation and a coupled moment-of-inertia load for rotation.
The kinetic energy Riemannian metric matrix G 1 for the entire body is given by
K E = 1 2 G 1 θ ˙ i , θ ˙ j
where G 1 is the 110 × 110 symmetrical, non-singular, mass–inertia matrix of the body associated with the 110 D posture space Θ and θ ˙ i , θ ˙ j for i , j = 1 , , 110 are elemental-movement velocity vectors tangent to the 110 D posture space Θ [8]. Because of mechanical interactions between the body and the environment associated with supporting the body against gravity, each element G i j of the mass–inertia matrix G 1 c varies as a function of the configuration c C in the 116 D configuration manifold C = Θ × P × O .
The 3 × 3 submatrix G 2 is the Euclidean metric for the 3 D place space P corresponding to the place of the head in the 3 D Euclidean environment. The elements in this matrix are constant and do not change with configuration of the body.
The 3 × 3 submatrix G 3 c on the orientation subspace O is the metric matrix for rotation of the head in 3 D Euclidean space. Rotation in 3 D space is described by the special orthogonal group S O 3 . S O 3 is topologically equivalent to a unit 2-sphere S 2 embedded in the 3 D Euclidean space centered at the egocentric origin. When the metric for 3 D Euclidean space is pulled back onto the 2-sphere, it becomes
G 3 c = r 2 s i n 2 φ d θ × d θ + d φ × d φ
where r is the unit radius of the sphere, θ is the angle around horizontal latitude lines with θ = 0 defining a chosen internally-generated horizontal reference compass heading and φ is the angle along vertical longitude lines with φ = 0 at the north pole. If φ is held constant and θ varies around the corresponding latitude line, the metric G 3 φ = r 2 s i n 2 φ is constant along that latitude line. Thus, G 3 φ = 0 at the north pole and G 3 φ = r 2 = 1 at the equator. In other words, G 3 c varies as a function of the configuration of the body depending on the orientation angle φ of the head from vertical.

2.4. Posture, Place and Orientation

As a person moves about in a local environment, it is possible to have different orientations of the head independently of posture and place. For example, a person can be standing with the body in the same posture and with the head in the same place but with the head pointed in a different direction. It is the presence of the 116 × 116 Riemannian metric matrix G c on the 116 D configuration space C = Θ × P × O varying from point to point on C that defines the configuration space to be a 116 D curved Riemannian manifold C , G rather than a flat Euclidean space. According to our geometric theory, the origin of the 3 D Euclidean space used for sensing the place of the head in the 3 D environment and the reference compass heading for the rotation of the head in the horizontal plane are innate within the hippocampus. The place and orientation of the head in the environment together with the posture of the body define the configuration of the body at each moment in time as it moves about in the local 3 D Euclidean environment. Geometrically, we can think of the configuration of the body at each moment in time as a point in the 116 D configuration manifold. Movements are represented by trajectories in posture, place and orientation, that is, in the 116 D configuration manifold. Importantly, the range of each elemental movement and the position and orientation of the head in the environment are all limited, giving rise to impossible postures and no-go places. In other words, the configuration manifold has a boundary. Impossible postures and no-go places are on the outside of the boundary. Generally speaking, people do not injure themselves by attempting to make movements that exceed their possible range of movement. This can be attributed to the fact that mass–inertia loads on muscles become infinitely large on the boundary, causing geodesic trajectories to deviate away [6,14].

2.5. State Space for Body Movement

From a Riemannian geometry point of view, any movement of the body in 3 D Euclidean space is represented geometrically by a trajectory α t parameterized by time t in the curved 116 D Riemannian configuration manifold C , G together with its velocity vector α t at each point along α t . At each point c C , G , there exists a 116 D vector space tangent to the configuration manifold at the point c C , G . This tangent linear vector space is denoted by T c C . All the possible vectors in the tangent vector space T c C tangent to the point c C , G represent all the possible velocity vectors c that all the possible movement trajectories passing through the point c C , G can possess. If all the tangent vector spaces T c C over all the configurations c C , G are ‘glued’ together, we obtain a 232 -dimensional manifold known as the tangent bundle  T C over the configuration manifold C , G . A point in the tangent bundle needs 116 real numbers to specify its configuration plus another 116 real numbers to specify its velocity at that configuration. The body is a second-order, nonlinear, dynamical, mechanical system with 116 degrees of freedom. Each point c , c in the tangent bundle T C corresponds to the state (i.e., configuration and rate of change of configuration) of the body moving in the 3 D Euclidean environment. Thus, the tangent bundle T C is the 232 D curved nonlinear state space for the body moving in the outside 3 D environment.

2.6. Submanifolds and Controlled Degrees of Freedom

We define a minimum-effort movement synergy to be a low-dimensional smooth Riemannian submanifold embedded in the high-dimensional Riemannian configuration manifold of the human body moving in a local 3 D environment [6,7,9]. The dimension of the submanifold has to match the number of degrees of freedom in the specified visual task space. This will require coordinated (i.e., nonlinearly correlated) changes of elemental movements throughout the body. The particular joint angles involved are determined by the position and orientation of the submanifold in the configuration manifold. Switching between visual task spaces requires the selection of new movement synergies. Switching between movement synergies involves changing from one submanifold to another. The number of CDOFs can change from one submanifold to the next. Valency rules for transitions between submanifolds concern the dimensions of the intersections (i.e., overlaps) of consecutive submanifolds.

2.7. Curvature of the Configuration Manifold

Any smooth manifold endowed with a Riemannian metric that varies from point to point on the manifold is a warped or curved manifold with the curvature at each point being described mathematically by a curvature tensor, as shown by Equations (5) and (6). Knowing the Riemannian metric G c at each point on the configuration manifold as a result of the accumulation of data over time during development, as described in Section 2.2, allows the nervous system to compute the coefficients R i j k       l of the type 3,1 curvature tensor at each point on the manifold C , G using Equations (5) and (6).
Γ j k i = 1 2 G i m G m j , k + G m k , j G j k , m
R i j k       l = Γ k j , i l Γ k i , j l + Γ k j m Γ m i l Γ k i m Γ m j l
where i , j , k , l , m = 1 ,   ,   116 .
The commas in the above notation represent partial differentiation, the Γ j k i at each point in C , G are known as Christoffel symbols and the R i j k       l are the coefficients of a type 3 , 1 curvature tensor at each point. When computed for all 116 values of i , j , k , l   a n d   m for every configuration c C , G , Equations (5) and (6) represent a large amount of computation and a large amount of data stored in motor memory in association with each configuration c C , G and the rate of change of configuration c . The data are accumulated over time by the nervous system during development and play a crucial role in motor compensation for change in the size and shape of a growing body. The data are all associated with the configuration c C , G and rate of change of configuration c so can be quickly retrieved from motor memory through the specification of c and c that are continuously sensed. In a lifetime, most people experience only a subset of all the possible configurations of their body, so their range of visually-guided coordinated movements is limited to those configurations that have been experienced. In other words, a person can be highly skilled in performing certain task-related coordinated movements while, at the same time, being poorly coordinated for other tasks requiring different movement synergies.

2.8. Geodesics

Any movement trajectory α t in the curved configuration manifold C , G for which the covariant derivative  α α t (described below) is zero at every point along the curve is called a geodesic trajectory. Geodesic trajectories in Riemannian manifolds have special properties. They are to curved Riemannian manifolds what straight lines are to flat Euclidean spaces. They can pass through every point c C , G in the manifold in every possible direction. Since their metric acceleration α α t is zero at every point along the curve, it follows that their metric speed α t G is constant along the curve. The metric speed can be set to any value simply by changing the metric norm of the initial velocity vector α 0 . The arc-length along the curve is the shortest distance between any two points along the curve. Most importantly, since the metric acceleration α α t is zero, in the absence of any external force acting on the body, including gravitational and muscle forces, geodesic curves correspond to the natural free motion trajectories of the body attributable to its mass–inertia properties.
Given an initial configuration c i C , G and an appropriate initial velocity α 0 T c i C , the resulting geodesic trajectory requires no muscle force to move between the given initial configuration c i and any final configuration along the geodesic pathway (think of the movements of a person in the zero-gravity environment of an orbiting space station). A burst of multiple muscle activity is required to set an appropriate initial velocity of all the elemental movements at the start of the movement. But after that, in the absence of external forces, the body simply glides from its initial configuration to the required final configuration along its natural geodesic path determined by the changing mass–inertia loads on its elemental movements. Think of a person in zero gravity tumbling about the body’s center of gravity. On Earth, this includes the changing distribution of anti-gravity support forces acting on the body. Thus, geodesics provide the most energy-efficient pathways between any given initial configuration and any given final configuration in the 116 D configuration manifold with boundary of the human body. A unique geodesic pathway between specified initial and final configurations always exists. The time required for movement between the specified initial and final configurations can be set by setting an appropriate initial metric speed α 0 G for the geodesic. Goal-directed movements planned in this way correspond to the shortest, most energy-efficient pathways between specified initial and specified final configurations taking the mass–inertia characteristics of the body in interaction with its environment into account.
So, the question becomes the following: How can the nervous system generate geodesic trajectories to span a minimum-effort, synergy-related submanifold? The amount of calculation required to generate such a minimum-effort geodesic submanifold is so large that, as asserted in the introduction, there is no way it can be performed within a single reaction time. In the following section on motor development, we begin to address this problem, prior to moving to visual development and visuomotor integration, in each case using the geometry to point to what needs to be accomplished by neurally-feasible networks and the sequence in which this must happen.

3. Motor Development

During the first two years of life, a remarkable transition occurs from the spontaneous pattern-generator movements of the fetus and neonate through to the walking and talking skills of the infant. Motor skill acquisition continues on into adulthood and throughout life. Riemannian geometry provides a picture of the data that have to be acquired in order to be able to generate minimum-effort geodesic pathways from any given initial point to any given final point in a high-dimensional curved Riemannian configuration manifold. In other words, Riemannian geometry provides a mathematical framework for describing motor development.
The mathematical theory determines the order in which these data must be acquired because (i) the sensory system must remove redundancy from millions of sensory receptors before cortical sensory maps of sensory signals such as encoded muscle lengths, muscle tensions and joint angles can be formed, (ii) cortical sensory maps must exist before relationships between the encoded sensory signals can be modeled, (iii) the ability to model relationships between joint angles and muscle lengths is necessary before the leverage of each muscle about each elemental movement as a function of posture can be determined, (iv) that leverage must be known before the mass–inertia load about each elemental movement as a function of body configuration can be computed, (v) the mass–inertia load about each elemental movement as a function of changing configuration must be known before the curvature at each point in the configuration manifold can be determined, (vi) the curvature at each point in the configuration manifold must be known before illusory accelerations associated with curvilinear coordinates can be obtained for each configuration and rate of change of configuration, (vii) metric accelerations at each configuration and the rate of change of configuration must be known before geodesic trajectories can be generated from anywhere to anywhere in the configuration manifold and (viii) the ability to generate geodesic trajectories from anywhere to anywhere within the configuration manifold is needed before minimum-effort synergy submanifolds spanned by geodesic trajectories embedded in the configuration manifold can be generated.
Based on this mathematical insight, we propose, here, a natural sequence of motor development underlying the ability of the mature nervous system to plan and initiate a goal-directed, minimum-effort, coordinated movement within a reaction time interval. The computations implemented by the mature system are already detailed elsewhere [6,7,9,15]. Here, we focus on the developmental sequence itself and the accumulation of data necessary for forming minimum-effort synergies that overcome the degrees-of-freedom problem while also compensating for mass–inertia loads that change with the changing configuration of the body.

3.1. Fetal Movements Bootstrap Motor Development

Fetal movements have long been of interest to scientists and expectant parents alike. But detailed knowledge of these movements was very limited until the development of ultrasound imaging allowed ground-breaking studies to occur, beginning in the 1980s. Whereas mothers could usually only say that the baby is “kicking”, ultrasound scanning revealed a large repertoire of different coordinated fetal movements occurring spontaneously and in no fixed order [16,17,18]. These are considered “endogenous”, arising from pattern-generator signals produced by the developing motor nervous system. Remarkably, and with obvious exceptions such as breathing, there is no change at birth between movements of the fetus and those of the neonate. The movements of a newborn are the same movements they were making in utero [19,20]. This situation continues until qualitative changes in the pattern-generator movements begin to be observed around the end of the second post-term month [21] (note that the timing for a premature baby is not from when they were born but from when they were due to be born). In addition, subsequent to that come the first movements that can be interpreted as visually goal-oriented (e.g., reaching towards a suspended toy). Thus, during the third post-natal month, a major developmental change is observed to occur [18,21].
What does that change entail? We see the pattern-generator movements of the fetus and neonate as being the “bootstrap” movements for establishing sensory–motor relationships. Their nature and distribution suggest that they are generated randomly, as if by a random number pattern-generator selection code. Starting with these bootstrap movements, the associated efference copy and sensory feedback provide the data that allow the developing fetal and neonatal brain to remove redundancy from millions of receptors to form cortical sensory maps [22]. Descending motor pathways are modulated by supraspinal influences associated with intended reafference [23]. The cortical motor and sensory signals encoded within these cortical sensory maps provide the developing nervous system with input and output signals for modeling the transformations between outgoing motor commands, muscle tensions, elemental movements and other sensory consequences associated with the spontaneous fetal and neonatal pattern-generator movements. In other words, the bootstrapping pattern-generators are laying the foundation for the nervous system to model the relationship between motor efference and the consequent sensory reafference.
During the major developmental change that begins around the third month, the baby starts to transition from pattern-generated movement to voluntary purposive goal-directed movement. Other processes are clearly coming into play, in keeping with the well-understood increasing myelination of the developing brain [24]. We propose that the transition to goal-directed movement is enabled by the myelination of the cortical–basal ganglia–cortical and cortical–cerebellar–cortical pathways where, according to our previous work [15], neural adaptive filters are able to form both forward and inverse models of the nonlinear dynamic relationships within and between sensory and motor signals. The gradual establishment of these relationships allows the baby to switch away from pattern-generated movements, replacing them with movements initiated by trajectories of the “desired” sensory consequences of those movements. Thus, a pattern-generator movement that, by chance, moved the baby’s arm in the direction of a toy becomes the basis for building the sensory–motor relationship that will subserve voluntary goal-directed reaching. Our account of this important occurrence in motor development draws strongly on our earlier work on adaptive feedforward–feedback movement control. To maintain the continuity of our present geometrical proposals on synergy selection, a description of the neural adaptive filters involved in this transition is set out in Appendix A. As indicated there, the random pattern-generator selection code operating in the fetus and neonate is gradually replaced by a synergy-generator selection code. This code is associated with the adaptively tuned parameters that modulate basal ganglia and cerebellum forward and inverse transformations of orthogonalized sensory and motor feature signals associated with the selected movement synergy. In other words, the code specifies parameters that apply not only to the selection of an appropriate synergy but also to its implementation, as shown in Figure A1 of Appendix A.

3.2. Movement–Muscle Relations and Mass–Inertia Loads

The nervous system has to tune its models relating changes in elemental movements of the body with associated changes in the lengths of functional muscles. Clearly, it is necessary to fine tune which muscles control which elemental movements. But this is not a simple relationship because each functional muscle operates across multiple elemental movements and each elemental movement is acted upon by multiple functional muscles. Moreover, the leverage of each functional muscle across each elemental movement changes with body posture [25]. It also has to learn the relationships between the tensions generated by functional muscles, the length changes of functional muscles and the resulting changes in elemental movements. These relationships are determined by the mechanical loads on the muscles and these loads change with posture, the distribution of support forces on the body and other mechanical interactions between the body and the environment. In other words, nonlinear changes in mass–inertia loads about each elemental movement associated with changes in the configuration of the body and with growth of the body have to be taken into account.

3.3. Modeling Movement–Muscle Relations

Elsewhere, we have described the design of nonlinear adaptive filters requiring only a small number of adaptive parameters [15]. We contend that the nervous system is able to adaptively model the nonlinear relationships between small changes of elemental movements and the nonlinearly correlated small changes in the lengths of functional muscles in different postures of the body. Basically, this means establishing the nonlinear polynomial relationships between small changes in each elemental movement detected by joint capsule, ligament and skin receptors with the nonlinearly-correlated small changes in the lengths of functional muscles detected by muscle spindle endings. Importantly, this modeling has to occur slowly over many weeks so that short-term correlations between elemental movements can be averaged out.
The positive or negative sign of the modeled relationships between small changes in elemental movements and small changes in muscle lengths defines whether the muscle is an agonist or an antagonist about each elemental movement. These relationships vary with posture. The variation in the relationships with posture encodes the way the leverage (or moment arm) of each functional muscle varies with posture for each elemental movement. This relationship is important because, for minimum-effort movements, the agonist and antagonist muscles across each elemental movement must be activated in proportion to their leverage about that movement [25]. Such adaptive modeling forms part of motor development initiated by fetal pattern-generator movements as described above but continues beyond into maturity using coordinated movements initiated by trajectories of desired synergy-dependent reafference.

3.4. Modeling Mass–Inertia Loads

We further contend that the nervous system has the ability to obtain a measure of the mass–inertia load about each elemental movement and to establish the way this changes as a function of the configuration of the body. Making this measure is complicated because there are multiple agonist and antagonist muscles operating across each elemental movement and each of these muscles also operates across multiple other elemental movements, as described in Section 3.2. This means that the leverage of each muscle about each elemental movement changes with the positions and angles of multiple elemental movements (i.e., with body posture as described in Section 3.3). Moreover, the center of rotation for most synovial joints of the body changes with the angle of rotation. This means the muscles encounter both a mass load for translation and a moment-of-inertia load for rotation. The synovial joints mostly involve rotation. Other elemental movements, such as those of the face, tongue, larynx and scapular, mostly involve translation. Thus, in general, the mechanical load about any elemental movement consists of both a mass load and a moment-of-inertia load. We refer to this as a mass–inertia load. Mass–inertia loads are influenced not only by the mass distribution of the body itself but also by the anti-gravity support forces distributed across the surface of the body. For example, the mass–inertia loads about the ankle, knee and hip change dramatically between the swing phase and the stance phase of a walking cycle in association with a change in the distribution of support force from one leg to the other.
Golgi tendon organs encode the tension actively generated by each functional muscle acting across the elemental movement while joint receptors encode the coupled position and angle of the elemental movement. From these afferent signals combined with knowledge of body posture and sensed configuration of the body, the mass–inertia load about each elemental movement can be computed. This involves multiplying each of the tension afferent signals by the already computed leverage of each muscle about the elemental movement in the given posture. As described in Section 3.2, the positive or negative sign of the leverage indicates whether the muscle is acting as an agonist or an antagonist about the elemental movement in the given posture. Summing the tension signals scaled by the leverage gives the net tension (i.e., the coupled net force and net torque) applied about the elemental movement with the body in the sensed configuration. Since the translation and rotation of the elemental movement are coupled, they can be treated as a single movement variable. It is this movement variable that is encoded by joint receptors and represented in the cortical sensory map.
As detailed elsewhere [26], every voluntarily-generated movement and muscle tension is accompanied by a small amplitude 10 Hz oscillation known as an action tremor. The 10 Hz tremor is clearly detectable in the encoded elemental movement and muscle tension afferent signals. Computing the ratio of the amplitude of the 10 Hz tremor in the computed net tension signal to the amplitude of the 10 Hz tremor in the encoded elemental movement afferent signal gives a measure of the mass–inertia load on that elemental movement at that configuration of the body. This method of measuring the mass–inertia load on the elemental movement at a fixed configuration works because the 10 Hz frequency of the action tremor is well above the measured resonant frequency of the mass–spring properties of the mechanical load about each elemental movement, which is typically less than 2 Hz. Consequently, as is well known from second-order mass–spring dynamics, the relative amplitude of a 10 Hz tremor is dominated by the mass–inertia properties of the particular mechanical load.
This computation has to be repeated for every elemental movement in every configuration of the body. When collected together, the mass–inertia loads about all the elemental movements at each configuration take the form of a symmetrical positive definite 110 × 110 matrix (i.e., given 110 elemental movements of the body). However, the entries in these matrices vary as a function of the 116 variables, described in Section 2, defining the configuration of the body. In other words, a different mass–inertia matrix must be computed and stored in motor memory for each body configuration. From a Riemannian geometry point of view, as explained in Section 2.3, the mass–inertia matrix at each configuration of the body corresponds to the kinetic-energy metric at each point in the configuration manifold. The fact that the mass–inertia matrix changes from one configuration to another corresponds geometrically to the kinetic-energy metric changing from point to point in the configuration manifold and, as shown in Section 2.7, it is this change that is predominantly responsible for the curvature of the manifold changing from point to point.
Because of the large number of elemental movements and the large number of possible configurations of the body, a large amount of data corresponding to the mass–inertia matrices for all elemental movements in all possible configurations of the body (or at least for those configurations that have been experienced) has to be computed and stored. These data are acquired over time in a piecemeal manner. This accumulation is important because, as shown below, the geometric structure and shape of minimum-effort movement synergies depends on the mass–inertia loads and how they vary from point to point in the submanifold.
We return now to Riemannian geometry.

3.5. The Connection

Each tangent space T c C over the configuration c C , G is spanned by a set of 116 unit-length coordinate basis vectors 1 , , 116 tangent to the coordinate axes at each point c C , G . Let us call these coordinate axes x 1 , , x 116 . Because of the curvature of C , G , these coordinate axes x 1 , , x 116 are curvilinear (or at least the 110 coordinates corresponding to the elemental movements of the body and the coordinate corresponding to the vertical pitch of the head are curvilinear). Consequently, the unit coordinate basis vectors 1 , , 116 are not mutually orthogonal to one another. Knowing how these coordinate basis vectors change relative to each other from point to point in C , G provides important information, discussed below, about the geometrical structure of the configuration manifold. In each tangent vector space T c C the directional covariant derivative k j is defined to be the infinitesimal change in the coordinate basis vector j associated with an infinitesimal movement in the direction of the coordinate basis vector k . The resulting directional covariant derivative k j is a vector in the same tangent space T c C . Consequently, it can be written as a linear combination of the coordinate basis vectors 1 , , 116 spanning that space, that is,
k j = Γ j k 1 1 + + Γ j k 116 116
where the coefficients Γ j k i   i , j , k = 1 ,   , 116 are the same Christoffel symbols defined in Equation (5). These are called the coefficients of the connection at each c C , G and define the connection  .

3.6. The Covariant Derivative

Knowing the coefficients of the connection allows the metric acceleration  α α t of the movement trajectory α t to be computed at each point along the trajectory, taking the changing curvature of the configuration manifold C , G into account as in Equation (8):
α α t = 2 x i t 2 i + d x k d t d x j d t Γ j k i α t i
Summing Equation (8) over i , j , k = 1 , , 116 gives the covariant derivative  α α t in the form
α α t = α t f 2 α t , α t
where α t is the naïve Euclidean acceleration and f 2 α t , α t = d x k d t d x j d t Γ j k i α t i is the component of the acceleration attributable to the coordinate basis vectors 1 , , 116 spanning the tangent spaces T α t C along the trajectory α t changing relative to each other because of the changing curvature of the manifold and the associated curvilinear coordinates x 1 , , x 116 . The function f 2 α t , α t is known as the acceleration component of the geodesic spray field.
With knowledge of the configuration c and its rate of change c the acceleration vector field f 2 c , c can be computed (using Equation (8)) and stored in the so-called double tangent space T c T c C of the configuration manifold for every position c and velocity c in the state space T C . We hold that the nervous system is able to sense and encode the configuration c and the rate of change of configuration c at each moment in time along the trajectory α t . It follows that it has the information to pre-compute and store the geodesic acceleration vector field f 2 c , c in motor memory. Over time, the vector field f 2 c , c becomes an inherent part of the configuration manifold, continuously checked and adaptively updated through experience. It can be retrieved quickly from memory, simply by specifying the position c and the velocity c (i.e., the point in state space T C ).
From Riemannian geometry, the acceleration component f 2 c , c of the geodesic spray field at every c and c in the state space T C can be expressed in terms of the differential of the Riemannian metric tensor G c as follows:
f 2 c , c , w G c = 1 2 G c w c , c G c c c , w
where G c = d G c d c and w is an arbitrary fixed unit vector in T c C [27,28]. But as shown in Equation (4), it is only the mass–inertia matrix G 1 c and the orientation matrix G 3 c that change with position c C , G in the configuration manifold C , G . It follows that it is only changes in the mass–inertia matrix G 1 c and the matrix G 3 c from one configuration to another that are responsible for generating the acceleration component f 2 c , c of the geodesic spray field. A large amount of computation is required to pre-compute and store f 2 c , c for each point c , c in motor memory. It turns out that this acceleration vector f 2 c , c stored at every state c , c in motor memory is the key piece of pre-computed data needed to generate minimum-effort geodesic pathways within the configuration manifold.

3.7. Geodesic Trajectory Generator (GTG)

It has been shown experimentally that movement trajectories of the eyes, head, arms and legs are geodesic [29,30,31,32,33]. In our geometric theory, the notion of a geodesic trajectory generator plays an important role in the planning and execution of minimum-effort coordinated movements to achieve visual goals. From Equation (9), it can be seen that by setting α α t equal to zero, we obtain
α t = f 2 α t , α t
where α t is the Euclidean acceleration of the body along the geodesic trajectory. It is important to appreciate that experimental measurements are made in Euclidean space and so, experimentally measured accelerations of elemental movements correspond to naïve Euclidean measures of acceleration α t . While a geodesic trajectory has a constant metric speed α t G in the curved configuration manifold C , G , it appears, observationally, to accelerate α t along a curved pathway in Euclidean space.
Given initial conditions c 0 , c 0 and the pre-computed f 2 c , c for every point c , c , it follows from Equation (11) that a geodesic trajectory α t in the 116 D configuration manifold for the given initial conditions is easily generated within the nervous system simply by double integrating the acceleration component of the geodesic spray field α t = f 2 c t , c t along the pathway. This requires nonlinear feedback of f 2 c t , c t obtained from the association memory network across the double integrator for each computed c t and c t .
We have constructed and tested a Matlab Simulink simulation of the double integrator circuit using feedback of the pre-computed acceleration f 2 c t , c t at each point c t , c t along the geodesic pathway for a realistic two-jointed arm moving in the horizontal plane [9]. It works well and quickly generates geodesic trajectories in the curved configuration manifold. We call a neural circuit able to perform this double integration using feedback c t = f 2 c t , c t retrieved from motor memory a geodesic trajectory generator (GTG).
Such a GTG represents a feasible way to generate a geodesic trajectory from any specified initial state c t i , c t i to any specified final state c t f , c t f within the state space of the body (i.e., within the configuration manifold in motor memory). The existence of such a GTG accounts for the ability of the nervous system to employ previously acquired motor data to rapidly generate minimum-effort movement trajectories taking changing mass–inertia loads about elemental movements and the changing configuration of the body into account. This applies to the planning of all goal-directed movements and forms the basis of the geodesic synergy hypothesis [7]. While the notion of double integration is relatively simple, its implementation does, in fact, require a large amount of parallel neural circuitry because, to generate a geodesic trajectory in the 116 D configuration manifold, the double integration has to be performed simultaneously in parallel for each of the cross-coupled 116 coordinate axes spanning the 116 D configuration manifold C , G .

3.8. Geodesic Coordinate Axes

To generate a 3 D geodesic submanifold embedded in the configuration manifold C , G centred on a specified initial configuration c i C , G , all that is required is a synergy selection code  c i , e 1 , e 2 , e 3 where c i is the specified initial configuration and e 1 , e 2 , e 3 are three appropriately selected G -orthonormal initial unit-velocity vectors in the initial tangent vector space T c i C . Three unit-speed geodesic trajectories emanating from the specified initial configuration c i C , G can then be generated by the GTG using initial conditions c i , e 1 , c i , e 2 and c i , e 3 . The resulting three geodesic trajectories in C , G emanating from c i C , G form a system of three geodesic spherical coordinate axes emanating from the specified initial configuration c i spanning a 3 D submanifold embedded in the 116 D Riemannian configuration manifold C , G .
While three Cartesian coordinate axes are sufficient to specify a 3 D submanifold in Euclidean space, this is not the case in a curved Riemannian manifold. Because the Riemannian metric G c changes from point to point in the manifold, it follows that the curvature of C , G also changes from point to point in the manifold. Consequently, the submanifold itself is curved and the curvature changes from point to point in the submanifold. To completely specify the submanifold in C , G , a system of unit-speed geodesic grid lines covering all the points in the submanifold is required in addition to the three geodesic coordinate axes. These unit-speed geodesic grid lines change their shape as they trace out positively and negatively curved regions in the submanifold. The submanifold can bulge up or down and can expand or contract depending on the curvature.

3.9. Synergy Selection Code

The pre-computed data required to generate geodesic trajectories are stored in motor memory and are easily accessed by neural activity encoding the state c , c . Consequently, in general, a synergy selection code, for example, c i , e 1 , e 2 , e 3 for a 3CDOF synergy containing the initial configuration c i and a specified set of orthonormal velocity vectors e 1 , e 2 , e 3 in the 116 D tangent vector space T c i C at the specified initial configuration c i , is all the information needed for the GTG to generate a 3 D geodesic submanifold spanned by geodesic coordinate grid lines emanating from the initial configuration c i C , G in the 116 D configuration manifold C , G . The dimension of the submanifold can be varied between one and some small number N (less than 10, say) depending on the task. The computed submanifold embedded in the configuration manifold C , G centred around the specified initial configuration c i C , G can be stored in motor memory in association with the synergy selection code c i , e 1 , e 2 , e 3 used to generate it.
We are yet to consider how to arrive at a synergy selection code for a specific visuomotor task. However, first we must set out our geometric account of the processes by which a developing brain comes to achieve a stable representation of its 3D visual environment.

4. Visual Development

People moving about in a local environment can switch their gaze from object to object in the environment as they move. However, when an object is observed from a different place, its image on the retina changes profoundly. As preluded in Section 2.2, not only does the position of the object in the visual field change but so does its size, shape, outline, curvature, rotation, occlusions, velocity and acceleration. Yet, despite this cascade of changing retinal images when viewing from different places, the visual system is able to construct a representation of a stable 3 D visual environment and of the body in that environment. It can visualize performing tasks such as reaching to grasp a glass, navigating around objects or sitting in a chair, and so forth. Indeed, the ability to visualize the body or parts of the body moving in a stable 3 D visual environment to achieve some visual outcome would seem to be a prerequisite for selecting a multi-joint coordinated movement to achieve that visual outcome. But how does the nervous system do this? The brain has to learn to see. Building on our previous descriptions of the calculations involved [6,9], we focus here on the development of the visual system before moving to its role in selecting a movement synergy that is compatible with a particular visual task space.

4.1. The Intrinsic Geometry of Visual Space

What the eye tells the brain about the geometry of the 3 D Euclidean outside world is nonlinear. Light from objects in the environment is sensed by overlapping ganglion cell receptive fields in the retina known as hyperfields [34]. The size of an image on the retinal hyperfields decreases as the Euclidean distance increases between the object and the nodal point of the eye. Thus, as is well known, objects appear to shrink in size as they recede. In a previous paper [9], we set out how this intrinsic geometry of egocentric 3 D visual space corresponds to a 3 D Riemannian manifold with a metric g that decreases with increasing Euclidean distance from the egocenter.
We call the geometry of visual space “intrinsic” because it is essentially determined by the anatomical structure of the eye. In that earlier paper, we provided a schematic diagram of the human eye that can be consulted there for detail. It is based on the egocenter O which, measured with respect to an external reference frame, provides a measure of the egocentric place of the head in the environment. It illustrates the notion of a cyclopean gaze vector  r , θ , φ lying on a line between the egocenter O and any gaze point Q (see further on this in Section 4.4). The diagram also depicts an anatomical parameter (the angle alpha) that changes with growth of the head and the eye. We propose that the nervous system models this parameter adaptively over time as part of the visual developmental process.
The Riemannian metric g is likewise acquired through experience over time during development and is an essential part of learning to see. Knowledge of the metric g depends on learning how the size of the image of an object on each retinal hyperfield changes with Euclidean depth r . The metric g encodes the fact that the size of retinal hyperfield images change in proportion to the angle subtended at the nodal point of the eye by the object in the environment. For any constant-size object, this angle varies in proportion to the inverse of the Euclidean distance r between the nodal point of the eye and the object in the environment. Binocular stereoscopic vision and focus control enable the nervous system to sense depth of objects relative to the egocenter. Over time, the visual system models how the size of the image of an object projected onto each retinal hyperfield changes with Euclidean depth r . This allows the visual system to anticipate the changing size of hyperfield images as a function of Euclidean depth r , an ability that is readily demonstrated by optical illusions [35].
To express this geometrically, we introduce the 3 D visual space V , g . Each point r , θ , φ in V , g is endowed with the Riemannian metric g r , θ , φ that encodes how the size of each retinal hyperfield image changes in inverse proportion to Euclidean depth r . The angles θ , φ give the direction of gaze measured relative to the innate Euclidean coordinates X , Y , Z . The Riemannian metric tensor g r estimated at each point r , θ , φ in V , g is given by
g r = 1 r 2 1 0 0 0 1 0 0 0 1 .
Thus, the 3 D Riemannian manifold V , g with cyclopean coordinates r , θ , φ endowed with a Riemannian metric g r provides a representation of the warped 3 D visual space as seen from each place and posture with warping of the visual space attributable to the retinal image on each retinal hyperfield changing in size in proportion to 1 r with changing Euclidean depth r .
The distance r to the gaze point between the egocenter and the gaze point in Euclidean space is estimated by the brain using stereopsis and focus control. Stereopsis and focus control are the only depth perception mechanisms that depend solely on current afferent signals. Unlike some other forms of depth perception, they do not depend on a statistical analysis of past visual experiences of depth.

4.2. Gaze and Focus Control

The ability to shift the gaze from point to point in the 3 D Euclidean environment and to focus the image of the gaze point onto the fovea of each eye is a prerequisite for seeing. The control of eye rotation has wired-in synergies for controlling conjugate, vergence, vertical and internal–external rotation movements of the eyes in the head and a vestibuloocular reflex (VOR) system to stabilize gaze despite perturbations in the place and orientation of the head. Nevertheless, gaze and focus control still require development of task-dependent movement synergies in order to coordinate the conjugate and vergence wired-in movements of the eyes with control of the place and orientation of the head. Different coordinations with different numbers of degrees of freedom are required to saccade between gaze points depending on the positions of those gaze points in the 3 D environment relative to the place and orientation of the head. Thus, all the processes described in Section 3 for the development of task-dependent movement synergies apply equally to the development of gaze and focus control. Indeed, pattern-generator movements of the eyes together with spontaneous neural activity of the retinas occur in the fetus at about six months after conception and are frequently rehearsed by the fetal brain thereafter [18]. Gaze control appears to be functioning in the neonate, but the processing of the associated retinal visual images awaits further development.
As with motor development, our mathematical theory prescribes a logical sequence of visual development. For example, the control of gaze and focus (as above) has to develop before the cyclopean coordinates r , θ , φ for each retinal hyperfield during each fixed-gaze interval can be determined. The synaptic weights of left-eye and right-eye ocular dominance columns have to be tuned slowly over several weeks before hyperfield images during fixed-gaze intervals can be encoded. Hyperfield images during fixed-gaze intervals have to be encoded before they can be stored in partitions of visuospatial memory associated with place and posture of the body. Very many encoded hyperfield images have to be stored in each place and posture sub-memory before the sub-memories can be mapped onto each other. Maps between sub-memories have to be formed before a stable representation of the 3 D visual environment and of the body in that environment can be constructed. In the next sections, we consider these further processes.

4.3. Early Processing in the Primary Visual Cortex

Visual signals from the retinas are encoded by temporospatial patterns of neural activity. The temporal firing pattern of a single retinal ganglion cell encodes information about the intensity and spectral composition of light falling on the retinal receptive field of that cell. The signal in the axon of that cell encodes the image falling on the cell’s receptive field in the form of a pulse-frequency modulated train of action potentials. So, the question becomes the following: What developmental processes take place in the visual system during the first weeks after birth in order to extract meaningful information about the visual images falling on the retinas? We now show how the required information can be obtained by the gradual tuning of neural parameters derived from the changing temporospatial patterns of action potentials in the two million or so optic nerve fibers projecting to the primary visual cortex via the lateral geniculate nucleus (LGN) of the thalamus.
We define a retinal hyperfield to be a collection of overlapping, neighboring ganglion-cell receptive fields. While a retinal hyperfield is composed of overlapping ganglion-cell receptive fields, it is nevertheless microscopic in size, typically about 100 microns. Just as the diameter of ganglion cell receptive fields increases with eccentric distance from the fovea, so does the size of retinal hyperfields. The image falling on the hyperfield during a single fixed-gaze interval is encoded by the temporospatial pattern of action potentials in the bundle of ganglion cell axons associated with those overlapping ganglion-cell receptive fields. The transformation of interest is the relationship between the visual image falling on the retinal hyperfield during a single fixed-gaze interval and the temporospatial pattern of spike activity in the bundle of axons from those ganglion cells.
A hypercolumn in the primary visual cortex is defined to be a collection of about 90 mini cortical columns. We suggest that the primary developmental processing module consists of a pair of corresponding left-eye and right-eye retinal hyperfields (i.e., left and right retinal hyperfields with the same retinal coordinates relative to the fovea) and the cortical hypercolumn in the primary visual cortex to which the hyperfields project in a retinotopic manner [34]. In other words, we propose that activity in about 50–200 axons emanating from a single retinal hyperfield in the left eye connects to 10 left ocular dominance cortical columns in the hypercolumn. A similar connection occurs between the corresponding retinal hyperfield in the right eye to 10 right ocular dominance columns in the same cortical hypercolumn. We now describe the developmental tuning mechanism. For simplicity, we refer only to the left eye process, but we hold that the same process of synaptic tuning takes place in parallel for the corresponding right-eye retinal hyperfield and 10 right ocular dominance columns in the same hypercolumn.
The synaptic weights connecting the incoming axons to the first of the 10 left ocular dominance column tune slowly over several weeks according to a correlation-based Hebbian-like mechanism of synaptic plasticity. The correlation matrix between activity in the incoming axons is determined almost exclusively by the spatial frequency spectrum of the tens of thousands of hyperfield images experienced during the tuning period and this, in turn, is strongly influenced by the less than 10 Hz per degree spatial resolution of the visual system itself. The first left ocular dominance column exerts an inhibitory influence on the other nine left ocular dominance columns within the hypercolumn. This creates a winner-take-all mechanism that prevents the other left ocular dominance columns from tuning to the same dominant correlation matrix.
The second left ocular dominance column uses a similar mechanism to tune its synaptic weights to the next most dominant pattern of correlations. The same process continues for all 10 left ocular dominance columns. Consequently, the synaptic weights across the 10 left ocular dominance columns tune to form 10 rank-1 matrices with the 1 D vectors spanned by each rank-1 matrix being mutually orthogonal. This corresponds mathematically to a linear singular value decomposition (SVD) [36] of the tens of thousands of images falling on the left retinal hyperfield over the several weeks required to tune the synaptic weights.
Subsequently, the level of activity induced in each of the 10 left ocular dominance columns during a single fixed-gaze interval equals the coefficient in a linear combination of the 10 orthogonal stochastic feature vectors that span the matrix of axon activity induced by the image on that left retinal hyperfield during that single fixed-gaze interval. In other words, the level of activity induced in the 10 left ocular dominance columns corresponds to the 10 singular values in an SVD analysis. These 10 coefficients across the 10 left ocular dominance columns provide a linear encoding of the image on the hyperfield during the fixed-gaze interval.
The SVD and spatial spectral analyses just described are linear analyses and do not take nonlinear higher-order moments into account. But probability distributions of natural visual scenes are known to be non-Gaussian, revealing the existence of nonlinear higher-order moments [37,38]. We have shown previously that nonlinear non-Gaussian distributions can be taken into account by extending the SVD analysis using a small number of 60 additional adaptive weights compared to the large number of adaptive weights required for nonlinear Volterra or Wiener kernel filters [15]. This is achieved by taking advantage of the fact that the nonlinearity described by a second-order Volterra filter is equivalent to a linear filter in cascade with a squarer, while a nonlinearity described by a third-order Volterra filter is equivalent to a linear filter in cascade with a cuber [15,39,40]. Thus, by squaring and cubing the singular values encoded by the levels of activity in each of the 10 left ocular dominance columns and the 10 right ocular dominance columns, we obtain a set of 30 rank-1 linear and nonlinear filters that can be used to span the nonlinear matrix of axon activity encoding the image projected onto a left retinal hyperfield and, separately, the image projected onto the corresponding right retinal hyperfield.
A problem that has hindered the development of nonlinear adaptive filters for many years is that the nonlinear features are not mutually orthogonal and the correlations between them change from one visual scene to another. In the present proposal, correlations between the nonlinear features are removed by a three-parameter least mean square (LMS) Gram–Schmidt orthogonalizing filter. The filter tunes adaptively to remove correlations between the linear, second-order and third-order components of each nonlinear feature. This gives synaptic weights corresponding to 30 orthogonal rank-1 matrices encoding the linear and nonlinear features of the left retinal hyperfield image during each fixed-gaze interval and, similarly, for the right retinal hyperfield image.

4.4. Image-Point Vectors

During any fixed-gaze interval, the level of activity induced in the 30 left ocular dominance columns provides an encoding of the image projected onto the left-eye retinal hyperfield during that fixed-gaze interval. Similarly, the level of activity induced in the 30 right ocular dominance columns provides an encoding of the image projected onto the corresponding right-eye retinal hyperfield during that fixed-gaze interval. For simplicity, we refer to these sets of 30 levels of activity as left and right 30 D image-point vectors. These image-point vectors encode the corresponding left and right retinal hyperfield images during a fixed-gaze interval taking skewness and kurtosis of their probability distributions into account. This encoding of image features is sufficiently detailed to capture the fine detail in the images projected from a small neighborhood of a point in the environment onto its retinal hyperfield during each fixed-gaze interval.
The remaining 30 mini columns within each hypercolumn are binocular. Binocular columns within each hypercolumn encode the difference between the left and right image-point vectors, thereby providing a detailed measure of retinal image disparity between the corresponding left and right retinal hyperfield images. Retinal image disparity is employed in binocular depth perception. We estimate that about 5000 pairs of overlapping corresponding retinal hyperfields cover the retinas. Summarizing what has been said above, each pair of corresponding hyperfields projects in a retinotopic fashion to a cortical hypercolumn in the primary visual cortex. Each hypercolumn in the visual cortex tunes its synaptic weights independently and in parallel over several weeks. This enables each hypercolumn to extract two 30 D image-point vectors encoding the images projected onto its corresponding left and right retinal hyperfields during any single fixed-gaze interval. Thus, using parallel processing, all the hypercolumns in the primary visual cortex encode the entire visual image falling on the left and right retinas during each such interval.
With the gaze fixed on any point in the 3 D environment, the focus control system works independently in each eye to adjust the thickness of the lens so as to maximize the sharpness of the image projected onto each of the foveal hyperfields. The gaze control system ensures that the image at the gaze point is projected equally onto the left and right retinal hyperfields located at the centre of both foveas. Indeed, for foveal images, the gaze and focus control system adjusts the orientation of the head and the rotation of the eyes in the head so that the visual axes of the two eyes intersect precisely at the chosen gaze point. When this occurs, the difference between the left and right foveal image-point vectors is reduced to zero.
However, not all images project to the foveas. During a gaze interval, there will also be images from points in the environment that project to hyperfields located in the periphery of the retinas. With increasing retinal distance from the foveas, the amount of blurring (i.e., lack of focus) increases, as does the difference between the left and right image-point vectors. These differences cannot be reduced to zero by adjusting the visual axes. Rather, they provide a measure of retinal image disparity during each fixed-gaze interval. Marr [41] defined disparity to mean the angular discrepancy in the positions of the images of objects in the environment in the two eyes. Marr and Poggio [42] developed an algorithm to detect disparities using a stereo correspondence neural network or a local pattern-matching (local correlation) mechanism. Our proposal [9], summarized above and based on differences between left and right image-point vectors encoded by the binocular mini columns within each cortical hypercolumn, offers an alternative method for measuring disparity that places less demand on neural resources than the Marr and Poggio algorithm.
To compute the position in the environment of a given fixed-gaze point on the surface of an object, it is necessary to know the orientation of the head and the rotation angles of the eyes, along with the distance between the centers of rotation of the eyes. The cosine and sine rules from trigonometry then enable the computation of the Euclidean distance between the gaze point and the nodal point of each eye (i.e., a point at the back of the lens through which every beam of light passes in a straight line on its way to the retina). From this, the coordinates r , θ , φ for the gaze vector (a vector from a point midway between the eyes to the gaze point on the object) can be computed. These are called the cyclopean coordinates r , θ , φ for the gaze point. Actually, the trigonometry is slightly more complicated because the visual axis of the eye does not pass through the centre of rotation of the eye. So, as described in [9], we additionally have to know the angle alpha between the visual axis and the optical axis of the eye. The optical axis does pass through the center of rotation. Moreover, differences between the foveal retinal image and images on nearby left and right corresponding retinal hyperfields encoded by left and right image-point vectors within a hypercolumn provide sufficient information to compute the cyclopean coordinates r R , θ R , φ R and r L , θ L , φ L for nearby points in the environment that project onto the corresponding right and left retinal hyperfields. These points in the environment are slightly different. However, it can be noted that, while the visual system does not need to do so, the image-point vectors provide all the information necessary to accurately reconstruct the image on each retinal hyperfield. A small change in the coordinates r , θ , φ of the gaze point associated with a hyperfield image results in a change in the size and shape of that image on the hyperfield. In other words, there is a local one-to-one mapping between the image-point vector encoding the image falling on the retinal hyperfield and the coordinates r , θ , φ of the point in the environment projecting its image onto that hyperfield.
Thus far, we have dealt only with single fixed-gaze intervals. We have set out how, during each interval, each cortical hypercolumn works in parallel to extract image-point vectors encoding left and right images projected onto its corresponding left and right retinal hyperfields during each fixed-gaze interval. We have also set out how, during each interval, the coordinates r R , θ R , φ R and r L , θ L , φ L can be computed for the points projecting images onto those corresponding right and left retinal hyperfields. We now propose that during each fixed-gaze interval, these coordinates are held online with the corresponding left and right image-point vectors in each hypercolumn in the primary visual cortex. But this is only short-term storage. As soon as the next gaze interval occurs, these data in the cortical hypercolumns are replaced by the encoded image-point vectors and gaze coordinates for the next gaze point. There is, therefore, a need for more permanent visuospatial memory.

4.5. Place-and-Posture Encoding of Visual Images

Retinal hyperfield images of objects in the environment change with the place of the head in the environment but not with posture, while retinal hyperfield images of parts of the body change with posture but not with place. We call these arrays of stored retinal hyperfield images of the environment and of the body in that environment place-and-posture encoded visual images.
We propose that a crucial aspect of visual development is the building of a long-term visual memory partitioned by both place and posture. Each place-and-posture partition of visuospatial memory contains the place-and-posture encoded retinal hyperfield visual images (i.e., image-point vectors) of the entire 3 D environment and of the body in that environment as seen through visual scanning of the environment and of the body from that place and posture. This scanning occurs in a piecemeal fashion with images stored in the appropriate partition of visuospatial memory every time the person passes through that place and posture. As the person moves about, stored images will update when overlapping hyperfield images with a smaller left-eye–right-eye disparity replace those with a bigger left-eye–right-eye disparity. In this way, the spatial resolution of the stored retinal hyperfield images improves as the number of gaze points increases.
As with motor memory, a large number of place-and-posture encoded images must be accumulated through experience during visual development. We propose that these images are stored in partitions of visuospatial memory, each associated with a particular place and posture. We now show below that these partitions have the geometric structure of a vector bundle. We will then show further that, by means of vector bundle morphisms, the construction of maps between these partitions can provide a stable 3 D representation of the entire visual environment and of the body in that environment as seen from any place and posture.

4.6. A Vector Bundle Model of Visuospatial Memory

Each partition of the visuospatial memory proposed above can be defined in terms of a mathematical object known in Riemannian geometry as a vector bundle. Each vector bundle consists of a base space V , g covered by a vector space E where g is a Riemannian metric on the 3 D representation of the egocentric 3 D visual space V within each place-and-posture partition of visuospatial memory. Introduced in Section 4.1, V , g is a 3 D egocentric gaze-based Riemannian manifold with the ego at the origin and with coordinates r , θ , φ corresponding to points in the 3 D environment for each retinal hyperfield with the head at a fixed place and the body in a fixed posture. The orientation of the head at each place and posture is absorbed into the gaze vector r , θ , φ . Actually, the geometry of the visual space V and metric g are the same in each partition of visuospatial memory but the image-point vectors change from one place and posture to another. In other words, visual images change profoundly when observed from different places and postures but the geometry of the egocentric 3 D visual space V is an intrinsic property of the visual system and remains unchanged.
As just described, the 3 D visual space V , g encoded within each partition of visuospatial memory is the base of the vector bundle while E is the total space of the vector bundle. E includes the disjoint union of all the 30 D vector spaces containing 30 D image-point vectors over all the points r , θ , φ in the base 3 D visual manifold V , g . Each vector space E q = π 1 q is called a fiber of E over q = r , θ , φ and contains the superposition of the encoded left-eye and right-eye retinal hyperfield images corresponding to the gaze point at r , θ , φ in the environment associated with that place and posture. The left- and right-eye image-point vectors derive from the same point in the 3 D environment. Csuperimpose at each q = r , θ , φ point in the base space of each vector bundle. Small differences can occur between the two vectors due to the fact that each eye views the point in the environment from a slightly different angle and because the left and right retinal hyperfield images are located at slightly different places on the retinas. The presence of a large disparity leads to double vision. When all of the fibers E q = π 1 q at all of the points q in the warped 3 D visual space V , g within a partition of visuospatial memory are taken together, we obtain a visual encoding of the entire 3 D environment and of the body in that environment as seen through visual scanning from that place and posture.

4.7. Vector Bundle Morphisms

Maps between vector bundles are known in differential geometry as vector bundle morphisms. We propose that it is this feature of Riemannian geometry that can account for the ability of the visual system to integrate a diverse collection of visual images, seen from different places and postures and differing in size, shape, outline, curvature, rotation, occlusions, velocities and accelerations, into a representation of a stable 3 D visual environment. By forming maps (i.e., vector bundle morphisms) between each and every stored place-and-posture-encoded collection of visual images (i.e., between every vector bundle place and posture partition of visuospatial memory), the nervous system is able to transform images of the environment and of the body in that environment as seen from one place and posture into the visual images as seen from any other place and posture. This allows the filling in of occlusions and the construction of a stable 3 D visual environment as seen from any place and posture. More than this, the nervous system is able to generate a visualization not only of a stable 3 D visual environment but also of the body (or parts of the body) moving within that environment.

5. Visuomotor Integration

From here on in this paper, we address the question of how the nervous system can use the large amount of visual and motor data acquired during development stored in visual and motor memory to plan and initiate, within a reaction time interval, minimum-effort, multi-joint, coordinated movements to achieve visual goals.

5.1. Accessing Visual and Motor Memory Simultaneously

In Section 2 and Section 3, we found that according to the theorems of Riemannian geometry, a minimum-effort trajectory in the configuration manifold connecting any given initial configuration to any given final configuration is a geodesic trajectory. We also found that to generate a geodesic trajectory from anywhere to anywhere within the configuration manifold, a geodesic trajectory generator (GTG) requires access to the pre-computed acceleration component of the geodesic spray field f 2 c , c at every point c , c in the tangent bundle T C of the manifold. Indeed, all the data pre-computed and stored in motor memory are prerequisite to the computation and storage of the all-important acceleration component f 2 c , c of the geodesic spray field at every point c , c in the tangent bundle T C . But as described in Section 2.5, each point c , c in the tangent bundle T C corresponds to the state (i.e., configuration and rate of change of configuration) of the body moving in the 3 D Euclidean environment. Thus, the state c , c of the body provides the accession code required to retrieve the appropriate acceleration vector f 2 c , c from motor memory.
Keep in mind, however, that the configuration manifold C is defined to be the 116 D space C = Θ × P × O equal to the Cartesian product of the 110 D posture space encoded by the temporospatial activity of neurons in the somatosensory cortex together with the 6 D place and orientation of the head in the 3 D Euclidean environment encoded by temporospatial activity of neurons in the hippocampus and entorhinal cortex. Thus, according to our proposed geometric theory, a combined temporospatial pattern of neural activity encoding posture, place and orientation as well as the rate of change of posture, place and orientation provides the accession code able to retrieve, from motor memory, the appropriate temporospatial pattern of neural activity encoding the geodesic acceleration vector f 2 c , c at that configuration and rate of change of configuration.
With respect to visual memory, as described in Section 4, we claim that through visual scanning, the encoded retinal hyperfield images associated with every point r , θ , φ in the environment, as seen from each place and posture of the body in the 3 D Euclidean environment, are encoded within partitions of visuospatial memory. Each partition is associated with (or accessed by) the sensed posture and place of the body with the orientation of the head absorbed into the gaze coordinate r , θ , φ within each partition. In other words, the configuration c encoded by temporospatial neural activity in the somatosensory cortex plus the temporospatial activity in the hippocampus and entorhinal cortex functions as the accession code required to retrieve, from visual memory, all of the place-and-posture-encoded visual images of the environment and of the body in that environment as seen from each place and posture.
With respect to visuomotor integration, it is important to appreciate that specification of the temporospatial pattern of neural activity encoding the state c , c of the body in the environment retrieves the appropriate geodesic acceleration vector f 2 c , c from motor memory and, at the same time in parallel, the configuration c contained in the state c , c retrieves from visual memory the appropriate place-and-posture encoded visual images associated with that state c , c . In other words, a single combined temporospatial pattern of neural activity derived from the hippocampus, entorhinal cortex and somatosensory cortex encoding the state c , c of the body in the environment retrieves, from the large amount of data stored in visual and motor memory, the particular visual and motor data appropriate for the particular state c , c . The induced neural activity in the networks converges to an attractor state associated with both the stored motor and stored visual data associated with the state c , c . In other words, the configuration and rate of change of configuration provide rapid access to both the visual and motor data associated with the specified state c , c . The question now becomes the following: How does the nervous system use this store of encoded visual and motor data to transform a given visual task space into an appropriately coordinated, minimum-effort, multi-joint movement to achieve the given visual goal?

5.2. Visual Task Spaces

Natural behavior can be broken down into a sequence of subtasks or action modes. Animals switch rapidly from one activation mode to another with minimum overlap between them [43,44,45]. Each action mode requires the selection of a specific subtask-related movement synergy. For example, reaching and grasping requires a particular movement synergy, drawing on a blackboard requires a different movement synergy, walking up steps requires yet another movement synergy, riding a bicycle another, and so on. Each subtask is defined by an evolving sequence of sensory challenges presented by the changing environment as the person moves about within it. The place-and-posture encoded visual image of the body in its current initial configuration c i C , G is needed because that is where the movement has to start from (or at least, it has to start from the initial configuration of the body predicted ahead by the reaction time interval required to plan and initiate the movement). Also needed are sufficient other place-and-posture encoded visual images of the environment and of the body in that environment to specify the rest of the visual task space appropriate for the given visual challenge. It is important to notice that the visual task space has to be specified first before visual goal-directed submovements confined to that task space can be planned and performed.

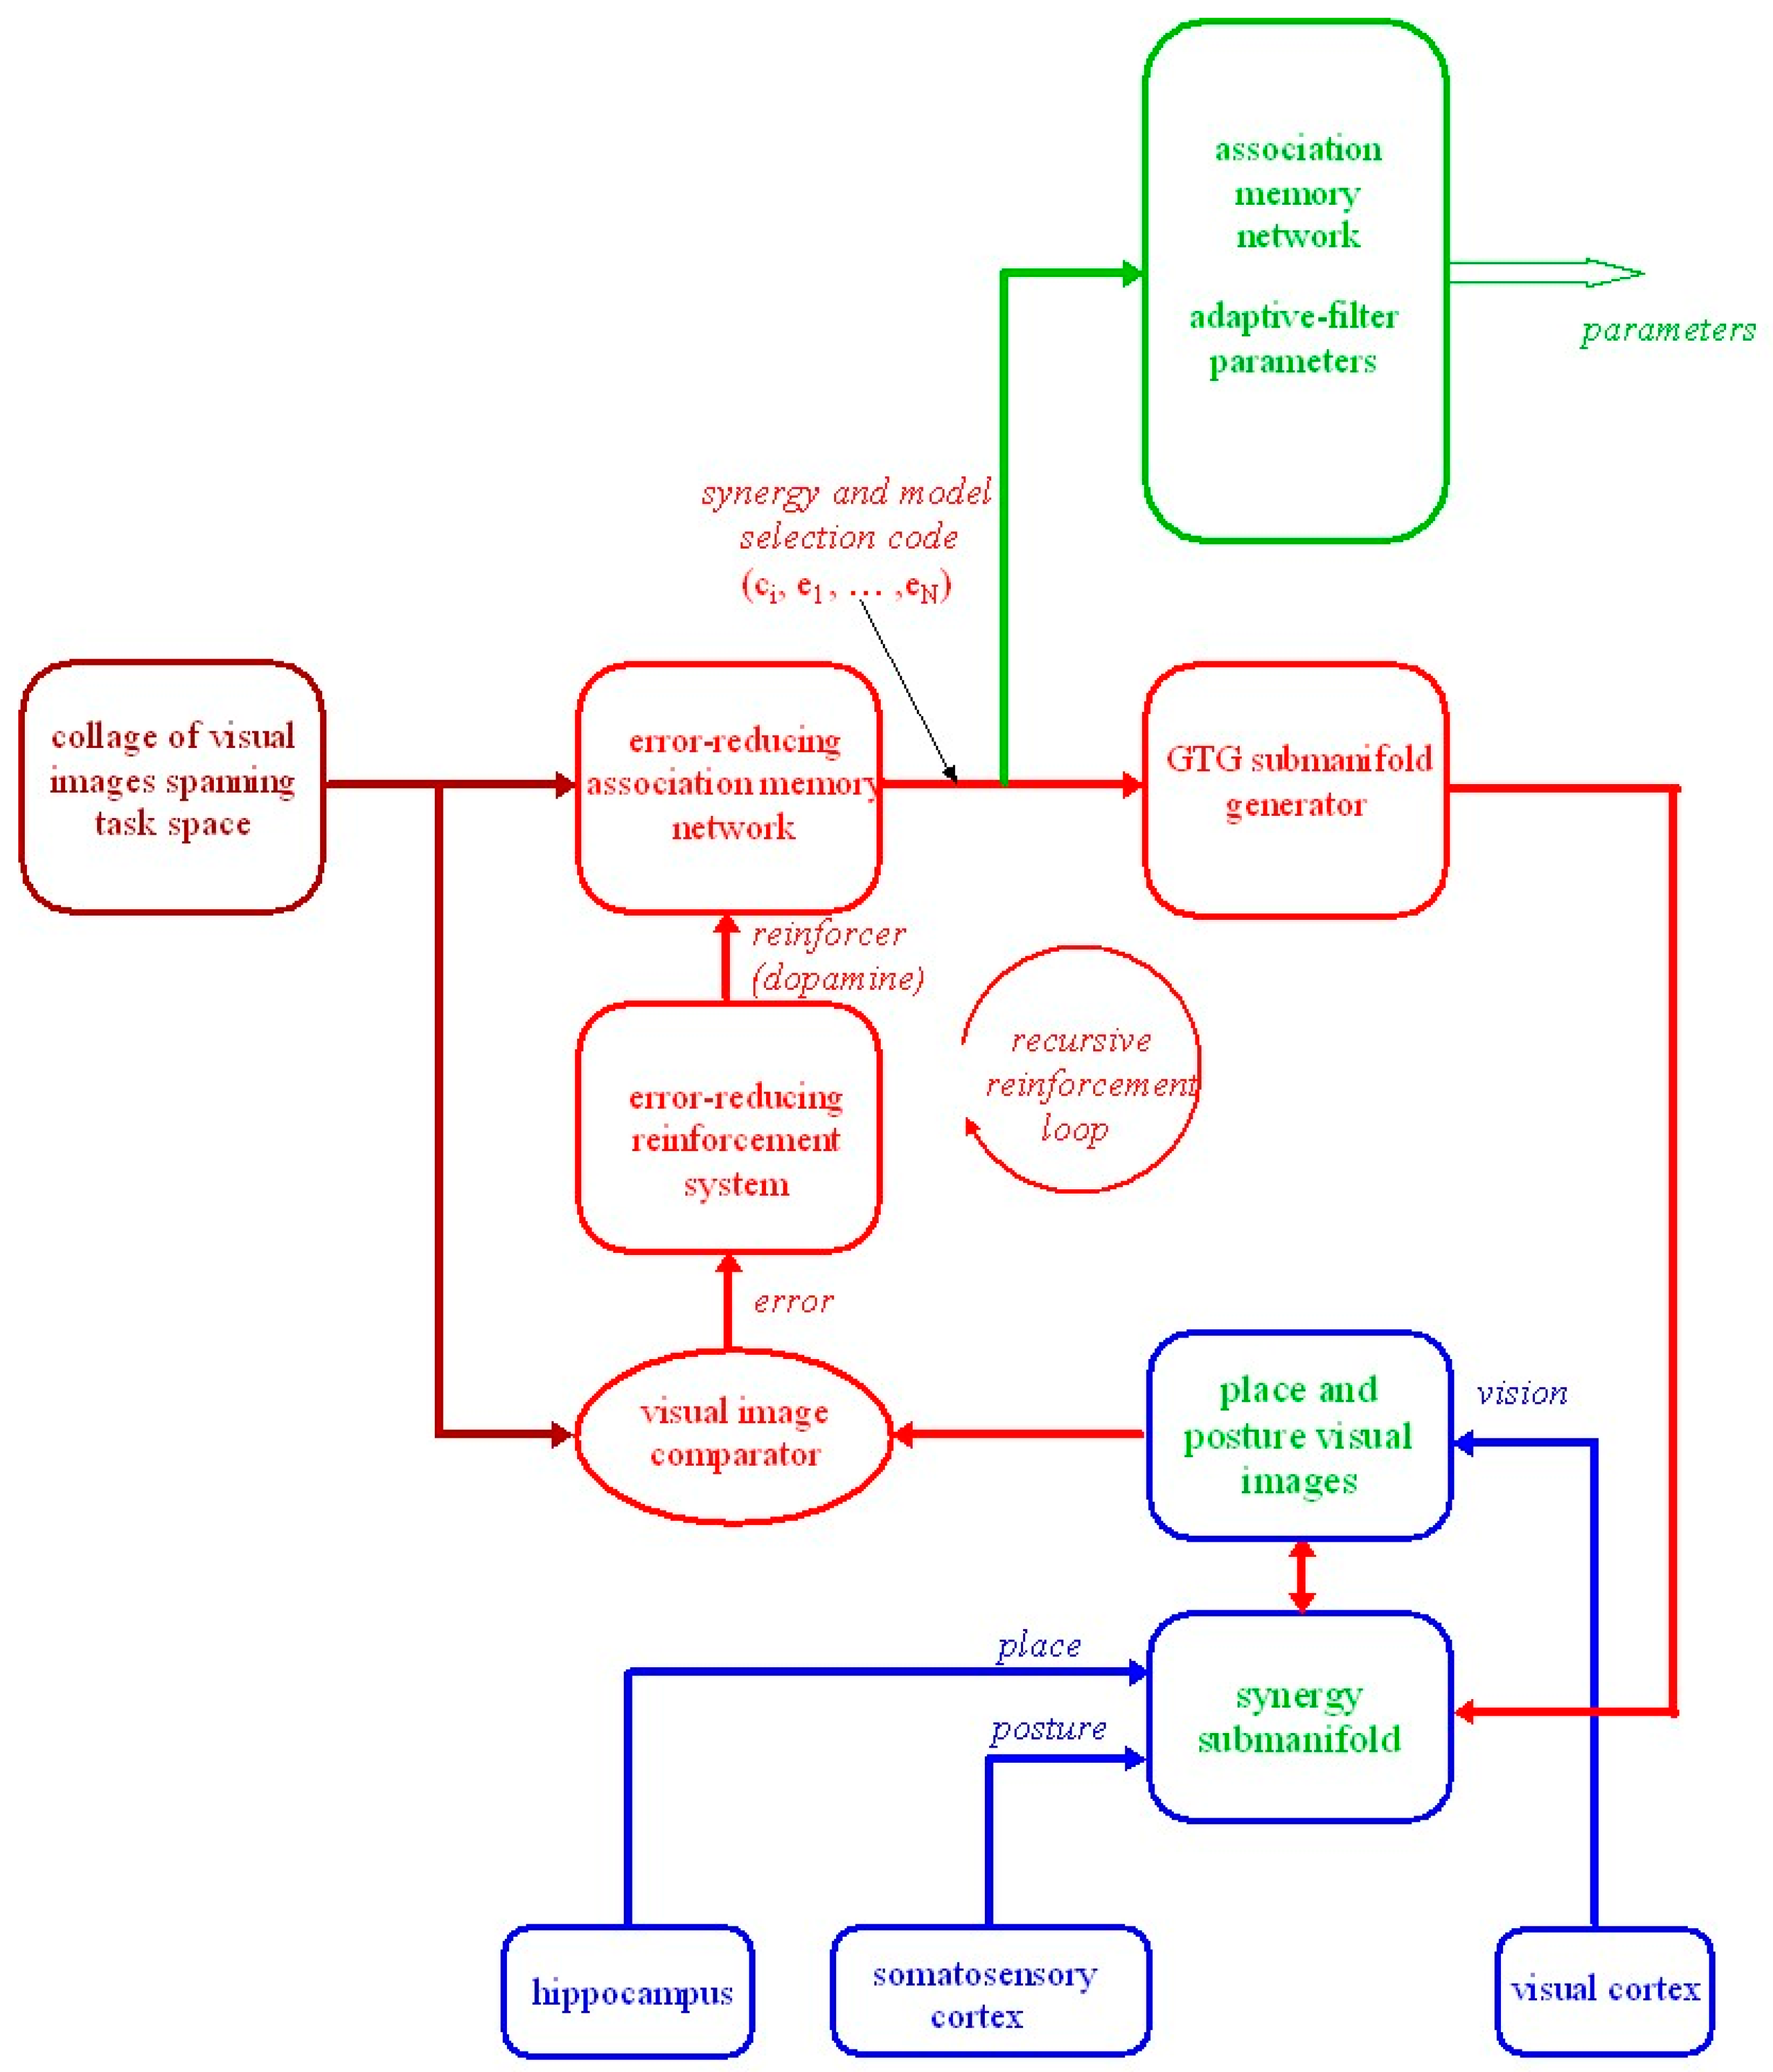
5.3. Transforming Visual Task Spaces into Synergy Selection Codes

As just described, according to our proposed geometrical theory, a given visual task space is specified by a selected collage of place-and-posture encoded visual images that span the task space. We claim that these visual images are held on-line in working memory in the frontal part of the brain. Another temporospatial pattern of neural activity representing a synergy selection code  c i , e 1 , e 2 , e 3 (described in Section 3.8 and Section 3.9) is also held on-line in working memory in the frontal part of the brain. Together, these patterns of neural activity drive an error-reducing association memory network distributed throughout the cerebral cortex and including cortical–basal ganglia–cortical pathways. This network links the selected collage of place-and-posture encoded visual images held in working memory with a synergy selection code also held in working memory. The process is equivalent to the notion of pattern completion in Kohonen and Hopfield neural networks. The error-reducing association memory network associates the collage of place-and-posture encoded visual images defining the required visual task space with an appropriate synergy selection code that provides all the information needed either to construct a new synergy submanifold embedded in motor memory, or to retrieve from memory and update an already partly constructed synergy submanifold, else to retrieve from memory an already completed synergy submanifold. Over time, during development and onwards, driven by imitation, trial and error and coaching, the nervous system increases its repertoire of associations between given collages of place-and-posture encoded visual images spanning visual task spaces and appropriate synergy selection codes (e.g., c i , e 1 , e 2 , e 3 ).
Using the method described in Section 3.8 and Section 3.9 for generating geodesic submanifolds, the GTG can use the information contained in the synergy selection code to generate and store the corresponding geodesic submanifold into motor memory. Since the submanifold is embedded in the 116 D configuration manifold C = Θ × P × O , it follows that every point in the generated submanifold corresponds to a place and posture in the configuration manifold. Thereby, it is associated with a place-and-posture encoded visual image of the environment and of the body in that environment as seen from that place and posture as described in Section 4.5. If the correct synergy has been selected, the place-and-posture encoded visual images associated with place-and-posture points in the generated submanifold will match the specified visual images in the specified collage of place-and-posture encoded visual images spanning the visual task space.
The place-and-posture encoded visual images associated with places and postures (i.e., points) in the generated synergy submanifold retrieved from visuospatial memory are compared with the collage of place-and-posture encoded visual images specifying the required visual task space held on-line in working-memory. When the correct synergy selection code is selected, the images match. Comparing encoded 3 D visual images is not a simple matter. However, the nonlinear SVD encoding of left and right retinal hyperfield images during each fixed-gaze interval (Section 4.2 and Section 4.3) provides an efficient high-resolution image-point vector encoding of hyperfield images that facilitates accurate image comparison.

5.4. Error-Reducing Association Memory Network

The error-reducing association memory network includes a large number of cortical neurons of different types and sizes interconnected both vertically and horizontally in both forward and backward reciprocal directions by both adaptive excitatory and inhibitory synapses. Most of the neurons in the network have correlation-based stabilized Hebbian-like molecular mechanisms of synaptic plasticity. Vertical connections dominate, forming a network of mini cortical columns across the six layers of the neocortex. Cortical columns are reciprocally interconnected both locally and across different regions of the cortex through association fiber tracts. The network also includes cortico–subcortical–cortical loops through parts of the basal ganglia. Multiple recurrent pathways within the network have different loop transmission time delays caused by varying numbers of synapses within loops. These multiple time-delay feedback interconnections produce 20–40 Hz bursting patterns of activity in cortical columns and cause lightly damped oscillations or waves of bursting activity to spread through the network. Depending on the sensitivities of synapses throughout the network, the temporospatial pattern of activity induced in the network by the neural activity held online in input and output working memories converges to a stable pattern called an attractor state of the network. This induces a stable temporospatial pattern of activity in the output working-memory buffer. Thus, depending on the attractor dynamics of the network, the temporospatial pattern of activity in the input working memory is associated with a temporospatial pattern of neural activity in the output working memory. This is a phenomenon referred to as pattern completion. Thus, temporospatial patterns of input activity become associated with temporospatial patterns of output activity. The large size of the network allows many different attractor states to coexist.

5.5. Temporal Difference Learning

A key property that enables the network to function as an error-reducing association memory network is the fact that the adaptive modification of synaptic weights within the network happens only when dopamine is present. A reduction in the visual-image error signal from one learning cycle to the next (i.e., negative temporal difference in error) is rewarded by release of a short burst of dopamine onto neurons throughout the memory network [46,47,48]. Thus, synaptic modification driven by neural activity within the network occurs only in association with a reduction in the mismatch between the collage of place-and-posture encoded visual images held in the input working memory and the place-and-posture encoded visual images retrieved from visuospatial memory by the synergy selection code in the output working memory.
Over time, through imitation, trial and error and coaching, the nervous system accumulates a repertoire of associations between collages of place-and-posture encoded visual images specifying visual task spaces and appropriate synergy selection codes. The synergy selection code retrieves from memory the synergy submanifold embedded in the configuration manifold that is compatible with the given visual task space. This error-reducing association memory network forms the basis of a neural, model-based, recursive, reinforcement learning mechanism [47,49,50] for associating specified visual task spaces with appropriate synergy selection codes. A schematic diagram of this reinforcement learning is shown in Figure 1.

6. Geodesic Trajectories

In Section 5, we have set out the means for selecting the appropriate synergy to accomplish a particular visual task. We now consider issues concerning the generation of minimum-effort geodesic trajectories that span the appropriate synergy submanifold.

6.1. Complications in Generating a Geodesic Trajectory

We begin with the fact that planned geodesic trajectories must not only take into account the changes in mass–inertia load incurred as the body moves but they must also allow for the effects of gravity and any other external force fields. Planning multi-joint minimum-effort coordinated movements to achieve sensory goals such as walking up steps, standing up from a chair or rolling over in bed is complicated by the fact that the mass–inertia loads about elemental movements change with posture and with changing distributions of support forces across the surface of the body. This problem was set out earlier with our proposed solution that compensation for changing mass–inertia loads can be achieved by computing and storing in motor memory the geodesic spray acceleration vector f 2 c t , c t at every configuration and rate of change of configuration of the body (Section 3.6). With this achieved during motor development, the geodesic trajectory generator (GTG) can employ feedback of the retrieved vector f 2 c t , c t to generate a minimum-effort geodesic trajectory from any specified initial position and velocity to any specified final position and velocity within the configuration manifold (Section 3.7). However, the task is not complete because gravitational forces and other external force fields also influence actual movement trajectories.
In classical mechanics, the computation of movement trajectories takes both kinetic energy and potential energy fields into account. Geodesic trajectories take only kinetic energy into account. They describe the natural motion of the body attributable to its changing mass–inertia characteristics. Potential energy fields, along with all other externally applied forces, cause the trajectory to accelerate away from the geodesic pathway. To maintain an intended geodesic trajectory, accelerations about each elemental movement caused by potential energy fields and externally applied forces have to be compensated for by muscle forces. We now show that accelerations that change in a predictable way can be pre-computed and added to or subtracted from the acceleration component of the geodesic spray field f 2 c t , c t to obtain the required acceleration in the presence of the potential energy field and/or external force field.

6.2. Compensating for Gravitational Forces

Movement in a gravitational field is an example where the acceleration can be predicted. However, the computation is not simple. The potential energy field V c is expressed as a real-valued function over the configuration manifold C , G as well as by the negative of its gradient vector g r a d   V c in every tangent vector space T c C at every point c C , G . In other words, to compensate for gravity, the torque attributable to gravity about every elemental movement in every configuration of the body has to be computed and stored. This is equivalent to learning, in a piecemeal fashion, through experience the net muscle tensions required about each elemental movement of the body to hold the posture of the body constant against gravity in every possible stable configuration. These data can be stored in motor memory. So, in the presence of a gravitational potential energy field V c , the natural motion of the body given an initial configuration and initial velocity c 0 , c 0 will have Euclidean acceleration c ¨ t = f 2 c t , c t g r a d   V c t . To follow a geodesic pathway with c ¨ t = f 2 c t , c t in the presence of a gravitational field, g r a d   V c t has to be added to c ¨ t to obtain c ¨ t = f 2 c t , c t g r a d   V c t + g r a d   V c t . Thus, if the GTG employs feedback f 2 c t , c t + g r a d   V c t obtained from motor memory rather than just the acceleration component of the geodesic spray field f 2 c t , c t to generate required movement trajectories, then the specified accelerations g r a d   V c t are exactly cancelled by the gravitational potential energy field g r a d   V c t , leaving the actual trajectory equal to the geodesic pathway. We propose that, over time and through experience, the nervous system can compute and store in motor memory the gravitational vector field g r a d   V for every configuration of the body. This large amount of data is acquired gradually during motor development and updated as the body grows. Given these data stored for each configuration and rate of change of configuration, the effect of gravity can easily be compensated for when generating required geodesic trajectories.

6.3. Compensating for External Force Fields

There are many examples of functional movements that require the body to exert forces on objects in the environment, e.g., propelling a scooter, riding a bicycle or sweeping with a broom. Similarly, there are many examples where the environment exerts forces on the body, e.g., walking in a gale or being pushed by another person. For every action, there is an equal but opposite reaction. In differential geometry, an externally applied force corresponds to a horizontal differential 1-form on the tangent bundle T C (i.e., a horizontal differential 1-form is a 1-form on T C that varies with c in T C ) [27]. Thus, the multi-joint acceleration caused by an applied external force corresponds to a vertical vector 0 , Y 2 in the double tangent bundle T c T c C over the tangent bundle T C (i.e., a vertical vector Y 2 is an acceleration vector on T C that varies with c in T C ).
A vertical acceleration vector Y 2 induces a horizontal 1-form reaction force ω on T C and, conversely, a horizontal 1-form reaction force ω induces a vertical acceleration vector Y 2 on T C . Depending on the direction of the vertical acceleration vector Y 2 , the applied external force can either inject energy into the system or dissipate energy. For example, when pushing a child on a swing, if the push is applied in the direction in which the kinetic energy is increasing (i.e., the direction of increasing velocity), the push will inject energy, increasing the amplitude of the swing. On the other hand, if the push is in the direction opposing an increase in kinetic energy (i.e., in the direction that decreases the velocity), the push will dissipate energy and the amplitude of the swing will decrease.
A reaction force field F Y 2 = D 2 D 2 L q , v Y 2 corresponds to a map between velocities in the vector tangent space T c C and horizontal 1-forms ω in the cotangent space T c C for every configuration c C , G . This map is called an external force field. D 2 D 2 L q , v is the second differential of the Lagrangian L q , v with respect to the velocity v and the Lagrangian L q , v is equal to the difference between the kinetic energy K E and the potential energy V at every state c , c T C . The horizontal reaction force 1-form ω and the vertical external force acceleration vector Y 2 are related by the equation ω = C Y 2 Ω L = D 2 D 2 L q , v Y 2 v [27] where C Y 2 Ω L is the negative of the contraction of the Lagrangian 2-form Ω L by the external force acceleration vector Y 2 . This gives the horizontal external 1-form reaction-force field ω = F Y 2 v for every point c , c T C . Over time and through experience, external force acceleration vector fields Y 2 as a function of c , c T C can be obtained and stored in motor memory at every state c , c for a variety of different tasks with different external force fields. This corresponds to the development of motor skill for a variety of tasks with different external force fields such as skiing, riding a bicycle or sailing a boat.

6.4. Combining Compensation for Changing Mass–Inertia Loads, Gravitational Forces and External Force Fields

As described above, the acceleration component of the geodesic spray field f 2 c , c , the gravitational vector field g r a d   V c , c and the vertical external force acceleration vector Y 2 c , c can all be pre-computed and stored at the same site c , c in motor memory in association with the configuration c and the rate of change of configuration c . Thus, at each state c , c , the acceleration vector 0 , Y 2 of the externally applied force can be added and the gradient of the potential energy field g r a d V can be subtracted from the acceleration component f 2 c , c of the geodesic spray field to give the total acceleration vector X = f 2 c , c g r a d V c , c + Y 2 c , c for that state. The GTG can then employ f 2 c , c + g r a d V c , c Y 2 c , c retrieved from motor memory to generate geodesic movement trajectories that include compensation for predictable changing mass–inertia loads, predictable changes in gravitational forces and predictable changes in externally applied forces. If the prediction is correct, the muscles will generate the forces needed to exactly cancel accelerations caused by these gravitational and external forces and the resulting movement will correspond to the required minimum-effort geodesic trajectory.
Of course, in everyday experience, the body may encounter unexpected changes in mechanical load or be subjected to unpredictable external forces. The system can minimize the effect of these unexpected perturbations on posture and movement trajectories by (i) stiffening elemental movements through co-contraction of agonist and antagonist muscles, (ii) increasing the sensitivities of tonic stretch reflexes tuned to oppose deviations from pre-planned movement trajectories and (iii) forming triggered responses such as stumble responses, etc. While it is obvious that the developing nervous system ultimately achieves these strategies, it can also be seen from this geometric theory that a large amount of nonlinear computation and data storage has to take place during development for it to do so.

7. The Geometry of Submanifolds

7.1. Minimum-Effort Submanifolds

Opening cupboards, picking up objects and moving about from room to room may seem trivial exercises. But this is only because most of what the nervous system is doing is subconscious. Only when something goes wrong within the brain does one become aware of the complexity of what it is normally doing. Both vision and movement are nonlinear so, as described in previous sections, the nervous system has to accumulate in memory, through experience over time, a large amount of data for every configuration and rate of change of configuration of the body. The accomplishment of visually-guided tasks depends on there being, for every place and posture, an encoded store of the retinal hyperfield images of the environment and of the body in that environment as seen from that place and posture. From among these, the nervous system must select a particular collage of place-and-posture encoded hyperfield images to span a given visual task space. The visual task space often spans more than one degree of freedom.
Given a particular visual task space, the nervous system then has to generate a minimum-effort submanifold embedded in the configuration manifold of the body with dimension equal to the number of degrees of freedom in the visual task space. This minimum-effort submanifold must be such that movement trajectories confined within the submanifold produce movements of the body that are visually contained within the specified visual task space. How is this achieved by the nervous system? In this section, we examine how, according to our geometrical theory, this can be done.

7.1.1. Radial Geodesic Coordinate Grid Lines

As detailed in Section 3.8, to generate a 3 D geodesic submanifold embedded in the configuration manifold C , G centred on a specified initial configuration c i C , G , all that is required is the synergy selection code c i , e 1 , e 2 , e 3 where c i is the specified initial configuration and e 1 , e 2 , e 3 are three appropriately selected G -orthonormal initial unit-velocity vectors in the initial tangent vector space T c i C . The ability of the nervous system to generate minimum-effort submanifolds compatible with given visual task spaces depends on this ability to generate geodesic trajectories. As we have seen, this depends, in turn, on a large amount of data accumulated in motor memory over time during development. These accumulated data have to be continuously updated to take body growth and novel configurations of the body into account. Until a synergy submanifold for a given visual task space has been constructed, either the person is unable to perform the task or efforts to perform the task are clumsy. But once constructed and stored in memory, the task-related movement synergy can be retrieved by the synergy selection code without having to be reconstructed and, within a reaction time interval, the person can quickly and skilfully plan and initiate goal-directed submovements confined to the given visual task space.
According to our geometric theory, the minimum-effort submanifold compatible with the visual task space is constructed as follows. The G -orthogonal unit velocity vectors e 1 , e 2 , e 3 in the synergy selection code span a linear three-dimensional vector subspace in the 116 D tangent vector space T c i C at the initial configuration c i C , G . Unit-length radial vectors r pointing in every direction in this linear 3 D vector subspace are constructed. Then, c i , r for every unit radial vector r is used as an initial condition in the GTG to generate radial geodesic grid lines emanating in every direction in the 3 D submanifold from the point c i that pass through every point in the 3 D submanifold. Each unit speed geodesic grid line is parameterized by metric radial distance r (i.e., arc-length) along the unit speed geodesic curve. The arc-lengths of these radial geodesic grid lines have to be limited so they do not cross each other, as can happen if the submanifold is positively curved. The radial geodesic grid lines sweep out a 3 D submanifold embedded in C , G . They form the geodesic radial grid lines of a 3 D spherical coordinate system spanning the 3 D submanifold. Spherical coordinate systems have advantages over Cartesian ones. Not least is the fact that spherical geodesic coordinates correspond to so-called normal coordinates in a Riemannian manifold relative to which the Christoffel symbols Γ j k i equal zero at and only at the initial configuration c i C , G . In other words, relative to normal coordinates, the manifold appears flat at the initial configuration c i C , G ; that is, the curvature of the geodesics exactly compensates for the curvature of the submanifold at and only at the initial configuration c i C , G . This property of spherical coordinates can greatly simplify within fiber calculations at the initial configuration.

7.1.2. Transverse Coordinate Grid Lines

Transverse connecting grid lines on the submanifold are constructed by forming a system of concentric spheres with different radii r about the origin in the linear tangent vector space T c i C . When every point on each concentric sphere is mapped by an exponential map into the configuration manifold, a system of concentric closed ellipsoidal surfaces about the point c i C , G is obtained. This is equivalent to joining together all the points along all the radial geodesic grid lines that are an equal metric radial distance r from the origin. It is conventional to refer to these surfaces as geodesic spheres. The Gauss lemma from Riemannian geometry proves that, despite the changing curvature of the submanifold and the changing shape of the radial geodesic grid lines, these all intersect the geodesic spheres G -orthogonally just as radial lines intersect concentric spheres orthogonally in Euclidean space. Great circle pathways on concentric spheres in the tangent vector space T c i C map exponentially onto the geodesic spheres in C , G , forming transverse coordinate grid lines at equal metric distances r along the radial geodesic coordinate grid lines defining the submanifold. These transverse coordinate grid lines are not geodesics, just as latitude lines on a sphere in Euclidean space are not geodesics. Using the procedures in Section 6, the nervous system is able to transform a synergy selection code associated with a given visual task space into the required synergy submanifold spanned by geodesic trajectories appropriate for that visual task space.

7.2. Geometry of Submanifolds

We have now shown that using reinforcement learning, the nervous system can associate a collage of place-and-posture encoded visual images spanning a given visual task space with a synergy selection code able to generate a task-compatible submanifold spanned by geodesic trajectories embedded in the configuration manifold. Because of the properties of geodesics in a curved Riemannian manifold, the resulting submanifold not only corresponds to a minimum-effort movement synergy compatible with the given visual task space but, at the same time, compensates for changing mass–inertia loads about elemental movements associated with changes in posture and changes in the distribution of support forces across the surface of the body as well as for gravity and changing external force fields. To understand exactly how this is achieved, we need to understand in more detail the geometry of the embedded submanifold.

7.2.1. Curvature of Submanifolds

Any family of geodesics on a curved Riemannian submanifold either converge or diverge from each other at each point in the submanifold depending on whether the curvature of the submanifold is positive or negative, respectively, at that point. From Equation (10), it can be seen that whether the curvature is positive or negative depends on the differential G c of the Riemanninan metric at each configuration and this, in turn, depends on the rate of change of the mass–inertia load about each elemental movement at each configuration. A rapid increase in the mass–inertia load at a point in the submanifold is associated with a positive curvature of the submanifold at that point while a rapid decrease in the mass–inertia load at a point in the submanifold is associated with a negative curvature of the submanifold at that point. The bigger the rate of change in the mass–inertia matrix, the larger the absolute value of the curvature. Over time, the developing nervous system learns the mass–inertia loads about all the elemental movements of the body in all experienced configurations of the body. From these data, the differential G c associated with changes in mass–inertia load at each point in the submanifold is known. This is a large amount of information and a large amount of calculation over time is needed to obtain it. But without these data stored in memory during motor development, it is not possible for the nervous system to generate task-related, minimum-effort, geodesic movement synergies that take changing mass–inertia loads into account.

7.2.2. Jacobi Vector Fields

The theory of Jacobi vector fields in Riemannian geometry provides a way to compute the acceleration or deceleration of the divergence or convergence, respectively, at each point between local geodesics α s r in a 2 D submanifold embedded in the configuration manifold. In Riemannian geometry, the sectional curvature at each point c C , G corresponds to the Gauss curvature of a 2 D submanifold Γ r , s spanned by vectors α , η where α is the vector tangent to a radial geodesic α s r and η is a vector orthogonal to α , that is, tangent to the transverse coordinate at each point r , s . The restriction to 2 D submanifolds is not a serious limitation because any higher-dimensional submanifold can be decomposed into orthogonal two-dimensional component submanifolds. Using a Matlab simulation, we have shown [9] that a combination of orthogonal 2 D submanifolds spanning a 3 D space enables the geodesics to be constructed at every point in the 3 D space. This can be extended to higher-dimensional spaces.
2 D submanifolds spanned by vectors α s , η are known in differential geometry as 2 D variations through radial geodesics. Using the calculus of variations, the 2 D submanifolds are used to compute least-effort (geodesic) pathways between specified initial and final positions and velocities within the 2 D submanifold. The submanifolds possess the following mathematical properties:
α η = η α
η α , α G = 2 η α , α G = 2 α η , α G
α , α G = 1   a n d   α , η G = 0
α η η α = R α , η
Γ r , s s = η r , s

7.2.3. The Jacobi Equation

Consider any 2 D submanifold Γ r , s spanned by radial geodesics α s r with tangent velocity vectors α s r and G -orthogonal transverse coordinates with tangent velocity vectors η r s at every point r , s along each radial geodesic α s r . Because η and α are coordinate vectors, the Lie bracket η , α = η α α η is zero at each point r , s on Γ r , s . Thus, because the torsion of the Riemannian submanifold is zero, by definition, we can write η α = α η as in Equation (13). Taking a second covariant derivative with respect to α , we obtain α η α = α α η = α 2 η . The curvature endomorphism R α r , s , η r , s α r , s at each point r , s on Γ r , s is given by R α , η α = α η α η α α = α η α because α α = 0 since α is a geodesic as shown in Equation (9). Thus, using α η α = α α η , we can write R α , η α = α η α = α α η = α 2 η . This gives the well-known Jacobi equation
α 2 η = R α , η α .
This is an important equation. It shows that the second covariant derivative of η for infinitesimal changes in the direction α r along each radial geodesic α s r on the submanifold Γ r , s is equal to the curvature endomorphism R α , η α of the submanifold at each point r , s on the submanifold.
The Jacobi equation is a second-order tensorial differential equation. To solve it for a particular solution η r s along a radial geodesic α s r , we must specify two initial conditions z = η 0 and w =   α η 0 at r = 0 . Setting z = η 0 to zero ensures that all the unit speed radial geodesics α s r emanate from the same specified initial configuration c i C , G as required for polar coordinates on a 2 D submanifold. Setting w =   α η 0 to be G -orthogonal to α 0 ensures that both η r and α η r are G -orthogonal to α r for every point r along every unit speed radial geodesic α s r , thereby forming G -orthogonal polar grid lines emanating from the initial configuration c i C , G on the 2 D submanifold.
Given these initial conditions at r = 0 , we obtain polar coordinates on the submanifold with unit metric-speed radial geodesics α s r and vertical coordinate velocity vectors η r s that are G -orthogonal to the velocity vectors α r at every point along every radial geodesic spanning the 2 D submanifold Γ r , s . While we know from above that the velocity vectors η r s are G -orthogonal to the velocity vectors α r at every point along every radial geodesic α s r , to quantify the deviation or convergence of the neighboring radial geodesic, we need to know how the G -norm f r = η r G = η r , η r G 1 2 of the vertical velocity vector η r varies with the Riemann curvature tensor R m α , η , α , η at each point along each radial geodesic α s r .
Using differentiation by parts, we obtain the following equation for the acceleration f r of the G -norm f r = η r G :
f r = 1 η r G 3 α η G 2 η G 2 α η , η G 2 + 1 η r G R m α , η , α , η .
This equation is exactly what is needed to show how the G -norm f r = η r G of the vertical velocity vector η r everywhere orthogonal to every radial geodesic α s r accelerates or decelerates as a function of the Riemann curvature tensor R m α , η , α , η of the submanifold at each point r along each radial geodesic α s r . Since the vectors η r and α η r are both G -orthogonal to α at every point along each radial geodesic α s r for the given initial conditions z and w described above, it follows that η r and α η r are collinear and, hence, the first term in Equation (19) is zero. Thus, the acceleration f r of the G -norm f r = η r G at each point r along each radial geodesic α s r is given by the second term 1 η r G R m α , η , α , η in Equation (19) where R m α , η , α , η is the Riemann curvature tensor at each point. If the Riemann curvature tensor R m α , η , α , η at a point along a radial geodesic α s r is positive, then Equation (19) shows that the G -norm f r = η r G of the orthogonal η r is accelerating along r while if the Riemann curvature tensor R m α , η , α , η at a point along a radial geodesic is negative, then Equation (19) shows that the G -norm f r = η r G is decelerating along r .
Because of the convention chosen in Riemannian geometry for positive and negative curvature and because of the known symmetry properties of the Riemann curvature tensor, it turns out that a positive R m α , η , α , η corresponds to a negative (bowl-like) curvature of the submanifold at the point while a negative R m α , η , α , η corresponds to a positive (sphere-like) curvature of the submanifold at the point. From the symmetries of the Riemann curvature tensor, we know that R m α , η , η , α = R m α , η , α , η . Thus, Equation (19) shows that, if the curvature of the submanifold Γ r , s at a point along any radial geodesic α s r is negatively curved (bowl-like), then the local radial geodesics accelerate away from each other, while if the submanifold Γ r , s is positively curved (sphere-like) at the point, then the local radial geodesics accelerate towards each other.
If we imagine two objects moving along local radial geodesics then, if the local curvature is negative, the two objects diverge and accelerate away from each other. It is as if there is a local repulsive force acting between the objects (a type of anti-gravity). On the other hand, if the local curvature is positive, then the two objects converge and accelerate towards each other. It is as if there is a local attractive force between them. These forces are fictitious forces since the accelerations are actually attributable to the local curvature of the submanifold. These fictitious forces are often referred to as tidal forces.

7.2.4. Shape of Submanifolds

As shown in Section 7.2.3, setting the initial conditions to z = η 0 = 0 and w =   α η 0 to be G -orthogonal to α 0 at the initial configuration c i C , G , the Jacobi equation (Equation (18)) gives rise to a set of unit speed radial geodesics α s r emanating from the given initial configuration c i in every direction in the 2 D submanifold and with transverse vectors η r and α η r   G -orthogonal to α s r at every point along each radial geodesic α s r . In other words, the 2 D submanifold is spanned by a polar coordinate system with geodesic radial coordinates. The G -norm η r G of the transverse vector η r at position r along each radial geodesic vanishes at r = 0 but, as shown by Equation (19), its norm η r G either accelerates or decelerates at each point along each geodesic depending on whether the curvature of the submanifold at that point is negative or positive, respectively.
The curvature at each point is determined by whether the mass–inertia matrix is decreasing or increasing at each point with the magnitude of the curvature determined by the rate of change of the mass–inertia matrix. Remember, the mass–inertia load about each elemental movement changes not only with changes in body posture but also with changes in the distribution of support forces across the surface of the body and with other mechanical interactions between the body and the environment. The rapid rate of change of mass–inertia load on muscles of the legs during transitions from swing-to-stance and stance-to-swing phases of a walking cycle provides a nice illustration of such rapid changes. Generally speaking, the rate of change in the mass–inertia load varies from point to point within any submanifold. Therefore, in general, the curvature of the submanifold varies from point to point, being positive (sphere-like) in some regions and negative (bowl-like) in other regions. Consequently, the G -norm η r G of the transverse velocity vector η r decelerates along r in regions of positive curvature and accelerates in regions of negative curvature.
If the metric speed η r G is large, then the metric distance travelled in a fixed interval of time is large, and if the metric speed η r G is small, then the metric distance travelled in a fixed interval of time is small. Thus, in regions of negative curvature in the submanifold, the distance between neighboring radial geodesics will accelerate along the geodesic and, consequently, the neighboring geodesics will diverge away from each other. In this region, the submanifold expands. In regions of positive curvature in the submanifold, the distance between neighboring geodesics will decelerate along the geodesic and, consequently, neighboring geodesics that are initially diverging will slow down, stop and then accelerate back towards each other. In this region, the submanifold contracts. This accelerating divergence or convergence between neighboring radial geodesics spanning the submanifold depends on the rate of change of mass–inertia load on the elemental movements from point to point in the submanifold. These accelerating divergences and convergences between local neighboring radial geodesics determine the shape of the submanifold. It is this changing shape of the synergy submanifold that anticipates and compensates for the changing mass–inertia loads about elemental movements experienced during the execution of goal-directed movements. The extensive amount of data calculated and stored in the association memory network during motor development provides the nervous system with all the information needed to construct and store movement synergies that anticipate and compensate for changing mass–inertia loads.

7.2.5. Upper and Lower Bounds on the Shape of Submanifolds

Over time, the nervous system accumulates and stores in memory a repertoire of movement synergies with a variety of CDOFs and a variety of shapes for different visual tasks. Without knowing exactly how the mass–inertia loads on elemental movements change within each visual task space, we cannot describe the exact shape of each submanifold. The nervous system, on the other hand, is able to generate the exact shape because it has the mass–inertia data associated with all the different configurations of the body stored in its motor memory. We can, however, quantify upper and lower bounds on the shape of submanifolds. Upper and lower bounds on sectional curvatures (i.e., curvatures of 2 D submanifolds) can be used to derive bounds on the shape of all higher-dimensional submanifolds.
To determine upper and lower bounds on curvature, we need to consider configuration manifolds C , G that have constant sectional curvatures K α , η everywhere. There are only three such manifolds with constant sectional curvature everywhere: (i) the sphere with radius R that has constant positive sectional curvature K α , η = 1 R 2 > 0 everywhere, (ii) the flat Euclidean plane that has zero curvature everywhere and (iii) the hyperbolic manifold with radius R that has constant negative sectional curvature K α , η = 1 R 2 < 0 everywhere [51] (Ch.11). We describe these constant curvature manifolds not because they actually exist within an acquired repertoire of movement synergies but because they enable us to derive upper and lower bounds on the shapes of submanifolds within that repertoire. This will give an intuitive understanding of how the shapes of submanifolds anticipate and compensate for changes in the mass–inertia loads on the elemental movements of the body.
On a constant curvature manifold, the Jacobi equation α 2 η = R α , η α (Equation (18)) with initial conditions z = η 0 = 0 and w =   α η 0 set G -orthogonal to α 0 gives a transverse coordinate vector
η r = k S k r E r
where k is an arbitrary constant, S k r is a real-valued function that varies smoothly with r along each radial geodesics α s r and E r is any unit vector G -orthogonal to α 0 r at each point parallel translated along the radial geodesic α 0 r . The function S k r is given by
S k r = r   i f   K = 0 R sin r R   i f   K = 1 R 2 > 0 s i n h r R   i f   K = 1 R 2 < 0 .
These functions are illustrated graphically in Figure 2.
The vector k E 0 in Equation (20) is equal to the initial condition w = α η 0 . Thus, the G -norm of η r along each radial geodesic α s r is given by
η r G = S k r α η 0 G .
This equation shows that the G -norm (i.e., metric length) of the G -orthogonal Jacobi vector η r G varies along each radial geodesic α s r in proportion to the absolute value S k r of the smooth real-valued function S k r . We already know that η r is everywhere G -orthogonal to each radial geodesic α s r . However, as seen in Equation (21) and Figure 2, the way S k r varies with r along each radial geodesic α s r is different depending on whether the constant curvature K is positive, zero or negative. We therefore have to consider upper and lower bounds on the shape of 2 D submanifolds for positive curvature and negative curvature separately. The changing shape and size of submanifolds for upper and lower bounds on constant negatively curved and constant positively curved submanifolds is sketched in Figure 3.
At configurations where the rate of change in mass–inertia load is high, such as at transitions from swing to stance in a walking cycle, the magnitude of the curvature is large and the synergy submanifold is contracted and small, as sketched in Figure 3. At such points the minimum-effort movement synergy has to be switched more frequently than at other points in the walking cycle.

8. Concluding Remarks

Knowing the connectivity of the brain and the action of all the neurotransmitters and modulators on synaptic behavior is necessary knowledge but not sufficient. We also have to know what the neural circuits are doing. In this paper, we have explored how a mathematical consideration of human movement and its development can complement the traditional neurobiological and behavioral approaches to the underlying processes.

8.1. The Necessity of Visual and Motor Memory Networks

The geometric theory of visually-guided movement synergies presented here depends on the memorized accumulation of a great amount of visual and motor data. This is biologically feasible only if it is allowed to occur piecemeal over an extended period of time. In other words, the theory quintessentially involves the milestones of human sensory–motor development and the processes that take an individual from the spontaneous movement of the fetus to the skilled movements of maturity.
Indeed, Riemannian geometry provides an explanation as to why a long period is required before the developing nervous system can even start to plan and initiate coordinated minimum-effort movements to achieve sensory goals. If the relationship between a “desired” reafferent response and the motor commands required to generate that response were a simple linear dynamical one, then a long developmental period would not be necessary. In that case, the configuration manifold would be flat, the geometry of every point within it would be the same and, consequently, the sensory–motor relationship would have to be computed for only one configuration and rate of change of configuration of the body in the environment. However, this is not the case; the relationship is not linear. The mass–inertia load about each elemental movement of the body and the size of the images projected onto the retinas of the eyes each vary from one configuration of the body to another. Hence, the geometry at every point in the configuration manifold is different, as shown by the change from point to point in both the metric tensor G and the curvature of the manifold R i j k       l . Consequently, the generation of a geodesic minimum-effort trajectory from anywhere to anywhere within the manifold requires the geodesic acceleration vector f 2 c , c to have been pre-computed and stored in motor memory for every configuration c and rate of change of configuration c . Likewise, the generation of a stable representation of the 3D visual environment and of the body in any posture within it as seen from any place requires a library of encoded retinal hyperfield images to be pre-computed and stored in visual memory for every configuration c of the body in that environment.

8.2. Spatial vs. Temporal Response Planning

We should indicate here that the generation of minimum-effort multi-joint coordinated movements to achieve visual goals is actually a process of at least two stages. The first stage involves the selection of a minimum-effort movement synergy compatible with the visual task space. This is called spatial response planning and is the main topic of this paper. The second stage involves the planning and execution of a sequence of visual goal-directed concatenated submovement trajectories within the selected synergy (i.e., within the required visual task space). This is called temporal response planning.
The experimental investigation of movement control has often been limited to examination of temporal planning. The reason for this is that the experimental setup itself often specifies the spatial component of the response. For example, in a visual pursuit tracking task, the person might be shown how to hold and operate the joystick to control the visual position of a response marker on a display screen. In other words, the experimenter has already determined the movement synergy that the person is to employ to perform the task. This approach dates from the early “human operator” studies that began in World War 2 [52,53,54,55] and much has been learned. In everyday natural movement, however, the person is confronted by a changing sequence of visual challenges and has to select an appropriate movement synergy for each challenge. In this paper, we have focused exactly on this spatial aspect of response planning, namely, the selection of an appropriate minimum-effort movement synergy compatible with a required visual task space.
To perform movement trajectories from any given initial position and velocity to any specified final position and velocity within the submanifold requires a synergy-dependent movement control system. This process is known as response execution. Providing a neurally-feasible account of response execution has been the subject of much of our previous work [15]. The process is summarized diagrammatically in Figure A1 and is not further discussed here other than to say that for a 3CDOF synergy, for example, three optimum minimum metric acceleration trajectory generator circuits (OTGs) are employed in parallel in the control system to generate minimum effort trajectories with equal durations between the initial and final positions and velocities projected onto each of the three geodesic coordinate axes. When these three trajectories along the spanning geodesic coordinate axes are executed together, the resulting movement is a minimum-effort trajectory within the submanifold between the given initial and final positions and velocities in the 3 D submanifold. The resulting trajectory in the 3 D submanifold is not a geodesic because it changes direction, and its metric acceleration is not zero. Nevertheless, its component curves along the three geodesic coordinate axes are all minimum metric-acceleration, minimum-effort curves.

8.3. A Speculation

We suggest here the possibility that minimum-effort movement along geodesic trajectories may have played a profound role in the evolution of the morphology of the human body. From our simulations of two-jointed arm movements using realistic estimates of the lengths of bones and moments of inertia [7], we found that geodesic trajectories in joint-angle space corresponded more or less to straight-line movements of the hand in the outside 3 D Euclidean world. It can be argued, therefore, that the lengths of bones and the distribution of mass along those bones may well have evolved so that minimum-effort, goal-directed, geodesic trajectories in joint-angle space correspond to straight-line movements of the hand in 3 D -Euclidean space. A similar argument can be applied to movements of the leg, foot and center of mass of the body. This implies that the dynamic relations between shoulder, elbow and wrist joint angles and between hip, knee and ankle joint angles during reaching and walking movements will be linearly dynamically related, as has been demonstrated experimentally for walking [56]. Consequently, we suggest that an evolutionary pressure to move with minimum demand by muscles for metabolic energy has not only shaped neural circuits involved in motor control but also, in parallel, the morphology of the parts of the body being controlled.

8.4. Depth Perception

Stereopsis and focus control give a direct pre-conscious measure of absolute depth. According to our geometric theory, these are the only depth perception mechanisms used in the planning and execution of visually-guided movement. Other modules in the brain able to estimate depth are based on occlusions, relative size, texture gradients, shading, height in visual field, aerial perspective and perspective. All depend on a statistical probability analysis of past experiences, and all introduce illusions into conscious visual perception. For example, all of the depth perceived in a television picture is an illusion since the picture is actually on a flat 2 D screen as sensed by stereopsis and focus control. A visual space contaminated with illusions is exactly what is not required for the planning of precisely controlled, visually-guided movements. The other statistically-based depth-estimation modules contribute to the conscious perception of depth. But in our theory, these are not used in the planning and execution of visually-guided movement. Their probabilistic nature is too imprecise for the accuracy required for the control of precise, visually-guided movement. This is consistent with the existence of blind vision [57,58] and the experimental observation that visually-guided movement is not altered by visual illusions [59,60,61]. Interestingly, this implies the existence within the brain of a complete pre-conscious 3 D visual system with depth derived solely from stereopsis and focus control.

8.5. Other Geometries

Our proposed geometric theory accounts for much experimental evidence. Nevertheless, a reviewer has requested some mention, at least at a philosophical level, of other topologic and geometric models pertaining to visual perception. Earlier relevant work was addressed in our previous papers on vision, in particular, in [9]. To briefly recap, we point here to the following pioneering work.
Luneburg [62] appears to have been first to argue that the geometry of perceived visual space is Riemannian with constant negative curvature. From experimental work [63] and on philosophical grounds, Battro [64] described the geometry of visual space as Riemannian but with variable curvature. Hoffman [65] wrote of a “geometric psychology” as being the key to an understanding of perceptual and cognitive phenomena, setting out concepts from differential geometry and topology in relation to binocular vision and its underlying retinal and cortical arrangements. He referred to perceptual spaces that are both Euclidean and non-Euclidean and outlined vector bundle and fiber bundle constructions that differ from ours but are philosophically in keeping. Koenderink and colleagues [66,67,68,69], using the method of exocentric pointing, were first to make direct measurements of the curvature of the horizontal plane in perceived visual space. The results showed large errors in the direction of exocentric pointing that varied systematically depending on the exocentric locations of the remote pointer and target. These results were consistent with a changing curvature, as suggested by Battro. However, Cuijpers et al. [70,71] found that the measured curvature varied depending on the conditions of the experiment and measurement techniques employed. The implication was that the measured geometry of perceived visual space is task dependent.
From continued work [72,73,74,75,76,77,78,79,80,81,82], it became apparent that experimental measures of the geometry of perceived visual space are not just task dependent but vary according to the many contextual factors that affect spatial judgement [83,84,85]. This inconsistency in the experimental results led some to question or even to abandon the concept of such a visual space [70,86]. Others argued that there really is only one visual space in our perceptual experience but it has a cognitive overlay in which observers supplement perception with their knowledge of how distance affects size [87,88,89,90,91,92,93]. We see the source of the problem being the fact that it is not possible to measure directly the perceptual experience of someone else. Rather than rejecting the existence of a geometrically-invariant perceived visual space because of variability due to top-down cognitive processes perturbing measurement, we have argued that an intrinsic geometry can be deduced mathematically from the known size–distance relationship between the size of the image on the retina and the Euclidean distance between the nodal point of the eye and the object in the environment [9].

8.6. Coda

Finally, with regard to technology and the integration of artificial intelligence with robotics, it is recognized that neuromorphic memory and neuromorphic computing may well provide the next major advance. We have long believed that so-called neural networks should be biologically realistic and not depend on mechanisms such as back-propagation that have no neurophysiological counterpart. Accordingly, we have given in this paper a mathematical description of how biologically-feasible human neural processing can subserve the development and adaptive maintenance of a wide range of flexible visuomotor skills. The most important features that enable this are (i) the encoding of data by temporospatial patterns of action potentials in bundles of neurons, (ii) the existence of association memory networks able to directly link and quickly retrieve associated temporospatial patterns of neural activity and (iii) the existence of large numbers of neural adaptive filters in basal ganglia and cerebellar circuits that have input–output characteristics able to tune adaptively to mimic nonlinear dynamical relationships between sensory–sensory, sensory–motor and motor–motor signals. Riemannian geometry has given a window into a memory structure that can be developed gradually over time and place as well as accommodate the myriad possible postures of the body and its changing dimensions from babyhood onwards.

Author Contributions

Conceptualization, P.D.N.; methodology, P.D.N.; writing—original draft preparation, P.D.N. and M.D.N.; writing—review and editing, M.D.N. and P.D.N.; visualization, P.D.N. All authors have read and agreed to the published version of the manuscript.

Funding

This research received no external funding.

Data Availability Statement

No new data were created or analyzed in this study. Data sharing is not applicable to this article.

Acknowledgments

The authors thank Joel and Chloe Foffani, who have informed the writing of this paper with their regular videos showing the development of Zac (born October 2022) and Gwenny (born November 2024)—our great-grandchildren.

Conflicts of Interest

The authors declare no conflicts of interest.

Abbreviations

The following abbreviations are used in this manuscript:
AMTAdaptive model theory
CDOFsControlled degrees of freedom
GTGGeodesic trajectory generator
LGNLateral geniculate nucleus
LMSLeast mean square
SVDSingular value decomposition
VORVestibulo-ocular reflex

Appendix A. Transition from Pattern-Generator Movements to Purposive Goal-Directed Movements

Here, we first summarize our previous work on the sensory–motor modeling of purposive movement by means of neural adaptive filters. We then set out an extension of this earlier computational circuitry to show the evolution from non-purposive pattern-generator movement along with a means to select the appropriate synergies for a particular task.

Appendix A.1. Neural Adaptive Filters

In a comprehensive overview of our earlier work [15], we set out how the neuroanatomical connections of cortical–cerebellar–cortical pathways match the connectivity of adaptive filters that tune parameters using the least mean square (LMS) adaptive filter algorithm [94,95,96]. We showed that a basis of 10 orthogonal singular vectors can be obtained from a singular value decomposition (SVD) of a symmetrical matrix of 10 Hz low-pass filtered random numbers. Using these singular vectors as impulse response functions for 10 parallel linear filters with a common input signal and with the output signals from each filter both squared and cubed, a nonlinear adaptive filter requiring only 60 adaptive parameters can be constructed. Simulations showed that this nonlinear adaptive filter can successfully model nonlinear low-pass systems with a large range of different amplitude probability distributions. This is an important advance in the theory of nonlinear adaptive filters.
Based on these demonstrated abilities of nonlinear adaptive filters, we put forward a computational account of goal-directed human movement termed adaptive model theory (AMT) [15]. In brief, we proposed that cortical–basal ganglia–cortical and cortical–cerebellar–cortical pathways function as networks of nonlinear neural adaptive filters, as has been suggested by others [97,98]. We further proposed that during any particular movement, the parameters of these filters are tuned by a neurally-implemented LMS algorithm (as above) and stored in long-term memory in association with that movement. When retrieved from that association memory, the parameters provide the means to recreate the movement. This is performed by using them to modulate synaptic gains between parallel fibers and Purkinje cells within the cerebellum via the descending modulation of gap junctions between cells in the inferior olive [99,100]. The axons of these inferior olive cells form climbing fibers that exert a powerful action on Purkinje cells in the cerebellum, causing their synaptic sensitivities to thousands of parallel fiber synaptic inputs to change in an arrangement determined by the coincidence of climbing fiber activity and parallel fiber activity. Thus, the cerebellum sends the appropriate signals for the correct motor commands to be sent from the cortex to the muscle control systems.
In the same earlier paper, we also showed that a network of adaptive filters can perform a dynamical nonlinear Gram–Schmidt orthogonalization of many partially intercorrelated signals. With additions replaced by subtractions, the same network can transform the small number of orthogonalized signals back into the large number of covarying signals. When a movement occurs, it generates an efference copy signal along with reafference signals from the sensory receptors that inform about the consequent elemental movements, muscle tensions and visual changes. The result is a swarm of intercorrelated signals arising from each movement. As before, adaptive neural filtering provides a solution. We propose that networks of neural filters, again in the basal ganglia and cerebellum, tune adaptively to perform a type of nonlinear dynamic Gram–Schmidt orthogonalization within each group of feedback signals. This enables a relatively small number of orthogonal motor and sensory feature signals to be extracted for each movement. If equal numbers of feature signals are extracted from each parallel stream of efference, elemental movement, muscle tension and visual reafference, the relationships between these can be identified by inverse modeling. We refer to the Gram–Schmidt orthogonalizing networks as feature-extraction networks and to the signals they produce as synergy-dependent feature signals. The feature-extraction networks effectively identify the synergy associated with each movement. Importantly, when run in reverse, each network acts as a synergy generator to produce its associated movement.
The time taken for a neural adaptive filter to converge can be varied between very fast, measured in tens of milliseconds, to very slow, measured in months, simply by changing the adaptive gain μ of the LMS adaptive-filter algorithm. Fast adaptation converges rapidly to noisy estimates of the filter’s parameters with large 95% confidence limits while slow adaptation converges slowly to accurate estimates of the filter’s parameters with small 95% confidence limits. This is of relevance for the development of a purposive goal-directed movement system. We have not previously explored how the proposed computational system might evolve developmentally. This is addressed below.

Appendix A.2. Pattern Generators, Synergy Codes and Skill Acquisition

The sensory–motor orthogonalization and system identification processes just described are not available to the newborn. As introduced in Section 3.1, it is not until around three months after birth that the myelination of cortical–subcortical pathways begins to make the necessary networks of adaptive filters available. It is at this point that the nervous system can begin to model the nonlinearly correlated temporal and spatial relationships between the sensory and motor signals that arise from the spontaneous pattern-generator movement that began in the fetus.
When a pattern-generator movement occurs, it generates an efference copy signal along with reafference signals from the sensory receptors that inform about the consequent elemental movements and muscle tensions as well as about any visual changes that co-occur. Just as described earlier for movement in the mature system, synergy-dependent feature signals are extracted by the newly available orthogonalizing networks, and these effectively identify the synergy associated with each pattern generator. In other words, the adaptive modeling circuitry begins by modeling the nervous system’s own pattern-generator movements.
The number of orthogonalized signals is determined by the particular pattern generator and can vary between pattern generators. Nevertheless, the number of orthogonalized feature signals associated with any one pattern-generator movement is always a relatively small number compared with the large number of interrelated sensory and motor afferent signals. Most pattern-generator movements have a sufficiently high number of degrees of freedom that they look not to be goal-directed. Around the three month mark, the baby begins storing in memory in association with appropriate pattern-generator selection codes the adaptive parameters that tune basal ganglia and cerebellum neural circuits. These circuits implement nonlinear orthogonal feature extraction and nonlinear adaptive modeling of dynamic transformations between the orthogonalized sensory–sensory, sensory–motor and motor–motor feature signals for each pattern generator movement. It is at this point that the remarkable transition in motor development occurs.
The baby moves away from the spontaneous, randomly selected pattern-generator movements of the fetus and neonate towards purposive, goal-directed voluntary movement. Initially, stored trajectories of visual reafference associated with pattern-generator movements retrieve the associated pattern-generator selection code using the mechanism described in Section 5. The synergy selection code retrieves the appropriate adaptive filter parameters from the association memory network. Initially, these parameters are the same as those associated with the pattern-generator movement. They tune the neural adaptive filters in basal ganglia and cerebellum in readiness to transform the trajectory of “desired” visual reafference into appropriately coordinated motor commands.
But now, the baby is free to introduce temporal and spatial variations into the trajectories of desired reafference. The timing of the desired reafferent trajectory can be altered and its degrees of freedom can be reduced. Using the LMS algorithm, the neural filters in the cortical–subcortical–cortical pathways adaptively model the new nonlinear dynamical relationships associated with the new desired trajectories of reafference. A new desired trajectory becomes associated with a new synergy selection code that, in turn, is associated with the new adaptive filter parameters. In other words, the baby has changed from the spontaneous random pattern-generator selection code to a goal-related synergy selection code associated with the desired reafferent response.
Subsequently, over time, driven by imitation, trial and error and coaching, the developing infant acquires an increasing repertoire of desired response trajectories of orthogonal reafferent sensory signals, each with its own set of neural adaptive filter parameters held in memory and each associated with its own synergy selection code. Each new coordinated movement is a variation on one or more previously acquired responses. The adaptive filter parameters from multiple previously acquired responses can be combined in parallel to form new adaptive filter models with novel combinations of orthogonalized feature signals. The number of degrees of freedom in the new coordinated responses can be decreased or increased compared with that of the pattern-generator responses. Indeed, the movement synergies can be acquired for moving each elemental movement one at a time, independently of all the other elemental movements.
The association of each desired response trajectory with a synergy selection code and with adaptive filter parameters stored in memory allows the development of new movement synergies to occur in a piecemeal fashion. Partly acquired coordinated movement trajectories can be revisited multiple times. The synergy selection code retrieves from memory the partly adapted neural filter parameters allowing the adaptive LMS algorithm to take up the adaptive process from where it left off the last time that coordinated movement was attempted. Thus, over time, in a piecemeal fashion, coordinated movements that were initially performed in a clumsy manner become progressively more skilled. By six months of age, the baby can sit, direct its gaze and point to objects in its environment, and by as early as one year, the infant is able to walk. An increasing range of motor skills is acquired, each with its own trajectory of desired orthogonalized reafference and set of adaptive filter parameters stored in memory in association with a unique synergy selection code. By two years, the infant is walking, running, jumping and talking, and new movement skills continue to be acquired in a similar way throughout life.
Figure A1 shows a block diagram illustrating the adaptive modeling process described above and the mechanism for the acquisition of new coordinated movements during motor development. In particular, the diagram illustrates the transition from spontaneous pattern-generator movements of the fetus and neonate to the purposive goal-directed movements of the mature nervous system. We do not provide a detailed description of the synergy-dependent movement control system on which much of the figure is based (for a full account see [15]). Nevertheless, the diagram provides sufficient information to give the gist of the adaptive control process and to illustrate how the ongoing adaptive modeling of afferent signals combines with the synergy selection and reinforcement learning processes described in the present text.
Our geometric theory holds that the large amount of associated visual and motor data accumulated adaptively during development enables the mature nervous system to implement the following sequence of processes to accomplish a visual goal-directed motor response. (i) The response is initiated by a collage of place-and-posture-encoded visual images held online in working memory spanning the visual task space for the required visual response. (ii) This temporospatial pattern of neural activity is transformed by a reinforcement learning mechanism into a temporospatial pattern of neural activity representing the required synergy selection code. (iii) The synergy selection code retrieves from an association memory network the appropriate set of parameters that modulate neural adaptive filters in the basal ganglia and cerebellum. These filters extract orthogonalized sensory and motor signals appropriate for the selected synergy and they form models of both forward and inverse nonlinear dynamical relationships appropriate for the selected synergy between the orthogonalized sensory–sensory, sensory–motor and motor–motor signals. The adaptive filter parameters are continuously updated by the LMS algorithms during execution of the movement. (iv) In parallel with the retrieval of adaptive filter parameters, the synergy selection code provides all the information needed to retrieve from motor memory the low-dimensional synergy submanifold spanned by geodesic coordinate axes embedded in the high-dimensional configuration manifold of the body. (v) The response-planning system generates minimum acceleration trajectories between given positions and velocities along each of the spanning geodesic coordinate axes. This results in a minimum-effort movement trajectory confined to the given visual task space between specified initial and final positions and velocities. The reafferent signals associated with these movements correspond to the orthogonalized sensory and motor signals extracted by the synergy-related feature-extraction networks.
Figure A1 can be used to trace steps (i) to (v) above, thus delineating diagrammatically the mature neural processes underlying the planning and initiation of a visual goal-directed coordinated motor response within a reaction-time interval.
Figure A1. A block diagram illustrating the transition from the spontaneous pattern-generator movements of the fetus and newborn to the goal-directed synergistic movements of the mature nervous system. The red Appliedmath 05 00052 i001 circuit shows random selection of a pattern-generator selection code that activates one of the many pattern-generator circuits developed within the brain during the first two trimesters of pregnancy. The pattern-generator selection code is connected to a motor association memory network shown in crimson. When activated, the pattern generators send a coordinated trajectory of motor commands m to the Appliedmath 05 00052 i002 functional muscles of the musculo-skeletal-reflex and external systems. These spontaneous fetal and neonatal pattern-generator movements produce motor and sensory afferent signals that tune sensory pathways, leading to the formation of cortical sensory maps illustrated here for only efference copy and vision. Somewhere during the third month after birth, green Appliedmath 05 00052 i003 neural adaptive filter circuits in cortical–cerebellar–cortical and cortical–basal ganglia-cortical loops come into play. Nonlinear Gram–Schmidt orthogonalizing networks of neural adaptive filters Δ MFE and Δ VFE extract the small number of orthogonalized first-differenced (differentiated) motor Δ M and visual Δ V feature signals associated with the activated pattern generator. Other neural adaptive filters in the cerebellum and basal ganglia tune adaptively to form nonlinear dynamic forward and inverse models of the relationships between the orthogonalized feature signals Δ M and Δ V. The forward models allow afferent signals to be separated into reafference and exafference. Descending neural signals that modulate cerebellar circuits via the inferior olive and basal ganglia circuits via the substantia nigra pars compacta correspond to parameter signals retrieved from the parameter association memory network that tune the cerebellar and basal ganglia neural adaptive filters. The parameter signals are stored in the motor association memory network in association with the pattern-generator selection code. Thus, the fetal and neonatal pattern-generator movements bootstrap, in a piecemeal fashion, the development of forward and inverse models for all the pattern-generator movements. At this stage, the red Appliedmath 05 00052 i004 pattern-generator circuit is switched off and the crimson Appliedmath 05 00052 i005 reinforcement learning system is brought into play. Desired visual task spaces can now be specified to generate an appropriate synergy selection code to replace the pattern-generator selection code. The synergy selection code associated with the specified visual task space retrieves from the association memory network the appropriate set of parameters to tune all the neural adaptive filters in readiness to adaptively model and perform the required goal-directed synergistic movement. The blue Appliedmath 05 00052 i006 response-planning system RP can now plan required visual response trajectories confined to the selected movement synergy using only the small number of orthogonalized signals, V, Va and V*, appropriate for the selected synergy. Δ V denotes the first-differenced orthogonalized desired visual response and Δ M  denotes the first-differenced required orthogonalized motor commands. By this stage of development the pattern generator has been replaced by the yellow Appliedmath 05 00052 i007 feedforward, adaptively-tuned inverse models and synergy generator within basal ganglia and cerebellar corticocortical loops. Over the next two years and on into adulthood, driven by imitation, trial and error and coaching, the nervous system acquires, in a piecemeal fashion, a repertoire of visual goal-directed multi-joint coordinated movements, each associated with a visual task space and its own associated synergy selection code.
Appliedmath 05 00052 g0a1

References

  1. Bernstein, N.A. The Co-Ordination and Regulation of Movements; Pergamon Press: Oxford, UK, 1967. [Google Scholar]
  2. Neilson, P.D.; Neilson, M.D.; O’Dwyer, N.J. Internal models and intermittency: A theoretical account of human tracking behavior. Biol. Cybern. 1988, 58, 101–112. [Google Scholar] [CrossRef] [PubMed]
  3. Jordan, M.I.; Wolpert, D.M. Computational motor control. In The New Cognitive Neurosciences; Gazzaniga, M., Ed.; MIT Press: Cambridge, MA, USA, 1999; pp. 601–620. [Google Scholar]
  4. Neilson, P.D.; Neilson, M.D. A neuroengineering solution to the optimal tracking problem. Hum. Mov. Sci. 1999, 18, 155–183. [Google Scholar] [CrossRef]
  5. Todorov, E.; Jordan, M.I. Optimal feedback control as a theory of motor coordination. Nat. Neurosci. 2002, 5, 1226–1235. [Google Scholar] [CrossRef] [PubMed]
  6. Neilson, P.D.; Neilson, M.D.; Bye, R.T. A Riemannian geometry theory of synergy selection for visually-guided movement. Vision 2021, 5, 26. [Google Scholar] [CrossRef]
  7. Neilson, P.D.; Neilson, M.D.; Bye, R.T. A Riemannian geometry theory of human movement: The geodesic synergy hypothesis. Hum. Mov. Sci. 2015, 44, 42–72. [Google Scholar] [CrossRef]
  8. Bullo, F.; Lewis, A.D. Geometric Control of Mechanical Systems: Modeling, Analysis, and Design for Simple Mechanical Control Systems; Texts in Applied Mathematics; Springer: New York, NY, USA, 2005; ISBN 978-0-387-22195-3. [Google Scholar]
  9. Neilson, P.D.; Neilson, M.D.; Bye, R.T. A Riemannian geometry theory of three-dimensional binocular visual perception. Vision 2018, 2, e43. [Google Scholar] [CrossRef]
  10. O’Keefe, J.; Dostrovsky, J. The hippocampus as a spatial map. Preliminary evidence from unit activity in the freely-moving rat. Brain Res. 1971, 34, 171–175. [Google Scholar] [CrossRef] [PubMed]
  11. O’Keefe, J. Place units in the hippocampus of the freely moving rat. Exp. Neurol. 1976, 51, 78–109. [Google Scholar] [CrossRef]
  12. Fyhn, M.; Molden, S.; Witter, M.P.; Moser, E.I.; Moser, M.-B. Spatial representation in the entorhinal cortex. Science 2004, 305, 1258–1264. [Google Scholar] [CrossRef]
  13. Hafting, T.; Fyhn, M.; Molden, S.; Moser, M.-B.; Moser, E.I. Microstructure of a spatial map in the entorhinal cortex. Nature 2005, 436, 801–806. [Google Scholar] [CrossRef]
  14. Klein, H.; Jaquier, N.; Meixner, A.; Asfour, T. On the design of region-avoiding metrics for collision-safe motion generation on Riemannian manifolds. In Proceedings of the IEEE/RSJ International Conference on Intelligent Robots and Systems (IROS 2023), Detroit, MI, USA, 1–5 October 2023. [Google Scholar]
  15. Neilson, P.D.; Neilson, M.D. An overview of adaptive model theory: Solving the problems of redundancy, resources, and nonlinear interactions in human movement control. J. Neural Eng. 2005, 2, S279–S312. [Google Scholar] [CrossRef] [PubMed]
  16. de Vries, J.I.P.; Visser, G.H.A.; Prechtl, H.F.R. The emergence of fetal behaviour. I. Qualitative aspects. Early Hum. Dev. 1982, 7, 301–322. [Google Scholar] [CrossRef]
  17. de Vries, J.I.P.; Visser, G.H.A.; Prechtl, H.F.R. The emergence of fetal behaviour. II. Quantitative aspects. Early Hum. Dev. 1985, 12, 99–120. [Google Scholar] [CrossRef] [PubMed]
  18. Prechtl, H.F.R. The importance of fetal movements. In Neurophysiology and Neuropsychology of Motor Development; Connolly, K.J., Forssberg, H., Eds.; Clinics in Developmental Medicine; Mac Keith Press: London, UK, 1997; pp. 42–53. ISBN 978-1-898683-10-0. [Google Scholar]
  19. Prechtl, H.F.R. Continuity of Neural Functions from Prenatal to Postnatal Life; Prechtl, H.F.R., Ed.; Clinics in Developmental Medicine; Blackwell Scientific Publications: Oxford, UK, 1984; ISBN 978-0-521-41214-8. [Google Scholar]
  20. Prechtl, H.F.R. New perspectives in early human development. Eur. J. Obstet. Gynecol. Reprod. Biol. 1986, 21, 347–355. [Google Scholar] [CrossRef]
  21. Prechtl, H.F.R.; Hopkins, B. Developmental transformations of spontaneous movements in early infancy. Early Hum. Dev. 1986, 14, 233–238. [Google Scholar] [CrossRef] [PubMed]
  22. Barlow, H.B. The coding of sensory messages. In Current Problems in Animal Behaviour; Thorpe, W.H., Zangwill, O.L., Eds.; Cambridge University Press: Cambridge, UK, 1961; pp. 331–360. [Google Scholar]
  23. Gandevia, S.C. Roles for perceived voluntary motor commands in motor control. Trends Neurosci. 1987, 10, 81–85. [Google Scholar] [CrossRef]
  24. Grotheer, M.; Rosenke, M.; Wu, H.; Kular, H.; Querdasi, F.R.; Natu, V.S.; Yeatman, J.D.; Grill-Spector, K. White matter myelination during early infancy is linked to spatial gradients and myelin content at birth. Nat. Commun. 2022, 13, 997. [Google Scholar] [CrossRef]
  25. Neilson, P.D.; Neilson, M.D. Motor maps and synergies. Hum. Mov. Sci. 2005, 24, 774–797. [Google Scholar] [CrossRef]
  26. Bye, R.T.; Neilson, P.D. The BUMP model of response planning: Intermittent predictive control accounts for 10Hz physiological tremor. Hum. Mov. Sci. 2010, 29, 713–736. [Google Scholar] [CrossRef]
  27. Marsden, J.E.; Ratiu, T.S. Introduction to Mechanics and Symmetry: A Basic Exposition of Classical Mechanical Systems, 2nd ed.; Texts in Applied Mathematics; Springer: New York, NY, USA, 1999; ISBN 978-0-387-98643-2. [Google Scholar]
  28. Lang, S. Fundamentals of Differential Geometry; Graduate Texts in Mathematics; Springer: New York, NY, USA, 1999; Volume 191, ISBN 978-1-4612-6810-9. [Google Scholar]
  29. Handzel, A.A.; Flash, T. Geometric methods in the study of human motor control. Cogn. Stud. 1999, 6, 309–321. [Google Scholar] [CrossRef]
  30. Ghosh, B.K.; Meegaskumbura, R.; Ekanayake, M.P.B. Human eye movement with and without the Listings constraint. In Proceedings of the 2009 American Control Conference, St Louis, MO, USA, 10–12 June 2009; pp. 1015–1020. [Google Scholar]
  31. Sekimoto, M.; Arimoto, S.; Prilutsky, B.I.; Isaka, T.; Kawamura, S. Observation of human multi-joint arm movement from the viewpoint of a Riemannian distance. In Proceedings of the ICCAS-SICE 2009-ICROS-SICE International Joint Conference 2009, Proceedings, Fukuoka, Japan, 18–21 August 2009; pp. 2664–2669. [Google Scholar]
  32. Biess, A. Shaping of arm configuration space by prescription of non-Euclidean metrics with applications to human motor control. Phys. Rev. E 2013, 87, 012729. [Google Scholar] [CrossRef] [PubMed]
  33. Klein, H.; Jaquier, N.; Meixner, A.; Asfour, T. A Riemannian take on human motion analysis and retargeting. In Proceedings of the 2022 IEEE/RSJ International Conference on Intelligent Robots and Systems (IROS), Kyoto, Japan, 23–27 October 2022; pp. 5210–5217. [Google Scholar]
  34. Frisby, J.P.; Stone, J.V. Seeing: The Computational Approach to Biological Vision, 2nd ed.; MIT Press: Cambridge, MA, USA, 2010; ISBN 978-0-262-51427-9. [Google Scholar]
  35. Neilson, P.D.; Neilson, M.D.; Bye, R.T. The Riemannian geometry theory of visually-guided movement accounts for afterimage illusions and size constancy. Vision 2022, 6, 37. [Google Scholar] [CrossRef] [PubMed]
  36. Brunton, S.L.; Kutz, J.N. Data-Driven Science and Engineering: Machine Learning, Dynamical Systems, and Control, 2nd ed.; Cambridge University Press: Cambridge, UK, 2022; ISBN 978-1-009-09848-9. [Google Scholar]
  37. Daugman, J.G. Entropy reduction and decorrelation in visual coding by oriented neural receptive fields. IEEE Trans. Biomed. Eng. 1989, 36, 107–114. [Google Scholar] [CrossRef]
  38. Simoncelli, E.P.; Olshausen, B.A. Natural image statistics and neural representation. Annu. Rev. Neurosci. 2001, 24, 1193–1216. [Google Scholar] [CrossRef] [PubMed]
  39. Bendat, J.S. Nonlinear System Analysis and Identification from Random Data; Wiley: New York, NY, USA, 1990; ISBN 978-0-471-60623-9. [Google Scholar]
  40. Bendat, J.S. Nonlinear System Techniques and Applications; Wiley: New York, NY, USA, 1998; ISBN 978-0-471-16576-7. [Google Scholar]
  41. Marr, D. Vision: A Computational Investigation into the Human Representation and Processing of Visual Information; originally published 1982; The MIT Press: Cambridge, MA, USA, 2010; ISBN 978-0-262-51462-0. [Google Scholar]
  42. Marr, D.; Poggio, T. Cooperative computation of stereo disparity. Science 1976, 194, 283–287. [Google Scholar] [CrossRef]
  43. Sprague, N.; Ballard, D.; Robinson, A. Modeling embodied visual behaviors. ACM Trans. Appl. Percept. 2007, 4, 11. [Google Scholar] [CrossRef]
  44. Graziano, M.S.A. The movement repertoire of monkeys, Chapter 9. In The Intelligent Movement Machine: An Ethological Perspective on the Primate Motor System; Oxford University Press: Oxford, UK, 2009; ISBN 978-0-19-986486-7. [Google Scholar]
  45. Hayhoe, M.M. Vision and action. Annu. Rev. Vis. Sci. 2017, 3, 389–413. [Google Scholar] [CrossRef]
  46. Schultz, W.; Dickinson, A. Neuronal coding of prediction errors. Annu. Rev. Neurosci. 2000, 23, 473–500. [Google Scholar] [CrossRef]
  47. Niv, Y. Reinforcement learning in the brain. J. Math. Psychol. 2009, 53, 139–154. [Google Scholar] [CrossRef]
  48. Wilson, R.C.; Takahashi, Y.K.; Schoenbaum, G.; Niv, Y. Orbitofrontal cortex as a cognitive map of task space. Neuron 2014, 81, 267–279. [Google Scholar] [CrossRef] [PubMed]
  49. Rescorla, R.A.; Wagner, A.R. A theory of Pavlovian conditioning: Variations in the effectiveness of reinforcement and nonreinforcement. In Classical Conditioning II: Current Research and Theory; Black, A.H., Prokasy, W.F., Eds.; Appleton-Century-Crofts: New York, NY, USA, 1972; pp. 64–99. [Google Scholar]
  50. Sutton, R.S.; Barto, A.G. Reinforcement Learning: An Introduction, 2nd ed.; Adaptive computation and machine learning series; MIT Press: Cambridge, MA, USA, 2018; ISBN 978-0-262-03924-6. [Google Scholar]
  51. Lee, J.M. Introduction to Riemannian Manifolds, 2nd ed.; Graduate Texts in Mathematics; Springer International Publishing: Cham, Switzerland, 2018; ISBN 978-3-319-91754-2. [Google Scholar]
  52. Craik, K.J.W. Theory of the human operator in control systems I. The operator as an engineering system. Br. J. Psychol. 1947, 38, 56–61. [Google Scholar] [CrossRef]
  53. Craik, K.J.W. Theory of the human operator in control systems II. Man as an element in a control system. Br. J. Psychol. 1948, 38, 142–148. [Google Scholar] [CrossRef]
  54. Young, L.R. On adaptive manual control. Ergonomics 1969, 12, 635–674. [Google Scholar] [CrossRef] [PubMed]
  55. Poulton, E.C. Tracking Skill and Manual Control; Academic Press: New York, NY, USA, 1974; ISBN 0-12-563550-8. [Google Scholar]
  56. O’Dwyer, N.; Rattanaprasert, U.; Smith, R. Quantification of coordination in human walking. In From Basic Motor Control to Functional Recovery II; Gantchev, N., Ed.; Academic Publishing House: Sofia, Bulgaria, 2001; pp. 107–119. ISBN 954-430-813-X. [Google Scholar]
  57. Goodale, M.; Milner, D. One brain—Two visual systems. Psychologist 2006, 19, 660–663. [Google Scholar]
  58. Goodale, M.A.; Milner, D. Sight Unseen: An Exploration of Conscious and Unconscious Vision; Oxford University Press: Oxford, UK, 2013; ISBN 978-0-19-175300-8. [Google Scholar]
  59. Króliczak, G.; Heard, P.; Goodale, M.A.; Gregory, R.L. Dissociation of perception and action unmasked by the hollow-face illusion. Brain Res. 2006, 1080, 9–16. [Google Scholar] [CrossRef]
  60. Whitwell, R.L.; Buckingham, G.; Enns, J.T.; Chouinard, P.A.; Goodale, M.A. Rapid decrement in the effects of the Ponzo display dissociates action and perception. Psychon. Bull. Rev. 2016, 23, 1157–1163. [Google Scholar] [CrossRef]
  61. Whitwell, R.L.; Goodale, M.A.; Merritt, K.E.; Enns, J.T. The Sander parallelogram illusion dissociates action and perception despite control for the litany of past confounds. Cortex 2018, 98, 163–176. [Google Scholar] [CrossRef] [PubMed]
  62. Luneburg, R.K. Mathematical Analysis of Binocular Vision; Princeton University Press: Princeton, NJ, USA, 1947. [Google Scholar]
  63. Battro, A.M.; di Pierro Netto, S.; Rozestraten, R.J.A. Riemannian geometries of variable curvature in visual space: Visual alleys, horopters, and triangles in big open fields. Perception 1976, 5, 9–23. [Google Scholar] [CrossRef]
  64. Battro, A.M. Visual Riemannian space versus cognitive Euclidean space. Synthese 1977, 35, 423–429. [Google Scholar] [CrossRef]
  65. Hoffman, W.C. Subjective geometry and geometric psychology. Math. Model. 1980, 1, 349–367. [Google Scholar] [CrossRef]
  66. Koenderink, J.J.; van Doorn, A.J. Geometry of binocular vision and a model for stereopsis. Biol. Cybern. 1976, 21, 29–35. [Google Scholar] [CrossRef] [PubMed]
  67. Koenderink, J.J.; van Doorn, A.J. Exocentric pointing. In Vision and Action; Harris, L.R., Jenkin, M., Eds.; Cambridge University Press: Cambridge, UK, 1998; pp. 295–313. ISBN 978-0-521-63162-4. [Google Scholar]
  68. Koenderink, J.J.; van Doorn, A.J.; Lappin, J.S. Direct measurement of the curvature of visual space. Perception 2000, 29, 69–79. [Google Scholar] [CrossRef] [PubMed]
  69. Cuijpers, R.H.; Kappers, A.M.L.; Koenderink, J.J. Investigation of visual space using an exocentric pointing task. Percept. Psychophys. 2000, 62, 1556–1571. [Google Scholar] [CrossRef] [PubMed]
  70. Cuijpers, R.H.; Kappers, A.M.L.; Koenderink, J.J. Visual perception of collinearity. Percept. Psychophys. 2002, 64, 392–404. [Google Scholar] [CrossRef]
  71. Cuijpers, R.H.; Kappers, A.M.L.; Koenderink, J.J. The metrics of visual and haptic space based on parallelity judgements. J. Math. Psychol. 2003, 47, 278–291. [Google Scholar] [CrossRef]
  72. Cuijpers, R.H.; Kappers, A.M.L.; Koenderink, J.J. On the role of external reference frames on visual judgements of parallelity. Acta Psychol. 2001, 108, 283–302. [Google Scholar] [CrossRef]
  73. Schoumans, N.; Kappers, A.M.L.; Koenderink, J.J. Scale invariance in near space: Pointing under influence of context. Acta Psychol. 2002, 110, 63–81. [Google Scholar] [CrossRef]
  74. Koenderink, J.J.; van Doorn, A.J.; Lappin, J.S. Exocentric pointing to opposite targets. Acta Psychol. 2003, 112, 71–87. [Google Scholar] [CrossRef]
  75. Doumen, M.J.A.; Kappers, A.M.L.; Koenderink, J.J. Visual space under free viewing conditions. Percept. Psychophys. 2005, 67, 1177–1189. [Google Scholar] [CrossRef]
  76. Doumen, M.J.A.; Kappers, A.M.L.; Koenderink, J.J. Horizontal–vertical anisotropy in visual space. Acta Psychol. 2006, 123, 219–239. [Google Scholar] [CrossRef]
  77. Doumen, M.J.A.; Kappers, A.M.L.; Koenderink, J.J. Effects of context on a visual 3-D pointing task. Perception 2007, 36, 75–90. [Google Scholar] [CrossRef]
  78. Koenderink, J.; van Doorn, A. The structure of visual spaces. J. Math. Imaging Vis. 2008, 31, 171–187. [Google Scholar] [CrossRef]
  79. Koenderink, J.J.; van Doorn, A.J.; Kappers, A.M.L.; Doumen, M.J.A.; Todd, J.T. Exocentric pointing in depth. Vision Res. 2008, 48, 716–723. [Google Scholar] [CrossRef] [PubMed]
  80. Koenderink, J.; van Doorn, A.; de Ridder, H.; Oomes, S. Visual rays are parallel. Perception 2010, 39, 1163–1171. [Google Scholar] [CrossRef] [PubMed]
  81. Koenderink, J.; van Doorn, A. The shape of space. In Shape Perception in Human and Computer Vision; Dickinson, S., Pizlo, Z., Eds.; Advances in Computer Vision and Pattern Recognition; Springer: London, UK, 2013; pp. 145–156. ISBN 978-1-4471-5194-4. [Google Scholar]
  82. van Doorn, A.; Koenderink, J.; Wagemans, J. Exocentric pointing in the visual field. i-Perception 2013, 4, 532–542. [Google Scholar] [CrossRef] [PubMed]
  83. Wagner, M.; Gambino, A.J. Variations in the anisotropy and affine structure of visual space: A geometry of visibles with a third dimension. Topoi Int. Rev. Philos. 2016, 35, 583–598. [Google Scholar] [CrossRef]
  84. Wagner, M.; Hatfield, G.; Cassese, K.; Makwinski, A.N. Differentiating between affine and perspective-based models for the geometry of visual space based on judgments of the interior angles of squares. Vision 2018, 2, 22. [Google Scholar] [CrossRef]
  85. Wagner, M. Sensory and cognitive explanations for a century of size constancy research. In Visual Experience: Sensation, Cognition, and Constancy; Hatfield, G., Allred, S., Eds.; Oxford University Press: Oxford, UK, 2012; pp. 63–86. ISBN 978-0-19-174188-3. [Google Scholar]
  86. Smeets, J.B.J.; Sousa, R.; Brenner, E. Illusions can warp visual space. Perception 2009, 38, 1467–1480. [Google Scholar] [CrossRef]
  87. Gogel, W.C. A theory of phenomenal geometry and its applications. Percept. Psychophys. 1990, 48, 105–123. [Google Scholar] [CrossRef]
  88. Predebon, J. Relative distance judgments of familiar and unfamiliar objects viewed under representatively natural conditions. Percept. Psychophys. 1990, 47, 342–348. [Google Scholar] [CrossRef]
  89. Predebon, J. The influence of object familiarity on magnitude estimates of apparent size. Perception 1992, 21, 77–90. [Google Scholar] [CrossRef] [PubMed]
  90. Gogel, W.C. An analysis of perceptions from changes in optical size. Percept. Psychophys. 1998, 60, 805–820. [Google Scholar] [CrossRef] [PubMed]
  91. Hatfield, G. Representation and constraints: The inverse problem and the structure of visual space. Acta Psychol. 2003, 114, 355–378. [Google Scholar] [CrossRef]
  92. Granrud, C.E. Development of size constancy in children: A test of the metacognitive theory. Atten. Percept. Psychophys. 2009, 71, 644–654. [Google Scholar] [CrossRef] [PubMed]
  93. Hatfield, G. Phenomenal and cognitive factors in spatial perception. In Visual Experience: Sensation, Cognition, and Constancy; Hatfield, G., Allred, S., Eds.; Oxford University Press: Oxford, UK, 2012; pp. 35–62. ISBN 978-0-19-174188-3. [Google Scholar]
  94. Widrow, B.; Stearns, S.D. Adaptive Signal Processing; Prentice Hall: Englewood Cliffs, NJ, USA, 1985; ISBN 978-0-13-004029-9. [Google Scholar]
  95. Haykin, S. Adaptive Filter Theory; Prentice Hall: Englewood Cliffs, NJ, USA, 1986; ISBN 978-0-13-004052-7. [Google Scholar]
  96. Widrow, B.; Walach, E. Adaptive Inverse Control; Prentice Hall: Upper Saddle River, NJ, USA, 1996; ISBN 978-0-13-005968-0. [Google Scholar]
  97. Ito, M. The Cerebellum and Neural Control; Raven Press: New York, NY, USA, 1984; ISBN 978-0-89004-106-2. [Google Scholar]
  98. Barlow, J.S. The Cerebellum and Adaptive Control; Cambridge University Press: Cambridge, UK, 2002; ISBN 978-0-521-80842-2. [Google Scholar]
  99. Llinás, R.R. The noncontinuous nature of movement execution. In Motor Control: Concepts and Issues; Humphrey, D.R., Freund, H.-J., Eds.; John Wiley: Chichester, UK, 1991; pp. 223–242. [Google Scholar]
  100. Llinás, R.R. Electrophysiology of the cerebellar networks. In Comprehensive Physiology; John Wiley & Sons, Ltd.: Hoboken, NJ, USA, 2011; pp. 831–876. ISBN 978-0-470-65071-4. [Google Scholar]
Figure 1. A block diagram illustrating how a recursive reinforcement learning loop can tune the attractor state of an error-reducing association memory network to obtain an appropriate association between a specified collage of place-and-posture encoded visual images that span the required visual task space and an appropriate synergy selection code (ci, e1, e2, e3). The synergy selection code generates or retrieves from motor memory its associated low-dimensional synergy submanifold embedded in the 116 D configuration manifold. Each point within the low-dimensional submanifold corresponds to a place and posture in the configuration manifold. Thereby, each point is associated with a previously acquired place-and-posture encoded visual image of the environment and of the body in that environment as seen from that place and posture. For the synergy selection code c i , e 1 , e 2 , e 3 to be correct, the place-and-posture encoded visual images associated with points in the synergy submanifold must match the given collage of place-and-posture encoded visual images spanning the visual task space. These encoded visual images are compared by a visual image comparator and any reduction in the mismatch error between the encoded visual images is rewarded by the error-reducing reinforcement system. This reward has the form of the release of a short burst of dopamine onto neurons distributed throughout the error-reducing association memory network. Dopamine facilitates synaptic sensitivity modification, allowing the pattern of neural activity in the network to converge towards an attractor state with minimum visual-image mismatch error. The synergy selection code also retrieves from memory all the neural adaptive filter parameters needed to tune the feedforward–feedback, synergy-dependent, feature extraction and sensory–motor transformations required by the movement control system, described in Appendix A.
Appliedmath 05 00052 g001
Figure 2. Graphs of S k r in Equation (21) for smooth submanifolds with constant hyperbolic negative curvature K = 1 R 2 , constant flat curvature K = 0 and constant elliptical positive curvature K = 1 R 2 . In each case, the Jacobi vector η r is orthogonal to each radial geodesic α s r at each radial distance r along the geodesic but, as shown in Equation (20), the G-norm of the vector η ( r )   G is proportional to the function S k r along each radial geodesic α s r . Consequently, for submanifolds with constant negative curvature K = 1 R 2 , neighboring geodesics diverge and accelerate away from each other, thus the submanifold expands. For flat submanifolds with constant zero curvature K = 0 , the G-norm of the vector η ( r )   G increases linearly along α s r , while for submanifolds with constant positive curvature K = 1 R 2 , the neighboring geodesics α s r accelerate towards each other and eventually cross, thus the submanifold contracts.
Appliedmath 05 00052 g002
Figure 3. Illustration showing how the size and shape of a 2D synergy submanifold spanned by radial unit speed geodesics α 0 r , α 1 r , α 2 r and α 3 r change with curvature. In each sketch the green arrows represent transverse co-ordinates that are not geodesics (see Section 7.1.2). (i) A sketch of the decelerating convergence of radial geodesics on a constant positively-curved spherical submanifold when the positive curvature is large. For the constant positive curvature of a sphere to be large, the radius of the sphere has to be small and, consequently, the submanifold is small. (ii) A sketch of the decelerating convergence of radial geodesics on a constant positively-curved spherical submanifold when the positive curvature is small. For the constant positive curvature of a sphere to be small, the radius of the sphere has to be large and, consequently, the submanifold is large. (iii) A sketch of the accelerating divergence of radial geodesics on a constant negatively-curved hyperbolic submanifold when the negative curvature is small. For the constant negative curvature of a hyperbolic space to be small, its radius has to be large and, consequently, the diverging submanifold is large. (iv) A sketch of the accelerating divergence of radial geodesics on a constant negatively-curved hyperbolic submanifold when the negative curvature is large. For the constant negative curvature of a hyperbolic space to be large, its radius has to be small and, consequently, the diverging submanifold is small.
Appliedmath 05 00052 g003
Disclaimer/Publisher’s Note: The statements, opinions and data contained in all publications are solely those of the individual author(s) and contributor(s) and not of MDPI and/or the editor(s). MDPI and/or the editor(s) disclaim responsibility for any injury to people or property resulting from any ideas, methods, instructions or products referred to in the content.

