Article

Sex-Specific Responses to Tacrolimus and Mycophenolate Mofetil in Spontaneously Hypertensive Rats

by
Rodrigo Oscar Marañón
1,2,3 and
Mohadetheh Moulana
2,3,4,*
1
Instituto de Fisiología, Facultad de Medicina—INSIBIO, Universidad Nacional de Tucumán, CONICET, San Miguel de Tucumán 4000, Argentina
2
Department of Physiology and Biophysics, University of Mississippi Medical Center, Jackson, MS 39216, USA
3
Women’s Health Research Center, University of Mississippi Medical Center, Jackson, MS 39216, USA
4
Department of Psychiatry and Human Behavior, University of Mississippi Medical Center, Jackson, MS 39216, USA
*
Author to whom correspondence should be addressed.
Future Pharmacol. 2023, 3(4), 862-876; https://doi.org/10.3390/futurepharmacol3040052
Submission received: 30 August 2023 / Revised: 4 October 2023 / Accepted: 16 October 2023 / Published: 10 November 2023

Abstract

:
In recent decades, the roles of tacrolimus and mycophenolate mofetil (MMF) in hypertension have been under discussion. However, the question of whether there are sex-specific responses to these agents has not received enough attention. Aim: To evaluate sex-specific differences in the responses to tacrolimus and mycophenolate mofetil in female (F) and male (M) spontaneously hypertensive rats (SHRs) and evaluate whether T cells contribute to mean arterial pressure (MAP) changes. Methods: Male and female SHRs received either tacrolimus or MMF for 14 days. The rats were implanted with radiotelemeters. MAP was measured chronically; then, circulating and renal infiltrated CD4+, CD8+, T helper 17 (Th17), and T regulatory (Treg) cells were quantified using flow cytometry. Key Findings: Tacrolimus increased MAP only in males, and it decreased CD4+ and CD8+ T cells in both males and females (p < 0.05). The tacrolimus-induced reduction of renal CD4+ and Treg cells was more profound in males. MMF reduced MAP and circulating and renal CD4+ and CD8+ T cells in the male and female rats. MMF also decreased Th17 and Treg cells in both sexes, but the decrease in Th17 was higher in males (p < 0.05) and the reduction in Treg cells was higher in females (p < 0.05). Our findings indicate that the effects of tacrolimus and MMF on renal T cell subsets are sex-specific. Significance: Targeting T cells in hypertension using therapeutic agents may have different effects on men and women; so, the management of hypertension and post-transplant hypertension using these agents should be specified by gender.

1. Introduction

Hypertension is a modifiable risk factor responsible for the high morbidity and mortality of cardiovascular events [1]. Within its pathogenesis, the immune system may contribute to the development and maintenance of hypertension [2]. Consequently, it involves inflammatory mechanisms in the kidney, peripheral vasculature, and central nervous system [3,4,5,6]. Several studies have demonstrated that hypertension in males and females is partly mediated by the activated immune system, particularly the adaptive immune system [2,6]; however, the precise mechanism(s) underlying sex differences in hypertension remain unclear.
Compelling evidence suggests that T cells play a significant role in hypertension [2,3,6,7,8]. Therefore, targeting them with immunosuppressive agents such as tacrolimus and mycophenolate mofetil (MMF) may be considered an alternative therapy for severe forms of hypertension. Tacrolimus (FK-506), a potent immunosuppressive agent, is used to decrease the incidence of allograft rejection, rheumatoid arthritis, multiple sclerosis, and systemic lupus erythematosus [9]. Tacrolimus’ mode of immunosuppressive action is well documented; it binds to the immunophilin FK-506 binding protein and blocks the proliferative response of T cells to antigens by inhibiting the phosphatase activity of calcineurin, thereby inducing a reduction in T cells [10,11,12]. MMF is a prodrug of mycophenolic acid (MPA) used for renal or cardiac allograft rejection. It is an inhibitor of inosine-5’-monophosphate dehydrogenase that blocks the cell cycle, inhibits T and B lymphocyte proliferation, and induces apoptosis [13].
Immunosuppressive agents have been used in several animal studies to demonstrate the role of immune cells in hypertension. However, the effect of immunosuppression on hypertension is inconsistent. On the one hand, studies on male hypertensive rats have determined that immunosuppressive agents ameliorate blood pressure, suggesting that the immune cells contribute to blood pressure regulation in males [3,8,12,13,14]. On the other hand, it has been demonstrated that some immunosuppressive agents increase blood pressure [15]. Interestingly, a study on SHRs revealed that female SHRs have a superior MMF response compared with males, suggesting that the immune cells play a more significant role in female hypertension [6]. However, it is unknown whether this is the case for tacrolimus, thus necessitating its investigation. Moreover, whether different immunosuppressive agents have sex-specific effects on hypertension needs to be elucidated. Therefore, the present study tested the hypothesis that there are sex-specific differences in the role of T cells in mediating hypertension in SHRs. To test the hypothesis, we studied the blood pressure responses to two different immunosuppressive agents, tacrolimus and MMF, in male and female SHRs.

2. Materials and Methods

2.1. Experimental Animals

Spontaneously hypertensive rats (SHRs), male (M: n = 28) and female (F: n = 28), aged three months, were obtained from Taconic Farms (Germantown, NY, USA). The rats were housed on a 12-h light/dark schedule in a temperature-controlled (25 °C) room in the Animal Care Facility at the University of Mississippi Medical Center, approved by the American Association for the Accreditation of Laboratory Animal Care. The animals were given ad libitum access to standard rat chow and water throughout the study, except when they were required to fast the night before the metabolic cage. All protocols were approved by the Animal Care and Use Committee of the University of Mississippi Medical Center (approval protocol: #297E). After the experiment, the rats were deeply anesthetized.

2.2. Experimental Design I

The SHRs [male (M): n = 7 and female (F): n = 7] were randomly divided into four groups according to whether they would receive vehicle (Control) or tacrolimus (T) treatment (M-C, M-T, F-C, and F-T). The SHRs (male and female) received tacrolimus suspended in saline in daily doses (0.25 mg/kg/day, i.p.) for 14 days, and each Control group received vehicle. Body weight and food intake measurements were collected daily.

2.3. Experimental Design II

The SHRs (male (M): n = 7 and female (F): n = 7) were randomly divided into four groups according to whether they would receive the vehicle (Control) or MMF treatment (M-C, M-MMF, F-C, and F-MMF). The SHRs (male and female) received MMF suspended in 5% dextrose, with daily doses (20 mg/kg/day, i.p.) for 14 days, and each Control group received vehicle. Body weight and food intake measurements were collected daily.
To determine tacrolimus and MMF dosage, a search of PubMed was conducted. Several different studies that have reported administration of tacrolimus and MMF in the specific species were reviewed (8, 9,11–15). Based on these previous studies, the dosages were determined and a small sample size was tested prior to the actual experiments.

2.4. Blood Pressure Measurement

Rats were implanted with radiotelemetry transmitters (TA11PA-C40; Data Sciences International, St. Paul, MN, USA) into the abdominal aorta below the renal arteries, as we previously described [16]. Using an induction chamber, rats were subjected to an induction dose of isoflurane varying from 2–3% isoflurane in 100% oxygen. Then, isoflurane was individually regulated and delivered at 1–3% for maintenance through a sterile nose cone. While under gas isoflurane, the depth of anesthesia was monitored regularly. After two weeks of recovery, 5–7 days of baseline mean arterial pressure was measured. Following baseline, rats received tacrolimus/MMF or vehicle treatment for 14 days, and mean arterial pressure was measured during this period.

2.5. Urinary Protein, Albumin, Sodium, and Nitrate Excretion

For these studies, rats were placed in individual metabolic cages for 24-h collection of urine for the measurement of protein, albumin, sodium, and nitrate excretion at the end of the drug administration period. These cages were equipped with a double-fine mesh screen that separated food and feces contamination from collected urine. After a one-day adaptation, 24 hr food and water intake and urine output volume were measured for three consecutive days. Urinary protein excretion was measured by the method of Bradford [17] with the use of a commercially available reagent (Bio-Rad, Richmond, CA, USA), and urinary albumin excretion was measured using the Nephrat ELISA (Exocell, Philadelphia, PA, USA). Urinary sodium concentration was measured by atomic absorption spectrophotometry (Instrumentation Laboratory) and expressed as urinary sodium excretion [18]. Nitrate/nitrite excretion (NOx) was measured in urine from rats placed in metabolism cages for 24 h. Nitrate/nitrite was measured as previously described by our laboratory [19].

2.6. Two-Color Flowcytometry

After the experiment, blood and kidney samples were collected. To enable the detection of circulating and infiltrated T cell subsets, the T cell panel was designed. Then, cells were stained for expression of CD4, CD8, CD25, and IgM using purified mouse anti-rat CD4, CD8a, CD25 (BD Biosciences, San Jose, CA, USA), and anti-IgM-FITC-conjugated (Southern Biotech, Birmingham, AL, USA) antibodies, as described previously [20]. To identify pro-inflammatory Th17 (CD4+CD25RORγ+) cells from anti-inflammatory Treg (CD4+CD25+FoxP3+) cells, further leukocytes were stained for CD4, CD25, ROR-γt, or FoxP3 expression. Cells were permeabilized and fixed before staining for the intracellular RAR-related orphan receptor-γ (ROR-γ) and X-linked forkhead/winged helix (FoxP3) transcription factors, using anti-ROR-γ-PE-conjugated (R&D Systems, Inc., Minneapolis, MN, USA) and anti-FoxP3-Allophycocyanin (APC)-conjugated antibodies (eBioscience, San Diego, CA, USA), as described previously [20]. After intracellular staining, CD4+ T cells were selected in order to segregate Th17 from Treg subsets. The percentage of ROR-γ+ and FoxP3+ cells were measured within the gate (selected population). Th17 were measured as CD4+CD25-ROR-γ+ and Treg were measured as CD4+CD25+Foxp3+. The number of cells of interest were measured by flow cytometry (Beckman Coulter Gallios Analyzer, Beckman Coulter, Inc., Indianapolis, IN, USA). Negative control for each rat was performed using isotype controls matched to each primary antibody’s host species, isotype, and conjugation format. The percent of positive staining cells above the negative control was collected for each individual rat, and mean values for each experimental group (Control, Treated) were calculated. To correctly interpret flow cytometry data and count for background antibody fluorescence, the Fluorescence Minus One Control (FMO) principle was used. The Forward and Side Scatter gating strategy was applied. First, leukocyte populations were identified; subsequently, lymphocytes were gated, and T cells were identified by expression of CD4+ and CD8+ markers, respectively. Then, CD4+ T cells were selected, and further gating identified Th17 (CD4+CD25-RORγ+) T cells from (CD4+CD25+FoxP3+) Treg subsets.

2.7. Tissue Digestion for Lymphocyte Preparation

Kidneys were collected in PBS and held at 4 °C in sterile Hank’s balanced salt solution. Kidneys were minced with a razor blade, digested at 37 °C for 1 hr in RPMI + 125 U/mL Collagenase IV + 200 ug/mL DNase I, and processed as described previously [20]. Cells were collected, processed, and quantified by flow cytometry.

2.8. Statistical Analyses

All data are expressed as mean ± SEM. Data were analyzed by Student’s t-test (for two groups) or one-way Analysis of Variance (ANOVA) with multiple repeat measures. Differences were considered statistically significant at p < 0.05.

3. Results

3.1. Body Weights

Body weights were similar in 16–17 week old rats exposed to tacrolimus or vehicle treatment in the same sex, respectively [(M-C: 386 ± 9 g, n = 7 vs. M-T: 366 ± 15 g, n = 7, p: NS) (F-C: 199 ± 8 g, n = 7 vs. F-T: 193 ± 7 g, n = 7, p: NS)]. Similarly, MMF treatment did not change body weight in all groups [(M-C: 313 ± 3 g, n = 7 vs. M-MMF: 318 ± 6 g, n = 7, p: NS) (F-C: 190 ± 8 g, n = 7 vs. F-MMF: 198 ± 9 g, n = 7, p: NS)]. In addition, food intake and water intake were measured once a week for the entire period of study and there were no significant changes in these parameters.

3.2. Mean Arterial Blood Pressure

The blood pressure baseline period was 5–7 days. After that, the drug was administered for 14 days in each case. In the case of the tacrolimus, the baseline period was 5 days (Figure 1A,B). On the other hand, the baseline period for MMF was 7 days (Figure 1C,D). Mean arterial pressure (MAP) was higher in male-control than female-control SHRs (Figure 1A,B). After a four-day baseline period, tacrolimus treatment increased blood pressure in males (M-C: 143 ± 3 vs. M-T: 163 ± 4 mmHg, p < 0.05; Figure 1A), and elevated blood pressure in M-T rats was maintained during the whole treatment period. However, as shown in Figure 1B, tacrolimus treatment did not affect female rats (F-C: 132 ± 3 vs. F-T: 133 ± 2 mmHg, p: NS; Figure 1B). In contrast, chronic administration of MMF decreased MAP in both males (M-C: 153 ± 2 vs. M-MMF: 140 ± 2 mmHg, p < 0.05; Figure 1C) and females (F-C: 128 ± 2 vs. F-MMF: 113 ± 2 mmHg, p < 0.05; Figure 1D). After the baseline period, M-MMF and F-MMF showed an increase in blood pressure on days 7 and 8 (days 2 and 3 for treatment), respectively, then the values decreased. F-MMF has a faster depressor response than M-MMF, but by the end of day 10 of the MMF treatment period, both the absolute numerical reduction (M-MMF: 5 ± 1; F-MMF: 13 ± 1 mmHg; p: NS) and the percentage reduction (M-MMF: 10 ± 1%; F-MMF: 11 ± 1%; p: NS) in MAP were similar between groups.

3.3. Renal Function

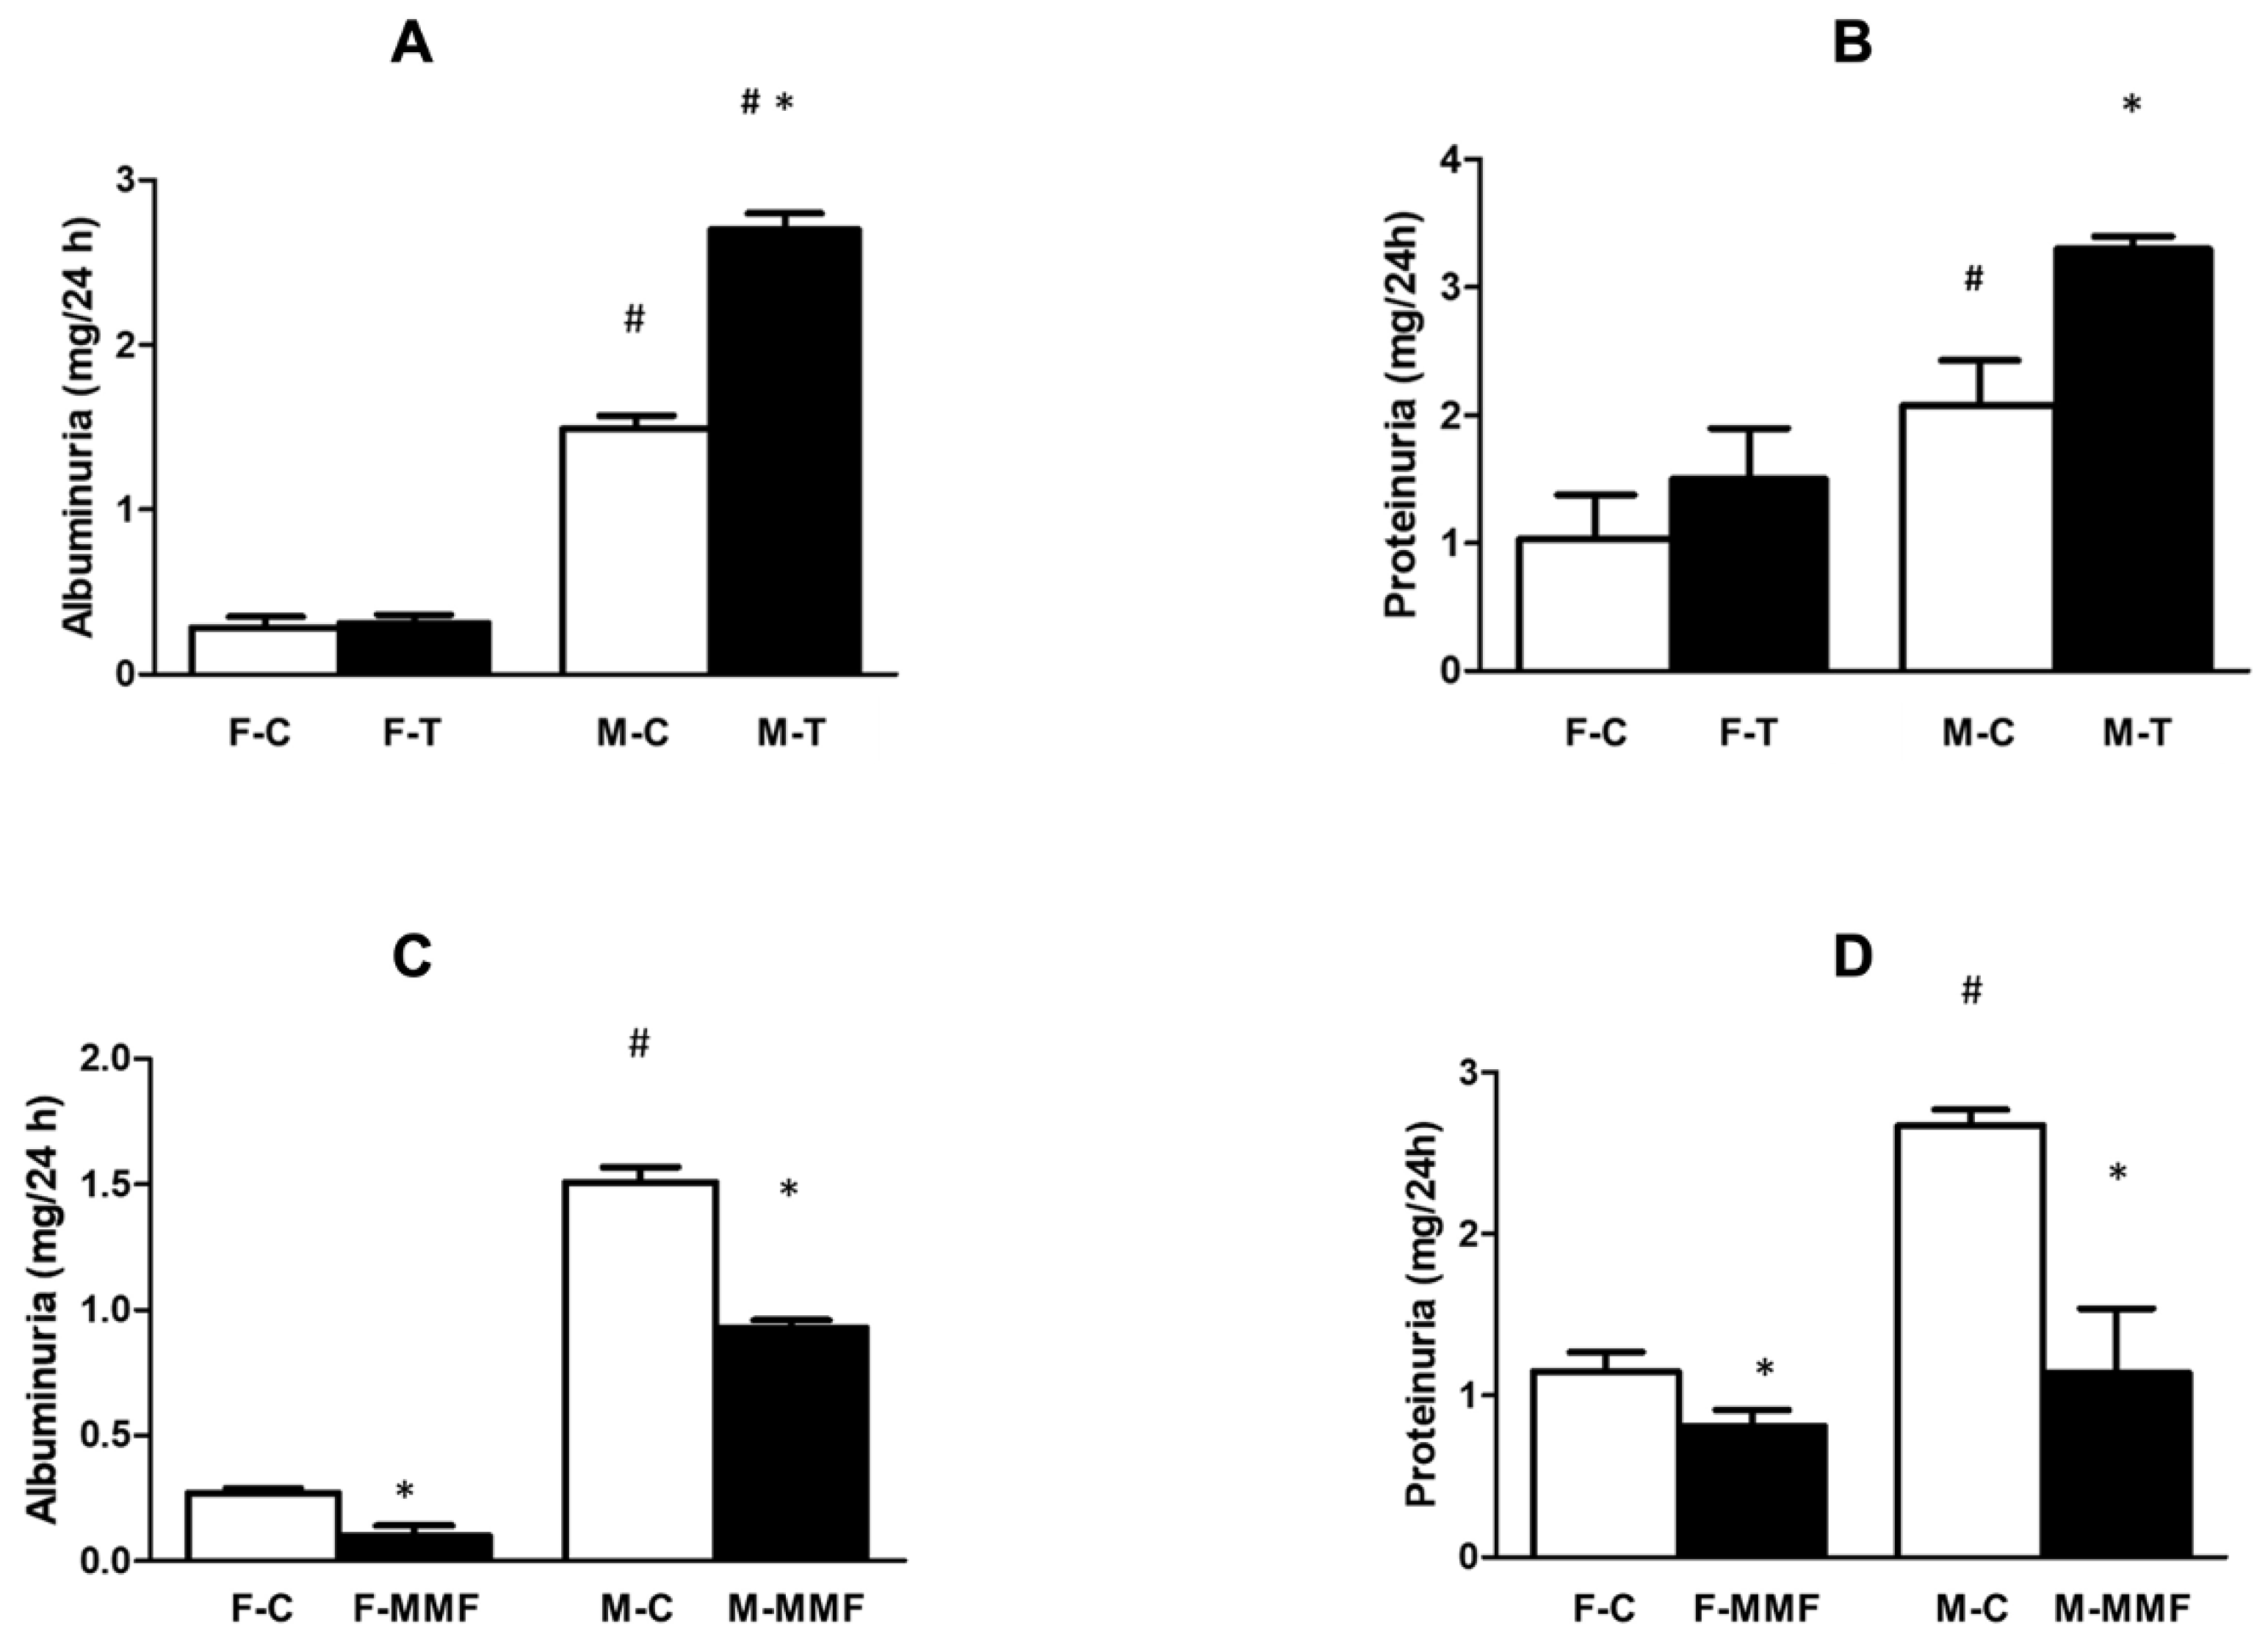
To see if the kidneys were affected, albuminuria and proteinuria were evaluated in all groups. The albuminuria was much higher in male-control than in female-control rats (p < 0.05). Albuminuria and proteinuria were significantly increased in males [(M-C: 1.49 ± 0.08 mg/24 h vs. M-T: 2.7 ± 0.1 mg/24 h) and (M-C: 2.1 ± 0.3 mg/24 h vs. M-T: 3.3 ± 0.1 mg/24 h)], respectively, after tacrolimus administration but without significant changes in females [(F-C: 0.3 ± 0.07 mg/24 h vs. F-T: 0.3 ± 0.05 mg/24 h) and (F-C: 1 ± 0.3 mg/24 h vs. F-T: 1.5 ± 0.4 mg/24 h, p: NS); Figure 2 A,B)]. In contrast, MMF treatment significantly improved these parameters in males [(M-C: 1.5 ± 0.06 mg/24 h vs. M-MMF: 0.9 ± 0.03 mg/24 h) and (M-C: 2.7 ± 0.1 mg/24 h vs. M-MMF: 1.1 ± 0.4 mg/24 h, p < 0.05); Figure 2 C,D], and females [(F-C: 0.27 ± 0.02 mg/24 h vs. F-MMF: 0.1 ± 0.04 mg/24 h) and (F-C: 1.2 ± 0.1 mg/24 h vs. F-MMF: 0.8 ± 0.1 mg/24 h, p < 0.05); Figure 2C,D], respectively.
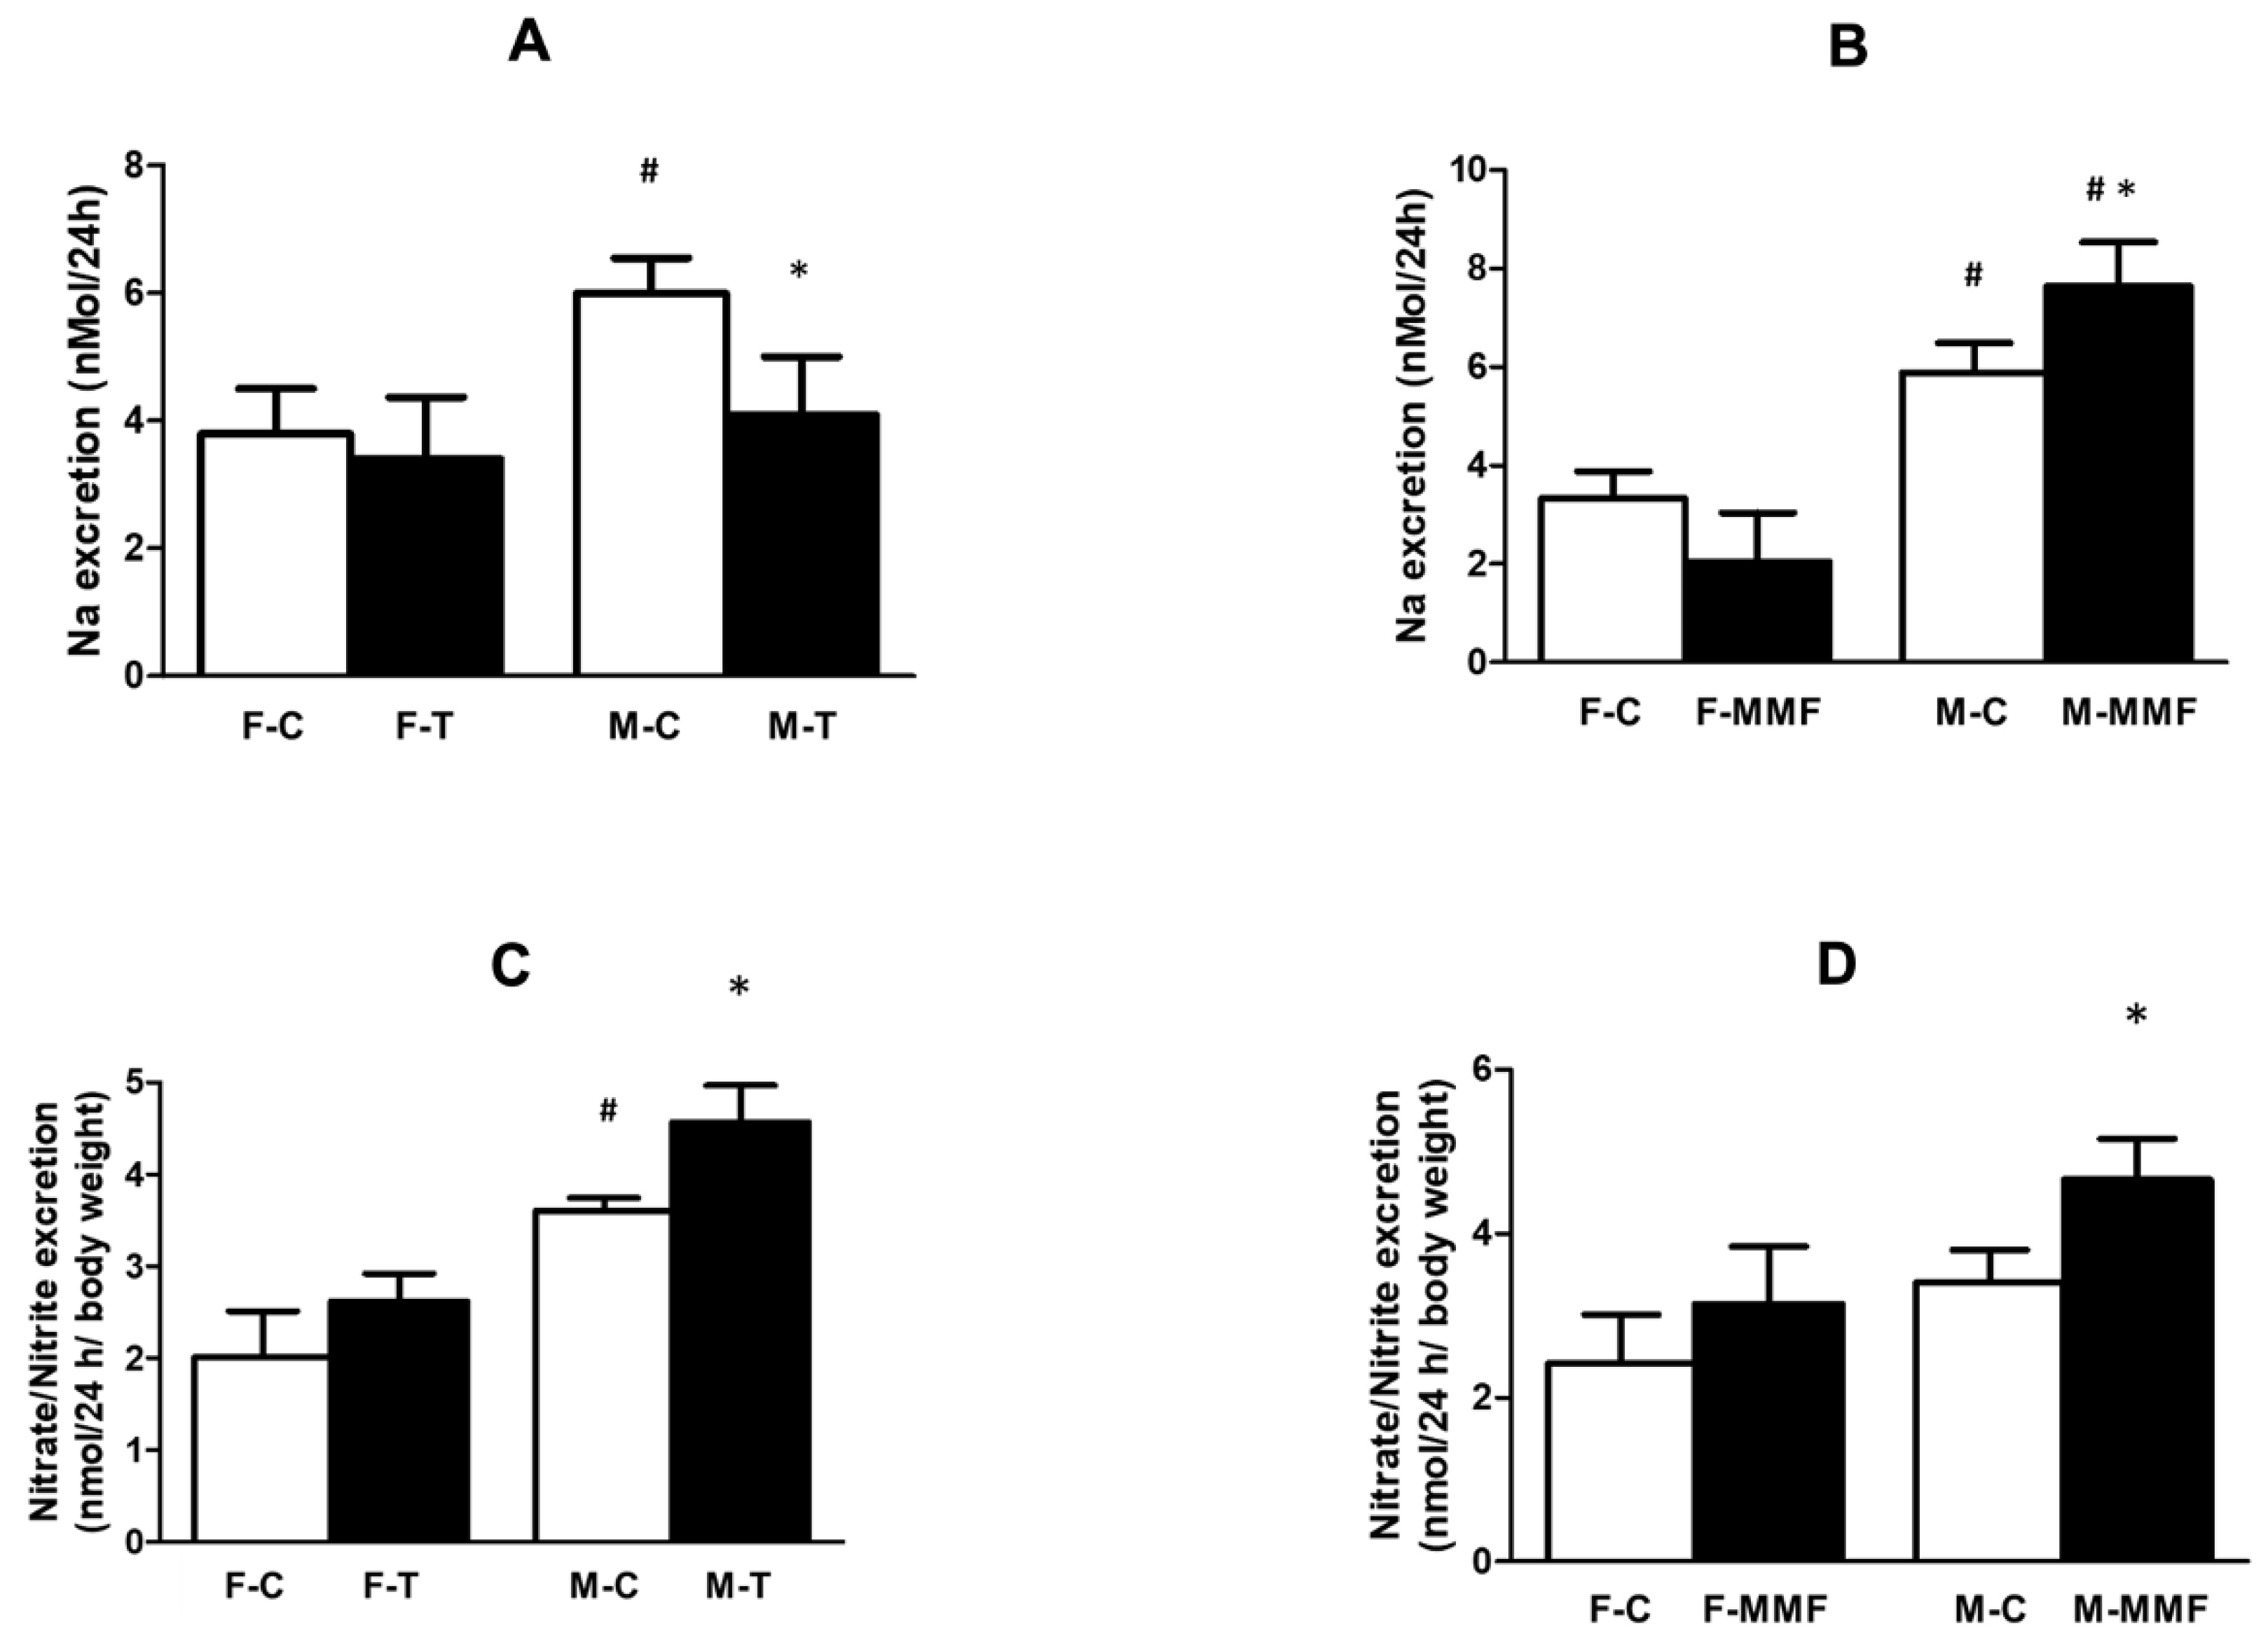
In the present study, to complement the albuminuria/proteinuria evaluation, urinary sodium excretion was assessed in all groups. It was found that urinary sodium excretion was higher in male control than female control rats (p < 0.05). Tacrolimus decreased urinary Na+ excretion in males versus their controls (p < 0.05; Figure 3A) but did not affect female rats [(M-C: 6 ± 0.55 mmol/24 h vs. M-T: 4.1 ± 0.9 mmol/24 h, p < 0.05) and (F-C: 3.8 ± 0.7 mmol/24 h vs. F-T: 3.4 ± 0.97 mmol/24 h, p: NS)]. In contrast, MMF treatment increased sodium excretion in male rats (Figure 3B) but had no effect on females [(M-C: 5.9 ± 0.6 mmol/24 h vs. M-MMF: 7.6 ± 0.9 mmol/24 h, p < 0.05) and (F-C: 3 ± 0.6 mmol/24 h vs. F-MMF: 2 ± 1 mmol/24 h, p: NS)]. We also determined the level of nitrate/nitrite excretion in urine from all groups. The male SHRs excreted higher baseline NOx compared with females (M-C: 3.6 ± 0.1 μmol/24 h/kg vs. F-C: 2 ± 0.5 μmol/24 h/kg, p < 0.05; Figure 3C). NOx levels were further significantly increased after tacrolimus and MMF treatment only in males [(M-C: 3.6 ± 0.1 μmol/24 h/kg vs. M-T: 4.6 ± 0.4 μmol/24 h/kg, p < 0.05) (F-C: 2 ± 0.5 μmol/24 h/kg vs. F-T: 2.6 ± 0.3 μmol/24 h/kg, p: NS)] and [(M-C: 3.4 ± 0.4 μmol/24 h/kg vs. M-MMF: 4.7 ± 0.5 μmol/24 h/kg, p < 0.05) (F-C: 2.4 ± 0.6 μmol/24 h/kg vs. F-MMF: 3.14 ± 0.7 μmol/24 h/kg, p: NS); Figure 3C,D], respectively, indicating that nitric oxide bioavailability was not impaired. These data suggest a sex-specific difference in response to tacrolimus and MMF treatment in male and female SHRs regarding renal function.

3.4. Circulatory and Renal T Cell Subsets

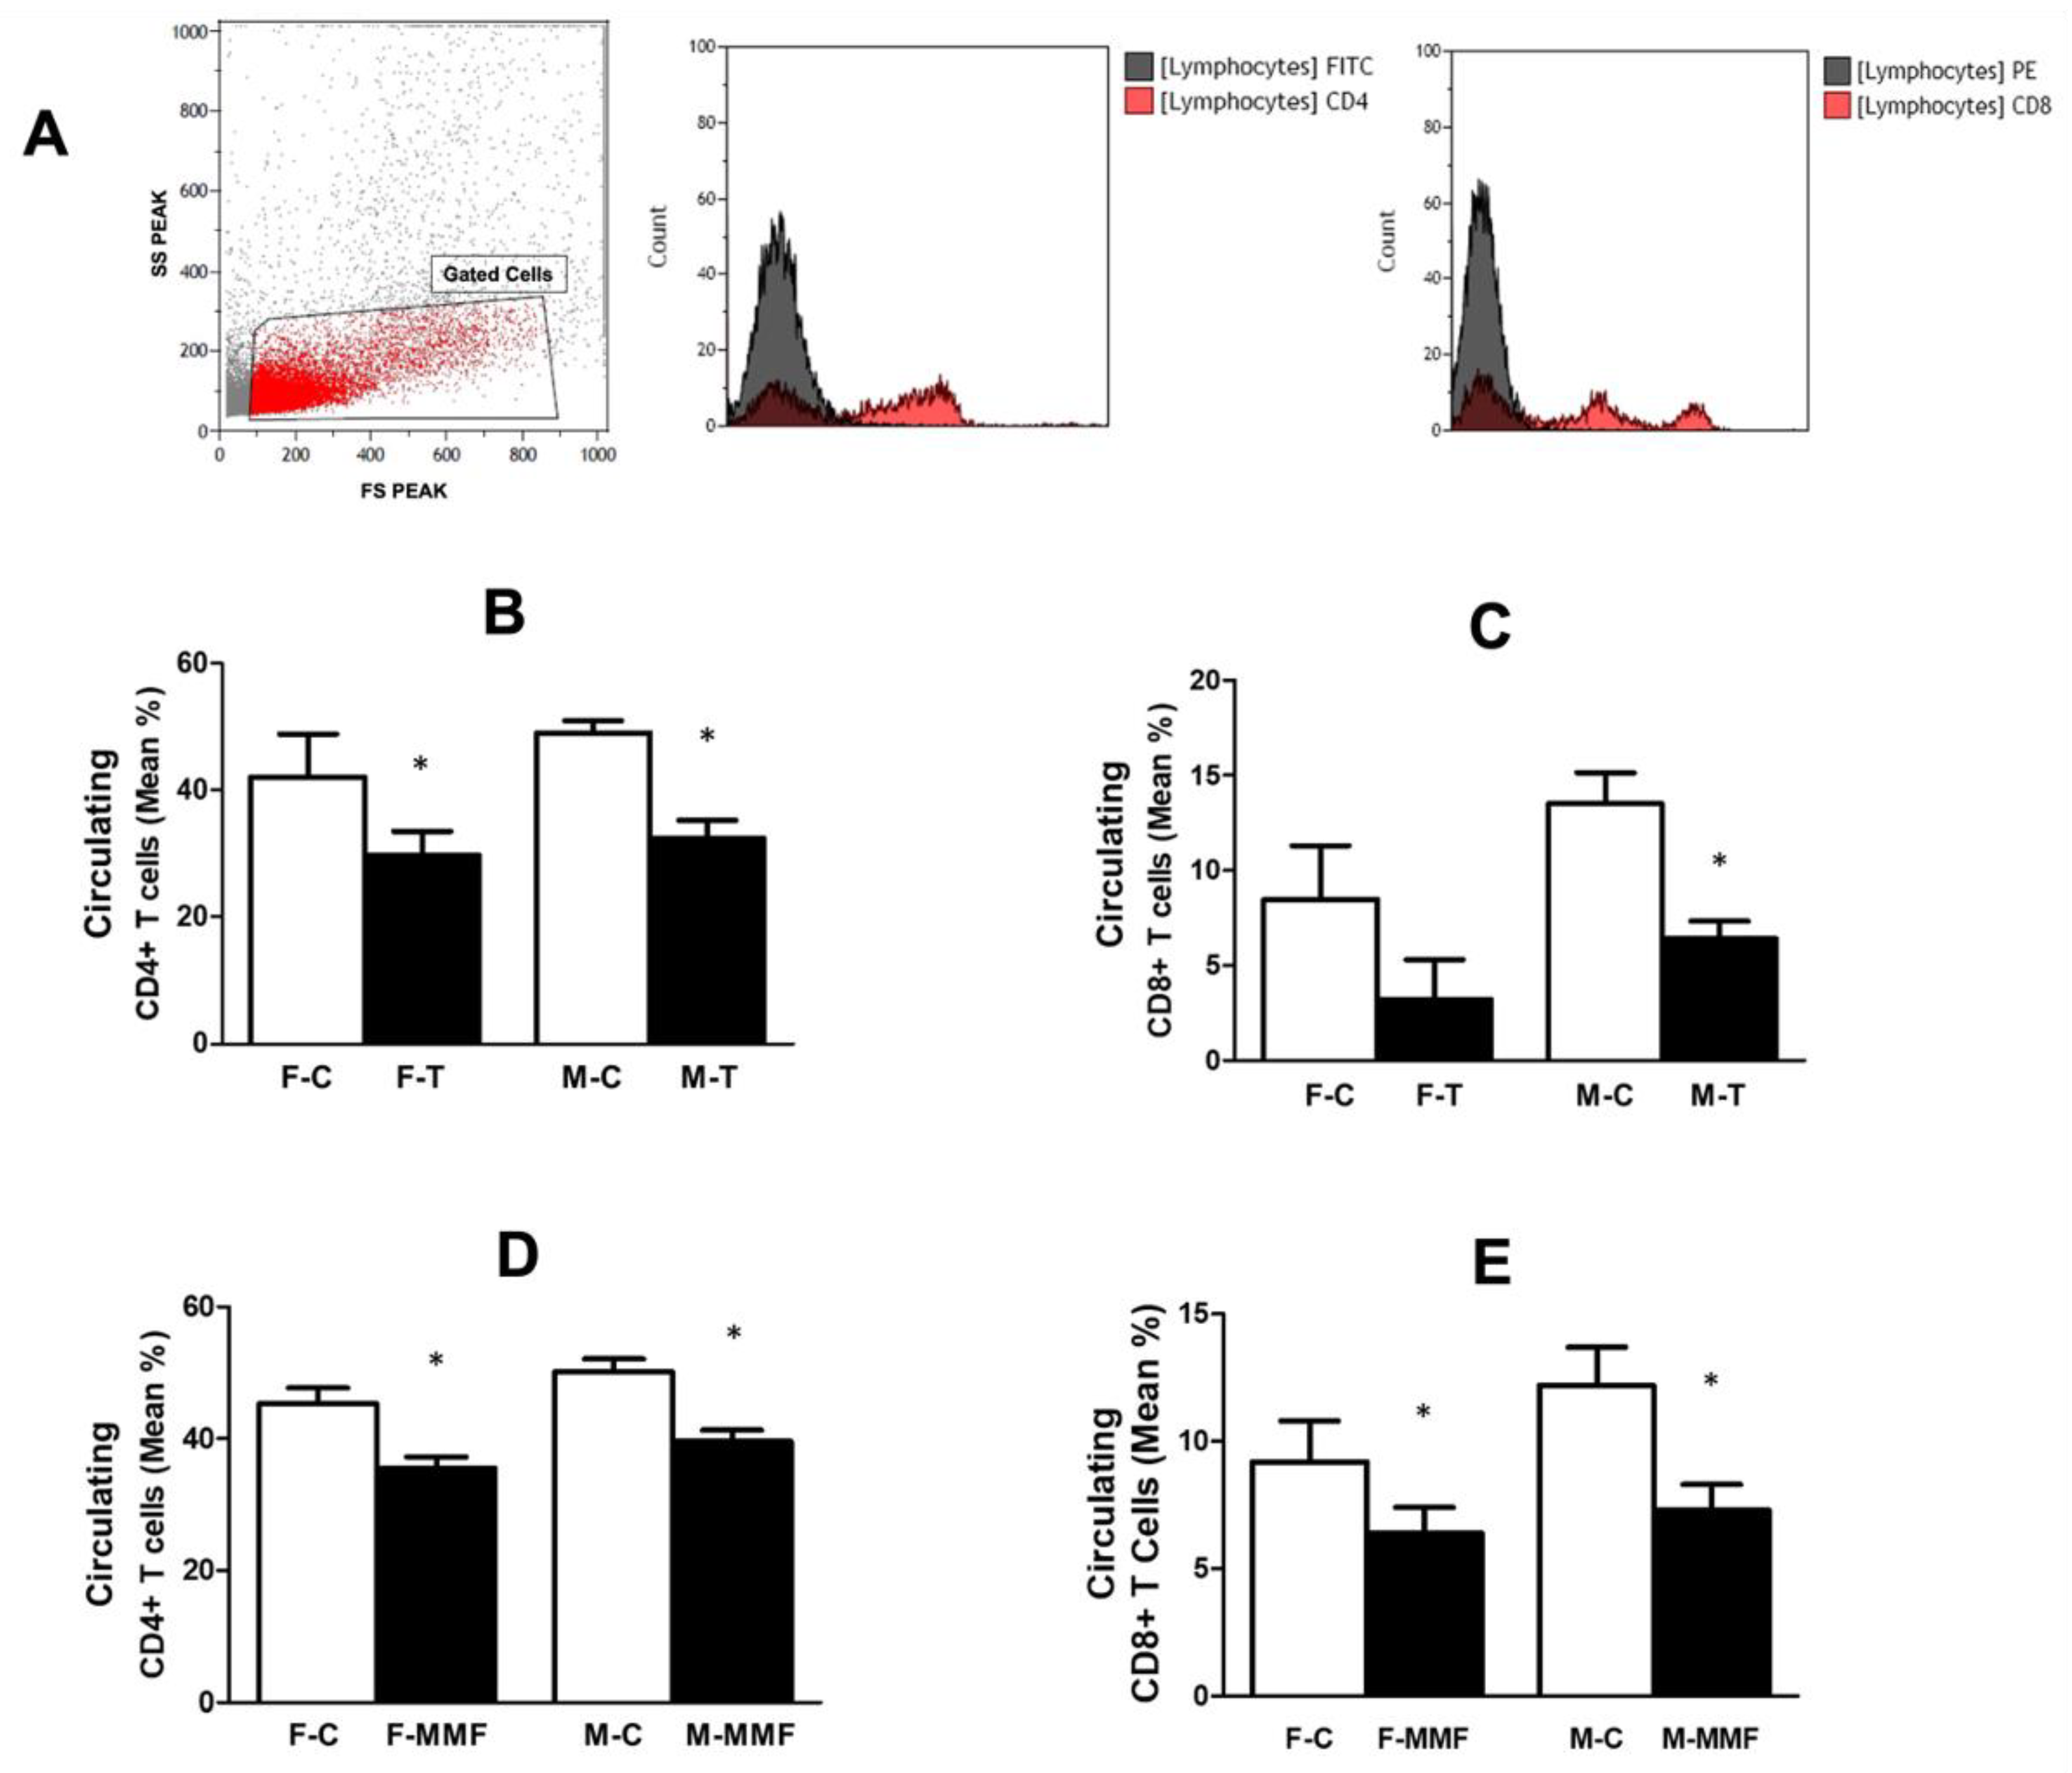
In the present study, the effect of tacrolimus and MMF on circulating and renal T cell subsets was evaluated in all groups. As Figure 4 shows, tacrolimus treatment decreased the percentage of the circulatory CD4+ T cells by a similar extent in males (M-C: 49 ± 2 vs. M-T: 32 ± 3% gated, p < 0.05) and females (F-C: 42 ± 7 vs. F-T: 30 ± 4% gated, p < 0.05; Figure 4B). Tacrolimus also reduced circulatory CD8+ in males by 52% (M-C: 13.5 ± 1.6 vs. M-T: 6.4 ± 1%, p < 0.05; Figure 4C) and in females by 62% (F-C: 8.47 ± 2 vs. F-T: 3.2 ± 2% gated, p < 0.05; Figure 4C). Similarly, MMF significantly reduced the circulating CD4+ T cells in both male and female rats by 21%; [(M-C: 50 ± 2 vs. M-MMF: 40 ± 1.7% gated) and (F-C: 45 ± 2.4 vs. F-MMF: 36 ± 1.7% gated, p < 0.05); Figure 4D], respectively, despite a higher percentage of CD4+ T cells in male compared with female rats (p < 0.05; Figure 4D). The percentage of circulating CD8+ T cells was significantly decreased in both males and females by MMF treatment [(M-C:12.2 ± 1.5 vs. M-MMF: 7.3 ± 1% gated) and (F-C: 9.2 ± 1.6 vs. F-MMF: 6.4 ± 1% gated, p < 0.05); Figure 4E].
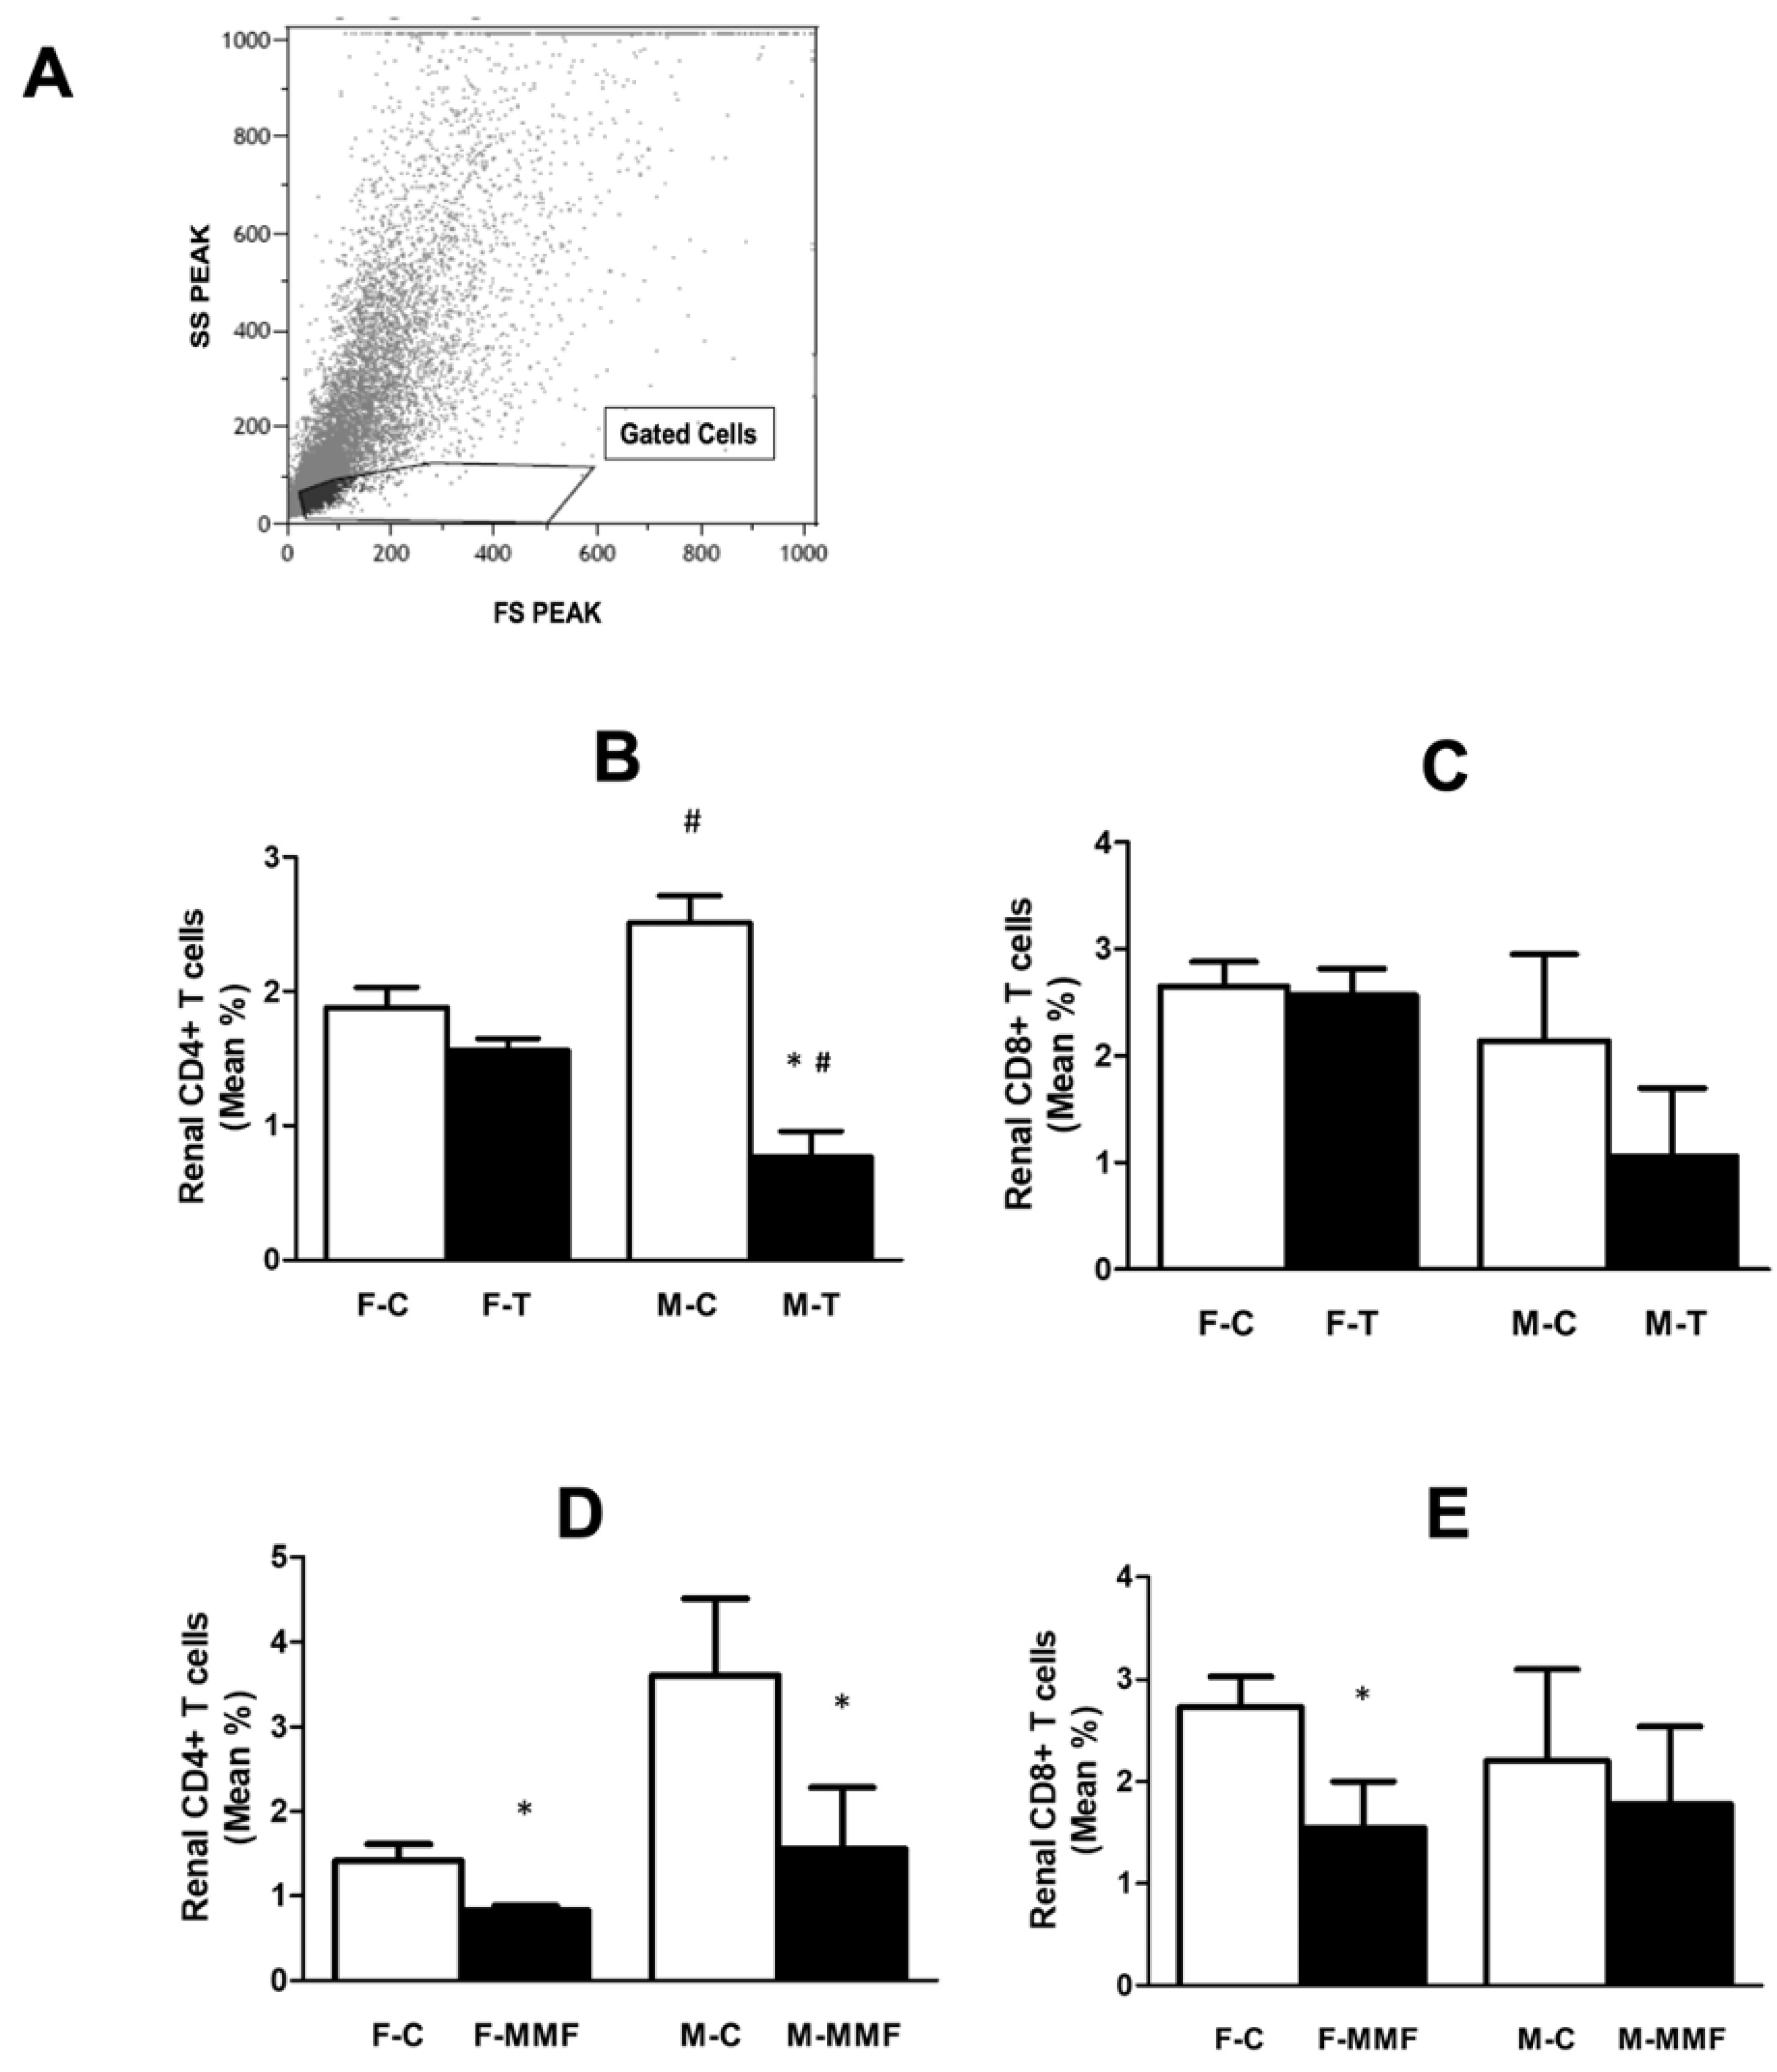
The renal infiltrated T cell subsets were measured, given the significant role of kidneys in the long-term control of blood pressure on the one hand and the contribution of renal T cells in hypertension on the other hand. In renal tissue, tacrolimus treatment significantly reduced CD4+ in both male and female rats compared with controls [(M-C: 2.5 ± 0.2 vs. M-T: 0.77 ± 0.2% gated, p < 0.001) and (F-C: 1.9 ± 0.15 vs. F-T: 1.6 ± 0.1% gated, p < 0.05); Figure 5B]; however, a more significant effect was observed in the male rats (p < 0.001). No significant reduction was observed in CD8+ in any groups [(M-C: 2.14 ± 0.8 vs. M-T: 1 ± 0.6% gated, p: NS) and (F-C: 2.65 ± 0.2 vs. F-T: 2.57 ± 0.25% gated, p: NS); Figure 5C]. Similarly, MMF reduced the CD4+ T cells in the renal tissue of both male (57%) and female (42%) rats. Renal CD4+ T cells were higher in males compared with their female counterparts [(M-C: 3.6 ± 0.9 vs. M-MMF: 1.6 ± 0.7% gated, p < 0.05) and (F-C: 1.4 ± 0.2 vs. F-MMF: 0.8 ± 0.05% gated, p < 0.05); Figure 5D]. While MMF treatment significantly decreased the percentage of CD8+ T cell infiltration in females, no significant change was observed in males [(M-C: 2.2 ± 0.9 vs. M-MMF: 1.8 ± 0.76% gated, p: NS) and (F-C: 2.7 ± 0.3 vs. F-MMF: 1.6 ± 0.8% gated, p < 0.05); Figure 5E].
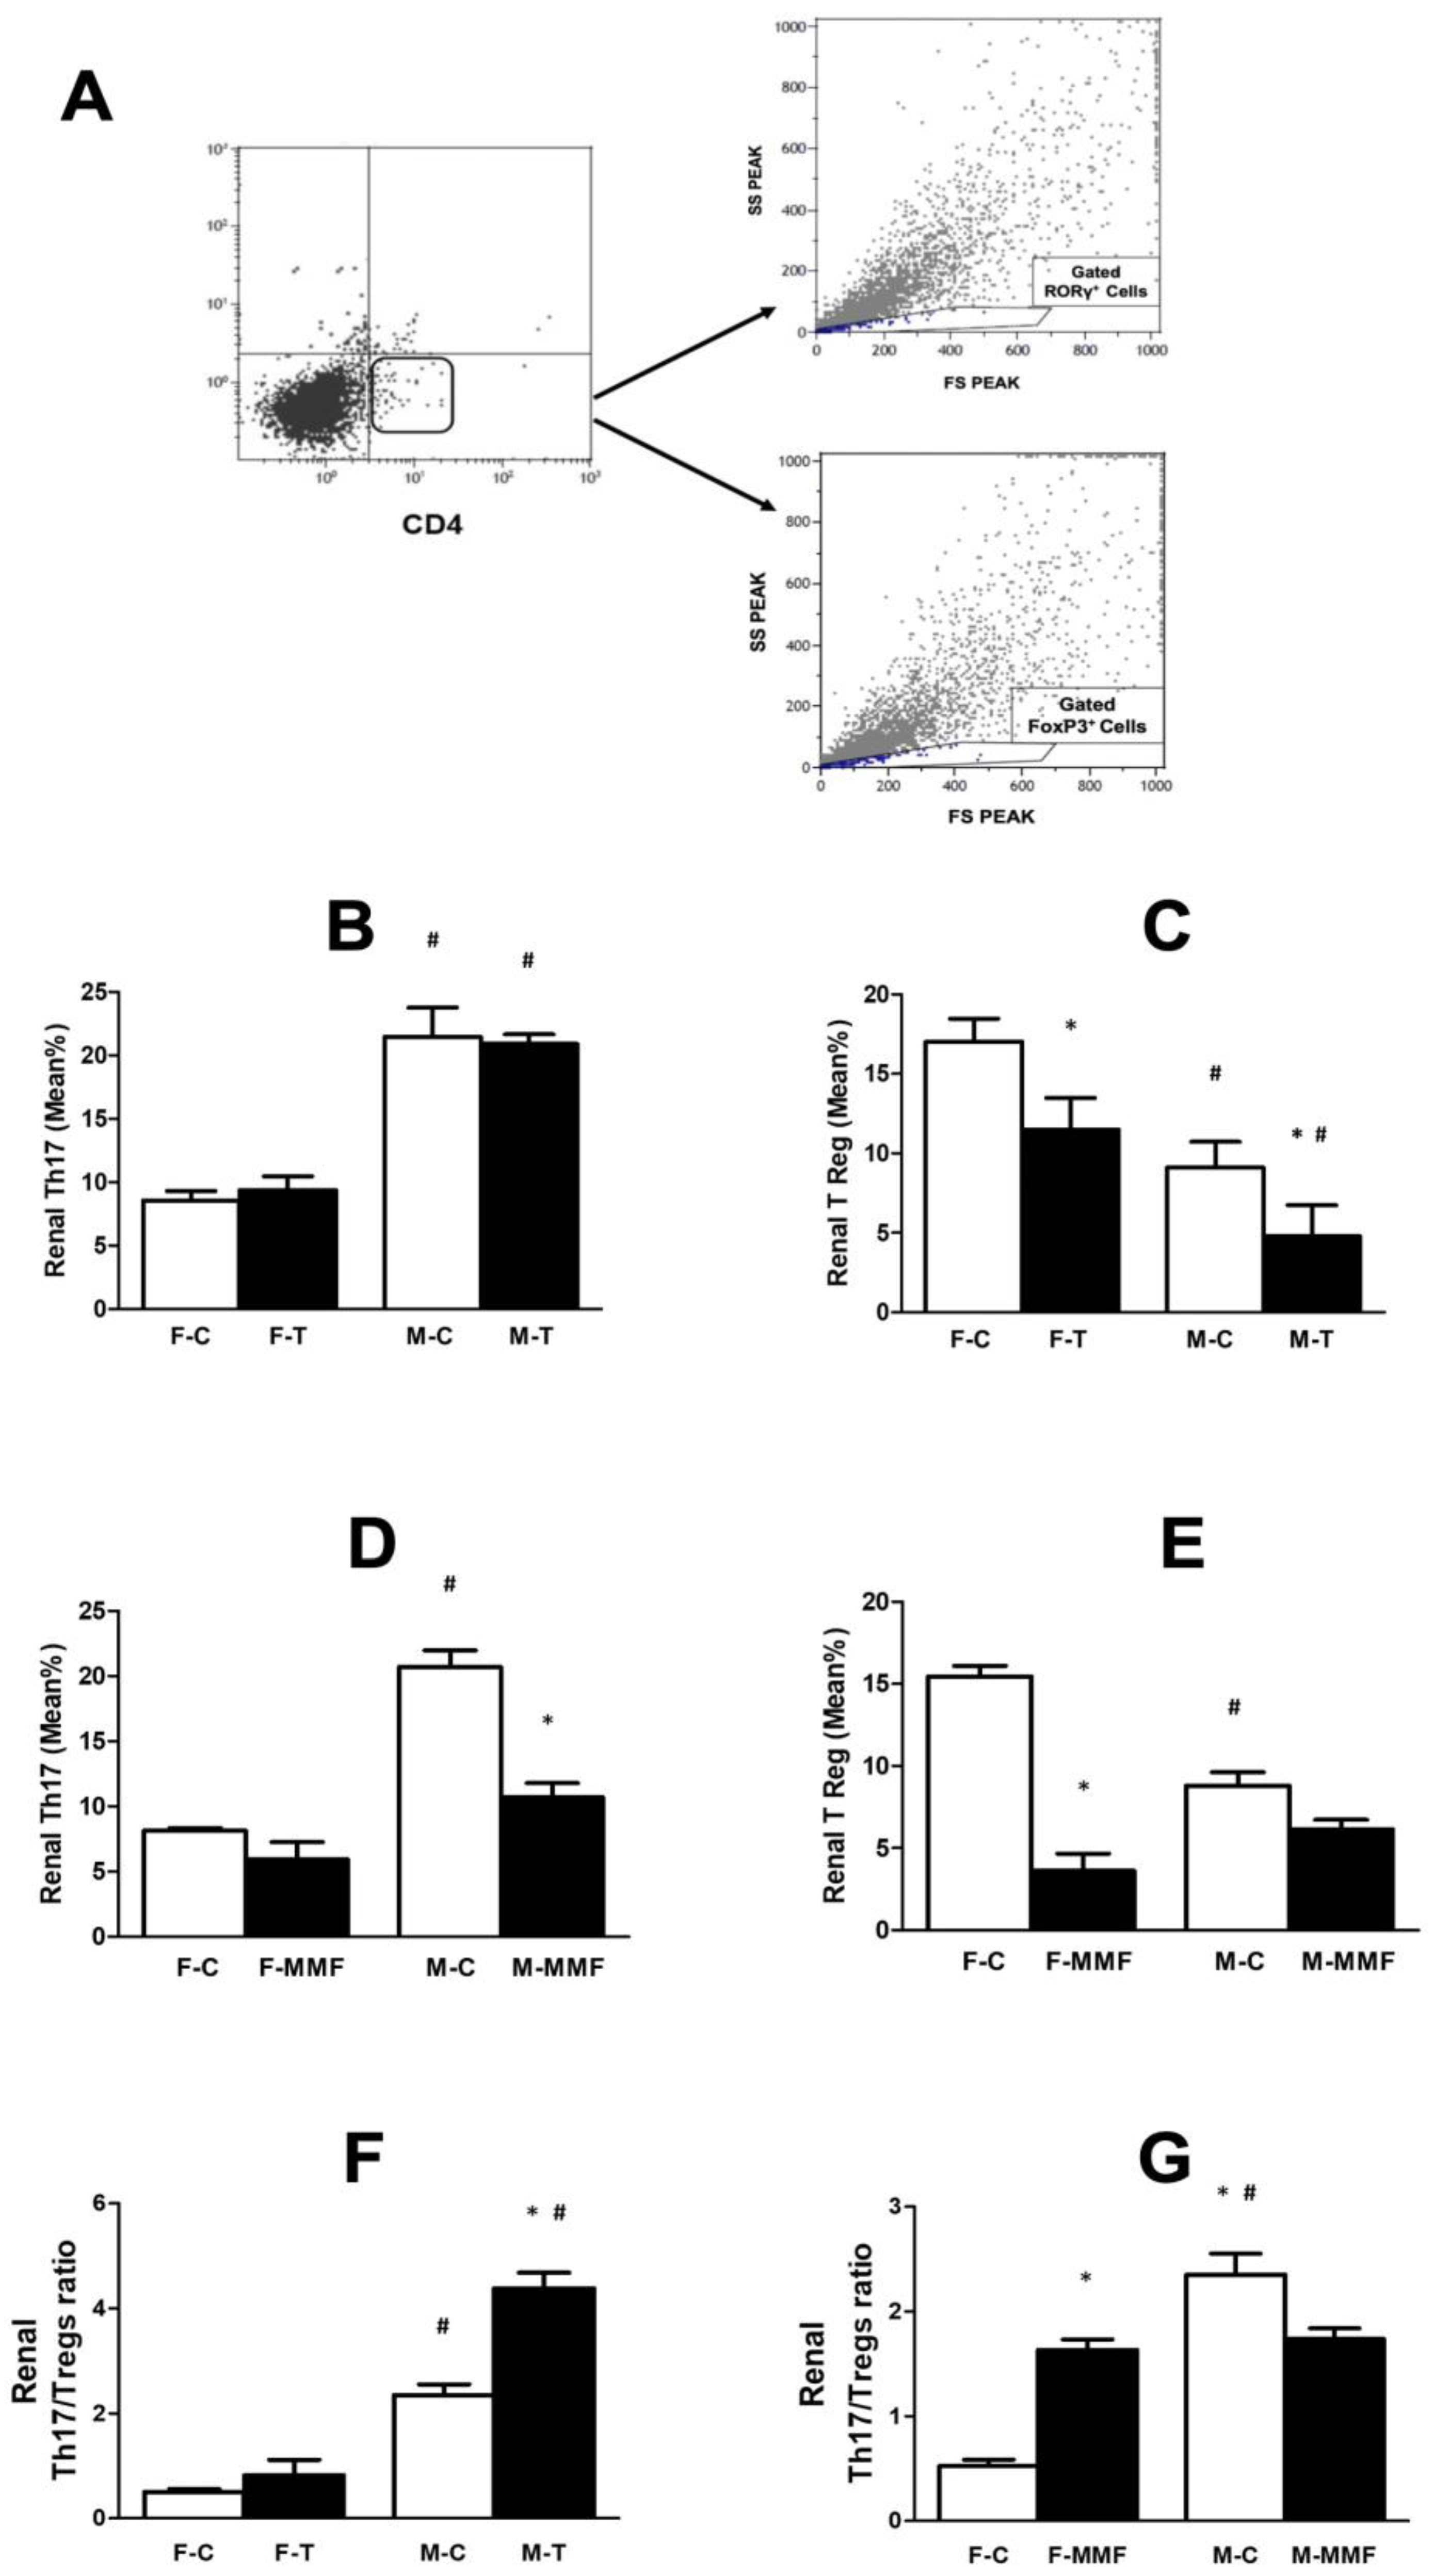
Pro-inflammatory Th17 cells were more abundant in male compared with female rats (p < 0.05), but tacrolimus treatment did not cause a significant change in their numbers in any groups [(M-C: 21.4 ± 2 vs. M-T: 20.9 ± 0.75% gated, p: NS) and (F-C: 8.6 ± 0.8 vs. F-T: 9.4 ± 1% gated, p: NS); Figure 6B]. In contrast, renal anti-inflammatory Treg cells were significantly more abundant in females than in their male counterparts (M-C: 9.1 ± 1.6 vs. F-C: 17 ± 1.45, p < 0.01). Tacrolimus treatment significantly decreased Treg cells infiltration in both male and female rats compared with control and a greater effect was observed in males [(M-C: 9.1 ± 1.6 vs. M-T: 4.8 ± 1.9% gated, p < 0.05) and (F-C: 17 ± 1.45 vs. F-T: 11.5 ± 2% gated, p < 0.05); Figure 6C]. MMF, in contrast to tacrolimus, significantly decreased both Th17 and Treg cells in male and female rats [Th17 (M-C: 20.7 ± 1.3 vs. M-MMF: 10.7 ± 1.1% gated, p < 0.05) (F-C: 8.1 ± 0.2 vs. F-MMF: 6 ± 1.4% gated, p < 0.05); Figure 6D] and [Treg (M-C: 8.8 ± 0.8 vs. M-MMF: 6.2 ± 0.6% gated, p < 0.05) (F-C: 15.46 ± 0.6 vs. F-MMF: 3.6 ± 1.1% gated, p < 0.05); Figure 6E]. Noteworthily, the immunosuppression effect of MMF on Th17 cells was more profound in males (p < 0.001) and its suppression effect on Treg cells was greater in females (p < 0.02). It was found that the Th17/Treg ratio was higher in males treated with tacrolimus compared with their controls (M-C) and compared with F-T and F-C groups (p < 0.05; Figure 6F). In MMF-treated animals, females had a higher Th17/Treg ratio than their controls; in males, MMF reduced the Th17/Treg ratio compared with the controls (p < 0.05; Figure 6G).
Since MMF affects the B cell populations, circulating and renal IgM+ B cells were examined after MMF treatment. It was found that the percentage of circulating B cells was similar in both male and female SHRs, and MMF significantly reduced these cells in both males and females [(M-C: 13.5 ± 0.3 vs. M-MMF: 5.6 ± 0.6) (F-C: 12.9 ± 0.9 vs. F-MMF: 5.14 ± 0.7, p < 0.05); Figure 7A] with a more profound effect in males (p < 0.001). Likewise, renal B cells infiltration was significantly decreased after MMF treatment in both males and females [(M-C: 11 ± 1 vs. M-MMF: 2.5 ± 0.8) (F-C: 6.9 ± 1 vs. F-MMF: 2.4 ± 0.9, p < 0.05); Figure 7B].

4. Discussion

Clinical and experimental data have shown that blood pressure is higher in males than in females during their fertile period [21,22,23]. Despite the increasing evidence on different mechanisms in blood pressure regulation between the sexes, the precise mechanism(s) remains controversial. One of the more exciting mechanisms discussed in the literature is the immune system’s contribution [3,4,5,6]. The earliest studies by Grollman showed that transferring lymphocytes from the infarct kidney of a hypertensive animal to a non-hypertensive animal can induce hypertension [24,25]. Similarly, Olsen determined that the transfer of splenocytes from a hypertensive to a normotensive animal increased blood pressure [26]. Additionally, it has been observed that the adoptive transfer of CD4+ or CD8+ T cells from a male donor increases blood pressure in male but not in female Rag-1−/− mice [27]. These and other studies support the role of the immune system in the pathogenesis of hypertension. Noteworthily, it is also suggested that for the development of hypertension the interaction between innate and adaptive immune responses is required. Innate immune cells recognize new antigens that are released during oxidative stress that lead to the activation of B and T cells [28], the cells that carry out adaptive immune responses. Innate immune cells also produce cytokines and reactive oxygen species (ROS), contributing to hypertension. However, the mechanism by which the immune system plays a role in this disease is not well-defined. Moreover, the identity of specific immune cells in hypertension requires more investigation [29].
Emerging evidence indicates that T cells play a crucial role in the pathogenesis of hypertension [3,7,8]. Different reports suggest that T cell subpopulations are increased in experimental models of hypertension and hypertensive humans [30,31], and that they could affect blood pressure differently in males and females [7,8,11,32,33,34,35,36]. Brinson et al. demonstrated that an increase in blood pressure in both male and female SHRs after nitric oxide synthase (NOS) inhibitor (L-NAME) administration is associated with an expansion of renal Th17 cells in male and a decrease of Treg cells in female SHRs [37]. Furthermore, the sex-specific effect of T cells can determine the magnitude of hypertension [6]. In our study, we found no difference in circulatory CD4+ T cells in male and female SHRs; however, CD8+ T cells were higher in male than in female SHRs. This finding is controversial because while some authors found higher CD8+ T cells in males than in females, others observed the opposite, with a significant proliferation in females [31]. On the contrary, some reported that CD4+ T cells and CD4+/CD8+ ratios were higher in females [32,33]. Moreover, different degrees of evidence support sex differences in the immune response depending on age. At young ages, the CD4+ T cells, CD8+ T cells, and CD4+/CD8+ ratios are equal in both sexes. Then, during post-puberty and old ages, CD4+ T cells, CD4+/CD8+ ratios, and T cell activation/proliferation are higher in females than males, but CD8+ T cells are higher in males [33]. Therefore, more investigation is necessary to elucidate the T cells’ activities and proliferation during the timeline period.
In the present study, we used two selective lymphocyte-suppressive agents to study the role of T cells in blood pressure. Tacrolimus reduced circulating CD4+ and CD8+ cells in both groups to the same extent; however, it induced a higher reduction in renal CD4+ and CD8+ T cell infiltration in males. It significantly reduced renal Treg cells in males (48%) and females (32%), with a more profound effect in males. This finding is consistent with previous studies that have demonstrated the reduction of Treg cells after tacrolimus administration in mice and patients [11,38]. The lower Treg cells imply a weaker inhibitory effects on Th17 cells. The extreme loss of Treg cells by tacrolimus resulting in an imbalance of the Treg/Th17 ratio appears to mediate inflammation and may contribute to blood pressure elevation in males.
The data indicate that MMF ameliorated hypertension in both male and female rats. The decreasing, induced effect of MMF has been reported previously in many different animal hypertensive models [3,8,12,14]; however, there is little evidence about the sex-specific effect of MMF in hypertensive animals [6]. The results from the present study show that MMF significantly decreased the circulatory CD4+ and CD8+ T cells in male and female rats, but the depletion of CD8+ T cells was higher in males than females. It is unclear why MMF affected CD8+ T cells differently in males, and this observation needs clarification. This could be explained by the findings of Sandberg and colleagues, who reported that CD4+ and CD8+ T cell populations are different in males and females, and the sex-dependent effects of these cells may affect hypertension [39]. Thus, there is a need to investigate whether CD8+ T cells play a more prominent role in males hypertension. Mainly, CD8+ T cells have been described to have a deleterious effect contributing to hypertension [14] and it has been shown that CD8+ T cells in knockout mice (CD8−/−) are protected against hypertension, but those mice lacking CD4+ T cells are not [40]. Another consideration is the deficient effect of MMF on CD8+ T cell infiltration in the kidneys in male SHRs. These results are opposite to previous observations by other researchers, who have reported that MMF reduces both CD4+ and CD8+ T cell populations in the kidneys of hypertensive animals [6,8,13]. The fact that MMF could not significantly modify CD8+ T cell infiltration in the kidney could also be explained by insufficient doses and/or treatment period of MMF to reduce renal CD8+ T cell infiltration in the current study. If this is the case, further studies are required with a higher dose and a more extended treatment period. However, the current result is consistent with the report that MMF induces a more significant effect on T cell subsets in females, implying that its effect is sex-specific [6]. The present result suggests that the reduction in blood pressure in males by MMF is mainly due to a decrease in the circulating T cells, whereas, in females, the effect is via circulating and renal T cells. Furthermore, it suggests that MMF-induced T cell reduction is sex-specific, but more investigations are required to understand the potential sex-specific suppressing mechanism of MMF.
Tacrolimus did not affect renal Th17 in any group, unlike MMF, which reduced Th17 infiltration in males and females. In the current study, female rats have greater renal anti-inflammatory Treg cells with lower pro-inflammatory Th17 than males. These observations are consistent with previous studies on SHRs [33,34]. Similarly, female Sprague-Dawley rats have significantly more renal Treg cells than their male counterparts [41]. While the tacrolimus-induced decline of renal Treg cells was more significant in male SHRs, MMF induced a greater decrease in renal Treg cells in females. These results suggest that the suppression effect of these agents on T cell subsets is sex-specific. Moreover, these findings emphasize the significance of Th17 and Treg cells balance in blood pressure control. This study demonstrates that hypertension in males and females is correlated with renal Th17 and Treg cells, and this result aligns with that of previous studies [27,34]. Consequently, the contribution of Th17, Treg, and Th17/Treg imbalance in the initiation and development of hypertension in males and females requires more attention, which may provide a new direction for the sex-specific treatment of hypertension.
In the current study, a significant depletion of the circulatory B cell population was observed by MMF in both males and females (58% and 60%), respectively. Comparatively, a significant reduction occurred in renal B cells in males (78%) and females (65%) with a more profound decrease in males. Our findings support the emerging studies that have demonstrated the significance of B cells in hypertension [42,43,44]. Kresovich et al. recently reported that higher circulating B cells are associated with hypertension incidence in women [44] and Dingwell et al. have demonstrated that B cell deficiency in mice results in decreased blood pressure [43]. Note that while the vital role of T cells in hypertension is widely investigated, the blood pressure role of B cells as a key player of the adaptive immune response remains obscure. B cells are multitasking by presenting processed antigens for T cell activation, producing pro- and anti-inflammatory cytokines and secreting antibodies. Remarkably, compelling evidence has been provided for the contribution of B cells in hypertension in recent years [42,43,44]. Therefore, the role of B cells, especially the anti-inflammatory regulatory B cell (Breg) subset in hypertension and their sex-specific response to immunosuppressants, remains to be explored.
Furthermore, a growing body of clinical studies suggests sex differences in absorption, distribution, metabolism, and excretion (ADME), and in the pharmacokinetics of immunosuppressive drugs. For instance, tacrolimus shows higher clearance in females [45] in contrast to MMF, with which males have higher clearance [46]. However, the mechanisms underlying the observed differences are controversial. Based on the available studies, sex differences in the pharmacokinetics of tacrolimus and MMF may be more significant from a clinical perspective, but the existing gap of knowledge in biomedical studies calls for more attention. Therefore, sex differences in the pharmacokinetics and ADME of tacrolimus and MMF require future studies using experimental models involving SHRs. Finally, it has been demonstrated that chronic administration of tacrolimus enhances vasoconstriction in males, which may lead to a higher blood pressure [47,48]. Therefore, vasoconstriction caused by tacrolimus has been suggested as a mechanism underlying hypertension. These findings provide a basis for further studies to investigate sex differences in vasoconstriction as one of the potential mechanisms of tacrolimus-induced hypertension in SHRs.

5. Conclusions

In conclusion, this study demonstrates sex-specific responses to immunosuppressive therapy and suggests that targeting T cells in hypertension by various immunosuppressants may have differential effects on men and women; so, the management of hypertension and post-transplant hypertension using these agents should be specified by gender.

Author Contributions

Conceptualization, M.M. and R.O.M.; methodology, M.M.; formal analysis, M.M. and R.O.M.; funding acquisition, M.M.; visualization, M.M. and R.O.M.; supervision, M.M.; resources, M.M.; project administration, M.M.; writing—original draft, review, and editing, M.M. and R.O.M. All authors have read and agreed to the published version of the manuscript.

Funding

This study was supported by the American Heart Association, Southeast Affiliate, Postdoctoral Fellowships # AHA 11POST7450006 (to M.M.).

Institutional Review Board Statement

All protocols were approved by the Animal Care and Use Committee of the University of Mississippi Medical Center (Approval Protocol: #297E).

Informed Consent Statement

Not applicable.

Data Availability Statement

Data will be provided upon reasonable request to the author.

Acknowledgments

The authors would like to thank Jane Reckelhoff for her scientific guidance, Kedra Wallace, the UMMC Cancer Institute Flow Cytometry Core Facility, Karen Hosick, and Huimin Zhang for the excellent technical support.

Conflicts of Interest

The authors declare no conflict of interest, financial or otherwise.

References

  1. World Health Organization. Hypertension Fact Sheet. September 2019. Available online: https://www.who.int/news-room/fact-sheets/detail/hypertension (accessed on 1 August 2023).
  2. Harrison, D.G. The immune system in hypertension. Trans. Am. Clin. Climatol. Assoc. 2014, 125, 130–138. [Google Scholar] [PubMed]
  3. Guzik, T.J.; Hoch, N.E.; Brown, K.A.; McCann, L.A.; Rahman, A.; Dikalov, S.; Goronzy, J.; Weyand, C.; Harrison, D.G. Role of the T cell in the genesis of angiotensin II-induced hypertension and vascular dysfunction. J. Exp. Med. 2007, 204, 2449–2460. [Google Scholar] [CrossRef] [PubMed]
  4. Paton, J.F.; Waki, H. Is neurogenic hypertension related to vascular inflammation of the brainstem? Neurosci. Biobehav. Rev. 2009, 33, 89–94. [Google Scholar] [CrossRef] [PubMed]
  5. Zubcevic, J.; Waki, H.; Raizada, M.K.; Paton, J.F. Autonomic-immune-vascular interaction: An emerging concept for neurogenic hypertension. Hypertension 2011, 57, 1026–1033. [Google Scholar] [CrossRef]
  6. Tipton, A.J.; Sullivan, J.C. Sex Differences in T Cells in Hypertension. Am. J. Phys. Regul. Integr. Comp. Phys. 2012, 303, R359–R367. [Google Scholar] [CrossRef]
  7. Drummond, G.R.; Vinh, A.; Guzik, T.J.; Sobey, C.G. Immune mechanisms of hypertension. Nat. Rev. Immunol. 2019, 19, 517–532. [Google Scholar] [CrossRef]
  8. Rodríguez-Iturbe, B.; Quiroz, Y.; Nava, M.; Bonet, L.; Chávez, M.; Herrera-Acosta, J.; Johnson, R.J.; Pons, H.A. Reduction of renal immune cell infiltration results in blood pressure control in genetically hypertensive rats. Am. J. Physiol.-Renal Physiol. 2002, 282, F191–F201. [Google Scholar] [CrossRef]
  9. Morales, J.M.; Domínguez-Gil, B. Impact of tacrolimus and mycophenolate mofetil combination on cardiovascular risk profile after kidney transplantation. J. Am. Soc. Nephrol. 2006, 17, S296–S303. [Google Scholar] [CrossRef]
  10. Hoorn, E.J.; Walsh, S.B.; McCormick, J.A.; Fürstenberg, A.; Yang, C.L.; Roeschel, T.; Paliege, A.; Howie, A.J.; Conley, J.; Bachmann, S.; et al. The calcineurin inhibitor tacrolimus activates the renal sodium chloride cotransporter to cause hypertension. Nat. Med. 2011, 17, 1304–1309. [Google Scholar] [CrossRef]
  11. Chiasson, V.L.; Talreja, D.; Young, K.J.; Chatterjee, P.; Banes-Berceli, A.K.; Mitchell, B.M. FK506 binding protein 12 deficiency in endothelial and hematopoietic cells decreases regulatory T cells and causes hypertension. Hypertension 2011, 57, 1167–1175. [Google Scholar] [CrossRef]
  12. De Miguel, C.; Guo, C.; Lund, H.; Feng, D.; Mattson, D.L. Infiltrating T lymphocytes in the kidney increase oxidative stress and participate in the development of hypertension and renal disease. Am. J. Physiol.-Renal Physiol. 2011, 300, F734–F742. [Google Scholar] [CrossRef] [PubMed]
  13. Boesen, E.I.; Williams, D.L.; Pollock, J.S.; Pollock, D.M. Immunosuppression with mycophenolate mofetil attenuates the development of hypertension and albuminuria in deoxycorticosterone acetate-salt hypertensive rats. Clin. Exp. Pharmacol. Physiol. 2010, 37, 1016–1022. [Google Scholar] [CrossRef] [PubMed]
  14. Mattson, D.L.; James, L.; Berdan, E.A.; Meister, C.J. Immune suppression attenuates hypertension and renal disease in the Dahl salt-sensitive rat. Hypertension 2006, 48, 149–156. [Google Scholar] [CrossRef] [PubMed]
  15. Hošková, L.; Málek, I.; Kautzner, J.; Honsová, E.; van Dokkum, R.P.; Husková, Z.; Vojtíšková, A.; Varcabová, Š.; Červenka, L.; Kopkan, L. Tacrolimus-induced hypertension and nephrotoxicity in Fawn-Hooded rats are attenuated by dual inhibition of renin-angiotensin system. Hypertens. Res. 2014, 37, 724–732. [Google Scholar] [CrossRef] [PubMed]
  16. Moulana, M.; Maranon, R.O. Regulation of blood pressure is influenced by gender: A study in obese Zucker rats. Life Sci. 2018, 209, 236–241. [Google Scholar] [CrossRef] [PubMed]
  17. Bradford, M.M. A rapid and sensitive method for the quantitation of microgram quantities of protein utilizing the principle of protein-dye binding. Anal. Biochem. 1976, 72, 248–254. [Google Scholar] [CrossRef] [PubMed]
  18. Reckelhoff, J.F.; Zhang, H.; Granger, J.P. Testosterone exacerbates hypertension and reduces pressure-natriuresis in male spontaneously hypertensive rats. Hypertension 1998, 31, 435–439. [Google Scholar] [CrossRef] [PubMed]
  19. Lopez-Ruiz, A.F.; Iliescu, R.; Reckelhoff, J.F. Refractory blood pressure in female SHR to increased oxidative stress is not mediated by NO or by upregulation of renal antioxidant enzymes. Am. J. Physiol. Regul. Integr. Comp. Physiol. 2010, 298, R266–R271. [Google Scholar] [CrossRef]
  20. Moulana, M. Immunophenotypic profile of leukocytes in hyperandrogenemic female rat an animal model of polycystic ovary syndrome. Life Sci. 2019, 220, 44–49. [Google Scholar] [CrossRef]
  21. Maranon, R.; Reckelhoff, J.F. Sex and Gender Differences in Control of Blood Pressure. Clin. Sci. 2013, 125, 311–318. [Google Scholar] [CrossRef]
  22. Cutler, J.A.; Sorlie, P.D.; Wolz, M.; Thom, T.; Fields, L.E.; Roccella, E.J. Trends in hypertension prevalence, awareness, treatment, and control rates in United States adults between 1988–1994 and 1999–2004. Hypertension 2008, 52, 818–827. [Google Scholar] [CrossRef] [PubMed]
  23. Sandberg, K.; Ji, H. Sex differences in primary hypertension. Biol. Sex. Differ. 2012, 3, 7. [Google Scholar] [CrossRef] [PubMed]
  24. Okuda, T.; Grollman, A. Passive transfer of autoimmune induced hypertension in the rat by lymph node cells. Tex. Rep. Biol. Med. 1967, 25, 257–264. [Google Scholar] [PubMed]
  25. White, F.N.; Grollman, A. Autoimmune Factors Associated with Infarction of the Kidney. Nephron 1964, 1, 93–102. [Google Scholar] [CrossRef] [PubMed]
  26. Olsen, F. Transfer of arterial hypertension by splenic cells from DOCA-salt hypertensive and renal hypertensive rats to normotensive recipients. Acta Pathol. Microbiol. Scand. Sect. C Immunol. 1980, 88C, 1–6. [Google Scholar] [CrossRef] [PubMed]
  27. Pollow, D.P.; Uhrlaub, J.; Romero-Aleshire, M.J.; Sandberg, K.; Nikolich-Zugich, J.; Brooks, H.L.; Hay, M. Sex differences in T-lymphocyte tissue infiltration and development of angiotensin II hypertension. Hypertension 2014, 64, 384–390. [Google Scholar] [CrossRef] [PubMed]
  28. Kirabo, A.; Fontana, V.; De Faria, A.P.; Loperena, R.; Galindo, C.L.; Wu, J.; Bikineyeva, A.T.; Dikalov, S.; Xiao, L.; Chen, W.; et al. DC isoketal-modified proteins activate T cells and promote hypertension. J. Clin. Investig. 2014, 124, 4642–4656. [Google Scholar] [CrossRef]
  29. Kvakan, H.; Luft, F.C.; Muller, D.N. Role of the immune system in hypertensive target organ damage. Trends Cardiovasc. Med. 2009, 19, 242–246. [Google Scholar] [CrossRef]
  30. Trott, D.W.; Thabet, S.R.; Kirabo, A.; Saleh, M.A.; Itani, H.; Norlander, A.E.; Wu, J.; Goldstein, A.; Arendshorst, W.J.; Madhur, M.S.; et al. Oligoclonal CD8+ T cells play a critical role in the development of hypertension. Hypertension 2014, 64, 1108–1115. [Google Scholar] [CrossRef]
  31. Lee, B.-W.; Yap, H.-K.; Chew, F.-T.; Quah, T.-C.; Prabhakaran, K.; Chan, G.S.H.; Wong, S.-C.; Seah, C.-C. Age- and sex-related changes in lymphocyte subpopulations of healthy Asian subjects: From birth to adulthood. Cytometry 1996, 26, 8–15. [Google Scholar] [CrossRef]
  32. Uppal, S.S.; Verma, S.; Dhot, P.S. Normal values of CD4 and CD8 lymphocyte subsets in healthy indian adults and the effects of sex, age, ethnicity, and smoking. Cytom. B Clin. Cytom. 2003, 52, 32–36. [Google Scholar] [CrossRef] [PubMed]
  33. Tipton, A.J.; Baban, B.; Sullivan, J.C. Female spontaneously hypertensive rats have greater renal anti-inflammatory T lymphocyte infiltration than males. Am. J. Physiol. Regul. Integr. Comp. Physiol. 2012, 303, R359–R367. [Google Scholar] [CrossRef] [PubMed]
  34. Tipton, A.J.; Baban, B.; Sullivan, J.C. Female spontaneously hypertensive rats have a compensatory increase in renal regulatory T cells in response to elevations in blood pressure. Hypertension 2014, 64, 557–564. [Google Scholar] [CrossRef] [PubMed]
  35. Chiasson, V.L.; Pakanati, A.R.; Hernandez, M.; Young, K.J.; Bounds, K.R.; Mitchell, B.M. Regulatory T-Cell Augmentation or Interleukin-17 Inhibition Prevents Calcineurin Inhibitor–Induced Hypertension in Mice. Hypertension 2017, 70, 83–191. [Google Scholar] [CrossRef] [PubMed]
  36. Pollow, D.P.; Uhlorn, J.A.; Sylvester, M.A.; Romero-Aleshire, M.J.; Uhrlaub, J.L.; Lindsey, M.L.; Nikolich-Zugich, J.; Brooks, H.L. Menopause and FOXP3+ Treg cell depletion eliminate female protection against T cell-mediated angiotensin II hypertension. Am. J. Physiol. Heart Circ. Physiol. 2019, 317, 415–423. [Google Scholar] [CrossRef] [PubMed]
  37. Brinson, K.N.; Elmarakby, A.A.; Tipton, A.J.; Crislip, G.R.; Yamamoto, T.; Baban, B.; Sullivan, J.C. Female SHR have greater blood pressure sensitivity and renal T cell infiltration following chronic NOS inhibition than males. Am. J. Phys. Regul. Integr. Comp. Phys. 2013, 305, R701–R710. [Google Scholar] [CrossRef] [PubMed]
  38. Fourtounas, C.; Dousdampanis, P.; Sakellaraki, P.; Rodi, M.; Georgakopoulos, T.; Vlachojannis, J.G.; Mouzaki, A. Different immunosuppressive combinations on T-cell regulation in renal transplant recipients. Am. J. Nephrol. 2010, 32, 1–9. [Google Scholar] [CrossRef]
  39. Sandberg, K.; Ji, H.; Hay, M. Sex-specific immune modulation of primary hypertension. Cell Immunol. 2015, 294, 95–101. [Google Scholar] [CrossRef]
  40. Manzi, S.; Meilahn, E.N.; Rairie, J.E.; Conte, C.G.; Medsger, T.A., Jr.; Jansen-McWilliams, L.; D’Agostino, R.B.; Kuller, L.H. Age-specific incidence rates of myocardial infarction and angina in women with systemic lupus erythematosus: Comparison with the Framingham Study. Am. J. Epidemiol. 1997, 145, 408–415. [Google Scholar] [CrossRef]
  41. Zimmerman, M.A.; Baban, B.; Tipton, A.J.; O’Connor, P.M.; Sullivan, J.C. Chronic ANG II infusion induces sex-specific increases in renal T cells in Sprague-Dawley rats. Am. J. Physiol. Renal Physiol. 2015, 308, F706–F712. [Google Scholar] [CrossRef]
  42. Chan, C.T.; Sobey, C.G.; Lieu, M.; Ferens, D.; Kett, M.M.; Diep, H.; Kim, H.A.; Krishnan, S.M.; Lewis, C.V.; Salimova, E.; et al. Obligatory Role for B Cells in the Development of Angiotensin II-Dependent Hypertension. Hypertension 2015, 66, 1023–1033. [Google Scholar] [CrossRef] [PubMed]
  43. Dingwell, L.S.; Shikatani, E.A.; Besla, R.; Levy, A.S.; Dinh, D.D.; Momen, A.; Zhang, H.; Afroze, T.; Chen, M.B.; Chiu, F.; et al. B-cell deficiency lowers blood pressure in mice. Hypertension 2019, 73, 561–570. [Google Scholar] [CrossRef] [PubMed]
  44. Kresovich, J.K.; Xu, Z.; O’brien, K.M.; Parks, C.G.; Weinberg, C.R.; Sandler, D.P.; Taylor, J.A. Peripheral Immune Cell Composition is Altered in Women Before and After a Hypertension Diagnosis. Hypertension 2023, 80, 43–53. [Google Scholar] [CrossRef] [PubMed]
  45. Velicković-Radovanović, R.; Mikov, M.; Paunović, G.; Djordjević, V.; Stojanović, M.; Cvetković, T.; Djordjević, A.C. Gender differences in pharmacokinetics of tacrolimus and their clinical significance in kidney transplant recipients. Gend. Med. 2011, 8, 23–31. [Google Scholar] [CrossRef] [PubMed]
  46. van Hest, R.M.; van Gelder, T.; Vulto, A.G.; Mathot, R.A. Population pharmacokinetics of mycophenolic acid in renal transplant recipients. Clin. Pharmacokinet. 2005, 44, 1083–1096. [Google Scholar] [CrossRef] [PubMed]
  47. Tang, Q.; Zheng, Y.-M.; Song, T.; Reyes-García, J.; Wang, C.; Wang, Y.-X. Inhibition of big-conductance Ca2+-activated K+ channels in cerebral artery (vascular) smooth muscle cells is a major novel mechanism for tacrolimus-induced hypertension. Pflügers Arch.-Eur. J. Physiol. 2021, 473, 53–66. [Google Scholar] [CrossRef]
  48. Wang, X.; Jiang, S.; Fei, L.; Dong, F.; Xie, L.; Qiu, X.; Lei, Y.; Guo, J.; Zhong, M.; Ren, X.; et al. Tacrolimus Causes Hypertension by Increasing Vascular Contractility via RhoA (Ras Homolog Family Member A)/ROCK (Rho-Associated Protein Kinase) Pathway in Mice. Hypertension 2022, 79, 2228–2238. [Google Scholar] [CrossRef]
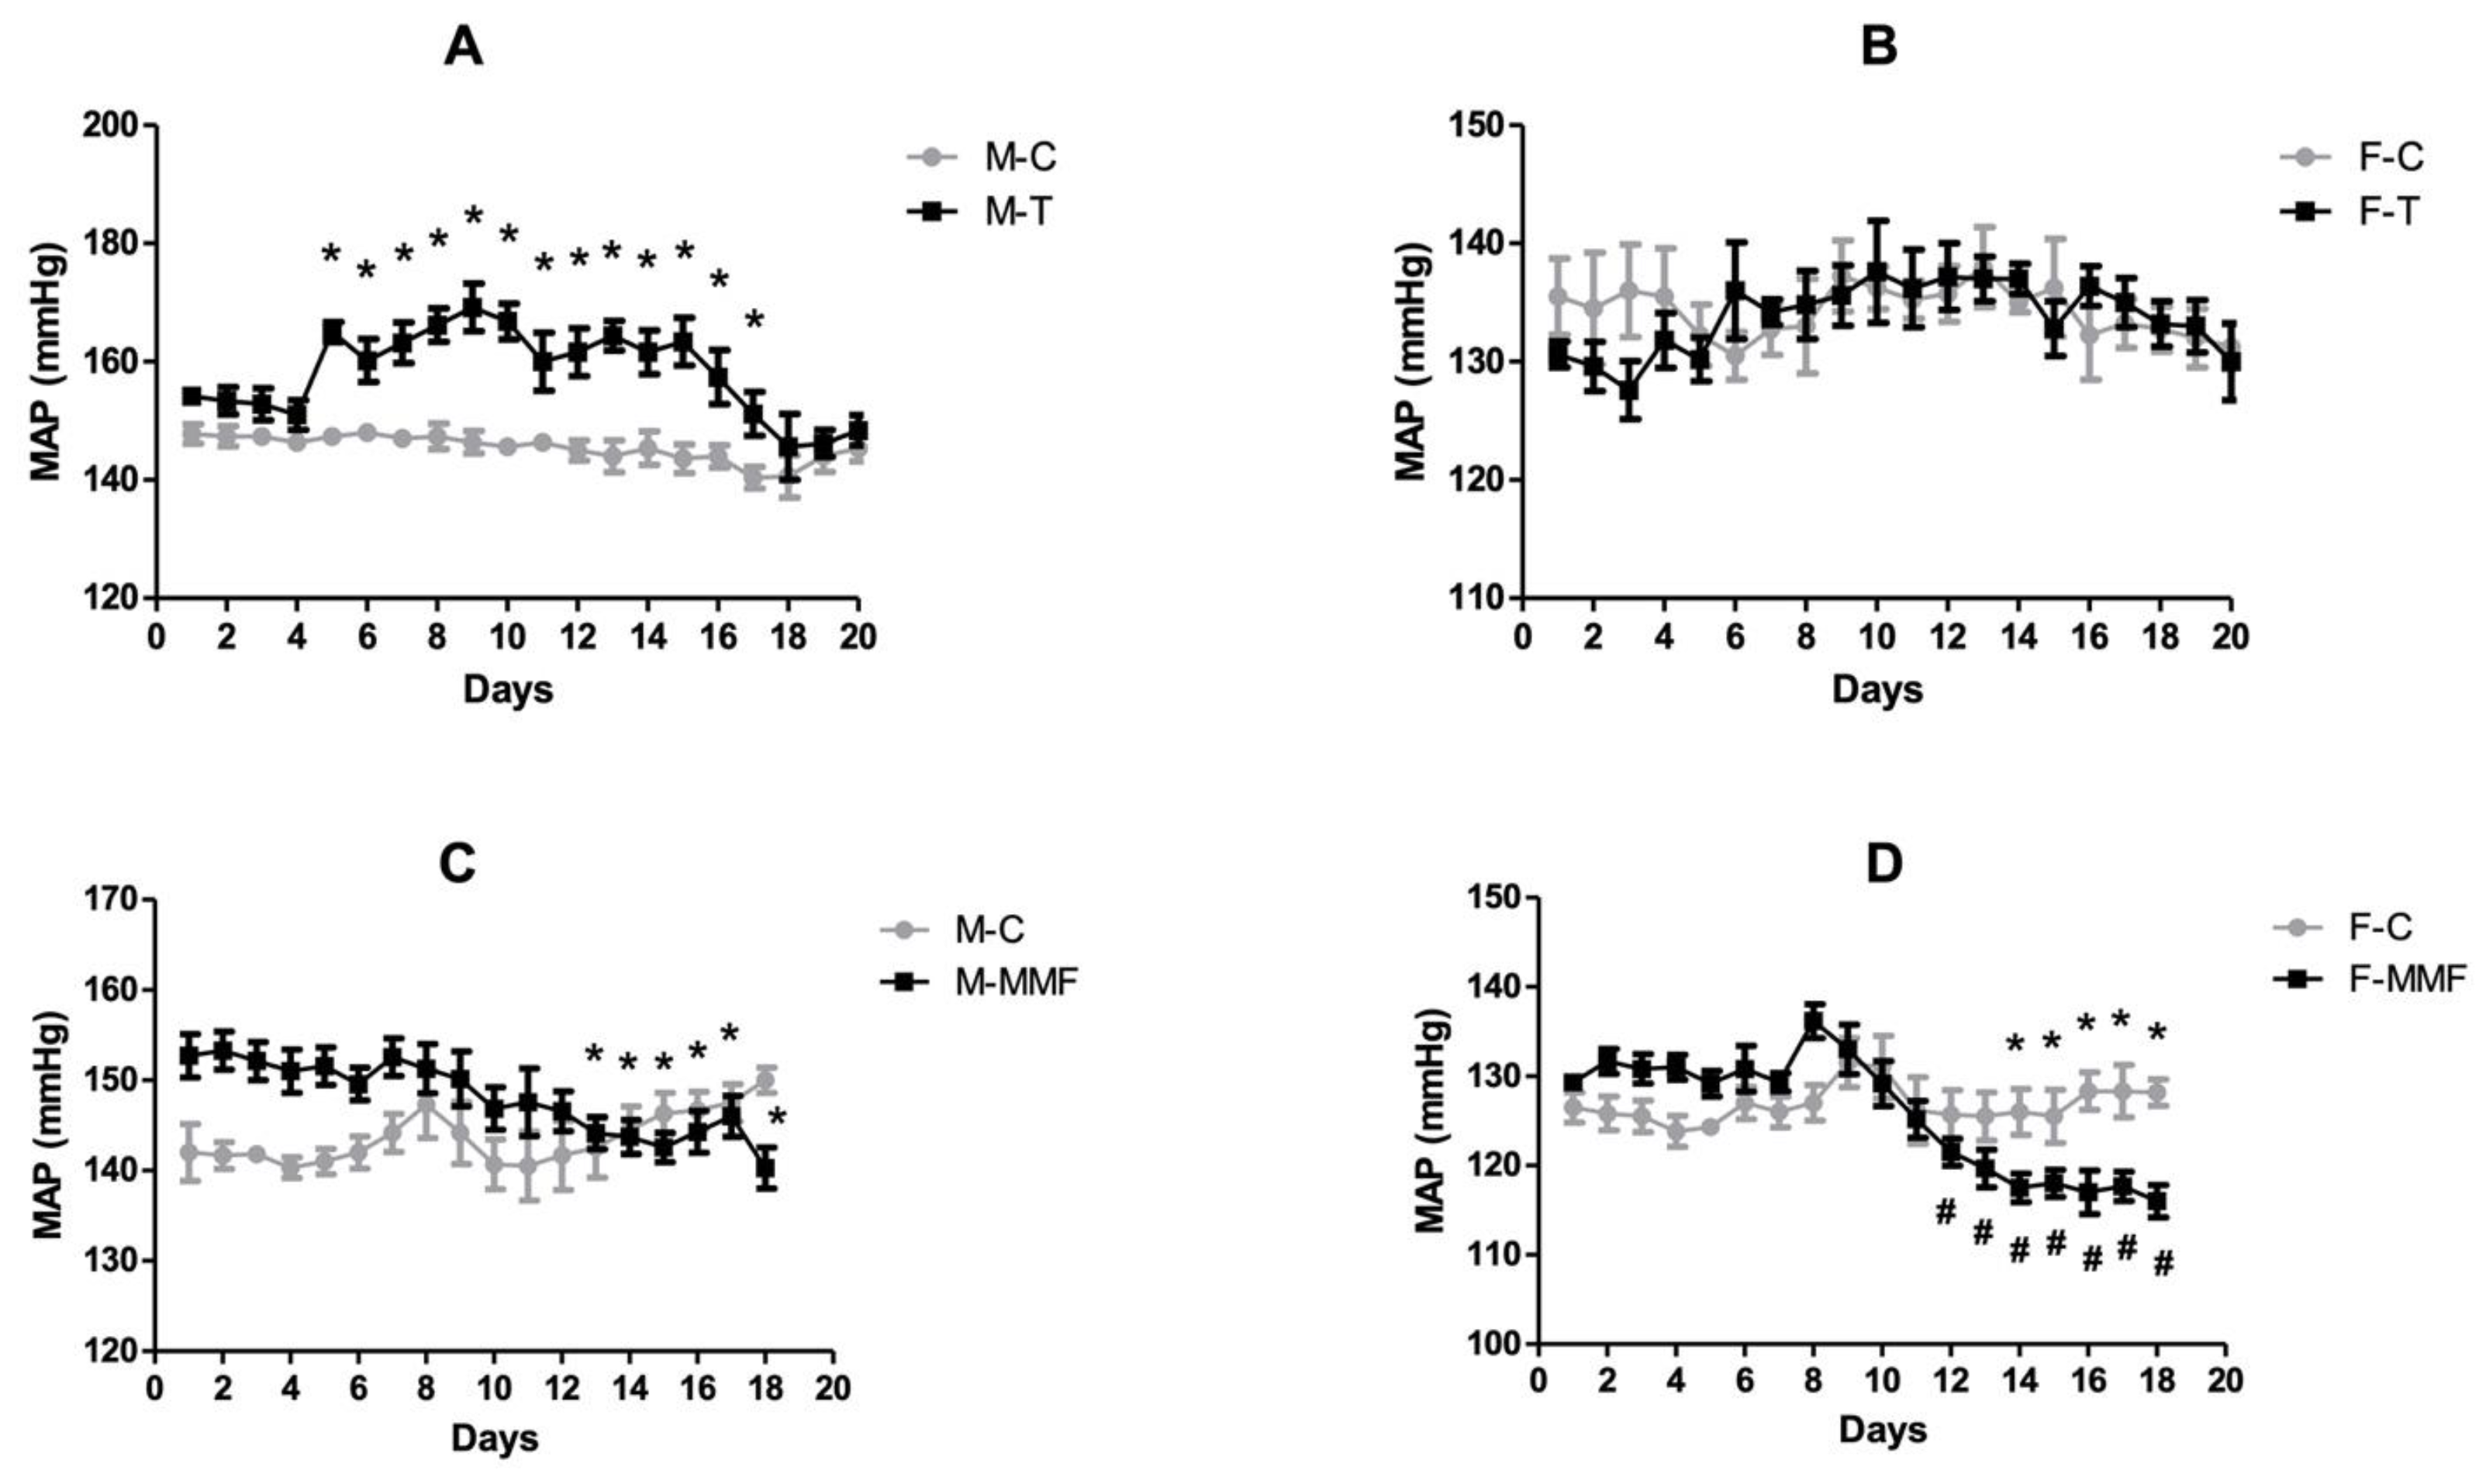
Figure 1. Mean arterial pressure (MAP) in male and female SHRs (n = 7/group). Tacrolimus (T) increases MAP in male (A) but does not affect female (B) SHRs. Mycophenolate mofetil (MMF) reduces MAP in both male (C) and female (D) SHRs. Data are presented as mean ± SEM. * p < 0.05 vs. control (C); # p < 0.05 vs. baseline of the same group. Data were analyzed by Student’s t-test (for two groups) or one-way Analysis of Variance (ANOVA) with multiple repeat measures. Differences were considered statistically significant at p < 0.05.
Futurepharmacol 03 00052 g001
Figure 2. Effect of tacrolimus and MMF treatment on albuminuria and proteinuria in male and female SHRs (n = 7/group). The albuminuria was higher in the male control than in the female control groups. Tacrolimus (T) increased albuminuria (A) and proteinuria (B) in male SHRs without significant changes in female SHRs. MMF reduced albuminuria and proteinuria in both male and female SHRs ((C,D), respectively, p < 0.05). Data are presented as mean ± SEM. * p < 0.05 vs. control (C); # p < 0.05 vs female groups. Data were analyzed by Student’s t-test (for two groups) or one-way Analysis of Variance (ANOVA) with multiple repeat measures. Differences were considered statistically significant at p < 0.05.
Futurepharmacol 03 00052 g002
Figure 3. Effect of tacrolimus and MMF treatments on urinary Na+ excretion and nitrate/nitrite excretion in male and female SHRs (n = 7/group). Tacrolimus (T) decreased the urinary Na+ excretion in treated males versus controls (A) but did not affect the female SHRs. In contrast, MMF treatment increased sodium excretion in both male and female SHRs; however, the excretion was only significant in males (B). Also, Tacrolimus (T) and MMF increased nitrate/nitrite excretion in male SHRs ((C,D), p < 0.05). The male SHRs excreted higher baseline NOx compared with females. Data are presented as mean ± SEM. * p < 0.05 vs. control (C); # p < 0.05 vs. female groups. Data were analyzed by Student’s t-test (for two groups) or one-way Analysis of Variance (ANOVA) with multiple repeat measures. Differences were considered statistically significant at p < 0.05.
Futurepharmacol 03 00052 g003
Figure 4. Effect of tacrolimus and MMF on circulating CD4+ and CD8+ T cells in male and female SHRs (n = 7/group). Representative gating strategy for identification of CD4+ and CD8+ T cell populations in peripheral blood leucocytes. Cells were stained for CD4 and CD8; then, lymphocytes were gated from total leukocyte populations using SSC and FS parameters and representative histograms show SHR cell counts (A). The subsequent phenotypic analysis identified CD4+ and CD8+ T cell subsets based on CD4 and CD8a expression, respectively. Tacrolimus (T) treatment decreased the percentage of the circulating CD4+ T cells by a similar extent in males and females; p < 0.05 (B). It also reduced the circulatory CD8+ in male and female SHRs, but the reduction was more profound in females (C). MMF decreased circulating CD4+ and CD8+ T cells in both male and female SHRs, despite a higher percentage of CD4+ T cells in male compared with female rats (D,E). Data are presented as mean ± SEM. * p < 0.05 vs. control (C). Data were analyzed by Student’s t-test (for two groups) or one-way Analysis of Variance (ANOVA) with multiple repeat measures. Differences were considered statistically significant at p < 0.05.
Futurepharmacol 03 00052 g004
Figure 5. Effect of tacrolimus and MMF on renal CD4+ and CD8+ T cell infiltration in male and female SHRs (n = 7/group). Renal leukocytes were stained for CD4 and CD8; then, lymphocytes were gated from total leukocyte populations using SSC and FS parameters. (A) Tacrolimus (T) treatment significantly reduced renal CD4+ T cell infiltration in both males and females compared with controls (B). However, tacrolimus did not modify renal CD8+ T cell infiltration in all groups (C). MMF reduced the CD4+ T cells in the renal tissue of male (57%) and female (42%) rats; although, CD4+ T cells were higher in males compared with female rats (p < 0.05; (D)). While the percentage of CD8+ T cells was significantly decreased in females by MMF treatment, no significant change was observed in males (p: NS; (E)). Data are presented as mean ± SEM. * p < 0.05 vs. control (C); # p < 0.05 vs female groups. Data were analyzed by Student’s t-test (for two groups) or one-way Analysis of Variance (ANOVA) with multiple repeat measures. Differences were considered statistically significant at p < 0.05.
Futurepharmacol 03 00052 g005
Figure 6. Effect of tacrolimus and MMF treatment on renal Th17 and Treg infiltration in male and female SHRs (n = 7/group). Renal leukocytes were stained for CD4, CD25, ROR-γ, or FoxP3 expression. Cells were permeabilized and fixed before staining for intracellular transcription factor ROR-γ or FoxP3. After intracellular staining, CD4+ T cells were selected in order to segregate Th17 from Treg subsets. The percentages of ROR-γ+ and FoxP3+ cells were measured within the gate (selected population (A). Tacrolimus (T) did not affect Th17 cells infiltration in any groups (B). However, it significantly reduced Treg cells in both male and female rats compared with the control; moreover, a greater effect was observed in the male rats (p < 0.01; (C)). MMF, in contrast to tacrolimus, significantly decreased both Th17 and Treg cells in male and female rats (D,E). The immunosuppression effect of MMF on Th17 cells was more profound in males (p < 0.001) and its suppression effect on Treg cells was greater in females (p < 0.02). Th17/Treg ratio was higher in males treated with tacrolimus compared with their controls and compared with female groups (p < 0.05; (F)). In MMF-treated animals, females have a higher Th17/Treg ratio than their controls (G). In males, MMF reduced the Th17/Treg ratio compared with the controls (p < 0.05; (G)). Data are presented as mean ± SEM. * p < 0.05 vs. control (C); # p < 0.05 vs. female groups. Data were analyzed by Student’s t-test (for two groups) or one-way Analysis of Variance (ANOVA) with multiple repeat measures. Differences were considered statistically significant at p < 0.05.
Futurepharmacol 03 00052 g006
Figure 7. Effect of MMF treatment on circulatory and renal B cell populations in male and female SHRs (n = 7/group). MMF significantly reduced circulatory B cells in male and female SHRs with a more profound effect in males (p < 0.001; (A)). Likewise, renal B cell infiltration was decreased after MMF treatment in both male and female rats (p < 0.05; (B)). Data are presented as mean ± SEM. * p < 0.05 vs. control (C); # p < 0.05 vs female groups. Data were analyzed by Student’s t-test (for two groups) or one-way Analysis of Variance (ANOVA) with multiple repeat measures. Differences were considered statistically significant at p < 0.05.
Futurepharmacol 03 00052 g007
Disclaimer/Publisher’s Note: The statements, opinions and data contained in all publications are solely those of the individual author(s) and contributor(s) and not of MDPI and/or the editor(s). MDPI and/or the editor(s) disclaim responsibility for any injury to people or property resulting from any ideas, methods, instructions or products referred to in the content.