Abstract
The isoquinoline alkaloids (IAs) represent a large and diverse subfamily of phytochemicals in terms of structures and pharmacological activities, including ion channel inhibition. Several IAs, such as liriodenine (an oxoaporphine) and curine (a bisbenzylisoquinoline (BBIQ), inhibit the L-type voltage-gated Ca2+ channels (LTCC). In this study, we aimed to search for new blockers of LTCC, which are therapeutic targets in neurological and cardiovascular diseases. We set up a screening assay using the rat pituitary GH3b6 cell line, which expresses two LTCC isoforms, CaV1.2 and CaV1.3. Both LTCC subtypes can be indirectly activated by KCl concentration elevation or directly by the dihydropyridine (DHP), BAY K8644, leading to an increase in the intracellular Ca2+ concentration ([Ca2+]i). These Ca2+ responses were completely blocked by the selective LTCC DHP inhibitor, nifedipine. Thereby, 16 selected IAs were tested for their ability to inhibit KCl and BAY K8644-induced Ca2+ responses. We then identified three new potent LTCC blockers, namely, oxostephanine, thaliphyline, and thalmiculine. They inhibited LTCC with IC50 values in the micromolar range through interaction to a binding site different to that of dihydropyridines. The two subfamilies of IAs, oxoaporphine with oxostephanine, and BBIQs with both thalyphilline and thalmiculine, constitute interesting pharmacophores for the development of future therapeutic leads for neurological and cardiovascular diseases.
1. Introduction
Voltage-gated Ca2+ channels (CaV channels) control Ca2+ influx through the plasma membrane in response to depolarization and thereby contribute to the regulation of the intracellular Ca2+ concentration ([Ca2+]i) in excitable cells [1,2]. CaV channels are key players in Ca2+ signaling and allow physiological couplings, such as excitation secretion and neurotransmitter release, contraction, and transcription in endocrine cells, neurons, and myocytes. CaV channels are heteromultimeric membrane proteins, consisting of a large principal α1 subunit, which contains the pore-forming domain, the voltage sensor, and gating apparatus, associated with the auxiliary subunits: α2δ, β, and γ [1,3]. The α1 subunit is encoded by 10 genes, namely, cacna1s (CaV1.1), cacna1c (CaV1.2), cacna1d (CaV1.3), cacna1f (CaV1.4), cacna1a (CaV2.1), cacna1b (CaV2.2), cacna1e (CaV2.3), cacna1g (CaV3.1), cacna1h (CaV3.2), and cacna1i (CaV3.3) [1,3].
Because of their involvement in various physiological and pathophysiological processes, the pharmacology of the CaV1 channel family, also called high-voltage and long-lasting or L-type CaV channels (LTCC), including CaV1.1-4, has attracted attention for decades [1,3]. These four LTCC isoforms exhibit a tissue-specific expression. The CaV1.1 channel subtype is specifically expressed in skeletal myocytes and then involved in muscle contraction. The CaV1.2 and CaV1.3 channel subtypes exhibit a broader expression pattern; they are expressed in cardiomyocytes, smooth muscle cells (SMCs), neurons, and endocrine cells. These two LTCC isoforms contribute to various functions, such as memory, neurotransmitters release, myogenic tone, pace-making activity, and hormone secretion. The last LTCC isoform, CaV1.4, is specifically expressed in the retina and involved in the neurotransmitter release [1,3]. Variants of LTCC genes and or alteration of their expression have been correlated with severe muscular, cardiovascular, and neuronal channelopathies, such as hypokaliemic periodic paralysis, Timothy syndrome, cardiac arrythmia, deafness, arterial hypertension, Parkinson’s disease, and neuropsychiatric disorders [1].
Three chemical classes of LTCC blockers, including dihydropyridine (DHP: e.g., nifedipine), phenylalkylamines (e.g., verapamil), and benzothiazepines (e.g., diltiazem) are extensively used for the treatment of cardiovascular diseases (CVDs), such as arrythmias, angina pectoris or myocardial ischemia, and arterial hypertension [1,4]. The 1,4-DHP reduces the contractility of vascular smooth muscle cells, resulting in vasodilation and thus efficiently decreases blood pressure [1,4]. These effects are mediated by the inhibition of CaV1.2 channels. The other beneficial effect of DHP in the treatment of arterial hypertension in aldosteronism is mediated by the inhibition of Cav1.3 channels of zona glomerula cells of the adrenal cortex, leading to the decrease in aldosterone secretion [5]. While the activators of LTCC have no therapeutical applications, they constitute useful tools for research studies. BAY K8644 (1,4-dihydro-2,6-dimethyl-5-nitro-4-[2-(trifluoromethyl)phenyl]-3-pyridinecarboxylic acid methyl ester) is one of the most used DHP to efficiently activate CaV1.2, CaV1.3, and CaV1.4 channels [1,4].
Various alkaloids behave as LTCC blockers and have been proven beneficial for the treatment of arterial hypertension [6,7]. Most of them belong to the large group of isoquinoline alkaloids (IAs) [8]. For example, tetrandine, a bisbenzylisoquinoline (BBIQ) alkaloid from Stephania tetranda, has been used in China since the 1950s for the treatment of angina pectoris and arterial hypertension [6,7,9,10]. Tetrandrine exhibits interesting pharmacological properties through the interaction with LTCC and other molecular targets, such as T-type CaV channels, Ca2+-activated K+ channels, and muscarinic receptors [11]. Others BBIQs including curine, hernandezine, cepharanthine, daphnoline, and daurisoline have been reported to inhibit LTCC [12,13,14,15]. Curine induces an LTCC blockade and subsequent arterial vasodilation [14,15]. IAs from other subgroups, such as liriodenine (an oxoaporphine) and berberine and coptisine (two protoberberines), have been also shown to block LTCC [16,17,18].
Here, we aimed to characterize the ability of IAs from an in-house alkaloid library, for their ability to block LTCC. We selected 16 IAs from the BBIQ, oxoaporphine, berberine, protoberberine, and protopine subgroups, which display members already reported as inhibitors of LTCC. Two cularines and one pavine were also used, but no LTCC inhibition has been reported for these two IA subgroups. In our cell assay, we used the clonal cell line GH3b6, which endogenously expressed two LTCC isoforms, CaV1.2 and CaV1.3 [19,20]. We used KCl and (±)-BAY K8644 (BAY K8644) to activate LTCC, which both increased [Ca2+]i in the GH3b6 cells, monitored by Fura-2 fluorescence. We determined that one oxoaporphine, oxostephanine, and two BBIQs, thalmiculine and thaliphyline, potently inhibit LTCC with different modes of action.
2. Materials and Methods
2.1. Reagents
Fura-2/AM probe and Pluronic®-F127 were purchased from Invitrogen (Carlsbad, CA, USA). Nifedipine, (±)-BAY K8644 (1,4-Dihydro-2,6-dimethyl-5-nitro-4-(2 trifluoromethylphenyl) pyridine-3-carboxylic acid methyl ester), and all solvents were purchased from Sigma-Aldrich (Saint-Louis, MO, USA) or Fisher Scientific (Waltham, MA, USA).
2.2. Alkaloids Tested for Their Ability to Block LTCC
Sixteen alkaloid members of the BBIQ, oxoaporphine, berberine, protoberberine, protopine, pavine and cularine subgroups were selected in our in-house library (Table 1). These alkaloids were extracted and purified from plants and collected during the recent decades in the SONAS laboratory (EA 921, University of Angers, Angers, France). Each sample was solubilized in DMSO at 10 mM and stored at −20 °C in aliquots to prevent thaw/refreeze cycle for further usage.
2.3. Cell Culture
GH3b6 cell line is a subclone of a cell line isolated from a tumor of the rat pituitary gland [21]. This cell line was generously provided by Dr. Françoise Macari (IGF, Montpellier, France). Cells were cultured as previously described [20]. In brief, culturing was carried out from passage 14 until passage 32 at 37 °C with 5% CO2 and 95% humidity in Dubelcco’s Modified Eagle Medium/F12 (Lonza, Basel, Switzerland) supplemented with 10% fetal bovine serum (Lonza), 1 mM L-glutamine, and 1% of penicillin/streptomycin. GH3b6 cells were seeded at a density of 100,000 cells per well on a 96-well Greiner black/clear bottom imaging plates (Corning Hazebrouck, Borre, France) and incubated at 37 °C/5% CO2 for 24 h before starting experiment.

Table 1.
Isoquinoline alkaloids (IAs) used in this work to screen for LTCC blockers.
Table 1.
Isoquinoline alkaloids (IAs) used in this work to screen for LTCC blockers.
| Trivial Name | Chemical Class | Structure | Plant Origin (Part of Plant) |
|---|---|---|---|
| (+)-cepharanthine [22] | BBIQ |  | Stephania suberosa, Menispermaceae (tuberous roots) |
| thaliphylline [23] | BBIQ |  | Thalictrum minus var. microphyllum, Ranunculaceae (roots and rhizomes) |
| (−)-curine [24] | BBIQ |  | Cyclea barbata, Menispermaceae (roots) |
| thalmirabine [24] | BBIQ |  | Thalictrum minus var. microphyllum, Ranunculaceae (roots and rhizomes) |
| (−)-thalmiculine [25] | BBIQ |  | Thalictrum cultratum, Ranunculaceae (whole plant) |
| (+)-bebeerine [26] | BBIQ |  | Curarea candicans, Menispermaceae (roots) |
| (−)-curicycleatjenine [27] | Amidic BBIQ |  | Cyclea atjehensis, Menispermaceae (whole plant) |
| (+/−)-8-oxotetrahydropalmatine * | Protoberberine |  | Pycnarrhena sp., Menispermaceae (unknown) |
| tTetrahydropalmatine * | Protoberberine |  | Berberis sp., Berberidaceae (unknown) |
| protopine [28] | Protopine |  | Corydalis majori, Fumariaceae (whole plant) |
| oxostephanine [29] | Oxoaporphine |  | Stephania venosa, Menispermaceae (leaves) |
| liriodenine [29] | Oxoaporphine |  | Stephania venosa, Menispermaceae (leaves) |
| (+)-claviculine [28] | Cularine |  | Corydalis claviculata, Papaveraceae (whole plant) |
| (+)-celtine [30] | Cularine |  | Ceratocapnos palaestinus, Fumariaceae (whole plant) |
| (−)-norargemonine [27] | Pavine |  | Cyclea atjehensis, Menispermaceae (whole plant) |
| (S)-stylopine [31] | Berberine |  | Corydalis majori, Fumariaceae (whole plant) |
* unpublished data.
2.4. Quantitative Real-Time PCR
Total RNA from GH3b6 cells was extracted from using the RNeasy micro kit (Qiagen, Courtaboeuf, France). One µg of total RNA was processed for cDNA synthesis using random hexamers and the QuantiTect Reverse Transcription kit (Qiagen). Real-time PCR assays were assessed on a LightCycler 480 Instrument II (Roche, Meylan, France) using Sybr® Select Master Mix (Applied Biosystems®, Waltham, MA, USA) and 10 ng of cDNA and gene-specific primers of LTCC (Table 2). Relative quantification of gene expression was normalized to the mean of expression of two housekeeping genes gapdh (glyceraldehyde-3-phosphate dehydrogenase) and gusb (beta-glucuronidase) (Table 2) using the 2−ΔCt method, where Ct is the threshold cycle, as previously described [20].
Table 2.
Primer pairs used to amplify LTCC transcripts by RTq-PCR.
2.5. Monitoring Intracellular Ca2+ Using Fura-2
After 24 h of incubation, cells were washed with HBSS (Hank’s balanced salt solution) and then incubated with the dual excitation, monoemission, Ca2+ probe, Fura-2 AM (4 µM), and Pluronic®-F127 (0.02%) in Fura-2 buffer solution composed of (in mM): 2.5 CaCl2, 1 MgCl2, 10 HEPES, and 0.5% BSA (Bovine serum albumin) (pH = 7.4) for 1 h at room temperature and in dark conditions. After washing twice with HBSS, cells were incubated with Fura-2 buffer solution for 1 h. Plates were then illuminated at 340 nm (Ca2+-bound Fura-2) and 380 nm (Ca2+-free Fura-2) excitation wavelengths, and the resulting fluorescence emission was monitored at 510 nm using a FlexStation® 3 Benchtop Multi-Mode Microplate Reader (Molecular Devices, Sunnyvale, CA, USA). Thirty seconds after baseline recording, LTCC activators, including KCl (1, 10, 30, and 100 mM) or BAY K8644 (1 µM), were automatically injected with or without nifedipine, and the fluorescence emission was read between 220 and 400 s. For testing the ability of IAs to inhibit LTCC, each IA was coinjected with KCl or BAY K8644 at 30 s, and the fluorescence of Fura-2 was monitored as described above. As negative control, HBSS was injected alone, as was nifedipine and each IA. Each condition was performed in triplicate wells and repeated at least twice. The membrane depolarization induced by 10, 30, and 100 mM was calculated with Goldman–Hodgkin–Katz equation:
E is the membrane potential; R is the universal gas constant; T is the temperature in Kelvin; F is the Faraday’s constant; PK, PNa and PCl are the membrane permeability values for K+, Na+, and Cl−, respectively; o: outside; and i: intracellular.
2.6. Statistical Analysis
Fluorescence data analysis was performed using the SoftMax Pro 5.4.1 software (Molecular Devices, Sunnyvale, CA, USA). The kinetic traces of Ca2+ signals, monitored with Fura-2, were plotted as a ratio of fluorescence intensities measured at λ = 510 nm as emission, after a dual excitation at λ = 340 nm and 380 nm. The area under curve (AUC) was used for analysis. All graphs and statistical analysis were established using GraphPad Prism 7.02 (GraphPad Software, San Diego, CA, USA). Data are presented as mean ± SEM. Nonlinear analysis was used to fit the concentration–response data with Langmuir–Hill equation with Hill coefficient. For this analysis, the integration of the fluorescence kinetics (AUC) obtained with increasing concentrations of ligands were used. IC50 or EC50 and Hill coefficient values were calculated from at least two experiments. When applicable, nonparametric tests were used to analyze significance.
3. Results
3.1. KCl and BAY K8644 Induced Ca2+ Responses Mediated by L-Type CaV Channels (LTCC) in GH3b6 Cells
We first evaluated Cav channel expression by RT-qPCR (Figure 1). The data showed the endogenous expression of cacna1c and cacna1d transcripts, encoding for CaV1.2 and CaV1.3 channel subtypes, respectively (Figure 1). The mRNA expression level of cacna1c was found significantly higher than that of cacna1d (p < 0.0001, one-way ANOVA). As expected, the cacna1s mRNA encoding the muscular LTCC isoform CaV1.1 was not detected.
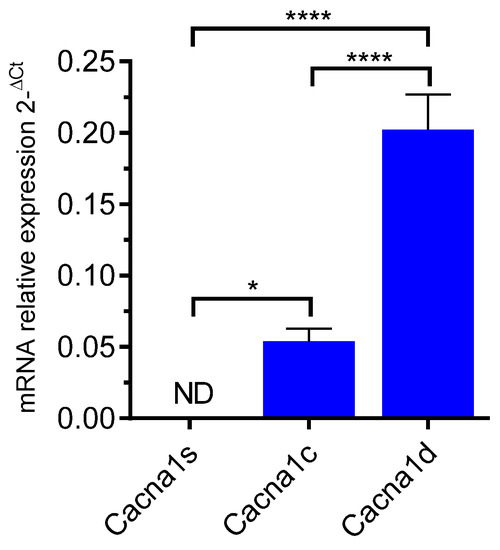
Figure 1.
RT-qPCR amplification of LTCC genes in GH3b6 cells. The histogram illustrates the expression level of cacna1s, cacna1c, and cacna1d encoding Cav1.1, Cav1.2, and Cav1.3, respectively. The data are mean of mRNA relative expression ±SEM. ND: Not Detected. One-way ANOVA (p < 0.0001) followed by Tukey’s post hoc multiple comparison test was performed. * p < 0.05, **** p < 0.0001.
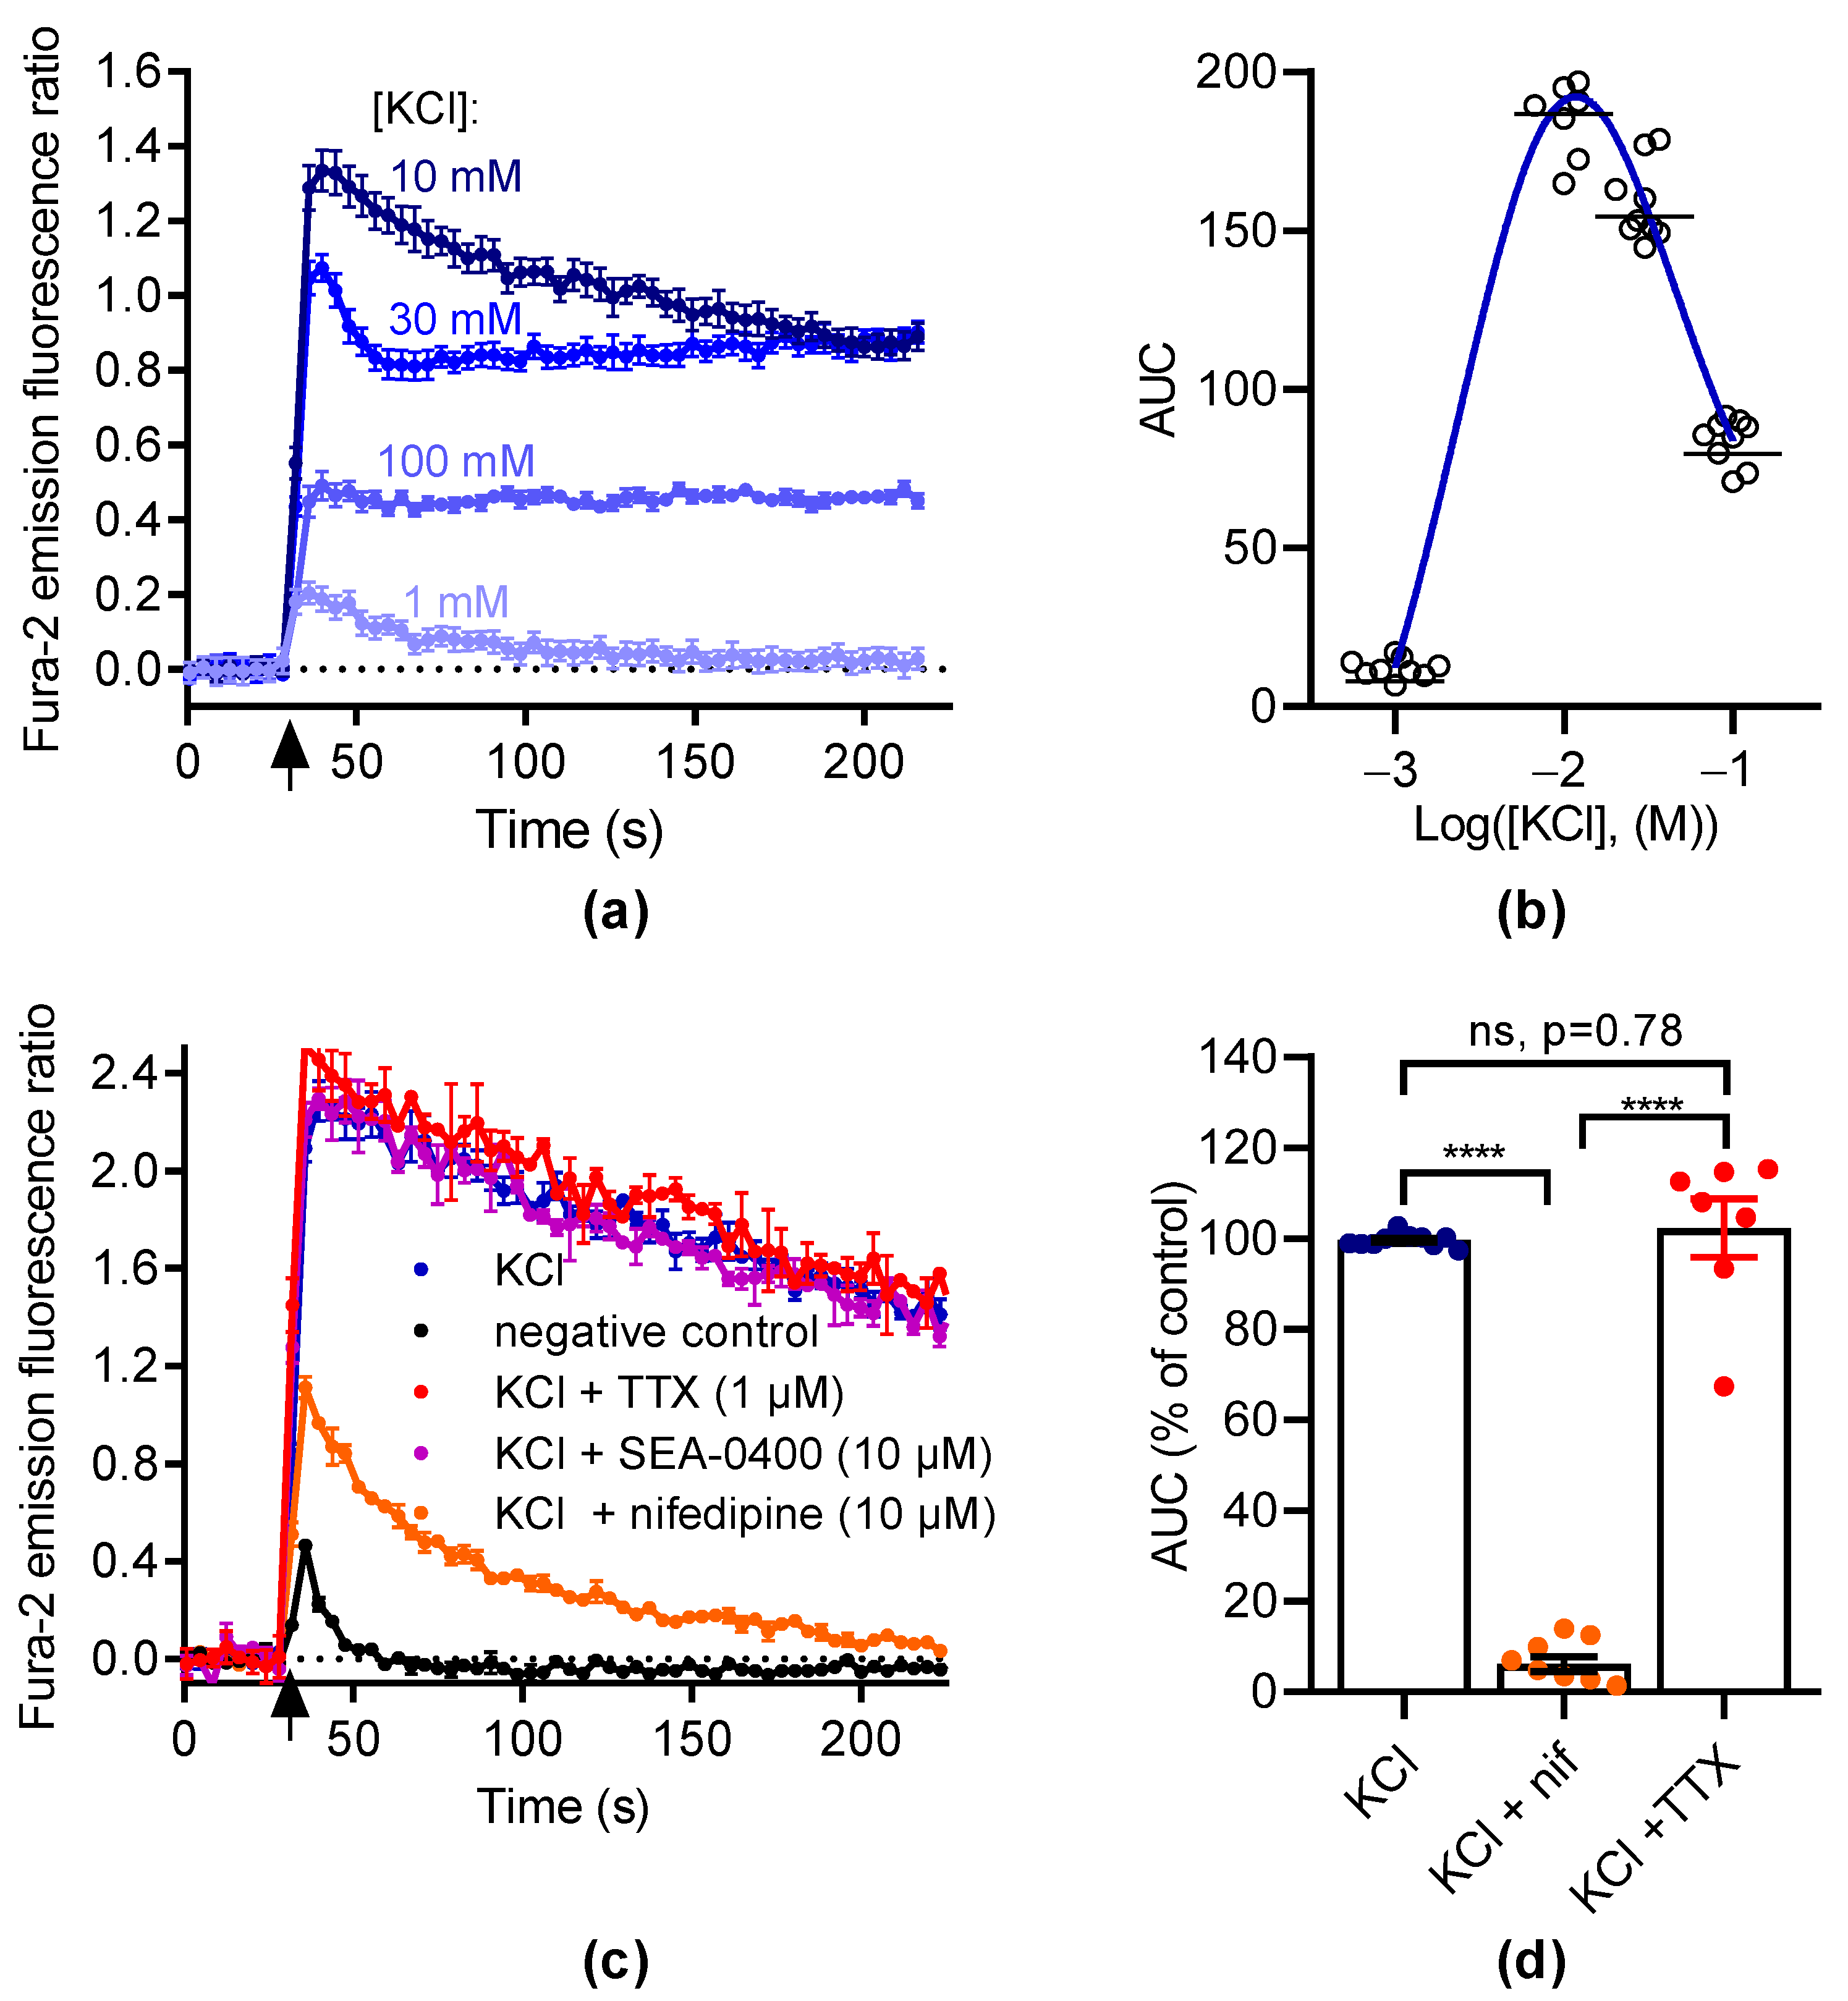
Next, we measured the variation of [Ca2+]i in responses to membrane depolarization with KCl (Figure 2a). The data were best fitted to a bell-shaped concentration–effect curve with a maximal response at 10 mM KCl (Figure 2b). Thus, we tested the ability of nifedipine to inhibit the [Ca2+]i elevation induced by 10 mM KCl (Figure 2c). At 10 µM, nifedipine abolished this response (93.9 ± 1.7% inhibition, Figure 2d). This indicates that the [Ca2+]i elevation induced by KCl was mostly mediated by LTCC.
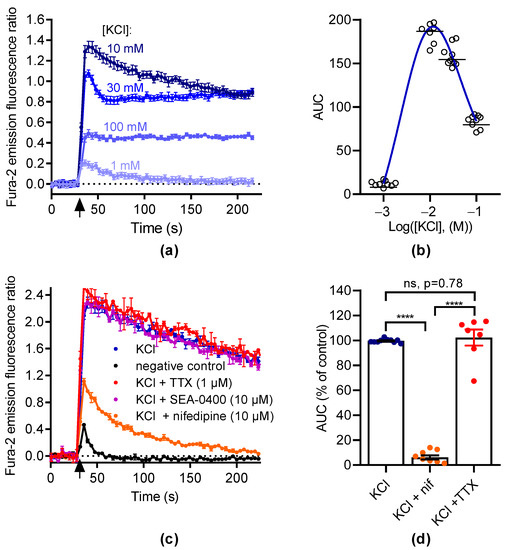
Figure 2.
KCl induces intracellular Ca2+ increase in GH3b6 cells. (a) Representative kinetic traces of KCl-induced Ca2+ responses. The fluorescence emission ratio of Fura-2 increased after the injection of KCl (black arrow) at 1, 10, 30, and 100 mM, respectively. (b) The concentration–Ca2+ response relationship for KCl is described by a bell-shaped curve. The AUC of kinetic traces of KCl-induced Ca2+ responses were fitted by a bell-shaped curve equation. The horizontal dashes represent the mean value. (c) Representative kinetic traces of Ca2+ responses induced by KCl at 10 mM in the absence and presence of nifedipine (10 µM), TTX (1 µM), and SEA-0400 (10 µM), respectively. As a negative control, HBSS was injected alone. (d) The scatter plot illustrates the effects of nifedipine (10 µM) and TTX (1 µM) on Ca2+ responses induced by 10 mM KCl. The AUC of fluorescence emission traces over time were normalized using maximum response to 10 mM KCl. The bars represent the mean ± SEM. Significance between groups was analyzed by one-way ANOVA (p < 0.0001) followed by Tukey’s post hoc multiple comparison test. ****, p < 0.0001; ns, nonsignificant. Data are shown as mean ± SEM ((a,c): n = 3; (b): n = 9).
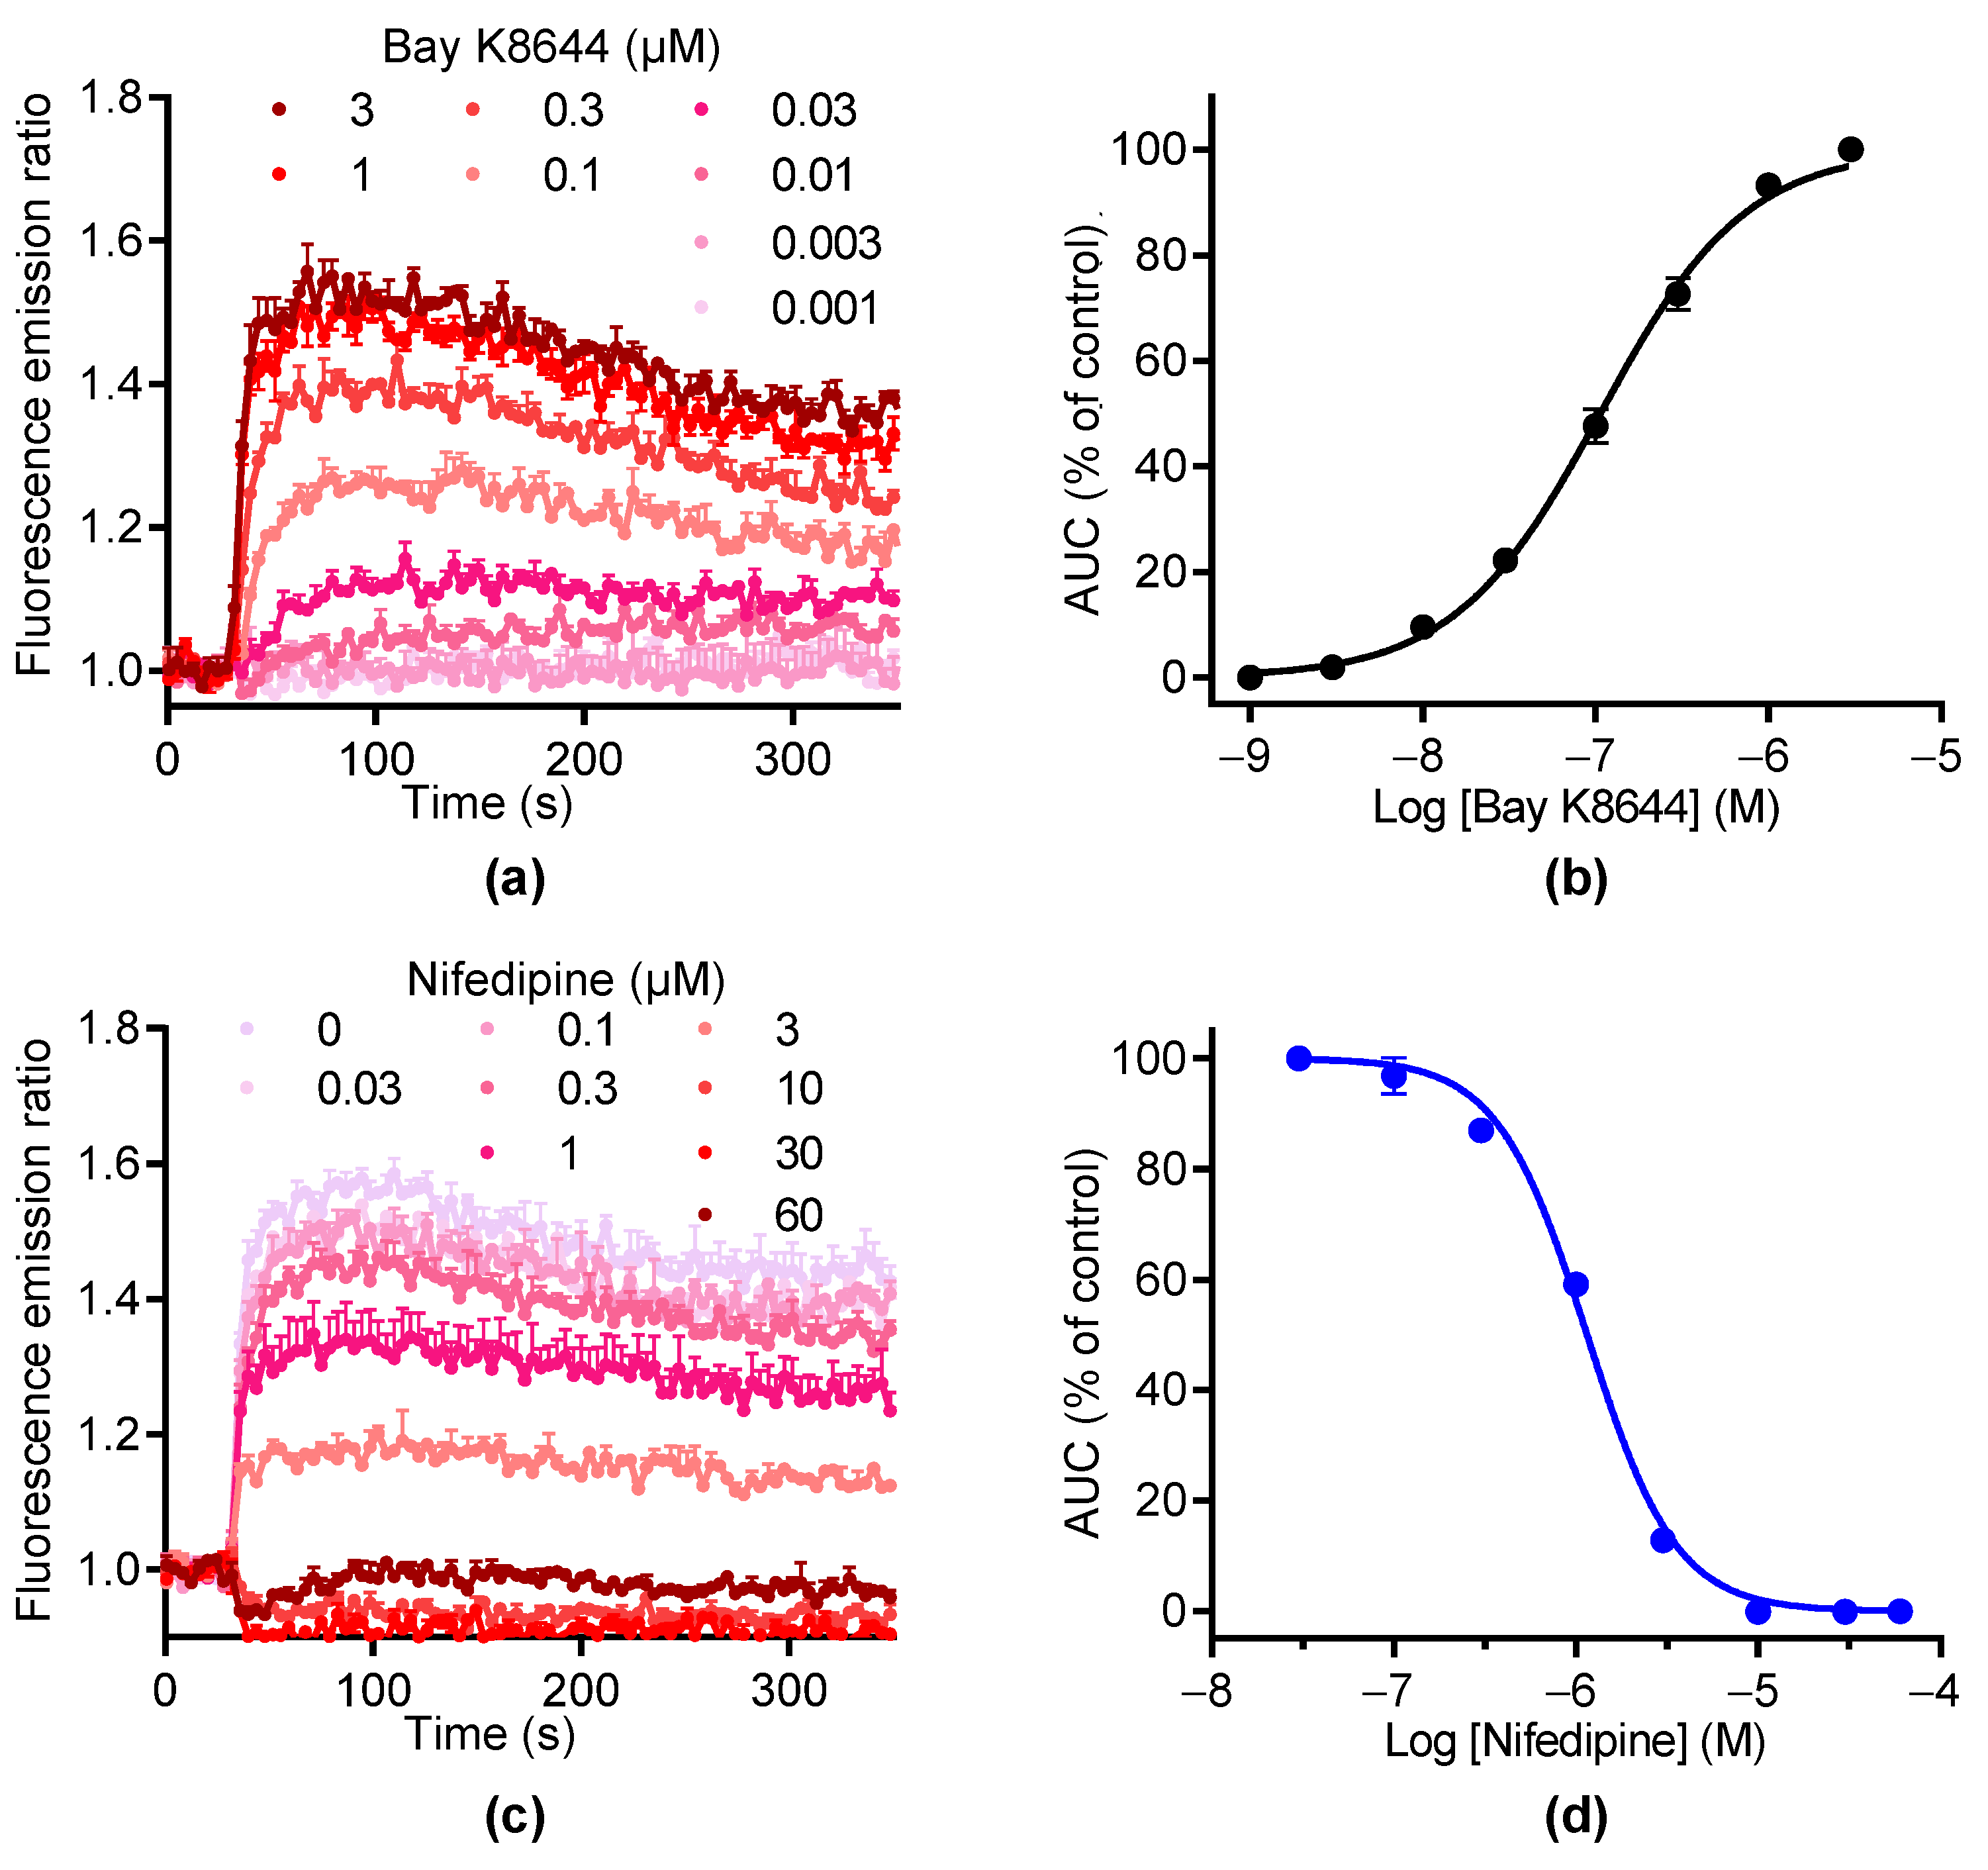
We then used BAY K8644 to activate LTCC. As illustrated in Figure 3a, BAY K8644 induced [Ca2+]i elevations in a concentration-dependent manner with an EC50 of 1.07 ± 0.04 µM and a Hill coefficient of 1.18 ± 0.15 (n = 2, Figure 3a,b). The increase in [Ca2+]i induced by BAY K8644 was inhibited by nifedipine in a concentration-dependent manner with an IC50 of 1.69 ± 0.51 µM and a Hill coefficient of 1.94 ± 0.16, respectively (n = 2, Figure 3c,d). At 10 µM, nifedipine totally inhibited the increase in [Ca2+]i induced by BAY K8644. These data demonstrate that the [Ca2+]i elevation in response to BAY K8644 is fully mediated by LTCC.

Figure 3.
BAY K8644 activates LTCC channels in GH3b6 cells. (a) Example of kinetic traces of Fura-2 emission fluorescence induced by increasing concentrations of BAY K8644. (b) Concentration–response curve of BAY K8644-evoked Ca2+ responses. (c) The kinetic traces show that the Ca2+ responses induced by 1 µM of BAY K8644 were inhibited by nifedipine in a concentration-dependent manner. (d) Inhibition–concentration curve of nifedipine. (b,d) The AUC of kinetic traces were normalized to maximal response (% of control) and analyzed using Hill–Langmuir equation with variable slope. Data are means ± SEM (n = 3). These experiments were repeated twice.
3.2. Screening of Isoquinoline Alkaloids for Inhibitors of LTCC
Sixteen alkaloids (Table 1) were chosen to screen for LTTC inhibitors based on structural analogs known to inhibit LTCC. Each alkaloid was injected alone or coinjected at 10 µM with BAY K8644 or KCl. None of the 16 compounds injected alone modified the Fura-2 fluorescence emission ratio (Figure 4a). Oxostephanine, liriodenine, thaliphylline, and thalmiculine inhibited BAY K8644-induced Ca2+ responses with higher potency, at 72.4 ± 5.9%, 44.0 ±0.8%, 41.5 ± 8.9%, and 71.6 ± 11.0%, respectively (Figure 4b). With the exception of liriodenine, these IAs also inhibited KCl-induced Ca2+ responses to the same extent (oxostephanine: 67.5 ± 8.8%, thaliphylline: 46.9 ± 3.8%, and thalmiculine: 60.0 ± 15.6%, Figure 4b). Liriodenine had a very low effect at 10 µM on KCl-induced Ca2+ responses (4.9 ± 4.8%). Additionally, cepharanthine used at 10 µM had a strong inhibitory effect on KCl-induced Ca2+ responses (59.5 ± 4.6%) and a low effect on BAY K8644-induced Ca2+ responses (12.4 ± 1.8%).
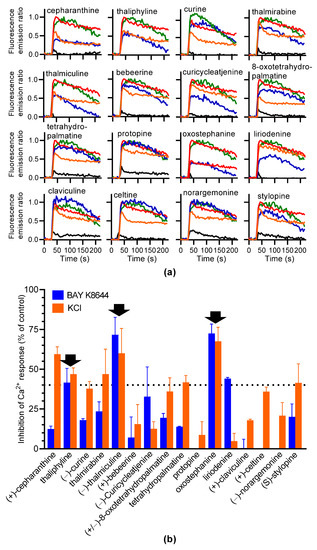
Figure 4.
Screening of 16 IAs for inhibiting BAY K8644 or KCl-induced Ca2+ response in GH3b6 cells. (a) The kinetic traces show the fluorescence emission ratio over time after injection of each IA (10 µM), alone (black line), with 1 µM of BAY K8644 (blue line), or with 10 mM of KCl (orange line). BAY K8644 (green line) and KCl (red line) were injected alone as positive controls. Data are means (n = 3). (b) The histogram shows the inhibitory effects in % of each IA on BAY K8644 and KCl-induced Ca2+ responses. The black arrows point out the IAs, which inhibit both BAY K8644 and KCl -induced Ca2+ responses at more than 40% (dashed horizontal line). Data are means ± SEM (n = 3–4).
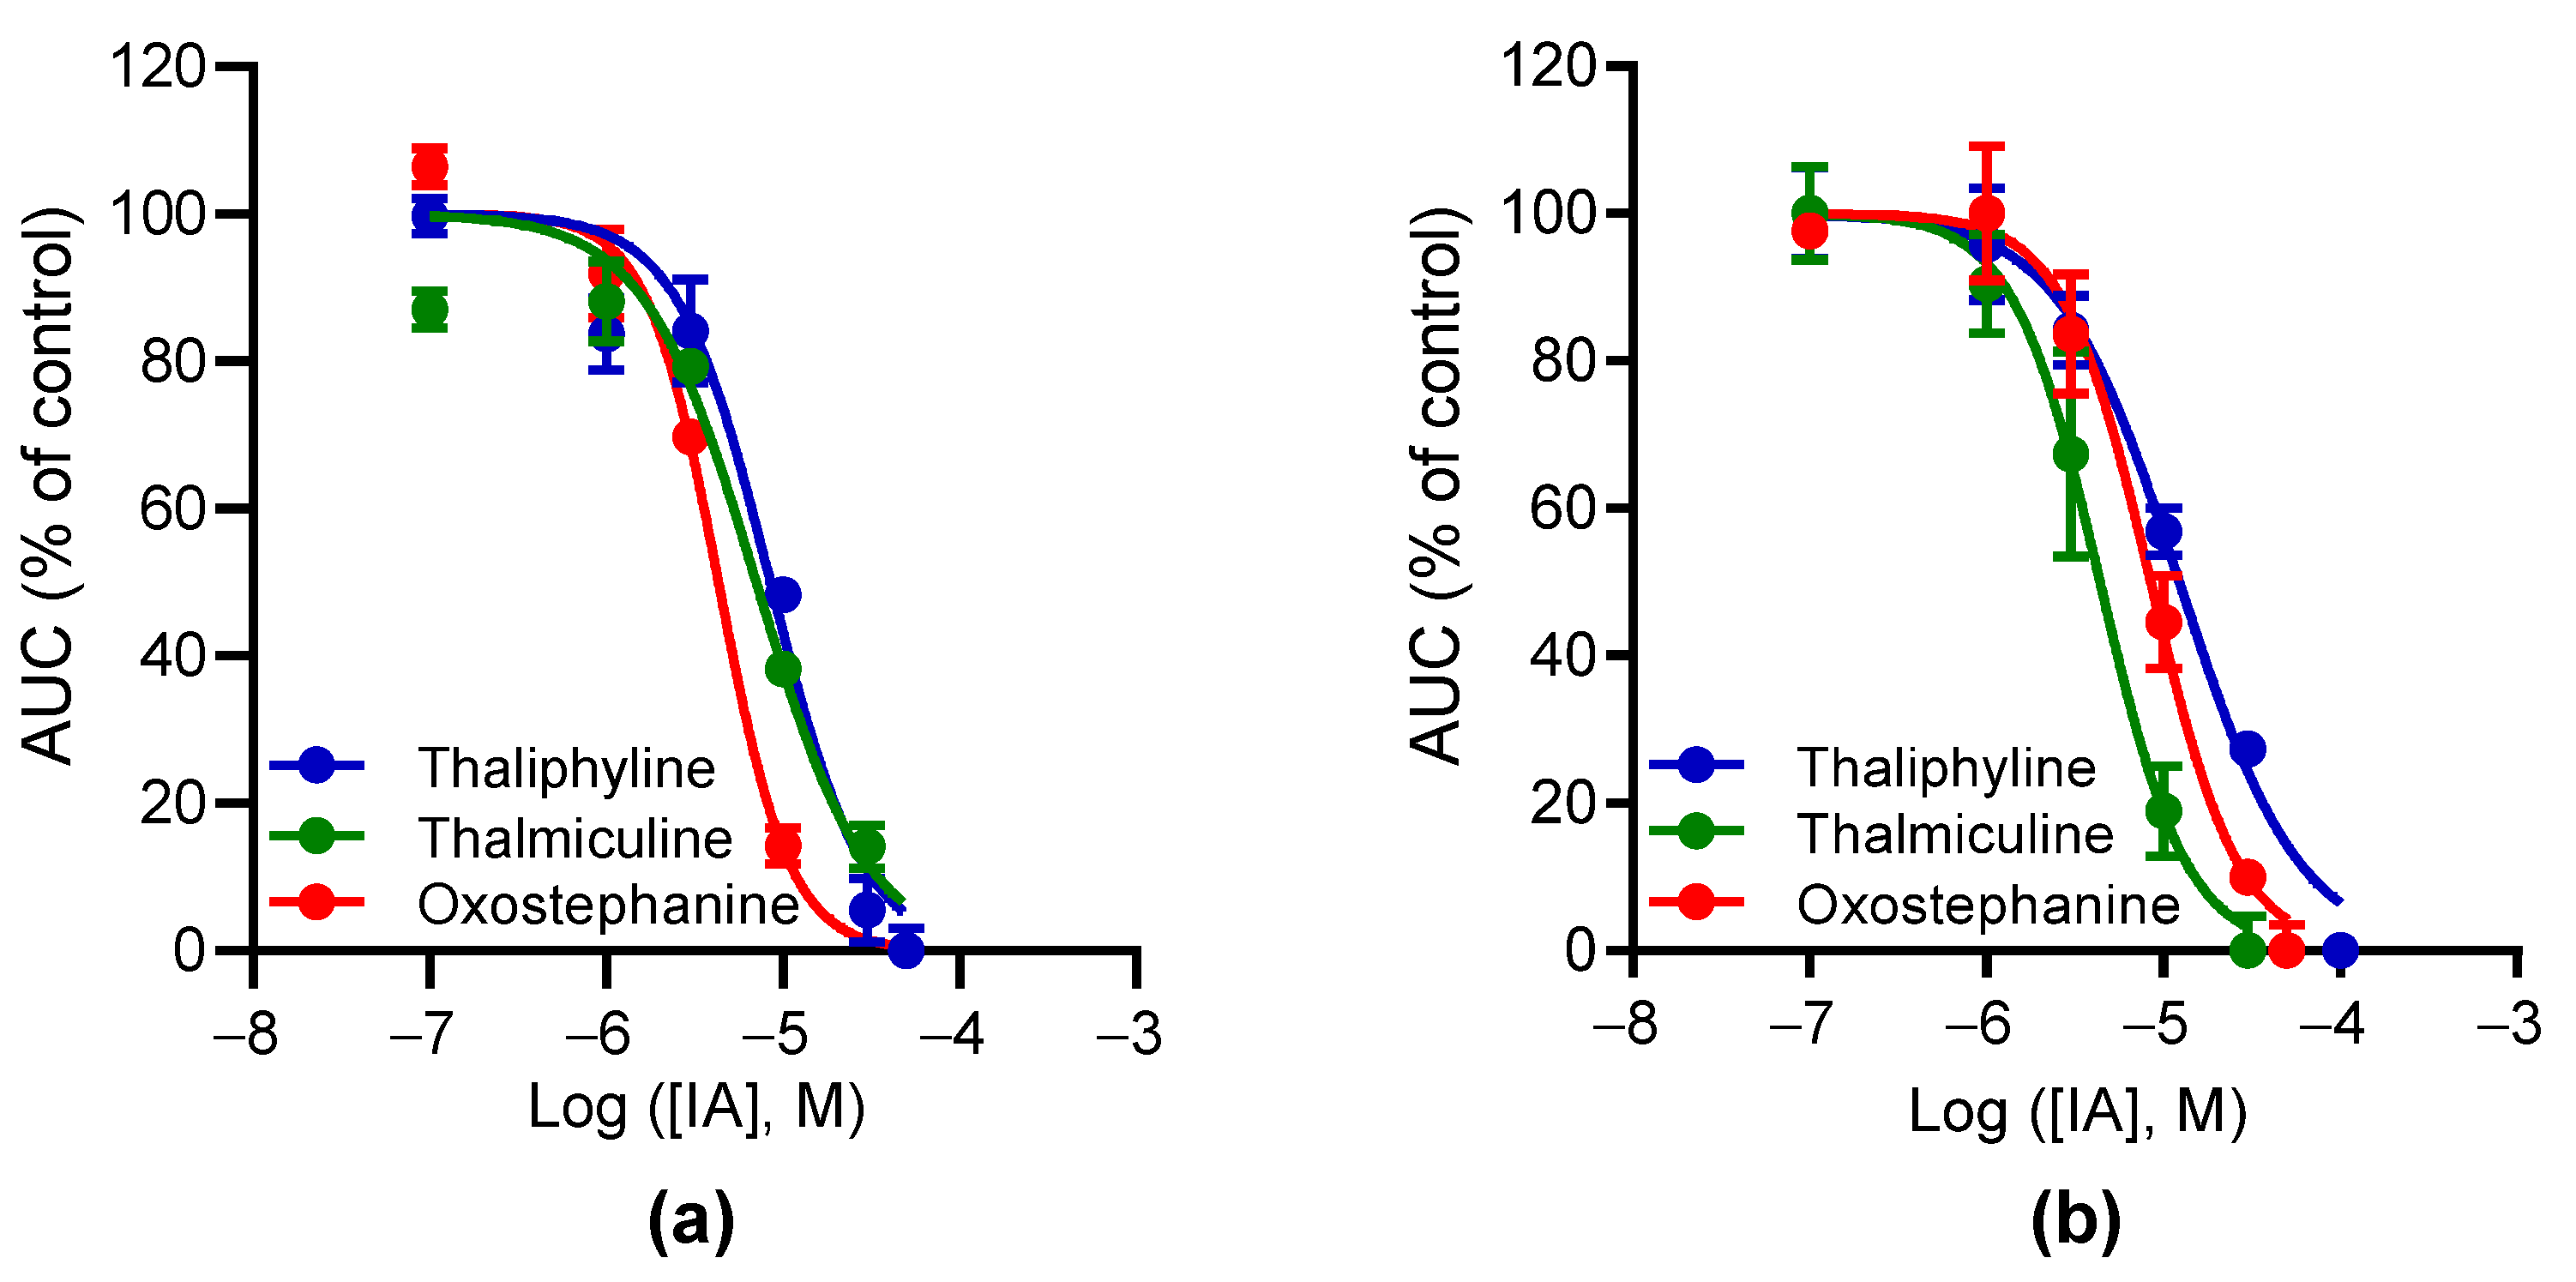
We finally selected oxostephanine, thaliphylline, and thalmiculine, which inhibited both BAY K8644 and KCl-induced Ca2+ responses at 40% minimum for further pharmacological characterization. The potency of the inhibitory effects of these three IAs on BAY K8644 (Figure 5a) or KCl-induced (Figure 5b) Ca2+ increases was further characterized. The determined IC50 values were in the micromolar range for the three molecules and in the same range with both activators of LTCC (4–10 µM, Table 3).
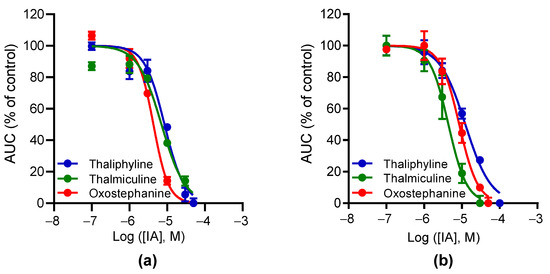
Figure 5.
Concentration–inhibition curves for oxostephanine, thalmiculine, and thaliphyline. The curves represent the relationships of concentration–inhibition effects of oxostephanine, thalmiculine, and thaliphyline on Ca2+ responses induced by 1 µM BAY K8644 (a) or by 10 mM KCl (b). Data (AUC of Ca2+ kinetic response) were normalized to maximal response induced by BAY K8644 or by KCl (% of control) alone. Data were best fitted with Hill–Langmuir equation. Data were expressed as means ± SEM (n = 3). These experiments were repeated thrice.
Table 3.
IC50 and Hill slope values for oxostephanine, thaliphylline, and thalmiculine.
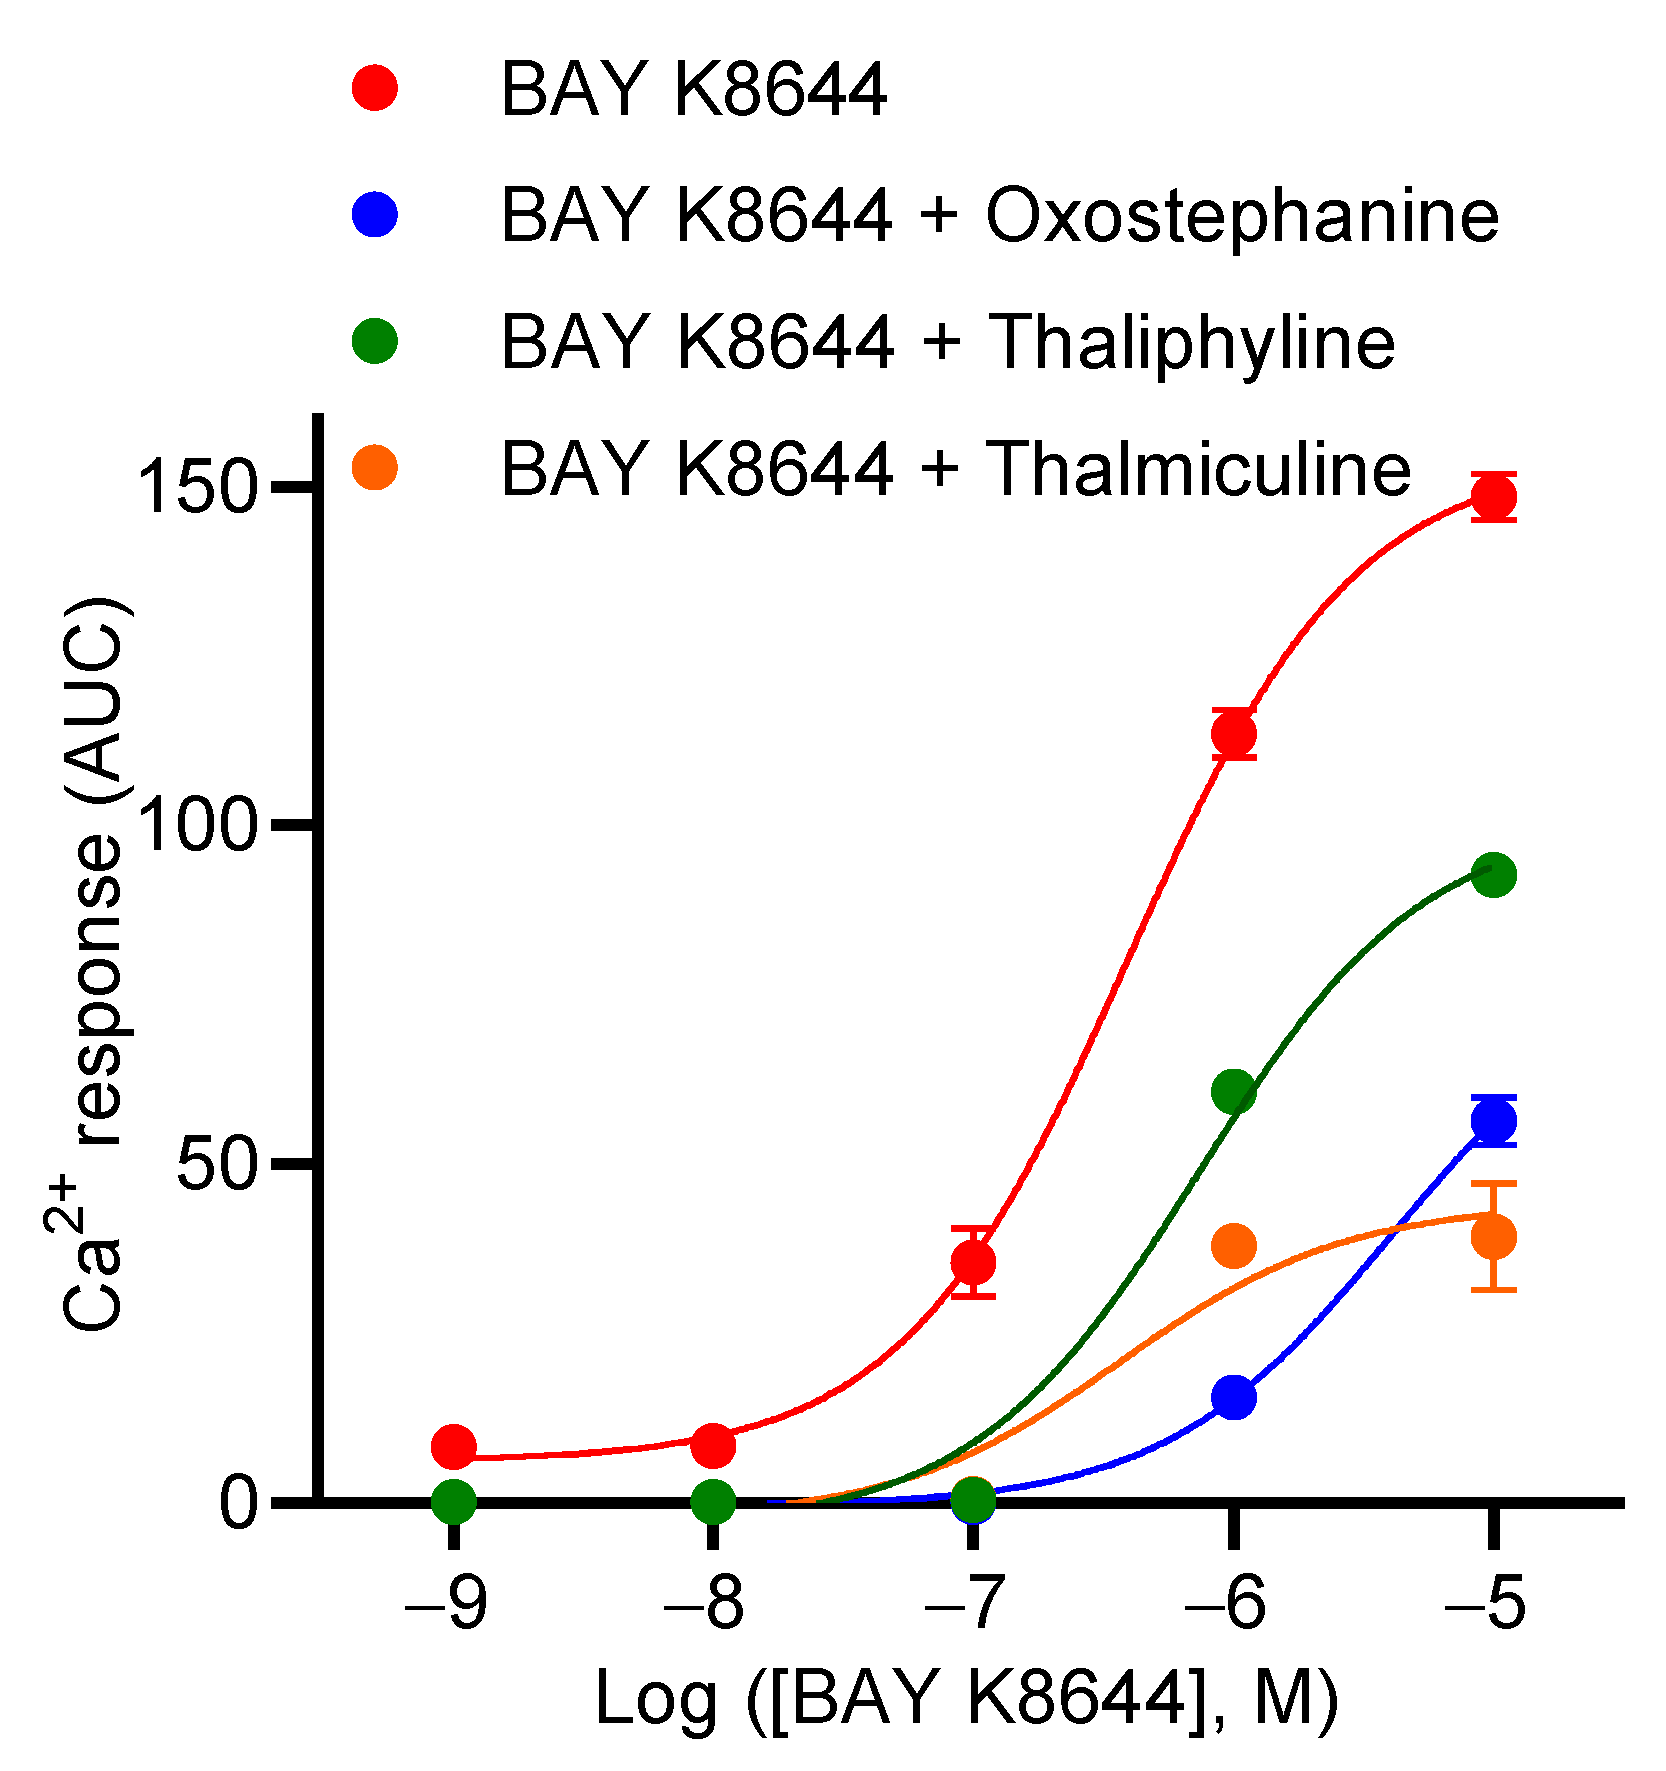
3.3. Effects of Oxostephanine, Thaliphylline, and Thalmiculine on the Concentration–Effect Relationship of BAY K8644
Next, we characterized the inhibitory effects of oxostephanine, thaliphylline and thalmiculine, at 10 µM each, on the concentration–effect relationship of BAY K8644 (Figure 6). Oxostephanine caused a right shift of the curve, leading to a 10-fold increase in the EC50 of BAY K8644 (p < 0.05). In addition, the Emax value of BAY K8644 was significantly decreased 2.6-fold in the presence of oxostephanine (p < 0.05, Mann–Whitney test). Thaliphylline and thalmiculine did not significantly change the EC50 value of BAY K8644 (p = 0.9) (Table 4). However, these two BBIQs significantly decreased the Emax value of BAY K8644 (3.7-fold, p < 0.05, with thalmiculine and 1.6-fold, <0.05, with thaliphyline, Mann–Whitney test). The Emax value of BAY K8644 decreased to a smaller extent than observed for oxostephanine and thalmiculine (Table 4). These results show that oxostephanine and both BBIQs exhibit distinct mechanisms of inhibition; oxostephanine altered both potency and efficacy of BAY K8644, while thaliphylline and thalmiculine only decreased the efficacy of BAY K8644 (Figure 6).

Figure 6.
Concentration–response curves of BAY K8644 in the presence of oxostephanine, thalmiculine, or thaliphylline. A total of 10 µM of oxostephanine, thalmiculine, and thaliphylline were coinjected with increasing concentrations of BAY K8644. Data (AUC of Ca2+ kinetic response) were best fitted with Hill–Langmuir equation and are shown in Table 4. Data are mean ± SEM (n = 3). These experiments were repeated thrice.
Table 4.
Effects of oxostephanine, thaliphylline, and thalmiculine on potency and efficacy of BAY K8644.
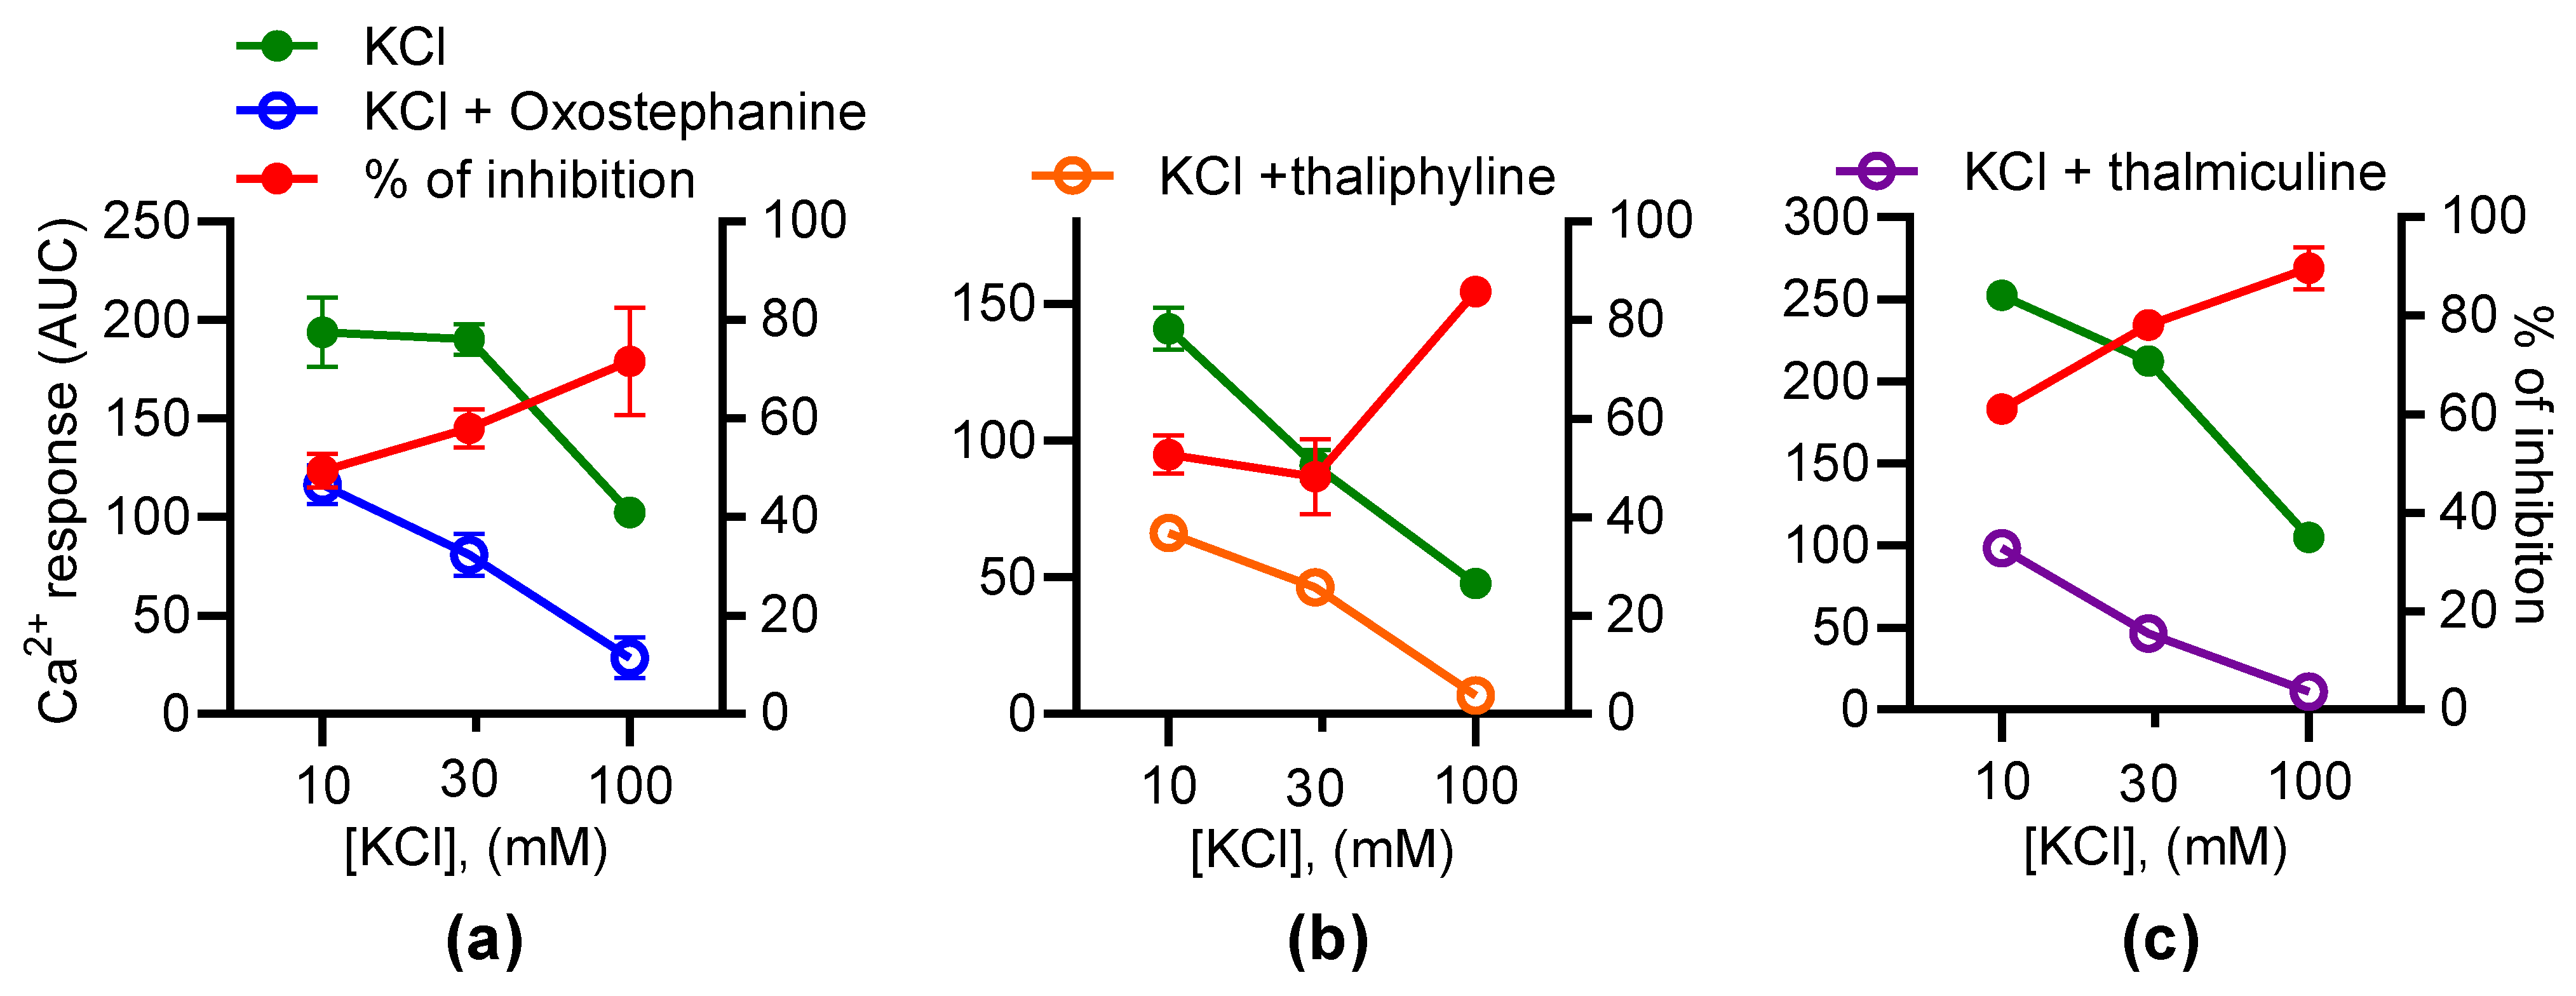
3.4. Inhibitory Effects of Oxostephanine, Thaliphylline, and Thalmiculine Increase versus KCl Concentration
To further characterize the effects of oxostephanine, thaliphylline, and thalmiculine, each at 10 µM, on KCl-induced Ca2+ responses, their inhibitory effects were evaluated as a function of the KCl concentrations (10, 30, and 100 mM) (Figure 7). According to the Goldman–Hodgkin–Katz equation, 10, 30, and 100 mM of KCl induce 8, 28, and 68 mV of depolarization. These experiments allowed us to establish the voltage-dependency of the inhibitory effects of oxostephanine, thaliphylline, and thalmiculine. For oxostephanine, the inhibition rate was similar on Ca2+ responses induced by 10 mM (49.4 ± 3.5%), 30 mM (57.9 ± 3.9%), and 100 mM (p = 0.24, one-way ANOVA test). However, for thaliphylline, the inhibition rate was similar at 10 mM (52.7 ± 3.8%) and 30 mM KCl (48.2 ± 7.6%) (p = 0.80, one-way ANOVA test), but the inhibition rate was significantly higher at 100 mM (85.8 ± 0.4%), in comparison to 10 and 30 mM (p < 0.001, one-way ANOVA test). For thalmiculine, the inhibition rate was similar at 30 mM (78.2 ± 3.0%) and 100 mM KCl (89.7 ± 4.2%) (p = 0.11, one-way ANOVA test), but the inhibition rate was significantly lower at 10 mM (61.0 ± 2.4%) in comparison to 30 and 100 mM (p < 0.05 and p < 0.001, respectively, one-way ANOVA test). In conclusion, the inhibitory effects of thaliphylline and thalmiculine changed according the KCl concentrations, reflecting changes in membrane depolarization levels.

Figure 7.
The inhibitory effects of oxostephanine, thaliphylline, and thalmiculine versus the KCl concentrations. The effects of 10 µM of oxostephanine (a), thaliphylline (b), and thalmiculine (c) were evaluated on Ca2+ responses induced by increasing concentrations of KCl (10, 30, and 100 mM). Left y axis: AUC were determined from kinetics of the Fura-2 emission fluorescence ratio. Right axis: the inhibition was calculated as a ratio of AUC of kinetic traces in the presence and absence of IAs in %. Data are mean ± SEM (n = 3).
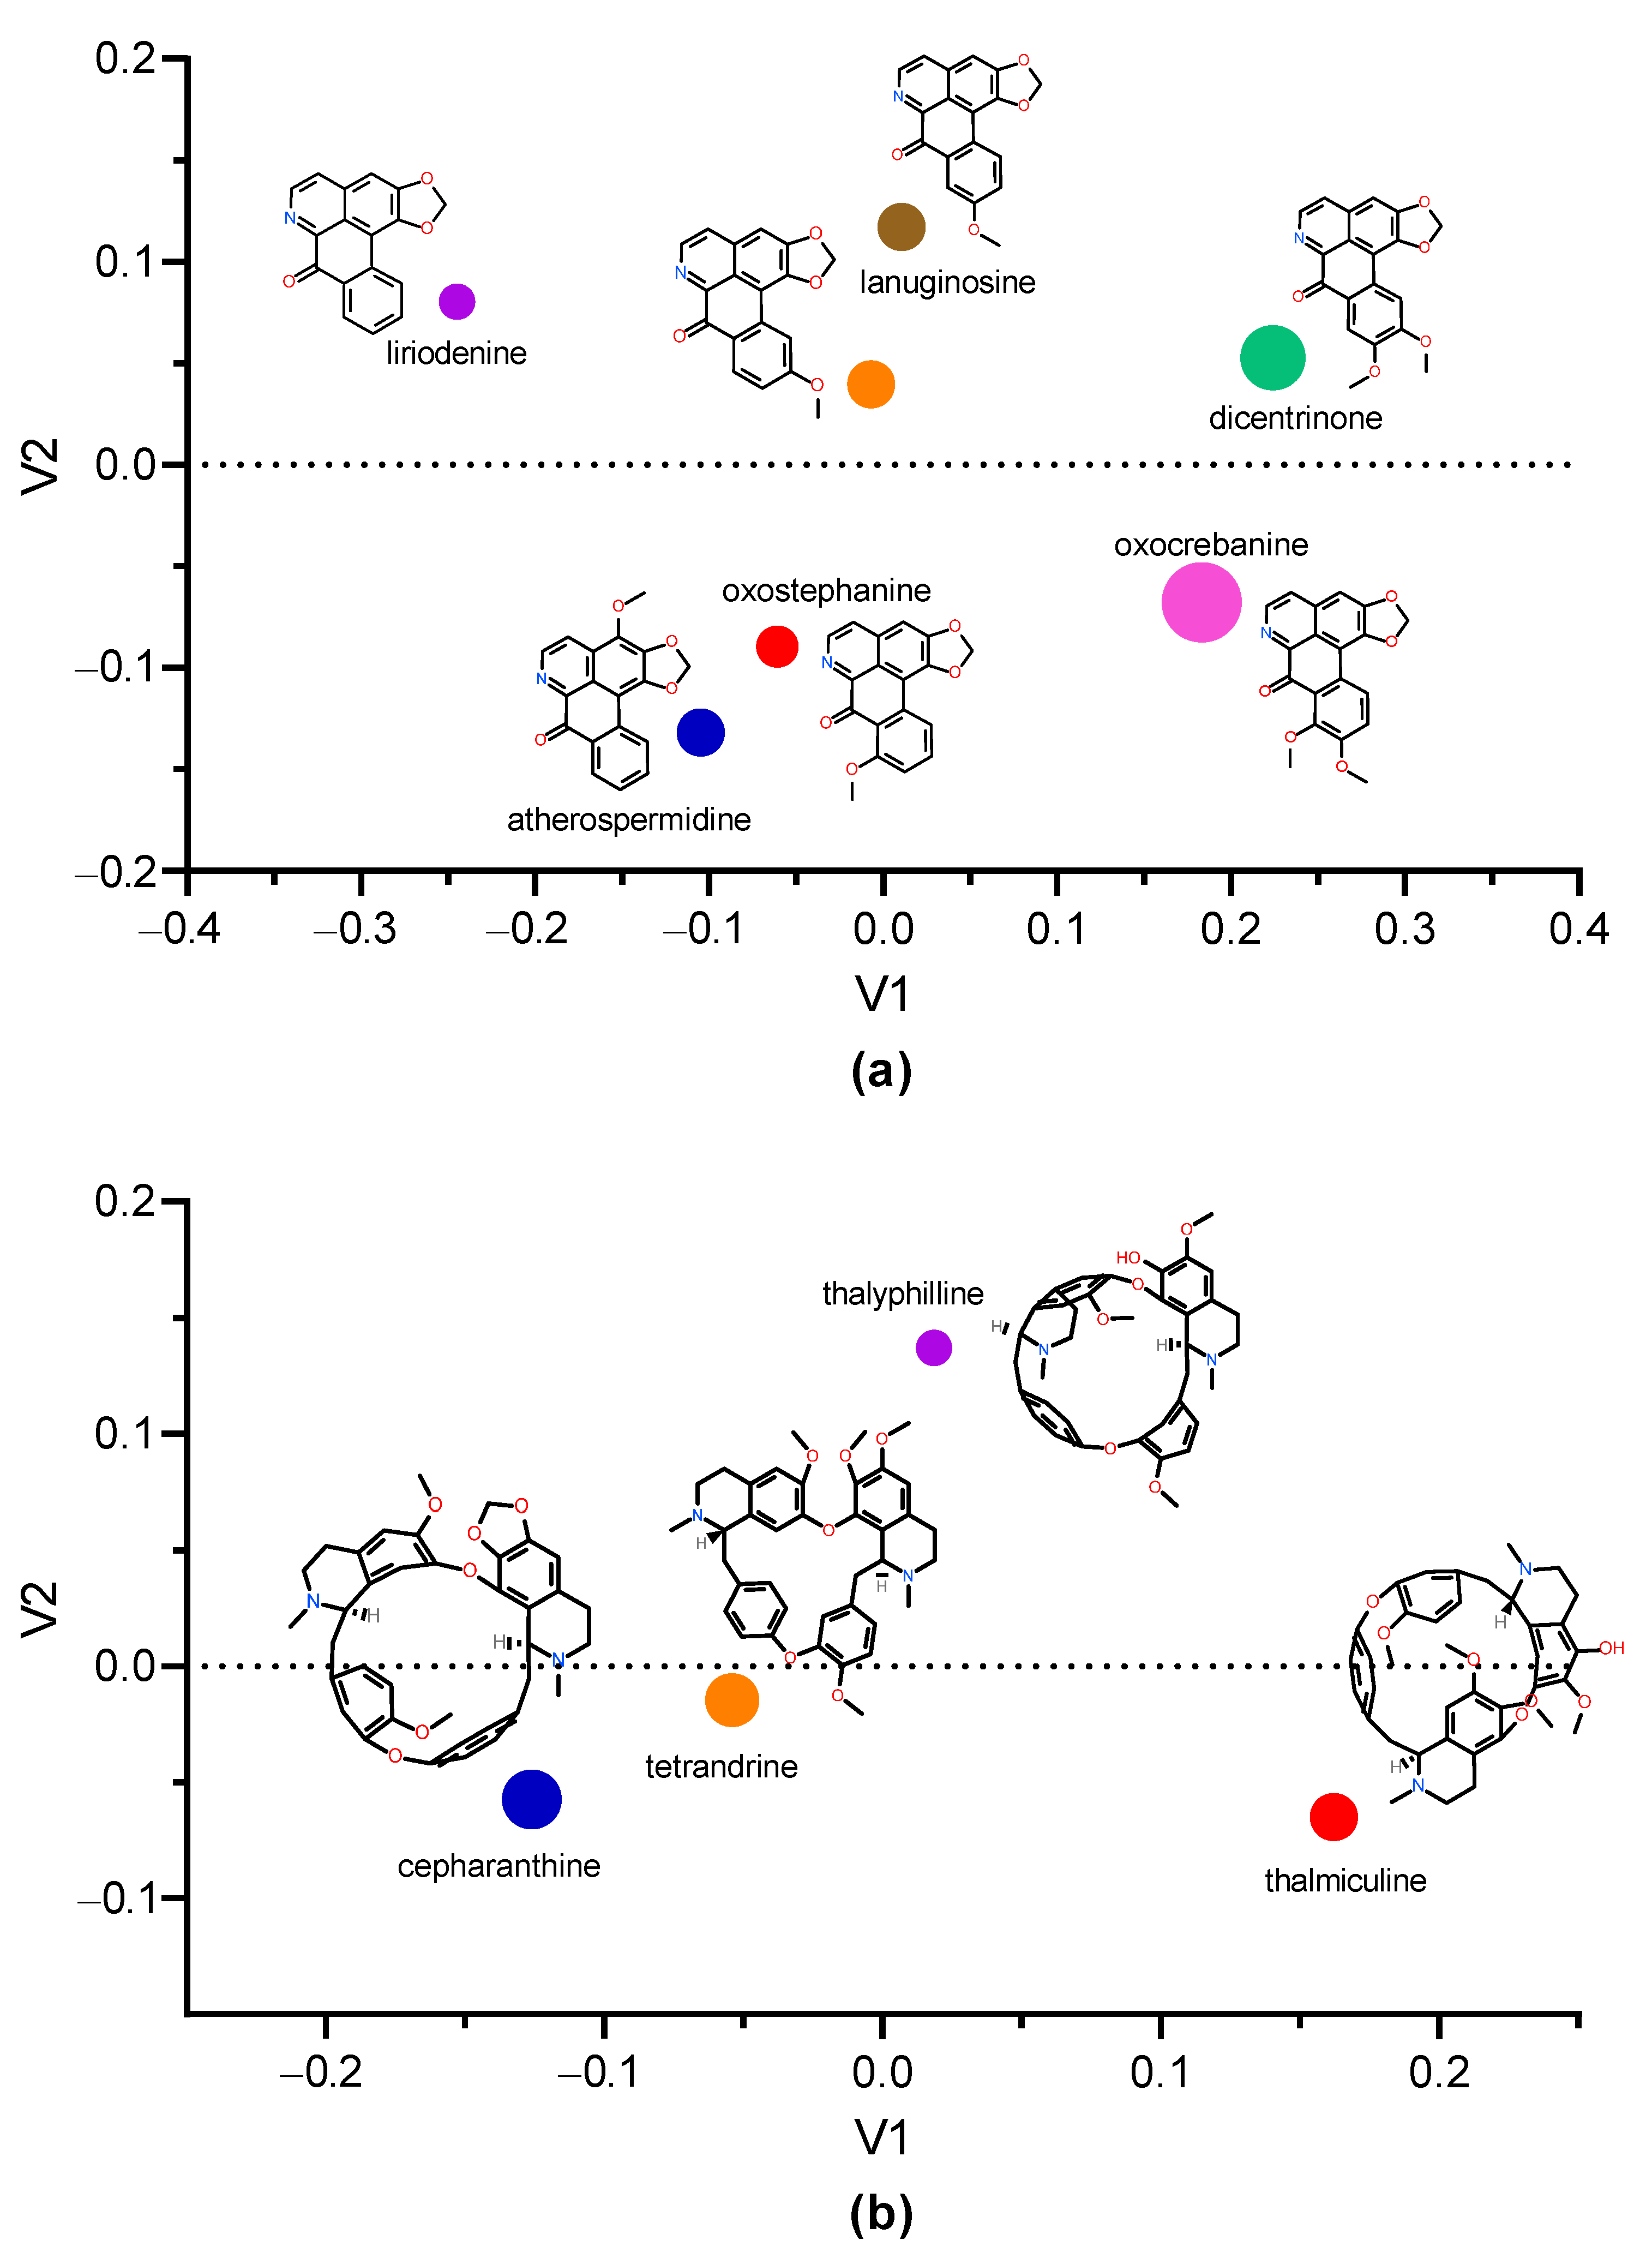
3.5. Structural Analogs of Oxostephanine, Thaliphylline, and Thalmiculine
Searching for structural analogs of oxostephanine allowed us to identify six other oxoaporphines alkaloids in the ChemIDplus data base (Figure 8a), namely, liriodenine, lauterine, atherospermidine, lanuginosine, oxocrebanine, and dicentrinone. These seven oxoaporphines only differ in the number and position of methoxy groups. The analysis of similarity using ChemMine tools [32] showed that oxostephanine shared the highest structural similarity with lauterine and atherospermidine, respectively (atom pair similarity of 0.83, Table 5). The analysis of these seven IAs by multidimensional scaling (MDS) (Figure 8a) highlighted at least three clusters: (1) oxostephanine and atherospermidine; (2) lanuginosine and lauterine; and (3) oxocrebanine and dicentrinone, while liriodenine appeared to be further than the other IAs.
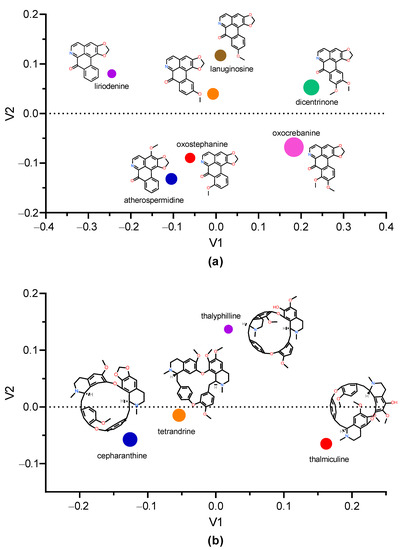
Figure 8.
Multidimension scaling analysis using Tanimoto coefficient. The multidimension scaling analysis of structural similarity among selected IAs was performed with ChemMine tools [32]. (a) Clustering of oxostepharnine, liriodenine, lauterine, atherospermidine, lanuginosine, oxocrebanine, and dicentrinone. (b) Comparison of structures of thaliphylline and thalmiculine and the inhibitory effects of oxostephanine, thaliphylline, thalmiculine, tetrandrine, and cepharanthine versus KCl concentrations. Inside the graphs, the 2D structure of each IA is shown next to the corresponding colored dot, whose size is proportional to the molecular weight. V1 and V2 values were calculated using Tanimoto coefficient.
Table 5.
Structural similarities among oxostephanine and other oxoaporphines.
Since thaliphylline and thalmiculine belong to the BBIQ subgroup of IAs, we analyzed their structural similarities with tetrandrine and cepharanthine, which have been already described as LTCC blockers. While thaliphylline shared the highest structural similarity with tetrandrine (0.80), thalmiculine is structurally closer to tetrandrine (0.76) (Table 6). The MDS analysis did not reveal clustering of thaliphylline and thalmiculine but showed a relative high similarity between tetrandrine and cepharanthine (Figure 8b).
Table 6.
Structural similarities among thaliphylline, thalmiculine, tetrandrine, and cepharanthine.
4. Discussion
In this study, we identified three novel LTCC blockers, one oxoaporphine, oxostephanine, and two BBIQs, thalmiculine and thaliphyline, exhibiting structural analogy with known IAs, which inhibit LTCC. Oxostephanine, thaliphylline, and thalmiculine inhibited LTCC, expressed in GH3b6 cells with IC50 values in the micromolar range. While oxostephanine decreased both potency and efficacy (maximal effect) in the activator of LTCC, BAY K8644, thalmiculine, and thaliphyline only altered its efficacy. In addition, the inhibitory effects of thalmiculine and thaliphyline increased as a function of the level of membrane depolarization induced by KCl, while oxostephanine did not. Altogether, these data revealed distinct modes of action inhibition of LTCC by both kinds of IAs.
GH3b6 cells endogenously express LTCC isoforms, CaV1.2 and CaV1.3, at the transcriptional level as previously described [19,20]. This was expected since this cell line is a subclone of GH3 cells, which have been extensively used for the investigation of LTCC pharmacology. Moreover, GH3b6 cells respond to both KCl and BAY K8644 by [Ca2+]i elevations, which were suppressed by the selective LTCC blocker, nifedipine [1,4]. This constitutes strong pharmacological evidence that KCl and BAY K8644 only activate LTCC in GH3b6 cells, as it has previously been reported in GH3 cells, its clonal parental cells [33]. Thus, GH3b6 cells exhibit excitable properties and represent a convenient cellular model to screen for LTCC blockers by monitoring [Ca2+]i using fluorescent Ca2+ probes, such as Fura-2.
Screening assays based on fluorescent probes should be well-designed to avoid the selection of false positive hits and agonists or antagonists with weak potency. Data mining and analysis are easier and faster with fluorescent assays. That is particularly convenient in large primary screening for rapid selecting hits (Coquerel et al., https://www.mdpi.com/1420-3049/27/13/4133, accessed on 2 May 2022). Here, we benefited from a dual screening based on chemical and pharmacological activation of LTCC in an excitable cell line, allowing a rapid identification of relevant hits. The concept of [Ca2+]i measurement using fluorescent probes for biomolecular screening has been extensively used but remains particularly powerful in ion channels targeting drug discovery [34,35]. Nevertheless, further experiments with electrophysiological techniques are unavoidable since key parameters, such as voltage-dependency and use-dependency, cannot be provided by fluorescent probe-based assays. Our approach consisting of the use of KCl to activate LTCC offers the advantage to induce membrane depolarization in a control manner.
Indeed, KCl-induced Ca2+ responses in GH3 cells is well-known to depend on extracellular Ca2+ and to be blockable by nifedipine [33]. However, extracellular Na+ concentration could also influence KCl-induced Ca2+ responses in these cells, since the replacement of extracellular Na+ by NMDG or TRIS suppresses action potential in GH3 cells and Ca2+ oscillations [36,37,38]. This is due to the contribution of the Na+ leak background channel, NALCN, which regulates cell excitability as well as hormone secretion in endocrine cells [36]. Here, we found that high K+ concentrations (30 and 100 mM) led to weaker Ca2+ responses than low concentrations (10 mM). Since high K+ concentrations were compensated by decreasing Na+ concentrations, we believed that the decreases in KCl-induced Ca2+ responses were likely due to low extracellular Na+ concentrations and consecutively a decrease in NALCN depolarizing effects as we have previously demonstrated in this cell line [36].
Here, we found that the oxoaporphine, oxostephanine, represents a promising blocker of LTCC. Several pharmacological properties of oxostephanine [39] have already been described, such as antiproliferative effects against breast cancer cell lines [40] and antimicrobial [41,42] and antiviral agent activity [43]. However, ion channels have not yet been reported as targets for oxostephanine. Interestingly, its closest structural analog, liriodenine, without a methoxy group present in the benzyl group of oxostephanine, is well known to exhibit a plethora of biological activities mediated by binding to ion channels, including NaV, KV, CaV channels and nicotinic and GABAA receptors [16,44,45]. Liriodenine had a weak inhibitory effect on KCl-induced [Ca2+]i elevation in GH3b6 cells but was able to inhibit BAY K8644-induced Ca2+ responses with a potency 2.5-fold weaker than oxostephanine (data not shown). These data agree with electrophysiological data, showing that liriodenine weakly inhibits (up to a maximum of 35%) the L-type Ca2+ currents recorded in isolated cardiomyocytes [16]. Thus, oxostephanine could be considered as a stronger inhibitor of LTCC than its structural analog liriodenine.
It is conceivable that the high structural similarity between both oxoaporphines suggests common pharmacological targets, such as NaV, KV, CaV channels and nicotinic and GABAA receptors. Other oxoaporphines have been described, sharing high structural similarities with oxostephanine, such as atherospermidine and lauterine. These three oxoaporphines only differ in the position of a methoxy group; oxostephanine and liriodenine exhibit similar pharmacological properties, such as anticancer and antibiotic activities, on different models [46,47,48,49]. Thus, we assume that the oxoaporphine skeleton represents an interesting pharmacophore targeting various ion channel types, and it would be very interesting to investigate further the structure–function relationships of their interaction with ion channels.
In contrast, no biological activities have been reported for the two BBIQs, thaliphylline and thalmiculine in the literature. Interestingly, thaliphylline and thalmiculine do not share high structural similarities, as the tetrandrine and cepharanthine pair. Thaliphylline appears to be structurally closer to tetrandrine than to thalmiculine. Thaliphylline and thalmiculine have been isolated from two different species of herbaceous perennial flowering plants in Ranunculaceae, Thalictrum minus var. microphyllum and Thalictrum cultratum, respectively, which contained various BBIQs [23,25]. Both BBIQs share 95% structural similarity with tetrandrine and cepharantine, which has been already described as a blocker of LTCC in GH3 cells with IC50 in the micromolar range [12,50,51]. Tetrandrine binds to the benzothiazepine site of LTCC inhibitors, such as verapamil and diltiazem, and stimulates the binding of DHP LTCC inhibitors [12]. This is in accordance with our data showing that thaliphylline and thalmiculine bind to an allosteric site, distinct from that of DHP since both BBIQs strongly reduced the maximal effects of BAY K8644. Thus, our findings strongly suggest that thaliphylline and thalmiculine are two inhibitors of LTCC, similar to tetrandrine that is used in traditional Chinese folk medicine to treat hypertension and cardiovascular disease [11]. Then, it will be very interesting to determine whether thaliphylline and thalmiculine exhibit vasorelaxant effects like tetrandrine [9].
Oxostephanine induced a decrease in both potency and efficacy (maximal effect) of BAY K8644, reflecting a noncompetitive antagonism mechanism [52,53] and thus distinct binding sites for both molecules. In contrast, thaliphylline and thalmiculine altered only the efficacy (maximal effect) of BAY K8644. This is in agreement with the interaction of BBIQs with the benzothizepine site of LTCC [12] and previous data showing that benzothizepine and BAY K8644 bind with a noncompetitive mechanisms to LTCC [54]. Thus, we assumed that both BBIQs and BAY K8644 interact noncompetitively with LTCC. Further experiments will be necessary to established whether oxostephanine, thaliphylline, and thalmiculine are reversible or irreversible noncompetitive antagonists of BAY K8644 and also to decipher their binding sites.
Interestingly, the inhibitory effects of both BBIQs, thalyphilline and thalmiculine, on LTCC increased with KCl concentration, suggesting that their blocking mechanism depends on membrane depolarization. Since KCl-induced Ca2+ responses were completely block by nifedipine, the membrane depolarization induced by increasing KCl concentration [Ca2+]i elevation is mediated by LTCC in GH3b6 cells. This is also a strong argument to conclude that thalyphilline and thalmiculine efficiently block LTCC. However, based on IC50 values on the inhibition of Ca2+ responses induced by 10 mM KCl and the comparison of inhibitory effects versus KCl concentrations, thalmiculine appeared to be a more potent inhibitor than thalyphilline. Further experiments will allow us to characterize further their mode of action and selectivity toward all LTCC subtypes. As tetrandrine, thalmiculine represents a valuable tool with potential therapeutic application for the treatment of neurological and cardiovascular diseases.
5. Conclusions
The major findings of this study are the discovery of the first biological activity of two BBIQs, namely, thaliphylline and thalmiculine, from two distinct species of Thalictrum, as novel blocker of LTCC. In addition, we also determined that oxostephanine, an oxoaporphine and structurally close to liriodenine, also exhibits potent inhibitory effects against LTCC. These three IAs likely bind to distinct DHP allosteric sites in LTCC. These data also highlighted the interest in screening two large subgroups of IAs, BBIQs, and oxoaporphines, for finding ligands of LTCC, which could be helpful in the development of novel drugs for the treatment of neurological and cardiovascular diseases.
Author Contributions
Conceptualization, C.L. (Christian Legros) and C.L. (Claire Legendre); methodology, C.L. (Christian Legros) and C.L. (Claire Legendre); formal analysis, C.L. (Christian Legros), C.L. (Claire Legendre) and J.F.; investigation, J.F., C.L. (Claire Legendre) and D.B.; writing—original draft preparation, C.L. (Christian Legros), C.L. (Claire Legendre) and J.F.; writing—review and editing, C.L. (Christian Legros), C.L. (Claire Legendre), C.M., Z.F., D.H., P.R., A.-M.L.R. and J.F.; supervision, C.L. (Christian Legros); project administration, C.L. (Christian Legros). All authors have read and agreed to the published version of the manuscript.
Funding
This research received no external funding.
Institutional Review Board Statement
Not applicable.
Informed Consent Statement
Not applicable.
Data Availability Statement
Not applicable.
Acknowledgments
We are grateful to Françoise Macari (IGF, Montpellier, France) for the GH3b6 cell line. We are also grateful to Linda Grimaud and Louis Gourdin for their technical assistance.
Conflicts of Interest
The authors declare no conflict of interest. The funders had no role in the design of the study; in the collection, analyses, or interpretation of data; in the writing of the manuscript; or in the decision to publish the results.
Abbreviations
The following abbreviations are used in this manuscript:
| AUC | area under curve |
| BBIQ | bisbenzylisoquinoline |
| CaV channels | voltage-gated Ca2+ channels |
| IA | Isoquinoline Alkaloid |
| Cav channel | voltage-gated Ca2+ channel |
| [Ca2+]i | intracellular Ca2+ concentration |
| gapdh | glyceraldehyde-3-phosphate dehydrogenase |
| gusb | beta-glucuronidase; |
| LTCC | L-type voltage-gated Ca2+ channel |
References
- Zamponi, G.W.; Striessnig, J.; Koschak, A.; Dolphin, A.C. The Physiology, Pathology, and Pharmacology of Voltage-Gated Calcium Channels and Their Future Therapeutic Potential. Pharmacol. Rev. 2015, 67, 821–870. [Google Scholar] [CrossRef] [PubMed]
- Catterall, W.A.; Lenaeus, M.J.; Gamal El-Din, T.M. Structure and Pharmacology of Voltage-Gated Sodium and Calcium Channels. Annu. Rev. Pharmacol. Toxicol. 2020, 60, 133–154. [Google Scholar] [CrossRef] [PubMed]
- Catterall, W.A.; Perez-Reyes, E.; Snutch, T.P.; Striessnig, J. International Union of Pharmacology. XLVIII. Nomenclature and Structure-Function Relationships of Voltage-Gated Calcium Channels. Pharmacol. Rev. 2005, 57, 411–425. [Google Scholar] [CrossRef] [PubMed]
- Lacinová, L.; Lichvárová, L. Pharmacology of Voltage-Gated Calcium Channels in Clinic. In Pathologies of Calcium Channels; Weiss, N., Koschak, A., Eds.; Springer: Berlin/Heidelberg, Germany, 2014; pp. 297–314. ISBN 978-3-642-40281-4. [Google Scholar]
- Barrett, P.Q.; Guagliardo, N.A.; Klein, P.M.; Hu, C.; Breault, D.T.; Beenhakker, M.P. Role of Voltage-Gated Calcium Channels in the Regulation of Aldosterone Production from Zona Glomerulosa Cells of the Adrenal Cortex: Voltage-Gated Channels in the Regulation of Aldosterone. J. Physiol. 2016, 594, 5851–5860. [Google Scholar] [CrossRef]
- Xue, Z.; Li, Y.; Zhou, M.; Liu, Z.; Fan, G.; Wang, X.; Zhu, Y.; Yang, J. Traditional Herbal Medicine Discovery for the Treatment and Prevention of Pulmonary Arterial Hypertension. Front. Pharmacol. 2021, 12, 720873. [Google Scholar] [CrossRef]
- Qian, J.-Q. Cardiovascular Pharmacological Effects of Bisbenzylisoquinoline Alkaloid Derivatives. Acta Pharmacol. Sin. 2002, 23, 1086–1092. [Google Scholar]
- Shang, X.; Yang, C.; Morris-Natschke, S.L.; Li, J.; Yin, X.; Liu, Y.; Guo, X.; Peng, J.; Goto, M.; Zhang, J.; et al. Biologically Active Isoquinoline Alkaloids Covering 2014–2018. Med. Res. Rev. 2020, 40, 2212–2289. [Google Scholar] [CrossRef]
- Huang, Y.-L.; Cui, S.-Y.; Cui, X.-Y.; Cao, Q.; Ding, H.; Song, J.-Z.; Hu, X.; Ye, H.; Yu, B.; Sheng, Z.-F.; et al. Tetrandrine, an Alkaloid from S. Tetrandra Exhibits Anti-Hypertensive and Sleep-Enhancing Effects in SHR via Different Mechanisms. Phytomedicine 2016, 23, 1821–1829. [Google Scholar] [CrossRef]
- Wang, X.; Yang, Y.; Yang, D.; Tong, G.; Lv, S.; Lin, X.; Chen, C.; Dong, W. Tetrandrine Prevents Monocrotaline-Induced Pulmonary Arterial Hypertension in Rats through Regulation of the Protein Expression of Inducible Nitric Oxide Synthase and Cyclic Guanosine Monophosphate-Dependent Protein Kinase Type 1. J. Vasc. Surg. 2016, 64, 1468–1477. [Google Scholar] [CrossRef]
- Bhagya, N.; Chandrashekar, K.R. Tetrandrine—A Molecule of Wide Bioactivity. Phytochemistry 2016, 125, 5–13. [Google Scholar] [CrossRef]
- Felix, J.P.; King, V.F.; Shevell, J.L.; Garcia, M.L.; Kaczorowski, G.J.; Bick, I.R.C.; Slaughter, R.S. Bis(Benzylisoquinoline) Analogs of Tetrandrine Block L-Type Calcium Channels: Evidence for Interaction at the Diltiazem-Binding Site. Biochemistry 1992, 31, 11793–11800. [Google Scholar] [CrossRef]
- Low, A.M.; Berdik, M.; Sormaz, L.; Gataiance, S.; Buchanan, M.R.; Kwan, C.Y.; Daniel, E.E. Plant Alkaloids, Tetrandrine and Hernandezine, Inhibit Calcium-Depletion Stimulated Calcium Entry in Human and Bovine Endothelial Cells. Life Sci. 1996, 58, 2327–2335. [Google Scholar] [CrossRef]
- Medeiros, M.A.A.; Pinho, J.F.; De-Lira, D.P.; Barbosa-Filho, J.M.; Araújo, D.A.M.; Cortes, S.F.; Lemos, V.S.; Cruz, J.S. Curine, a Bisbenzylisoquinoline Alkaloid, Blocks L-Type Ca2+ Channels and Decreases Intracellular Ca2+ Transients in A7r5 Cells. Eur. J. Pharmacol. 2011, 669, 100–107. [Google Scholar] [CrossRef]
- Dias, C.S.; Barbosa-Filho, J.M.; Lemos, V.S.; Côrtes, S.F. Mechanisms Involved in the Vasodilator Effect of Curine in Rat Resistance Arteries. Planta Med. 2002, 68, 1049–1051. [Google Scholar] [CrossRef]
- Chang, G.-J.; Wu, M.-H.; Wu, Y.-C.; Su, M.-J. Electrophysiological Mechanisms for Antiarrhythmic Efficacy and Positive Inotropy of Liriodenine, a Natural Aporphine Alkaloid from Fissistigma Glaucescens. Br. J. Pharmacol. 1996, 118, 1571–1583. [Google Scholar] [CrossRef]
- Xu, S.Z.; Zhang, Y.; Ren, J.Y.; Zhou, Z.N. Effects of Berberine of L- and T-Type Calcium Channels in Guinea Pig Ventricular Myocytes. Zhongguo Yao Li Xue Bao 1997, 18, 515–518. [Google Scholar]
- Wen, N.; Xue, L.; Yang, Y.; Shi, S.; Liu, Q.-H.; Cai, C.; Shen, J. Coptisine, a Protoberberine Alkaloid, Relaxes Mouse Airway Smooth Muscle via Blockade of VDLCCs and NSCCs. Biosci. Rep. 2020, 40, BSR20190534. [Google Scholar] [CrossRef]
- Glassmeier, G.; Hauber, M.; Wulfsen, I.; Weinsberg, F.; Bauer, C.K.; Schwarz, J.R. Ca2+ Channels in Clonal Rat Anterior Pituitary Cells (GH3/B6). Pflug. Arch. 2001, 442, 577–587. [Google Scholar]
- Réthoré, L.; Park, J.; Montnach, J.; Nicolas, S.; Khoury, J.; Le Seac’h, E.; Mabrouk, K.; De Pomyers, H.; Tricoire-Leignel, H.; Mattei, C.; et al. Pharmacological Dissection of the Crosstalk between NaV and CaV Channels in GH3b6 Cells. Int. J. Mol. Sci. 2022, 23, 827. [Google Scholar] [CrossRef]
- Zhu, Z.; Cui, W.; Zhu, D.; Gao, N.; Zhu, Y. Common Tools for Pituitary Adenomas Research: Cell Lines and Primary Cells. Pituitary 2020, 23, 182–188. [Google Scholar] [CrossRef]
- Patra, A.; Freyer, A.J.; Guinaudeau, H.; Shamma, M.; Tantisewie, B.; Pharadai, K. The Bisbenzylisoquinoline Alkaloids of Stephania Suberosa. J. Nat. Prod. 1986, 49, 424–427. [Google Scholar] [CrossRef]
- Guinaudeau, H.; Freyer, A.J.; Shamma, M.; Hüsnü Can Başer, K. Enzymic Control of Stereochemistry among the Bisbenzylisoquinoline Alkaloids. Tetrahedron 1984, 40, 1975–1982. [Google Scholar] [CrossRef]
- Angerhofer, C.K.; Guinaudeau, H.; Wongpanich, V.; Pezzuto, J.M.; Cordell, G.A. Antiplasmodial and Cytotoxic Activity of Natural Bisbenzylisoquinoline Alkaloids. J. Nat. Prod. 1999, 62, 59–66. [Google Scholar] [CrossRef]
- Hussain, S.F.; Freyer, A.J.; Guinaudeau, H.; Shamma, M. Five New Bisbenzylisoquinoline Alkaloids from Thalictrum Cultratum. J. Nat. Prod. 1986, 49, 488–493. [Google Scholar] [CrossRef]
- Lavault, M.; Fournet, A.; Guinaudeau, H.; Bruneton, J. Bisbenzylisoquinoline N-Oxides from Curarea Candicans. J. Chem. Res. 1985, 8, 248–249. [Google Scholar]
- Tantisewie, B.; Pharadai, T.; Pandhuganont, M.; Guinaudeau, H.; Freyer, A.J.; Shamma, M. (+)-N-Formylnornantenine, a New Aporphine Alkaloid from Cyclea Atjehensis. J. Nat. Prod. 1989, 52, 652–654. [Google Scholar] [CrossRef]
- Allais, D.P.; Guinaudeau, H. Composition Alcaloëdique de Corydalis Claviculata. J. Nat. Prod. 1990, 53, 1280–1286. [Google Scholar] [CrossRef]
- Pharadai, K.; Pharadai, T.; Tantisewie, B.; Guinaudeau, H.; Freyer, A.J.; Shamma, M. (−)-O-Acetylsukhodianine and Oxostephanosine: Two New Aporphinoids from Stephania Venosa. J. Nat. Prod. 1985, 48, 658–659. [Google Scholar] [CrossRef]
- Herath, W.H.M.W.; Zarga, M.H.A.; Sabri, S.S.; Guinaudeau, H.; Shamma, M. Some C-Secocularines from Ceratocapnos Palaestinus. J. Nat. Prod. 1990, 53, 1006–1008. [Google Scholar] [CrossRef]
- Allais, D.P.; Goezler, T.; Guinaudeau, H. Alkaloids of Corydalis Majoris Poelln. (Corydalis Integra Barbey and Major) (Fumariaceae) [Isoquinolic Alkaloids]. Plantes Med. Phytother. 1988, 22, 219–224. [Google Scholar]
- Backman, T.W.H.; Cao, Y.; Girke, T. ChemMine Tools: An Online Service for Analyzing and Clustering Small Molecules. Nucleic Acids Res. 2011, 39, W486–W491. [Google Scholar] [CrossRef] [PubMed]
- Vela, J.; Pérez-Millán, M.I.; Becu-Villalobos, D.; Díaz-Torga, G. Different Kinases Regulate Activation of Voltage-Dependent Calcium Channels by Depolarization in GH3 Cells. Am. J. Physiol. Cell Physiol. 2007, 293, C951–C959. [Google Scholar] [CrossRef] [PubMed]
- Vetter, I. Development and Optimization of FLIPR High Throughput Calcium Assays for Ion Channels and GPCRs. In Calcium Signaling; Islam, M.D.S., Ed.; Advances in Experimental Medicine and Biology; Springer: Dordrecht, The Netherlands, 2012; Volume 740, pp. 45–82. ISBN 978-94-007-2887-5. [Google Scholar]
- Bassett, J.J.; Monteith, G.R. Genetically Encoded Calcium Indicators as Probes to Assess the Role of Calcium Channels in Disease and for High-Throughput Drug Discovery. In Advances in Pharmacology; Elsevier: Amsterdam, The Netherlands, 2017; Volume 79, pp. 141–171. ISBN 978-0-12-810413-2. [Google Scholar]
- Impheng, H.; Lemmers, C.; Bouasse, M.; Legros, C.; Pakaprot, N.; Guérineau, N.C.; Lory, P.; Monteil, A. The Sodium Leak Channel NALCN Regulates Cell Excitability of Pituitary Endocrine Cells. FASEB J. 2021, 35, e21400. [Google Scholar] [CrossRef] [PubMed]
- Simasko, S.M. A Background Sodium Conductance Is Necessary for Spontaneous Depolarizations in Rat Pituitary Cell Line GH3. Am. J. Physiol. Cell Physiol. 1994, 266, C709–C719. [Google Scholar] [CrossRef] [PubMed]
- Sankaranarayanan, S.; Simasko, S.M. A Role for a Background Sodium Current in Spontaneous Action Potentials and Secretion from Rat Lactotrophs. Am. J. Physiol. Cell Physiol. 1996, 271, C1927–C1934. [Google Scholar] [CrossRef]
- Desgrouas, C.; Taudon, N.; Bun, S.-S.; Baghdikian, B.; Bory, S.; Parzy, D.; Ollivier, E. Ethnobotany, Phytochemistry and Pharmacology of Stephania Rotunda Lour. J. Ethnopharmacol. 2014, 154, 537–563. [Google Scholar] [CrossRef]
- Wirasathien, L.; Boonarkart, C.; Pengsuparp, T.; Suttisri, R. Biological Activities of Alkaloids from Pseuduvaria Setosa. Pharm. Biol. 2006, 44, 274–278. [Google Scholar] [CrossRef]
- Ferdous, A.J.; Islam, M.O.; Hasan, C.M.; Islam, S.N. In Vitro Antimicrobial Activity of Lanuginosine and Oxostephanine. Fitoterapia-Milano 1992, 63, 549. [Google Scholar]
- Makarasen, A.; Sirithana, W.; Mogkhuntod, S.; Khunnawutmanotham, N.; Chimnoi, N.; Techasakul, S. Cytotoxic and Antimicrobial Activities of Aporphine Alkaloids Isolated from Stephania venosa (Blume) Spreng. Planta Med. 2011, 77, 1519–1524. [Google Scholar] [CrossRef]
- Montanha, J.A.; Amoros, M.; Boustie, J.; Girre, L. Anti-Herpes Virus Activity of Aporphine Alkaloids. Planta Med. 1995, 61, 419–424. [Google Scholar] [CrossRef]
- Still, P.C.; Yi, B.; González-Cestari, T.F.; Pan, L.; Pavlovicz, R.E.; Chai, H.-B.; Ninh, T.N.; Li, C.; Soejarto, D.D.; McKay, D.B.; et al. Alkaloids from Microcos Paniculata with Cytotoxic and Nicotinic Receptor Antagonistic Activities. J. Nat. Prod. 2013, 76, 243–249. [Google Scholar] [CrossRef] [PubMed]
- Coquerel, Q.R.R.; Démares, F.; Geldenhuys, W.J.; Le Ray, A.-M.; Bréard, D.; Richomme, P.; Legros, C.; Norris, E.; Bloomquist, J.R. Toxicity and Mode of Action of the Aporphine Plant Alkaloid Liriodenine on the Insect GABA Receptor. Toxicon 2021, 201, 141–147. [Google Scholar] [CrossRef] [PubMed]
- Goren, A.C.; Zhou, B.N.; Kingston, D.G. Cytotoxic and DNA Damaging Activity of Some Aporphine Alkaloids from Stephania Dinklagei. Planta Med. 2003, 69, 867–868. [Google Scholar] [CrossRef]
- Thuy, T.T.; Quan, T.D.; Anh, N.T.; Sung, T.V. Cytotoxic and Antimicrobial Aporphine Alkaloids from Fissistigma Poilanei (Annonaceae) Collected in Vietnam. Nat. Prod. Res. 2012, 26, 1296–1302. [Google Scholar] [CrossRef]
- Mohamed, S.M.; Hassan, E.M.; Ibrahim, N.A. Cytotoxic and Antiviral Activities of Aporphine Alkaloids of Magnolia grandiflora L. Nat. Prod. Res. 2010, 24, 1395–1402. [Google Scholar] [CrossRef] [PubMed]
- Hu, J.; Shi, X.; Chen, J.; Mao, X.; Zhu, L.; Yu, L.; Shi, J. Alkaloids from Toddalia Asiatica and Their Cytotoxic, Antimicrobial and Antifungal Activities. Food Chem. 2014, 148, 437–444. [Google Scholar] [CrossRef]
- King, V.F.; Garcia, M.L.; Himmel, D.; Reuben, J.P.; Lam, Y.K.; Pan, J.X.; Han, G.Q.; Kaczorowski, G.J. Interaction of Tetrandrine with Slowly Inactivating Calcium Channels. Characterization of Calcium Channel Modulation by an Alkaloid of Chinese Medicinal Herb Origin. J. Biol. Chem. 1988, 263, 2238–2244. [Google Scholar] [CrossRef]
- Wiegand, H.; Meis, S.; Gotzsch, U. Inhibition by Tetrandrine of Calcium Currents at Mouse Motor Nerve Endings. Brain Res. 1990, 524, 112–118. [Google Scholar] [CrossRef]
- Pennefather, P.; Quastel, D.M. Modification of Dose-Response Curves by Effector Blockade and Uncompetitive Antagonism. Mol. Pharmacol. 1982, 22, 369–380. [Google Scholar]
- Lambert, D. Drugs and Receptors. Contin. Educ. Anaesth. Crit. Care Pain 2004, 4, 181–184. [Google Scholar] [CrossRef]
- Zahradníková, A.; Minarovic, I.; Zahradník, I. Competitive and Cooperative Effects of Bay K8644 on the L-Type Calcium Channel Current Inhibition by Calcium Channel Antagonists. J. Pharmacol. Exp. Ther. 2007, 322, 638–645. [Google Scholar] [CrossRef] [PubMed]


Publisher’s Note: MDPI stays neutral with regard to jurisdictional claims in published maps and institutional affiliations. |
© 2022 by the authors. Licensee MDPI, Basel, Switzerland. This article is an open access article distributed under the terms and conditions of the Creative Commons Attribution (CC BY) license (https://creativecommons.org/licenses/by/4.0/).