Article

Soybean Reproductive Traits Evaluated in Response to Temperature Stress and Elevated Oxygen; Three Peroxidase Transgenes Reduce Seed Abortion

1
Department of Biology, University of Florida, Gainesville, FL 32611, USA
2
Plant Molecular and Cellular Biology Program, University of Florida, Gainesville, FL 32611, USA
3
Agronomy Department, University of Florida, Gainesville, FL 32611, USA
4
Department of Biological and Agricultural Engineering, University of Florida, Gainesville, FL 32611, USA
5
USDA Agricultural Research Service, CMAVE, Gainesville, FL 32608, USA
*
Author to whom correspondence should be addressed.
Submission received: 19 January 2025 / Revised: 15 April 2025 / Accepted: 17 April 2025 / Published: 27 April 2025

Abstract

:
In a previous Arabidopsis investigation, three ovule-specific cell-wall peroxidases decreased seed abortion rates. These peroxidases were expressed in soybean plants. Because cell wall peroxidases alter extensibility, possible effects on seed size and plant yield were evaluated. Since the effects of these peroxidases in Arabidopsis were dependent on environmental stress, soybean plants were grown in controlled environment greenhouse rooms under four temperature treatments; the daily temperature averages were 26, 30, 34, and 38 °C. In this experiment in vivo oxygen levels during seed growth were 25-fold below ambient, which could affect peroxidase activities. Consequently, soybeans were grown at atmospheric (21%) and elevated (32%) O2 to evaluate peroxidase activities at higher O2. Chambers were maintained at 700 ppm CO2 in an attempt to minimize photorespiration in elevated O2. Individual seed weight decreased with increasing temperature to zero at 38 °C. In elevated O2 rooms, the oxygen concentration in developing seeds increased, but, due to leaf photorespiration, plant biomass and seed yield decreased. Seed size and shelling percentage declined equally with temperature at both O2 concentrations. Expression of all three cell-wall peroxidases reduced seed abortion; however, that did not increase yields at ambient or elevated O2. While O2 concentration is less than 1% in developing seeds, increased O2 levels in seeds were not beneficial for soybean reproduction.

1. Introduction

Soybean (Glycine max (L.) Merr.) is an economically important crop, serving as a primary source of vegetable oil and protein for both human consumption and animal feed. In many areas around the globe, its cultivation provides food security. Soybean yields frequently are affected by various environmental and physiological constraints. Temperature effects on soybean plants and seed yield have been thoroughly researched in soil–plant–atmosphere research (SPAR) chambers [1,2,3,4,5], growth chambers [6], and field environments [7]. Elevated temperatures can lead to increased susceptibility of soybean to drought. Innovative research has been conducted to identify genetic improvements of soybean for drought tolerance as a cost-effective approach [8].
Pollination failures and inhibitions of reproductive growth occur at elevated temperatures [9]. In progressively lower partial pressure of oxygen (pO2) treatments of soybean, seed size and quality increasingly diminished [10]. Seed production and size are also limited by subambient pO2 in rice, Oryza sativa, wheat, Triticum aestivum, sorghum, Sorghum bicolor, Brassica sp., Vicia faba, Pisum sativum, and Arabidopsis thaliana [10,11,12]. It was postulated that substantial pO2 is necessary for photoassimilate transport into seeds and that limiting pO2 may lead to disturbed seed development or even seed abortion [12].
Growth and photoassimilate partitioning in developing seeds are sensitive to pO2. For soybean, seed growth was lower at pO2 below 21 kPa, highly reduced at 10 kPa, and reached zero between 2.5 and 5 kPa. Similar results were observed for Arabidopsis thaliana [12]. Thorne [13] proposed that the low-pO2 effect was related to the O2 requirement to sustain assimilate transfer from the phloem in the seed coat to the embryo of soybean seed. He demonstrated that 14C assimilate transfer was blocked when intact pods and seeds were exposed to low pO2 but that assimilate uptake by isolated embryos, lacking a testa, was less sensitive to low pO2. Sinclair et al. [14] confirmed that subambient pO2 of 10 kPa limited growth of soybean seed and found that, under some environmental conditions, seed growth was stimulated by increasing pO2 to 42 kPa around pods only using pod chambers without enriching the whole plant with O2. Sinclair [15] showed that respiration of soybean seed coat tissue was limited by low pO2. This effect was temperature-dependent. He suggested that O2 diffusion through the seed coat was primarily restricted to liquid phase diffusion in the region of the vascular bundles where there were few, if any, air spaces. This is relevant since, at 20 °C, the rate of diffusion of O2 in water is about 0.0001 of that in the gaseous phase [16].
Porterfield et al. [11] reported low pO2 inside reproductive structures of Arabidopsis thaliana during early development. Below 15 kPa pO2, they found seed production decreased linearly until 2.5 kPa pO2, where no seeds developed. For Vicia faba and Pisum sativum, Rolletschek et al. [12] reported a sharp drop of pO2 to 0.6 kPa inside the seed coat. While there was no [O2] gradient within the embryo, young embryos had the lowest pO2, ATP concentration, and adenylate energy charge. Similarly, in developing seeds of oilseed rape (Brassica napus), Vigeolas et al. [17] showed that energy status (ATP/ADP and UTP/UDP ratios) increased with increasing pO2. Also, the activities of sucrose synthase and invertase rose with pO2, leading to higher sucrose and glucose levels. Rolletschek et al. [18] and Borisjuk et al. [19] showed that O2 starvation inside developing soybean seeds halted ATP generation, affecting energy status and metabolite pools. Rolletschek et al. [18] developed an [O2] map inside soybean seed at different developmental stages and showed that [O2] changed with development as indicated by seed size.
In many plant organs, environmental stress induces the formation of reactive oxygen species (ROS) [20,21]. ROS are highly reactive molecules that can cause extensive oxidative damage if they are not neutralized by ROS scavenger proteins [20]. ROS molecules damage lipids, proteins, and nucleic acids [21]. Increased production of free-radical scavengers and antioxidants helps prevent oxidative damage to organelles and enzymes [22]. Enzymes such as superoxide dismutases, ascorbate peroxidases, glutathione peroxidases, glutathione reductases, peroxiredoxins, and catalases either directly or indirectly neutralize ROS molecules [22].
In addition, ROS are signaling molecules that trigger genetic programs [23], which alter gene activity, attenuate growth, initiate programmed cell death, or promote plant defense responses. For example, peroxidases are associated with increased H2O2 generation in the apoplast, which preceded calcium release and the hypersensitive response [24,25].
While the soybean seed coat acts as a barrier to diffusion of O2 into the developing seed, photosynthesis within these seeds serves as a limited source of O2 for plant metabolism [17,26,27]. In pea (Pisum sativum) seeds, a hypoxic environment exists, however, fermentation did not occur [28]. This finding indicates that respiration rates are closely regulated to prevent the accumulation of harmful metabolites. It was hypothesized that nitric oxide (NO) regulates mitochondrial activity to control the rates of respiration and photosynthesis to balance O2 levels in seeds, minimizing harmful ROS metabolites from accumulating and allowing seed filling [19,28,29,30].
Three peroxidases identified when ovule abortion is induced in Arabidopsis [31] were ectopically expressed in stressed soybean. These three apoplastic peroxidases (PERs) were specifically expressed in Arabidopsis ovules. In Arabidopsis, PER gene expression in ovules decreased following osmotic stress, causing high rates of seed abortion [31]. Apoplastic PERs can regulate cell expansibility, so seed growth, pod growth, and seed abortion were evaluated in soybean with these transgenes.
Hypothesis 1. 
In Arabidopsis, three ascorbate peroxidases reduce seed abortion. If these genes have similar functions in soybean, ovule abortion will decrease.
Hypothesis 2. 
Supplemental oxygen in the atmosphere around soybean plants should increase O2 concentration in developing soybean seeds. This should increase yields and reduce ovule abortion.
In most developing seeds, low oxygen levels disrupt metabolic processes, which impacts seed quality, germination rates, and seed yields. Understanding the factors that regulate oxygen availability within soybean seeds is crucial for developing strategies to improve seed quality and enhance soybean productivity, thereby ensuring profitability for this vital commodity. This research aims to investigate the mechanisms underlying low seed oxygen levels in soybean and their impact on seed development, with the goal of identifying potential targets for genetic improvement and agronomic management.

2. Materials and Methods

2.1. Soybean Plant Materials

Wild-type soybean, cultivar Maverick, and three types of transgenic Maverick soybean plants were grown in pots in eight controlled environment rooms of a polycarbonate-clad greenhouse in Gainesville, Florida, USA, as described by [32,33]. The Maverick cultivar is a high-performing, Maturity Group III soybean that is resistant to root knot nematodes and phytophthora root rot [34]. Pots (23 cm, 9.5 L) had holes in the bottom for drainage or subirrigation. In preparation of the potting medium, 12 L of perlite and 18 tablespoons of Osmocote (19-6-12; N-P2O5-K2O) were mixed with 80 L of Metro-Mix Sunshine® MVP potting soil (Sun Gro Horticulture, Agawam, MA, USA). The Metro-Mix ingredients were vermiculite, Canadian sphagnum peat moss, coarse perlite, and dolomitic limestone. Seeds were sown on 10 August 2012 (day of year, DOY 223) and germinated at 30 °C daytime/22 °C nighttime in each of the eight greenhouse rooms. Ten days after sowing (DAS), at late vegetative growth stage VC to early stage V1, temperature treatments began: 30/22, 34/26, 38/30, and 42/34 °C (day/night temperatures with transitions at 9:00 a.m./9:00 p.m. Eastern Daylight Time). The relative humidity was near 58% in the daytime and 70% at night. One room at each of the four temperatures was maintained at elevated O2 (32%) from tanks of liquified O2 with an injection system, and one room at each of the four temperatures was maintained at ambient O2 (21%). Carbon dioxide concentration was set to 700 ppm and maintained with an injection and feedback control system [33]. Pots were placed in trays and initially irrigated from the top. After seedlings emerged, pots were subirrigated by adding sufficient water every 2 to 3 days to ensure adequate soil moisture without flooding the pots.
O2 levels were measured in vivo in seeds to determine if increasing the [O2] in the ambient environment affected the [O2] in this developing organ. A fiber-optic microsensor, described by Chaturvedi et al. [35,36,37], was used to monitor [O2] in seeds. Fiber-optic sensors were inserted through the pod wall and into the center of a developing seed. Sensors were calibrated before and after experiments to check for calibration drift. The sensors were temperature corrected, based on the ambient temperature of the growth room.
Soybean plants were harvested when at least 60% of pods reached the R8 stage [37] between 19 November 2012 (DOY 324) and 18 December 2012 (DOY 353), depending on treatment. Temperature treatment 30/22 °C was harvested at 101 DAS, treatment 42/34 °C was harvested early at 102 DAS because no pods were set, treatment 34/26 °C was harvested at 103 DAS, and treatment 38/30 °C was harvested at 130 DAS. The harvest date for the 38/30 °C treatment was delayed because pod addition was prolonged and seed pods filled and matured slowly at this temperature (as observed by Thomas et al. [9]). Data were collected on vegetative and reproductive parts of five plants per treatment. Dry weights of vegetative components were determined after drying at 65 °C for 3 days. Pod number per plant was determined and then pods were air-dried. Then pod weights per plant and seed numbers and weights per plant were determined. Individual seed weights were calculated. The seed harvest index and pod harvest index were calculated as the ratio of seed weight or pod weight to the total aboveground dry weight. Shelling percentage was calculated by total seed weight per total pod weight ×100. Seed abortion rate was measured by counting vacant locules from all pods having at least one seed at final harvest (seed abortion rate = vacant locules/total locules of seed-producing pods). Pods without seeds were not included in this count.
The experimental design was an unreplicated factorial (growth rooms not replicated), but there were usually 5 replicate plants per genotype (sometimes 4) with four levels of air temperature, two levels of atmospheric [O2], and four plant genetic types consisting of Maverick (wild-type) and three genetically modified versions of Maverick designated as PER17-OE (T501), PER28-OE (T502), and PER29-OE (T503). Reproductive growth stages were recorded throughout the experiment.

2.2. Transgenic Constructs

The coding sequences for three Arabidopsis ascorbate peroxidases were previously cloned [38]. The pEW401ML plasmid contains the PER17 coding sequence and an upstream in-frame myc tag (MEQKLISEEDL). The pEW402ML and pEW403ML plasmids contain PER28 and PER29, respectively, each with an myc tag. The STK promoter drives expression of the myc-PER genes. This promoter drives gene expression predominantly in reproductive tissues. In addition, a transgenic line containing a blank vector and an myc tag was created as a control. For soybean transformation, myc-PER fragments were excised from the vectors described by Wang et al. [38] using SmaI and PstI to clone PER17 and PER28 genes. For PER29, NotI and SmaI restriction enzymes were used. These DNA fragments were inserted into the pZY101 vector using the compatible restriction sites. The resulting plasmid vectors were transformed into plants as described in Zeng et al. [39] by the Plant Transformation Core Facility, Univ. of Missouri. The transgenic constructs contained an myc-tag at the N-terminal end of encoded protein. To demonstrate that each transgene was expressed in plants, using an anti-myc antibody, it was verified that the myc tag was present in protein extracts (Figure S1).

2.3. Statistical Analyses

A possible analysis of experiments is to use regression analysis if a suitable continuous, discrete independent variable exists. In the case of the 4 temperature × 2 oxygen × 4 plant type factorial, regressions of responses versus temperature are valid. Temperature at four levels is a CONTINUOUS variable. However, since O2 had only two levels it was treated as a CLASS variable. Furthermore, the plant genotypes were treated as a CLASS variable. An analysis of covariance (ANCOVA) was used to analyze the data.
Several combinations of independent variables and cross-products were tested by ANCOVA. The combination that included all relevant variables and cross-products was:
Y = A1 × O2TR + A2 × TTR + A3 × TTR × TTR + A4 × O2TR × TTR + A5 × O2TR × TTR × TTR + A6 × PLANT
where O2TR = oxygen treatment, TTR = temperature treatment, and PLANT = plant genotype. This model, a de facto form of moderated regression with temperature and [O2] interaction terms was executed via SAS PROC GLM ANCOVA. Yang and Juskiw [40] presented convincing arguments for the use of ANCOVA in agronomic and crop research because it combines analysis of variance with regression analysis. ANCOVA can be run in SAS PROC MIXED as well as SAS PROC GLM [40]. However, the SAS/STAT® 9.3 User’s Guide (SAS Institute Inc., Cary, NC, USA, 2011) lists the ANCOVA procedure only in PROC GLM. Therefore, this was the SAS procedure that was used. For a few cases where ANCOVA was run in PROC MIXED, estimates of the intercept and the regression coefficients, as well as values in the parameter column, Pr > |t|, were essentially identical to ANCOVA in PROC GLM. However, output values from ANCOVA in PROC MIXED had fewer significant digits. Furthermore, our use of PROC GLM should be satisfactory since temperature, [O2], and plant type were fixed-effect independent variables and not random variables. As restated by Yang and Juskiw [40], the focus of ANCOVA in PROC GLM is to model the mean of dependent variables in terms of fixed-effect parameters. Also, ANCOVA in PROC GLM provides both R2 values and means in the output, whereas PROC MIXED does not. Leppink [41] promoted moderated regression, which is essentially ANCOVA with interaction terms according to Kim [42]. Details regarding the plant transformants are provided in the Results section, rather than in this section, to provide information where needed in the text. Datasets of the actual measurements made on the soybean responses to treatments are provided in the Zenodo data repository (doi.org/10.5281/zenodo.15188046). SAS analysis of covariance programs with essential outputs are provided in the SAS data file. Methodologies for and data used to produce figures from ANCOVA regression coefficients are provided in the figures data file.

3. Results and Discussion

3.1. Soybean Growth and Seed Oxygen Concentration
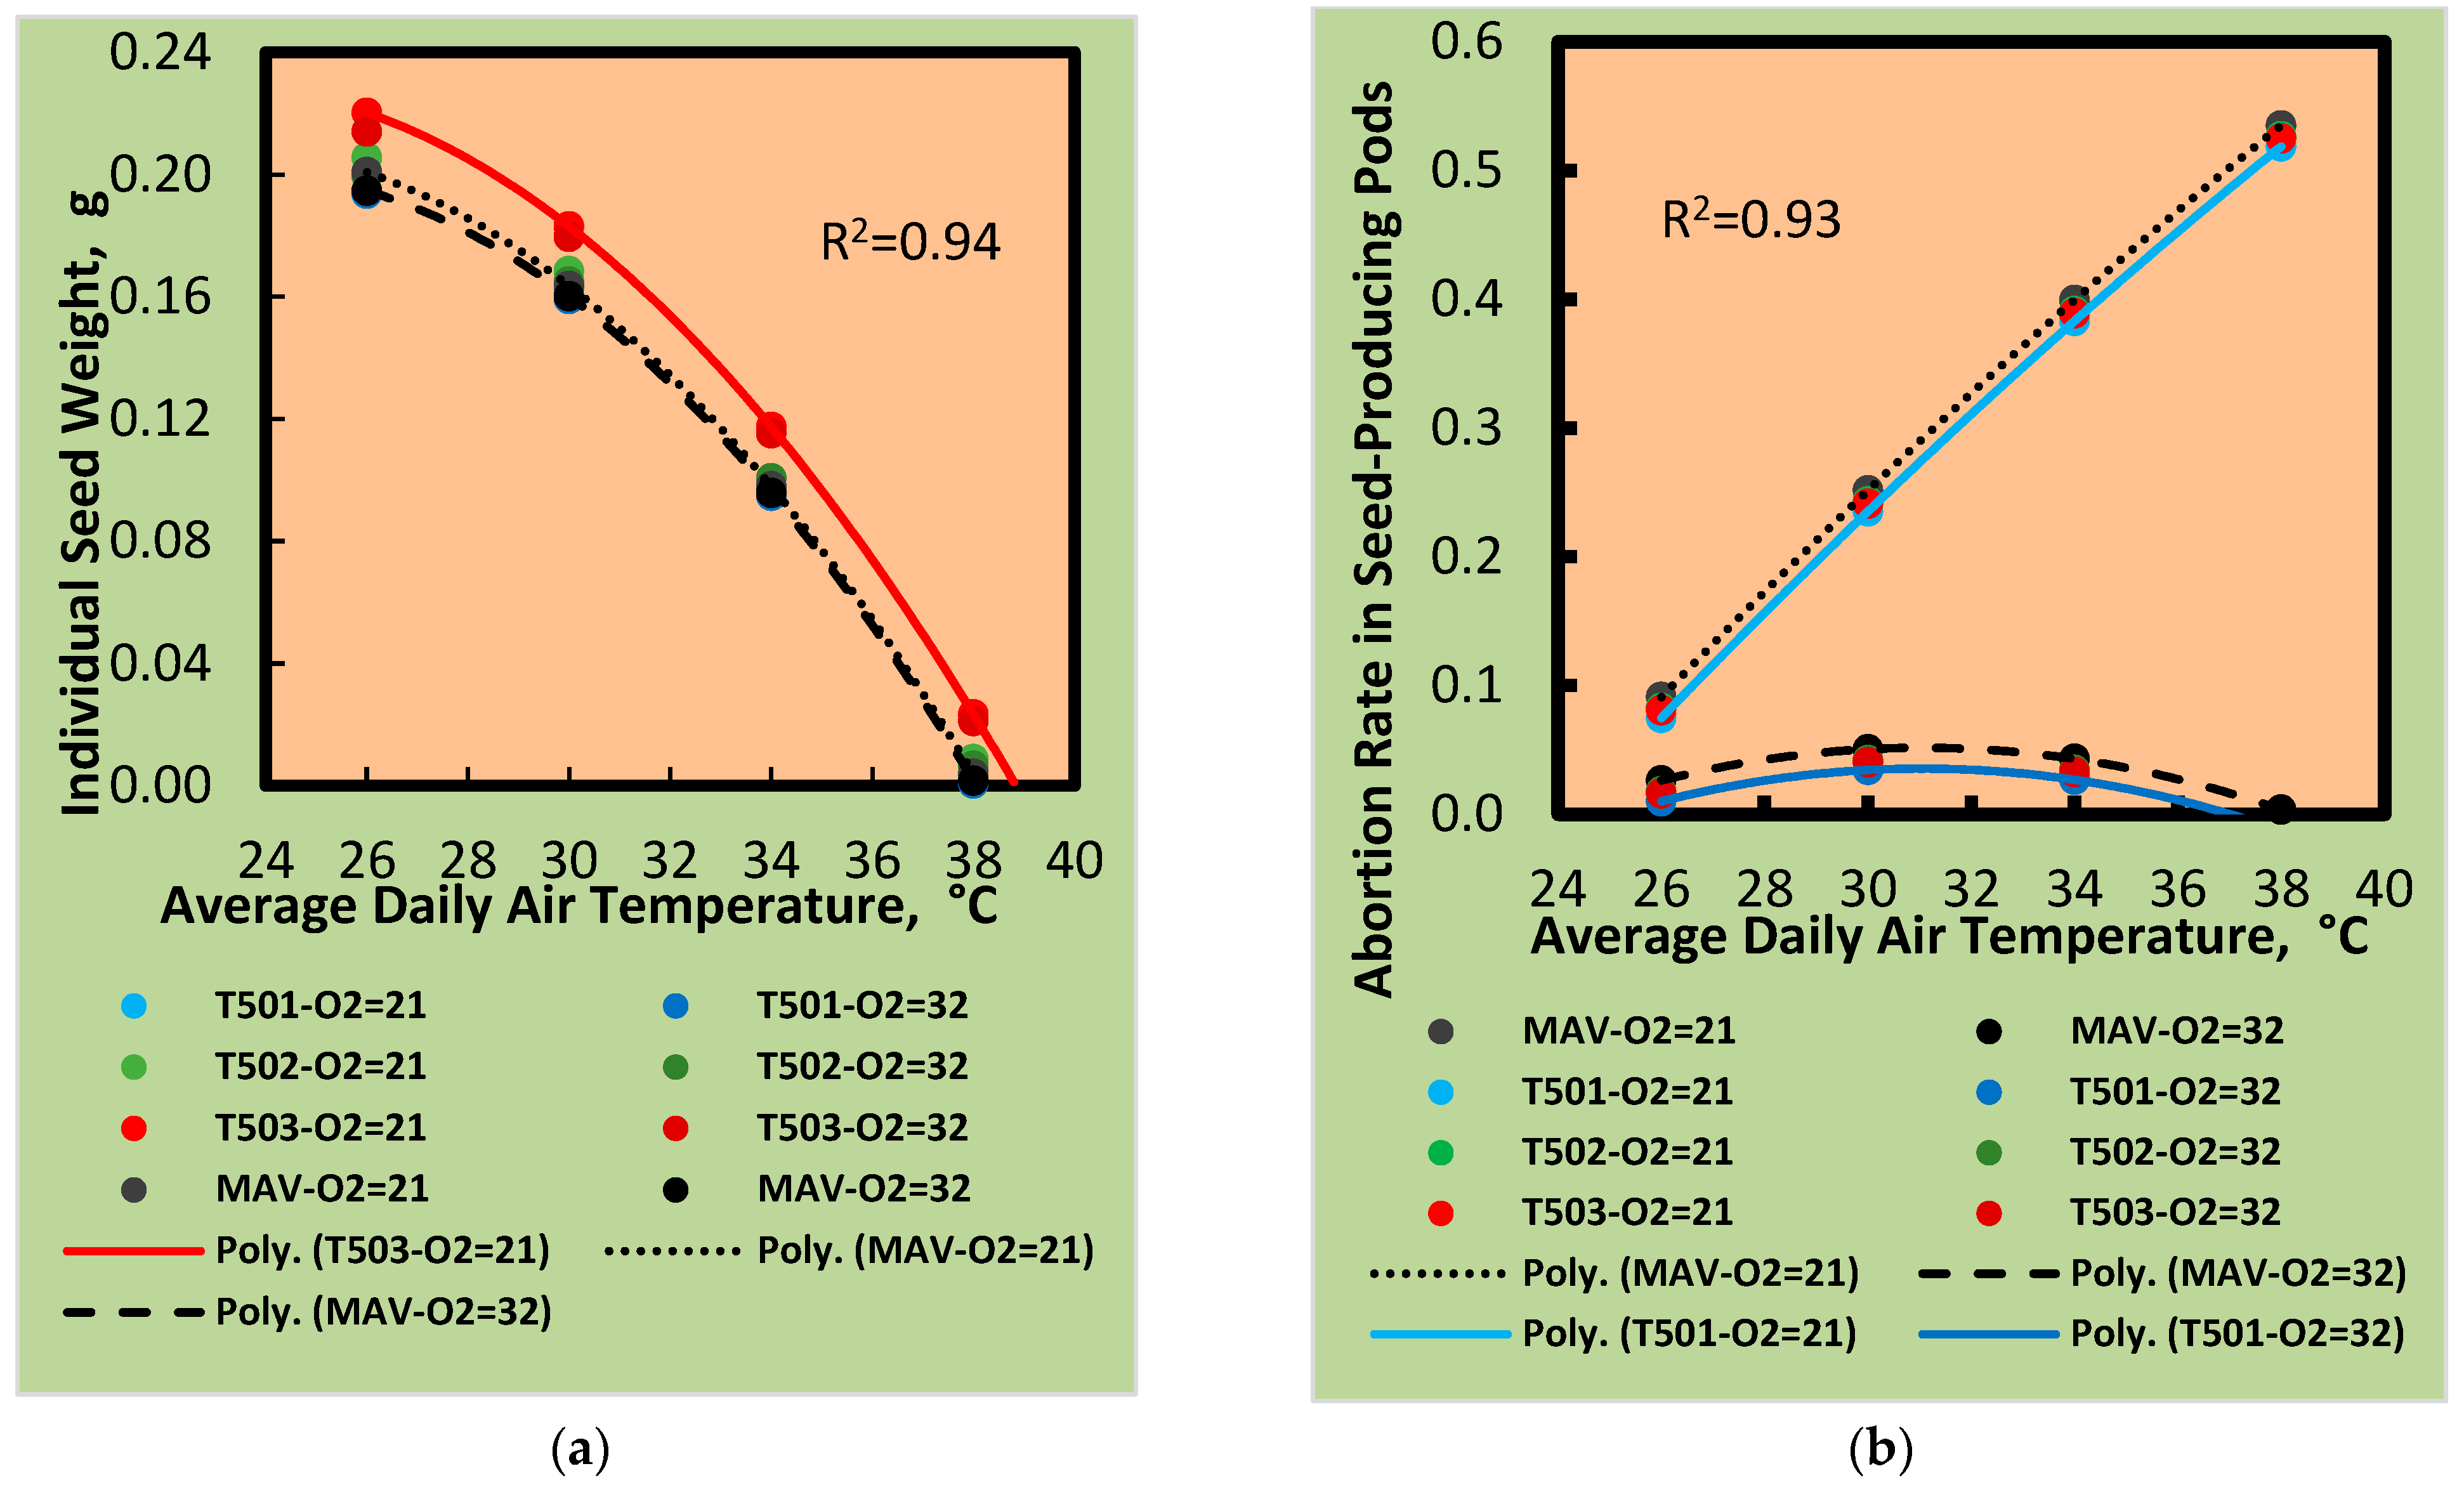
Soybean plants were grown in sunlit growth rooms where O2 levels were elevated to determine if this improved reproductive characteristics. Four growth temperatures were used to determine how temperature stress exacerbated O2 effects. The level of CO2 was elevated to 700 ppm to minimize photorespiration, which increases at high O2 levels. Table 1 shows average values for June 2011. When the time that researchers were in rooms was minimized, all parameters were well-controlled; notably the standard deviation for CO2 concentration fell to ±4.4 ppm, indicating the breathing of researchers caused most of this variance.
Previous reports revealed that soybean seeds have low [O2] [21]. During the experiment, measurements of seed [O2] were made using fiber optic sensors [35,36,37]. An oxygen-sensitive luminescent dye was coated on the tip of the fiber optic, and phase-sensitive detection of dissolved oxygen was carried out (description of probe chemistry and characteristics [35,36]). Each probe was calibrated with ambient 21% O2 and 0% O2. These probes exhibited a linear response to oxygen concentration [36,37]. While there are previous reports of an O2 gradient in soybean seeds, the central region of seeds had a large volume where O2 levels showed little change [26]. For this reason, the central region of developing seeds was sampled. For each reading, there was minimal drift in the signal, indicating that O2 was not leaking into the sample from where the probe was inserted.
The [O2] was dependent on the developmental age of the seed (Figure 1). Younger seeds had higher [O2] than R6 stage seeds, likely indicating that the seed coat of more mature seeds was more resistant to O2 diffusion. Earlier, Chaturvedi et al. [36] showed that the [O2] inside a seed was about 1% during the day and about 1.6% at night, with an interesting spike of 2.3% after dawn. These results showed a dynamic range of O2 in soybean seeds that depends on seed developmental stage, light levels, physiology, and time of day. Possibly, greater [O2] inside the developing seed as temperature increased was due to increased diffusivity of O2 in water but more likely due to changes in seed coat permeability for O2.

3.2. Seed Abortion

Figure 2 and Table 2 show the seed abortion rate within seed-producing pods, i.e., the sum of vacant locules/the sum of all locules of all pods that had one seed or more. The abortion rate at the highest temperature is a prediction based on ANCOVA regression coefficients since no seeds were produced at 38 °C. The abortion rate increased with increasing temperature at 21% O2 but not at 32% O2. The average seed weight decreased as temperature increased (Figure 2a). Except for pod abortion rate (PODABORT in Table 2), each dependent variable was significantly different (widely different) based on a Tukey test (https://doi.org/10.5281/zenodo.15188046). However, this Tukey test is not strictly valid because this was an unreplicated experiment. Despite this, the large differences in the Tukey test means indicate that the high [O2] provided protection from ovule and seed abortion.
In Figure 2, Figure 3, Figure 4, Figure 5, Figure 6 and Figure 7, T501 represents transgenic PER17-OE (blue lines), T502 represents transgenic PER28-OE (green lines), and T503 represents transgenic PER29-OE (red lines). Figure 2, Figure 3, Figure 4, Figure 5, Figure 6 and Figure 7 describe whole-plant responses.

3.3. Plant Fertility in Response to Temperature and Oxygen

The responses found by ANCOVA to temperature, [O2], plant genetics, and interactions are summarized in Figure S1 and calculations of ANCOVA-predicted responses based on regression coefficients are presented in Figure S2. Except for one category (ABORT4SEED/POD), all ANCOVA outputs had overall model Pr > F values that were significant (all <0.0001). This Pr > F tests whether the model as a whole accounts for a significant proportion of the value of the dependent variable. Values of R2 in the figures measure how much variation in the value of the dependent variable is accounted for by the model (i.e., they indicate the “goodness of fit” of the ANCOVA model). Regardless of significance level of the regression coefficients, all coefficients must be used for best-fit prediction of a given soybean response to these treatments and interactions.
Plant responses to temperature and [O2] treatments at final harvest are shown in Figure 3, Figure 4, Figure 5, Figure 6 and Figure 7. The regression coefficients for calculating responses to the four temperature and two [O2] treatments for each plant type are shown in the figures. Figure 3, Figure 4, Figure 5, Figure 6 and Figure 7 include 2nd-degree polynomial trendline fits to ANCOVA predictions across temperatures for both [O2] treatments. The figures show trendline responses to temperature for the cultivar Maverick compared with trendlines of the plant genetic type with the greatest and the least response at both [O2] levels.
Figure 3. Total dry weight and seed weight per plant are plotted: (a) Dry weight per plant of seeds, pod walls, and stems at final harvest vs. average daily air temperature at 21% O2 (upper set) and 32% O2 (lower set) showing 2nd-degree polynomial fits to points derived from ANCOVA regression coefficients. Black lines represent cv. Maverick. Each lower green line represents transgenic T502. The other two transgenic responses (T501 and T503) lie between the respective Maverick control lines and green lines; (b) Whole-plant seed weight vs. average daily air temperature at 21% O2 (upper set) and 32% O2 (lower set) of 2nd-degree polynomial curve fits to points derived from ANCOVA regression coefficients. Black lines represent cv. Maverick. Each lower green line represents transgenic T502. The other two transgenic responses lie between the black and green lines.
Oxygen 05 00005 g003
At final harvest, the total dry weight of stems and pods (pod walls + seeds) decreased with temperature at both [O2] levels with a somewhat different response curve at 32% O2 (Figure 3a). By the final harvest, most leaves had abscised (residual leaf mass was not included here). The R2 = 0.55 suggests that plant-to-plant variability contributed to a low R2 value although the average response of the actual dry weights followed the ANCOVA trend lines. In the type 1 sum of squares table (Type 1 SS) provided by the ANCOVA, only TTR and TTR × TTR were significant (both with Pr > F values of <0.0001 (doi.org/10.5281/zenodo.15188046)). The significance levels of these treatments and interactions do not show the directions of impact of the treatments, but these are shown in the figures.
Table 2. Between borders, each dependent variable is compared to the bottom one and significant differences between are highlighted. PODNUM is the average number of pods per plant; SEEDNUM is the average number of seeds per plant; SEEDABORT is the abortion rate for seeds; PODABORT is the pod abortion rate. A Tukey test using ANOVA indicated that all means for oxygen treatment were significantly different except PODABORT. Yellow highlight is used to identify significant Pr > |t| for the estimates of the ANCOVA regression coefficients. These ANCOVA regression coefficients are used for predicting the dependent variable responses.
Dependent VariablePODNUMSEEDNUMSEEDABORTPODABORT
Mean124.245. 39.13.68
R20.630.690.800.58
Probability columnPr > |t|Pr > |t|Pr > |t|Pr > |t|
Intercept<0.0001<0.0001<0.000100.328
O2TR 210.4590.0440.001<0.0001
O2TR 32
TTRT<0.0001<0.0001<0.00010.312
TTR × TTR<0.0001<0.0001<0.00010.351
TTR × TTR × O2TR 210.2380.865<0.0001<0.0001
TTR × TTR × O2TR 32
PER17-OE(T501)0.5800.8020.0270.264
PER28-OE(T502)0.0120.0450.0350.148
PER29-OE(T503)0.0020.0070.0030.007
MAVERICK
Tukey Mean for O2TR 21150.29768.44.73
Tukey Mean for O2TR 3298.619510.72.65
O2TRT32/O2TRT210.660.660.160.56
Mainstem node numbers at final harvest (Figure S2) showed an almost linear increase with temperature, with more nodes produced in the 21% O2 treatment than in the 32% O2 treatment, with an R2 = 0.56 for the ANCOVA. The O2TR, TTR, and TTR × TTR were significant for mainstem node numbers (Type 1 SS table). The average seed yields at 26 °C were 65.7 g per plant for the 21% O2 treatment and 43.8 g per plant for the 32% O2 treatment (Figure 3b). Both sets of 2nd-degree polynomial trendlines decreased with increasing temperature. The ANCOVA shows a reasonable fit with R2 = 0.81. The O2TR, TTR, O2TR × TTR, and TTR × TTR were significant for whole-plant seed weight in the Type 1 SS table. The shape of trendlines for the whole-plant pod weight (i.e., pod wall + seed) were similar to Figure 3b with a similar R2 = 0.82 (doi.org/10.5281/zenodo.1518). The O2TR, TTR, O2TR × TTR, and TTR × TTR were also significant in the Type 1 SS table (doi.org/10.5281/zenodo.15188046).
The trendlines for seed harvest index (seed weight)/(pod weight + stem weight) decreased with increasing temperature with an R2 = 0.92 (Figure 4a). Trendlines were similar for 21% O2 and 32% O2. The TTR, O2TR × TR, and TTR × TTR were significant for seed harvest index in the Type 1 SS table (doi.org/10.5281/zenodo.15188046). The ANCOVA for pod harvest index, defined as (pod weight)/(pod weight + stem weight) had a similar R2 = 0.93 (doi.org/10.5281/zenodo.15188046).
Figure 4. Plots of harvest index and shelling percentage as a function of temperature: (a) Harvest index vs. average daily air temperature at 21% O2 (upper set) and 32% O2 (lower set) of 2nd-degree polynomial curve fits to points derived from ANCOVA regression coefficients. Black lines represent cultivar Maverick. Each lower red line represents the transgenic T503; (b) Shelling percentage vs. average daily air temperature at both 21% O2 and 32% O2 (dashed lines) of 2nd-degree polynomial curve fits to points derived from ANCOVA regression coefficients. Curves are so similar for all cultivars at both oxygen levels that they overlie one another. Shelling percentage was affected only by temperature.
Oxygen 05 00005 g004
The shelling percentage (percentage ratio of weight of seeds to weight of pod walls + seeds) of Figure 4b decreased from 26 °C to zero at 38 °C and showed no appreciable difference between O2 treatments. This information indicates conclusively that the ratios of pod walls and seeds at maturation were not affected by [O2]. Only TTR and TTR × TTR were significant for shelling percentage in the Type 1 SS table.

3.4. Seed Responses to Temperature and Oxygen

Figure 5, Figure 6 and Figure 7 show reproductive responses from mainstem and branch stems from four plant genotypes to temperature and [O2]. The ANCOVA regression coefficients frequently showed significant differences for temperature and O2 treatments and their interactions, but only T503 transgenic plants (PER29-OE) and sometimes T502 (PER28-OE) showed consistently lower seed numbers than Maverick. In contrast, transgenic T503 PER29-OE showed a greater mainstem seed weight per plant (Figure 5a) and greater individual seed weights (Figure 2a). Trendlines from the ANCOVA predictions of numbers of seeds per plant on the mainstem and on the branch stems for both oxygen treatments are shown in Figure 5a (R2 = 0.77) and Figure 5b (R2 = 0.67), respectively, with the total number of seeds per plant shown in Figure 6a (R2 = 0.80). Numbers of seeds per plant were always greater for 21% O2 than for 32% O2. Although trendlines of numbers of seeds per plant for mainstems declined smoothly with increasing temperature, these trendlines for branch-stem seeds increased from 26 °C to 30 °C before declining to zero at 38 °C (Figure 5b). ANCOVA frequently showed differences for temperature and O2 treatments and interactions but did not show consistent differences of the transgenic plants from the Maverick cultivar.
Figure 5. Numbers of seeds on the mainstem and branch stems of plants: (a) Mainstem seed numbers per plant vs. average daily air temperature from the ANCOVA. Maverick trendlines are shown at 21% O2 (black dotted line) and 32% O2 (black dashed line). All transgenics made fewer seeds on the mainstem, but this effect was most pronounced in T503, which is plotted in the lower red trendlines. (b) Branch-stem seed number per plant vs. average daily air temperature from the ANCOVA. Maverick trendlines are shown at 21% O2 (black dotted lines) and 32% O2 (black dashed lines). The red trendlines represent the responses of T503 at 21% and 32% O2. Responses for T501 and T502 lie between the pairs of black and red lines.
Oxygen 05 00005 g005
Figure 6. Numbers of seeds per plant and per pod: (a) Total seed number per plant vs. average daily air temperature from the ANCOVA. Maverick trendlines are shown at 21% O2 (black dotted line) and 32% O2 (black dashed line). The lower red trendline represents the responses of T503 at 21% and 32% O2. Responses for T501 and T502 lie between the pairs of black and red lines; (b) Number of seeds per pod for the whole plant (mainstem and branch stems) vs. average daily air temperature from the ANCOVA. Maverick trendlines are shown for 21% O2 by the dotted black line and for 32% O2 by the dashed black line. Seeds per pod vs. temperature were similar for both mainstem and branch stems and were similar for both O2 treatments. Maverick and all three transgenic genotypes had similar numbers of seeds per pod, but growth temperature impacted this parameter.
Oxygen 05 00005 g006
ANCOVA of mainstem, branch-stem, and whole-plant seed number per pod showed high R2 values (0.97, 0.95, and 0.97, respectively). Since all data were similar, only whole-plant seed numbers per pod are illustrated (Figure 6b). All sources (O2TR, TTR, O2TR × TTR, TTR × TTR, O2TR × TTR × TTR, and PLANT) were significant in the Type 1 SS table for both branch-stem (doi.org/10.5281/zenodo.15188046) and whole-plant seed number per pod. The seed numbers per pod were similar for both O2 treatments for all plants with trendlines declining from 26 °C to 38 °C (Figure 6b). For mainstem seed weights per plant (Figure 7a), the response to temperature was linear and had a high R2 (0.79), however, the 32% O2 values were less than the 21% O2 values. The Type 1 SS values were significant for O2TR, TTR, and O2TR × TTR. However, branch-stem seed weight per plant was nonlinear with 32% O2 values greatest at 30 °C (Figure 7b, R2 = 0.65). Type 1 SS values were significant for O2TR, TTR, O2TR × TTR, and TTR × TTR. Individual seed weights decreased curvilinearly (convex upward) from 26 °C to 38 °C with an R2 = 0.94 (Figure 2a) and Type 1 SS values were significant for O2TR, TTR, TTR × TTR, and PLANT. Finally, the abortion rate of seeds in seed-producing pods (empty locules/total locules) increased with increasing temperature treatment only for the 21% O2 treatment but was relatively low at all temperatures for the 32% O2 treatment (Figure 2b, R2 = 0.93). All sources (O2TR, TTR, O2TR × TTR, TTR × TTR, O2TR × TTR × TTR, and PLANT) were significant in the Type 1 SS table.
Figure 7. Total seed weight on mainstems and branch stems: (a) Mainstem seed weight per plant vs. average daily air temperature from the ANCOVA. Maverick trendlines are shown at 21% O2 (black dotted line) and 32% O2 (black dashed line). The red lines show the fit of the largest response of the T503 transformant. Responses of transformants T501 and T502 lie between the black and red lines. (b) Branch-stem seed weight per plant versus average daily air temperature from the ANCOVA. Maverick trendlines at 21% oxygen (black dotted line) and 32% oxygen (black dashed line) are shown. The responses of the T501 transformants were next to those of the black Maverick controls and the T503 transformants (red dots) were quite close to the T502 (green lines). Interestingly, the mainstem seed weight was linear with respect to temperature, while the branch-stem seed weight was not.
Oxygen 05 00005 g007

3.5. Heterologous Expression of PER17 in Soybean (Blue Lines)

The STK::myc-PER17 construct was used to create transgenic soybean plants that heterologously expressed myc-PER17 (PER17-OE or T501 in tables and figures). PCR genotyping for the presence of the transgene revealed that the transgene was in plants, but there was rearrangement near the ends of the transgene. In Arabidopsis, this peroxidase is associated with ROS formation, which leads to lignin formation [43]. It is also induced four-fold when ovule abortion is signaled [38]. In PER17-OE, the total seed weight per plant was greatest compared to other transgenics (Figure 3b). Also, mainstem seed number per plant (Figure 5a) and branch seed weight per plant (Figure 7b) were greatest compared to other genotypes. Among all the genotypes, seed abortion rates for PER17-OE were the lowest (Figure 2b).

3.6. Heterologous Expression of PER28 in Soybean (Green Lines in the Figures)

The STK::myc-PER28 construct was used to create transgenic soybean plants that heterologously expressed myc-PER28 (designated PER28-OE or T502). In Arabidopsis, the PER28 gene is expressed in the stigma and style, as well as the zone of differentiation in roots. In roots, expression of the PER28 locus is induced by ROS [44] so this gene may affect fruit growth when seed abortion is induced. PCR genotyping for the presence of the transgene revealed that the transgene was in plants. Ectopic expression of PER28-OE led to the lowest dry weight of pods plus stems (Figure 3a, green lines), the lowest node number at final harvest (Figure S2), the lowest average seed weight (Figure 3b), and the lowest branch seed weight per plant (Figure 7b). Despite these low responses, seed abortion rates of the PER28-OE transgenic were neither the lowest nor highest at all temperatures (Figure 2b).

3.7. Heterologous Expression of PER29 in Soybean (Red Lines)

The STK::myc-PER29 construct was used to create transgenic soybean plants that heterologously expressed myc-PER29 (designated PER29-OE or T503). In Arabidopsis, the per29 mutant had a 40% reduction in seed set; this reduction in fertility corresponded to an increase in ROS created in ovules [38]. The PER29 coding sequence was PCR-amplified from transgenic plants. In the 30/22 °C treatment, the growth parameters measured in the PER29-OE transgenic lines did not differ significantly from the Maverick controls. However, the PER29-OE transgenic lines resulted in increased average mass per seed (Figure 2a, red line). In PER29-OE seeds, there was a higher average mass per seed, but fewer seeds per plant were harvested (Figure 5 and Figure 7, red lines). This resulted in a lower harvest index (Figure 4a, red lines). There was a higher mainstem seed weight (Figure 7a, red lines). Most of the vegetative tissues from the PER29-OE transgenic lines remained green through the R8 stage, while those of the controls mostly turned yellow and/or abscised. While the harvest index of the PER29-OE transgenic lines was lower under heat stress, plant vegetative biomass increased in these transgenic plants, rather than a pod or seed mass decrease.

3.8. Growth and Yield Responses to Temperature and O2

At maturity, plant weight (stem and pod wall plus seed) decreased as mean temperature increased above 30 °C (Figure 3a). Productivity was consistently lower at 32% [O2], presumably because the higher [O2] enhanced photorespiration even at 700 ppm [CO2]. The number of nodes on mainstems (Figure S2) increased as temperature increased. The soybean life cycle was slowed and the time to maturity was extended at 34 and 38 °C, also reported by Thomas et al. [9]. Seed yield per plant and seed harvest index progressively decreased as temperature increased above 26 °C, reaching zero yield at 38 °C (Figure 4 and Figure 5). Seed yield and harvest index responses to elevated temperature for Maverick (MG III) soybean in this controlled environment greenhouse study were similar to the yield responses observed with the Bragg cultivar (MG VII) grown using sunlit controlled environment chambers [3,9,45]. With the Bragg cultivar, seed yield and HI declined above 32 °C and reached the failure point of zero at 39 °C [45]. Seed number per plant (Figure 6a) and pod number per plant (doi.org/10.5281/zenodo.15188046) peaked at 30 °C, but then progressively decreased at higher temperature. The seed size declined as temperature increased above 26 °C, a phenomenon similar to that observed for the Bragg cultivar [3,9,45]. However, Egli and Wardlaw [7] found that soybean individual seed weight was relatively constant (~200 mg per seed) from 24/19 to 30/25 °C in one experiment and relatively constant (~150 mg per seed) across temperatures of 24/19 to 33/28 °C in another experiment. In their studies, individual seed weights decreased at progressively higher temperatures, as also observed in this study. Decreased pollen viability is believed to be the cause of reduced pod numbers above 30 °C. Reduced pollen numbers and reduced pollen viability were reported as the causes of decreased seed numbers under elevated temperature for two similar legumes, dry bean (Phaseolus vulgaris L.) [46] and peanut (Arachis hypogaea L.) [47], as well as sorghum (Sorghum bicolor (L.) Moench.) [48]. Sensitivity of pollen viability of soybean cultivars to elevated temperature has been evaluated by Salem et al. [49]. Seed number per pod (Figure 6b) was reduced above 30 °C, which also mimics their reduction in pods and seeds per plant above 30 °C.
From the results reported here, the hypothesis that elevated 32% [O2] overcomes or reduces the effect of elevated temperature on pod set, seed formation, and yield of soybean was rejected. The primary effect of 32% [O2] compared to ambient [O2] was to reduce productivity and seed yield apparently via higher photorespiration.
These results failed to support the hypothesis that soybean genotypes transgenic for ROS scavengers act to minimize the effect of elevated temperature on seed set and seed yield. For many measured parameters, the transgenic lines showed similar responses to rising temperature and 32% [O2] to the wild-type cultivar. The transgenic lines showed little to no differences in the seed yield response to elevated temperature and little to no difference as to the effect of 32% [O2]. Minor effects will be discussed in the next section relative to the proposed effect of the transgenic ROS scavengers during seed formation. In a number of animal species, low O2 levels regulate growth and differentiation of embryonic stem cells (for a review, see [50]). It is entirely possible that, in soybean, low O2 levels serve a similar purpose. Plants pistils frequently nurture embryos from different fathers. It has been proposed that parental conflict exists in plants where the progeny of different fathers try to sequester more resources than others, while mothers attempt to distribute available resources evenly to the offspring [51]. In soybean seeds, the decrease in O2 coincides with resource allocation so this may have been an adaptation that occurs in legumes to ensure even allocation of resources to developing seeds.

3.9. PER Function During Seed Formation

The three transgenes (PER17, PER28, and PER29) encode peroxidases that are abundantly expressed in developing seeds undergoing ovule abortion [38]. Ectopic expression of all three of these peroxidases resulted in significantly lower seed abortion. All three of these peroxidases are predicted to localize to the cell wall. While peroxidases have a broad range of functions, they have been reported to generate, as well as scavenge, reactive oxygen species [52]. The hypersensitive response (HR) is triggered by peroxide accumulation in the cell wall [24]. While any of these three peroxidases might interfere with peroxide accumulation and HR, data were not collected to confirm or refute this interference.
The PER29 transgenics had fewer seeds per plant, but the seeds were larger so the yield in these plants was unaffected. In Arabidopsis, the gene scavenges ROS in developing ovules. Fewer free radicals in the cell wall increases cell expansibility by reducing the number of cross-links among cell wall components. This would allow increases in cell size. This cell wall peroxidase might reduce the rate of lignin formation. Lignification is regulated by free-radical polymerization of monolignols. Lignin would be expected to reduce diffusion of O2 and slow growth. In the future, it seems reasonable to examine the amount of lignin in transgenic and control seeds to see if this correlates with the reported phenotypes here.
During reproduction, plants often are limited by nitrogen, phosphate, or photosynthate resources, and developing seeds would consume resources until one became limiting. This would result in similar yields even if seed number or size were altered. This explains why decreased seed abortion and changes in seed size had no net effect on yield.

3.10. Exposure of Seed Pods Only Versus Whole Plants

The experiments of Sinclair et al. [14] showed that, with only soybean seed pods exposed to high [O2], individual seed growth was promoted, which should promote seed yield. However, our experiment indicates that high [O2] around the whole plant diminishes photosynthetic rates and leads to a reduction, rather than an increase, in soybean seed yield. This effect was observed even in elevated CO2 (700 ppm) in this experiment. Apparently, over evolutionary time, soybean plants adapted to low [O2] in seeds during seed formation. Thus elevated [O2] served mainly to limit photoassimilate supply for seeds of this C3 photosynthetic pathway plant and the effects of higher [O2] in seeds were minor.

3.11. Supplemental O2 Decreased Yields

The increase in ambient [O2] around the whole plant negatively affected seed number per plant and yield due to the detrimental effect of high [O2] on photosynthesis [53], which reduces photoassimilate available for plant biomass and seed production and offsets any beneficial effect on seed [O2]. Differences among plant types were nil for mainstem, branch, or total seed yield (g/plant). In elevated O2, biomass and yield were decreased, but harvest index and shelling percentage were unaffected. Temperature effects on pod numbers and seed yield were similar to patterns shown in earlier experiments, e.g., [45]. Hypothesis 2, which predicted elevated O2 in seeds would overcome seed-set failure and seed yield reduction at elevated temperatures, was not supported.

4. Conclusions

Soybean plants transformed with PER17, 28, and 29 showed lower rates of seed abortion, however, this did not significantly increase seed yields. This result indicates that the failure of fertilized embryos to develop into fully formed seeds is not a substantial problem in soybean if at a moderate temperature. Plant breeders have selected high-performing lines that have mechanisms to extend the reproductive window when fertility is marginal. Consequently, yields were similar for all of the genotypes. This indicates plants adjust seed production to utilize photoassimilate supply, thereby maximizing reproduction.

Supplementary Materials

The following supporting information can be downloaded at: https://www.mdpi.com/article/10.3390/oxygen5020005/s1, Figure S1: Detection of myc-PER fusion proteins; Figure S2: Node Number at Final Harvest.

Author Contributions

Conceptualization, B.A.H., K.J.B. and L.H.A.J.; methodology, B.A.H. and Y.-Y.W.; formal analysis, L.H.A.J.; investigation, B.A.H., Y.-Y.W., K.J.B., E.S.M. and P.C.; resources, B.A.H., K.J.B., E.S.M. and L.H.A.J.; data curation, B.A.H., K.J.B., Y.-Y.W. and L.H.A.J.; writing—original draft preparation, L.H.A.J. and B.A.H.; writing—review and editing, B.A.H., K.J.B., Y.-Y.W. and L.H.A.J.; visualization, B.A.H., Y.-Y.W. and L.H.A.J.; supervision, B.A.H., K.J.B. and L.H.A.J.; project administration, B.A.H.; funding acquisition, B.A.H., K.J.B. and L.H.A.J. All authors have read and agreed to the published version of the manuscript.

Funding

This work was supported by a grant from the USDA Cooperative State Research, Education, and Extension Service, grant number 2008-35100-19244.

Data Availability Statement

Datasets of the actual measurements made on the soybean responses to treatments are provided in the Zenodo data repository (doi.org/10.5281/zenodo.15188046).

Acknowledgments

We thank the University of Florida IFAS Facilities, Planning, and Operations team, especially engineers Frank Tipton and Joe Hayden, for construction and maintenance of the 8-room greenhouse with air circulation, heaters, and chilled water environmental control systems. We especially thank Maritza Romero (USDA-ARS Mechanical Engineer) and John Truett (UF Agronomy Department Technician) for development of computer control systems and hardware for controlling temperatures, CO2 concentrations, and elevated O2 concentrations. We also thank Maritza Romero and John Truett for assisting in conducting the experiment, working up control data, plant sampling, and making some of the observations and recording plant response data. Transgenic plants were generated by the Missouri Plant Transformation Facility, under the direction of Zhanyuan Zhang. This research was supported by the National Research Initiative of the USDA Cooperative State Research, Education, and Extension Service grant to the University of Florida (grant number 2008-35100-19244), the University of Florida Agricultural Experiment Station, and the Center for Medical, Agricultural, and Veterinary Entomology, ARS, U.S. Department of Agriculture. We thank Joseph C.V. Vu (retired USDA-ARS Plant Physiologist) for his participation in developing the grant. The USDA is an equal opportunity provider and employer.

Conflicts of Interest

The authors declare no conflicts of interest.

References

  1. Allen, L.H.; Pan, D.; Boote, K.J.; Pickering, N.B.; Jones, J.W. Carbon Dioxide and Temperature Effects on Evapotranspiration and Water Use Efficiency of Soybean. Agron. J. 2003, 95, 1071–1081. [Google Scholar] [CrossRef]
  2. Allen, L.H.; Boote, K.J.; Jones, J.W.; Jones, P.H.; Pickering, N.B.; Baker, J.T.; Vu, J.C.V.; Gesch, R.W.; Thomas, J.M.G.; Prasad, P.V.V. Sunlit, Controlled-environment Chambers Are Essential for Comparing Plant Responses to Various Climates. Agron. J. 2020, 112, 4531–4549. [Google Scholar] [CrossRef]
  3. Boote, K.J.; Allen, L.H.; Prasad, P.V.V.; Baker, J.T.; Gesch, R.W.; Snyder, A.M.; Pan, D.; Thomas, J.M.G. Elevated Temperature and CO2 Impacts on Pollination, Reproductive Growth, and Yield of Several Globally Important Crops. J. Agric. Meteorol. 2005, 60, 469–474. [Google Scholar] [CrossRef]
  4. Thomas, J.M.G.; Boote, K.J.; Allen, L.H.; Gallo-Meagher, M.; Davis, J.C. Elevated Temperature and Carbon Dioxide Effects on Soybean Seed Composition and Transcript Abundance. Crop Sci. 2003, 43, 1548–1557. [Google Scholar] [CrossRef]
  5. Fleisher, D.H.; Timlin, D.; Reddy, K.R.; Reddy, V.R.; Yang, Y.; Kim, S.-H. Effects of CO2 and Temperature on Crops: Lessons from SPAR Growth Chambers. In ICP Series on Climate Change Impacts, Adaptation, and Mitigation; Imperial College Press: London, UK, 2010. [Google Scholar]
  6. Tacarindua, R.P.; Shiraiwa, T.; Homma, K.; Kumagai, E.; Sameshima, R. The effects of increased temperature on crop growth and yield of soybean grown in a temperature gradient chamber. Field Crops Res. 2013, 154, 74–81. [Google Scholar] [CrossRef]
  7. Egli, D.B.; TeKrony, D.M.; Heitholt, J.J.; Rupe, J.C. Air Temperature during Seed Filling and Soybean Seed Germination and Vigor. Crop Sci. 2005, 45, 1329–1335. [Google Scholar] [CrossRef]
  8. Chamarthi, S.K.; Kaler, A.S.; Abdel-Haleem, H.; Fritschi, F.B.; Gillman, J.D.; Ray, J.D.; Smith, J.A.; Dhanapal, A.P.; King, C.H.; Purcell, L.C. Identification and Confirmation of LOCI Associated with Canopy Wilting in Soybean Using Genome-Wide Association Mapping. Front. Plant Sci. 2021, 12, 698116. [Google Scholar] [CrossRef] [PubMed]
  9. Thomas, J.M.G.; Boote, K.J.; Pan, D.; Allen, L.H. Elevated temperature delays onset of reproductive growth and reduces seed growth rate of soybean. J. AgroCrop Sci. 2010, 1, 19–32. [Google Scholar]
  10. Borisjuk, L.; Rolletschek, H. The Oxygen Status of the Developing Seed. New Phytol. 2009, 182, 17–30. [Google Scholar] [CrossRef]
  11. Porterfield, D.M.; Kuang, A.; Smith, P.; Crispi, M.L.; Musgrave, M.E. Oxygen-Depleted Zones inside Reproductive Structures of Brassicaceae: Implications for Oxygen Control of Seed Development. Can. J. Bot. 2000, 77, 1439–1446. [Google Scholar] [CrossRef]
  12. Rolletschek, H.; Borisjuk, L.; Koschorreck, M.; Wobus, U.; Weber, H. Legume Embryos Develop in a Hypoxic Environment. J. Exp. Bot. 2002, 53, 1099–1107. [Google Scholar] [CrossRef] [PubMed]
  13. Thorne, J.C. Temperature and Oxygen Effects on 14C-Photosynthate Unloading and Accumulation in Developing Soybean Seeds. Plant Physiol. 1982, 69, 48–53. [Google Scholar] [CrossRef]
  14. Sinclair, T.R.; Ward, J.; Randall, C.W. Soybean Seed Growth in Response to Long-Term Exposures to Differing Oxygen Partial Pressures. Plant Physiol. 1987, 83, 467–468. [Google Scholar] [CrossRef] [PubMed]
  15. Sinclair, T.R. Oxygen and Temperature Effects on Soybean Seed Coat Respiration Rates. Plant Physiol. 1988, 86, 124–128. [Google Scholar] [CrossRef] [PubMed]
  16. Richard, T. Calculating the Oxygen Diffusion Coefficient in Water. Available online: https://compost.css.cornell.edu/oxygen/oxygen.diff.water.html (accessed on 15 April 2025).
  17. Vigeolas, H.; Van Dongen, J.T.; Waldeck, P.; Hühn, D.; Geigenberger, P. Lipid Storage Metabolism Is Limited by the Prevailing Low Oxygen Concentrations Within Developing Seeds of Oilseed Rape. Plant Physiol. 2003, 133, 2048–2060. [Google Scholar] [CrossRef]
  18. Rolletschek, H.; Radchuk, R.; Klukas, C.; Schreiber, F.; Wobus, U.; Borisjuk, L. Evidence of a Key Role for Photosynthetic Oxygen Release in Oil Storage in Developing Soybean Seeds. New Phytol. 2005, 167, 777–786. [Google Scholar] [CrossRef]
  19. Borisjuk, L.; Nguyen, T.D.; Neuberger, T.; Rutten, T.; Tschiersch, H.; Claus, B.E.H.; Feussner, I.; Webb, A.G.; Jakob, P.M.; Weber, H.; et al. Gradients of Lipid Storage, Photosynthesis and Plastid Differentiation in Developing Soybean Seeds. New Phytol. 2005, 167, 761–776. [Google Scholar] [CrossRef]
  20. Dat, J.F.; Vandenabeele, S.; Vranová, E.; Van Montagu, M.; Inzé, D.; Van Breusegem, F. Dual Action of the Active Oxygen Species during Plant Stress Responses. Cell. Mol. Life Sci. 2000, 57, 779–795. [Google Scholar] [CrossRef]
  21. Overmyer, K.; Brosché, M.; Kangasjärvi, J. Reactive Oxygen Species and Hormonal Control of Cell Death. Trends Plant Sci. 2003, 8, 335–342. [Google Scholar] [CrossRef]
  22. Bailly, C. Active Oxygen Species and Antioxidants in Seed Biology. Seed Sci. Res. 2004, 14, 93–107. [Google Scholar] [CrossRef]
  23. Wagner, D.; Przybyla, D.; Camp, R.O.D.; Kim, C.; Landgraf, F.; Lee, K.; Würsch, M.; Laloi, C.; Nater, M.; Hideg, É.; et al. The Genetic Basis of Singlet Oxygen–Induced Stress Responses of Arabidopsis thaliana. Science 2004, 306, 1183–1185. [Google Scholar] [CrossRef]
  24. Almagro, L.; Ros, L.V.G.; Belchí-Navarro, S.; Bru, R.; Barceló, A.R.; Pedreño, M.A. Class III Peroxidases in Plant Defence Reactions. J. Exp. Bot. 2008, 60, 377–390. [Google Scholar] [CrossRef] [PubMed]
  25. Bestwick, C.S.; Brown, I.H.; Mansfield, J.W. Localized Changes in Peroxidase Activity Accompany Hydrogen Peroxide Generation During the Development of a Nonhost Hypersensitive Reaction in Lettuce. Plant Physiol. 1998, 118, 1067–1078. [Google Scholar] [CrossRef] [PubMed]
  26. Tschiersch, H.; Borisjuk, L.; Rutten, T.; Rolletschek, H. Gradients of Seed Photosynthesis and Its Role for Oxygen Balancing. Bio-Systems 2011, 103, 302–308. [Google Scholar] [CrossRef]
  27. Brazel, A.J.; Ó’Maoiléidigh, D.S. Photosynthetic Activity of Reproductive Organs. J. Exp. Bot. 2019, 70, 1737–1754. [Google Scholar] [CrossRef] [PubMed]
  28. Benamar, A.; Rolletschek, H.; Borisjuk, L.; Avelange-Macherel, M.-H.; Curien, G.; Mostefai, H.A.; Andriantsitohaina, R.; Macherel, D. Nitrite–Nitric Oxide Control of Mitochondrial Respiration at the Frontier of Anoxia. Biochim. Biophys. Acta-Bioenerg. 2008, 1777, 1268–1275. [Google Scholar] [CrossRef]
  29. Kumar, S.; Chintagunta, A.D.; Reddy, Y.C.J.; Rajjou, L.; Garlapati, V.K.; Agarwal, D.C.; Prasad, S.; Simal-Gandara, J. Implications of Reactive Oxygen and Nitrogen Species in Seed Physiology for Sustainable Crop Productivity Under Changing Climate Conditions. Curr. Plant Biol. 2021, 26, 100197. [Google Scholar] [CrossRef]
  30. Borisjuk, L.; Macherel, D.; Benamar, A.; Wobus, U.; Rolletschek, H. Low Oxygen Sensing and Balancing in Plant Seeds: A Role for Nitric Oxide. New Phytol. 2007, 176, 813–823. [Google Scholar] [CrossRef]
  31. Sun, K.; Hunt, K.; Hauser, B.A. Ovule Abortion in Arabidopsis Triggered by Stress. Plant Physiol. 2004, 135, 2358–2367. [Google Scholar] [CrossRef]
  32. Allen, L.H.; Zhang, L.; Boote, K.J.; Hauser, B.A. Elevated Temperature Intensity, Timing, and Duration of Exposure Affect Soybean Internode Elongation, Mainstem Node Number, and Pod Number per Plant. Crop J. 2018, 6, 148–161. [Google Scholar] [CrossRef]
  33. Zhang, L.; Allen, L.H.; Vaughan, M.; Hauser, B.A.; Boote, K.J. Solar Ultraviolet Radiation Exclusion Increases Soybean Internode Lengths and Plant Height. Agric. For. Meteorol. 2014, 184, 170–178. [Google Scholar] [CrossRef]
  34. Sleper, D.A.; Nickell, C.D.; Noel, G.R.; Cary, T.R.; Thomas, D.J.; Clark, K.M.; Rao-Arelli, A.P. Registration of ‘Maverick’ soybean. Crop Sci. 1998, 38, 549–550. [Google Scholar] [CrossRef]
  35. Chaturvedi, P.; Hauser, B.A.; Allen, L.H.; Boote, K.J.; Karplus, E.; McLamore, E.S. A Multiplexing Fiber Optic Microsensor System for Monitoring Oxygen Concentration in Plants. Proc. SPIE—Int. Soc. Opt. Eng. 2014, 8719, 87190O. [Google Scholar] [CrossRef]
  36. Chaturvedi, P.; Taguchi, M.; Burrs, S.L.; Hauser, B.A.; Salim, W.W.A.W.; Claussen, J.C.; McLamore, E.S. Emerging Technologies for Non-Invasive Quantification of Physiological Oxygen Transport in Plants. Planta 2013, 238, 599–614. [Google Scholar] [CrossRef] [PubMed]
  37. Chaturvedi, P.; Hauser, B.A.; Foster, J.M.; Karplus, E.; Levine, L.H.; Coutts, J.L.; Richards, J.T.; Vanegas, D.C.; McLamore, E.S. A Multiplexing Fiber Optic Microsensor System for Monitoring Spatially Resolved Oxygen Patterns. Sens. Actuators B-Chem. 2014, 196, 71–79. [Google Scholar] [CrossRef]
  38. Wang, Y.-Y.; Head, D.J.; Hauser, B.A. During Water Stress, Fertility Modulated by ROS Scavengers Abundant in Arabidopsis Pistils. Plants 2023, 12, 2182. [Google Scholar] [CrossRef] [PubMed]
  39. Zeng, P.; Vadnais, D.A.; Zhang, Z.P.; Polacco, J.C. Refined Glufosinate Selection in Agrobacterium-Mediated Transformation of Soybean [Glycine max (L.) Merrill]. Plant Cell Rep. 2004, 22, 478–482. [Google Scholar] [CrossRef]
  40. Yang, R.-C.; Juskiw, P. Analysis of Covariance in Agronomy and Crop Research. Can. J. Plant Sci. 2011, 91, 621–641. [Google Scholar] [CrossRef]
  41. Leppink, J. Analysis of Covariance (ANCOVA) vs. Moderated Regression (MODREG): Why the Interaction Matters. Health Prof. Educ. 2018, 4, 225–232. [Google Scholar] [CrossRef]
  42. Kim, H.J. Statistical Notes for Clinical Researchers: Analysis of Covariance (ANCOVA). Restor. Dent. Endod. 2018, 43, e43. [Google Scholar] [CrossRef]
  43. Cosio, C.; Ranocha, P.; Francoz, E.; Burlat, V.; Zheng, Y.; Perry, S.E.; Ripoll, J.G.; Yanofsky, M.F.; Dunand, C. The Class III Peroxidase PRX 17 Is a Direct Target of the MADS-box Transcription Factor AGAMOUS-LIKE15 (AGL 15) and Participates in Lignified Tissue Formation. New Phytol. 2016, 213, 250–263. [Google Scholar] [CrossRef] [PubMed]
  44. Shin, R.; Schachtman, D.P. Hydrogen Peroxide Mediates Plant Root Cell Response to Nutrient Deprivation. Proc. Natl. Acad. Sci. USA 2004, 101, 8827–8832. [Google Scholar] [CrossRef]
  45. Boote, K.J.; Prasad, P.V.V.; Allen, L.H.; Singh, P.K.; Jones, J.W. Modeling Sensitivity of Grain Yield to Elevated Temperature in the DSSAT Crop Models for Peanut, Soybean, Dry Bean, Chickpea, Sorghum, and Millet. Eur. J. Agron. 2018, 100, 99–109. [Google Scholar] [CrossRef]
  46. Prasad, P.V.V.; Boote, K.J.; Allen, L.H.; Thomas, J.M.G. Effects of Elevated Temperature and Carbon Dioxide on Seed-Set and Yield of Kidney Bean (Phaseolus vulgaris L.). Glob. Change Biol. 2002, 8, 710–721. [Google Scholar] [CrossRef]
  47. Prasad, P.V.V.; Boote, K.J.; Allen, L.H.; Thomas, J.M.G. Super-Optimal Temperatures Are Detrimental to Peanut (Arachis hypogaea L.) Reproductive Processes and Yield at Both Ambient and Elevated Carbon Dioxide. Glob. Change Biol. 2003, 9, 1775–1787. [Google Scholar] [CrossRef]
  48. Prasad, P.V.V.; Boote, K.J.; Allen, L.H. Adverse High Temperature Effects on Pollen Viability, Seed-Set, Seed Yield and Harvest Index of Grain-Sorghum [Sorghum bicolor (L.) Moench] Are More Severe at Elevated Carbon Dioxide Due to Higher Tissue Temperatures. Agric. For. Meteorol. 2006, 139, 237–251. [Google Scholar] [CrossRef]
  49. Salem, M.A.; Kakani, V.G.; Koti, S.; Reddy, K.R. Pollen-Based Screening of Soybean Genotypes for High Temperatures. Crop Sci. 2007, 47, 219–231. [Google Scholar] [CrossRef]
  50. Simon, D.C.; Keith, B. The role of oxygen availability in embryonic development and stem cell function. Nat. Rev. Mol. Cell. Biol. 2008, 20, 285–296. [Google Scholar] [CrossRef] [PubMed]
  51. Picard, C.L.; Povilus, R.A.; Williams, B.P.; Gehrig, M. Transcriptional and imprinting complexity in Arabidopsis seeds at single-nucleus resolution. Nat. Plants 2021, 7, 730–738. [Google Scholar] [CrossRef]
  52. Passardi, F.; Cosio, C.; Penel, C.; Dunand, C. Peroxidases Have More Functions than a Swiss Army Knife. Plant Cell Rep. 2005, 24, 255–265. [Google Scholar] [CrossRef]
  53. Zhang, Z.; Zhu, G.; Peng, X. Photorespiration in plant adaptation to environmental changes. Crop Environ. 2024, 4, 203–212. [Google Scholar] [CrossRef]
Figure 1. Results from an O2 microsensor inserted into developing seeds. (a) The left panel shows O2 in soybean seeds at the reproductive stage R5 (seeds were ~3 mm in length). (b) The right panel shows O2 in soybean seeds at reproductive stage R6 (seeds expanded to fill the locule). Plants were grown in ambient (21%) or elevated O2 (32%). Early in seed development, increasing [O2] in the environment markedly enhanced [O2] in the seed. As the testa became more impermeable to O2 (stage R6), [O2] declined from earlier stages.
Oxygen 05 00005 g001
Figure 2. Average seed mass and seed failure rate with 2nd degree polynomial trendline fitted to the air temperature as predicted by ANCOVA: (a) Individual seed weight vs. average daily air temperature from the ANCOVA. Maverick trendlines are shown at 21% O2 (black dotted line) and 32% O2 (black dashed line). While all transformants had greater seed mass than Maverick controls, the red line shows the largest response of the T503 transformant at 21% O2. (b) Abortion rate of seeds in seed-producing pods (empty locules/total locules in seed-producing pods) vs. average daily air temperature from the ANCOVA. Maverick trendlines are shown at 21% O2 (black dotted line) and 32% O2 (black dashed line). Abortion rate was greater at 21% oxygen and increased sharply with temperature. All transformants showed lower abortion rates with the best response being shown for T501 (blue lines). Data at 38 °C are projections since no seeds were produced at this temperature.
Oxygen 05 00005 g002
Table 1. Mean daily CO2 concentration (µmol mol−1), O2 concentration (percent), temperature (Celsius), Relative Humidity (RH) (%), Photosynthetic Photon Flux Density (PPFD) (µmol photon m−2 s−1), and Daily Light Integral (DLI) (mol photon m−2 day−1) for Controlled Environment Greenhouse Room 1 to Room 8.
Room Number12345678
[CO2] Mean701698694703696696698697
Std. Dev8281738579797473
[O2] Mean
Std. Dev
32.0Amb32.0Amb31.9Amb31.6Amb
0.8≈zero0.8≈zero0.8≈zero1.3≈zero
Mean Daytime Temp °C
Std. Dev
30.030.034.034.038.038.042.042.0
0.90.80.70.50.50.50.50.5
Mean RH %57.255.955.555.757.058.963.860.2
Std. Dev2.92.02.71.33.24.84.54.4
Mean PPFD314.0334.4338.0330.5342.2339.2359.0342.8
Mean DLI13.5614.4514.6014.2914.7814.6515.5114.81
Disclaimer/Publisher’s Note: The statements, opinions and data contained in all publications are solely those of the individual author(s) and contributor(s) and not of MDPI and/or the editor(s). MDPI and/or the editor(s) disclaim responsibility for any injury to people or property resulting from any ideas, methods, instructions or products referred to in the content.

