Article

Cell Localization of DPI-Dependent Production of Superoxide in Reproductive Tissues of the Olive Tree (Olea europaea L.)

by
María José Jiménez-Quesada
,
Antonio Jesús Castro
,
Elena Lima-Cabello
and
Juan de Dios Alché
*
Plant Reproductive Biology and Advanced Imaging Laboratory (BREMAP), Department of Plant Stress, Signaling and Development, Estación Experimental del Zaidín (CSIC), Profesor Albareda 1, E-18008 Granada, Spain
*
Author to whom correspondence should be addressed.
Oxygen 2022, 2(2), 79-90; https://doi.org/10.3390/oxygen2020007
Submission received: 25 February 2022 / Revised: 12 April 2022 / Accepted: 15 April 2022 / Published: 19 April 2022
(This article belongs to the Special Issue Feature Papers in Oxygen)

Abstract

:
Reactive Oxygen Species (ROS) are compounds derived from oxygen with important implications in biological processes in plants, some of them related to reproduction. Among ROS, superoxide is the primary oxidant, since an array of other ROS are eventually derived from this anion. Therefore, analysis of the molecular systems able to generate this molecule and the cellular compartmentalization of these events is of paramount importance. We have used the fluorochrome DCFH2-DA and the chromogenic substrate NBT in association with DPI (a specific inhibitor of Rboh enzymes generating superoxide in plants) in combination with confocal microscopy and stereomicroscopy, respectively to identify cell localization of ROS in general, and superoxide accumulation in olive reproductive tissues. A significant production of both ROS and superoxide has been described, showing a fairly precise spatial and temporal location throughout olive flower development. The reduction of the NBT signal after the addition of DPI suggests that the generation of superoxide is largely due to Rboh or other flavin oxidase activity. At the subcellular level, accumulation of O2●− has been located in the plasma membrane of mature pollen and germinated pollen, as well as in the rough endoplasmic reticulum and in mitochondria.

1. Introduction

ROS and NO are currently considered central mechanisms controlling different steps of sexual plant reproduction, as they act as signaling molecules and are subjected to extensive regulation by antioxidant enzymes and molecules including glutathione, glutaredoxins or thioredoxins, among others. Thus, redox network has been described to control different aspects of the formation of male and female gametes, pollen–stigma interaction (including self-incompatibility), pollen germination and pollen tube growth and guidance through the female tissues, as well as fertilization (see reviews by [1,2,3,4]).
Among ROS, superoxide is of paramount significance because it represents the origin of other ROS through a cascade of reactions that have been described in different subcellular localizations including mitochondria, chloroplasts, peroxisomes and the endoplasmic reticulum [5]. Different superoxide sources have been described in plants like cell wall-bound peroxidases and amine, quinone and oxalate oxidases, together with the side reactions of metabolism and electron leakage (see review by [6]). However, plant oxidative burst has been described as a physiologically controlled and rapid source of ROS in response to different stresses and situations. The enzymes responsible for this O2●− production in plants are NADPH oxidases, members of the so-called Rboh (respiratory burst oxidase homolog) family of enzymes. Such Rboh enzymes are differentially inhibited by diphenyleneiodonium (DPI), which is able to specifically inhibit Rboh-dependent superoxide producing activity by affecting dimerization and mobility [7]. Vegetative Rboh isoforms are the subject of a tight multifactorial regulation, which include positive activation by Ca2+, phosphorylation, small GTPases from the Rop family and phosphatidic acid (PA) [8,9,10,11,12], as well as by the S-nitration of a C-terminal Cys [13].
Rboh isoforms, with similar regulation characteristics, are beginning to be identified in both (male and female) plant gametophytes [14,15,16,17,18]. In Arabidopsis thaliana, two specific forms of Rboh (RbohH and RbohJ) have been shown to be specifically expressed in pollen and stamens [19] and their activity was detected through pollen tube growth, subsequently to pollen rehydration [20], pollen tube apical elongation [14,15] and fertilization [21].
In the olive tree, an Rboh enzyme with a high degree of identity with RbohH and RbohJ from Arabidopsis, and also similarly expressed mainly in the pollen grain has been characterized [22]. The enzyme (named OeRbohH) shares structural characteristics with the corresponding Arabidopsis forms of the enzyme and its balanced expression prevents the appearance of abnormal phenotypes. Moreover, the treatment of growing pollen tubes with the DPI inhibitor produces impaired ROS production and consequent inhibition of pollen germination and pollen tube growth [22].
With regard to the gynoecium, present evidence of the involvement of ROS and NO in different aspects of stigma physiology is overwhelming in numerous plant species (see review by [1,2,3,4,23]). In the olive tree, the production of superoxide in floral tissues through different development stages was described by [24]. Superoxide generates a strong positive signal over the stigma surface, which was detected by using the fluorophore DHE (dihydroethidium), in combination with the O2●− scavenger TMP (4-hydroxy-2,2,6,6-tetramethylpiperidine-1-oxy) with a precise and controlled timely expression. However, and differently from olive pollen, we have no current cellular nor molecular evidence of whether such O2●− signal occurs as the result of the involvement of DPI-dependent Rboh activity in the stigma.
The main goal of the present work was to obtain confirmation of the presence of such potential Rboh activity in the olive stigma, the mature pollen grain and the pollen tube through the use of simple and effective staining methods, in comparison with a method designed to label total production of O2●−. Moreover, we also wanted to preliminary determine the potential use of an adapted method to assess the subcellular localization of DPI-dependent O2●− production.

2. Materials and Methods

2.1. Plant Material

Whole flowers at five different developmental stages and mature pollen were collected from olive trees (cv. Picual) placed at the Estación Experimental del Zaidín-CSIC (Granada, Spain). Five major developmental stages were established previously [24] to better dissect flower development in the olive. These were named “green bud” (stage 1), “white bud” (2), “recently opened flower” (3), “dehiscent anther“ (4) and finally “senescent flower” (5). Their main morphological characteristics, size and their duration were described by these authors.
Whole flowers were used straightforward for light microscopy (LM) or confocal laser scanning microscopy (CLSM) analyses, or stored at −80 °C until use. Mature olive pollen was isolated from dehiscent anthers by vigorously shaking the panicles inside large paper bags. Pollen was sequentially sieved through 150 and 50 μm mesh nylon filters to eliminate debris, and cultured in vitro or stored at −80 °C until use.

2.2. In Vitro Pollen Germination

In vitro olive pollen germination was induced as previously described [22,25]. Briefly, pollen prehydration was performed at 30 °C in the dark for 1 h in a humid chamber before transference to the culture medium [10% (w/v) sucrose, 0.03% (w/v) Ca(NO3)2, 0.01% (w/v) KNO3, 0.02% (w/v) MgSO4 and 0.03% (w/v) boric acid]. Pollen was cultured at RT in the dark and under continuous stirring, and samples were taken after different times of germination (5 min, 1, 3 and 6 h).

2.3. CLSM Detection of ROS Production

The presence of ROS was detected by using the DCFH2-DA (2′,7′-diclorodihidrofluorescein diacetate) fluorochrome. This compound is able of traversing the cell membrane thanks to its ester group, which is hydrolyzed by esterases in the cell inside to generate DCFH2, that will remain within the cells. Different ROS may oxidize this compound to produce DCF (dichlorofluorescein), a fluorescent component emitting at 520 nm when excited with a 480 nm wavelength. Therefore, the intensity of such fluorescence can be correlated to the ROS content, although neither the origin nor the nature of the ROS involved can be differentiated.
Either pistils or whole flowers of olive were incubated with 50 µM DCFH2-DA in MES-KCl [5 µM KCl, 10 mM MES, 50 µM CaCl2 (pH 6.15)] buffer for 10 min, then washed with MES-KCl buffer for 15 min. Such incubation conditions were similar to those previously described by us and elsewhere [23,24,26]. In order to assess the specific presence of DPI-dependent production of O2●− in olive flowers, parallel samples were incubated with the DPI inhibitor to a concentration of 200 µM (prepared from a 10 mM stock in DMSO) for 1 h prior to the fluorescein treatment. Again, concentrations of chemicals and extension of treatments are based in prior analyses [14,15,22]. Observations were performed using a Nikon C1 confocal microscope (Nikon, Japan) by exciting at 488 nm (Ar-488 laser) and using a small (30 µm) pinhole. Z-stack capture of multiple optical sections was performed, followed by projection using the FreeViewer (v3.90.) software (Nikon). Observations were performed in at least five flowers of the same stage, for each one of three independent experiments. Intensity of the fluorescence was measured using the EZ-C1 FreeViewer software selecting the region of interest (ROI) and analyzing pixel intensity, which was referred to the area of the ROI, therefore calculating the ratio fluorescence intensity/area in arbitrary units. ROIs included separately stigma surface and the anthers, as other olive flower organs showed no fluorescence.

2.4. Light Microscopy (LM) Chromogenic Detection of O2●− Production

In order to determine the production of O2●− in olive flower organs, we used the ability of this anion to reduce the chromogenic compound nitro blue tetrazolium chloride (NBT), to form a colored precipitate (formazan-blue) localizing the places of O2●− production [14,27]. Whole flowers or isolated pistils were used from five developmental stages previously reported [24] on the basic of macroscopic characters. They were submerged in Tris-HCl buffer (pH 7.4) containing 1 mg/mL NBT for 10 min. For inhibition studies, an incubation with 200 µM DPI (from a 10 mM stock in DMSO) for 30 min was performed prior to the incubation with the NBT solution [14]. After NBT incubation, all samples were washed with ultrapure water and then imaged. Control samples were treated with Tris-HCl buffer (pH 7.4) only. Observations were carried out with a stereomicroscope (Motic Europe, Spain) fitted with a digital Nikon Coolpix 4500 camera (Nikon, Japan), using a resolution of 2272 × 1704 dpi. Intensity of the precipitate was measured using the EZ-C1 FreeViewer (v. 3.90) (Nikon) selecting the region of interest (ROI) and analyzing pixel intensity, which was referred to the area of the ROI, therefore calculating the ratio color intensity/area in arbitrary units. ROIs included separately stigma surface and the anthers, as other olive flower organs showed no fluorescence. Observations and measurements were performed in at least five flowers of the same developmental stage, for each one of three independent experiments.

2.5. Transmission Electron Microscopy (TEM) Localization of O2●− Production in Mature Pollen Grains and Pollen Tubes

In order to localize the subcellular production of O2●− in olive pollen grains, we also used the ability of this anion to reduce the chromogenic compound NBT, which was further derived to high-electron components by post-fixation with OsO4. To start the procedure, both mature pollen and germinated pollen samples were slightly fixed using 1% (w/v) paraformaldehyde in 0.1 M sodium-cacodylate buffer (pH 7.2) for 4 h at 4 °C. Fixation was stopped by centrifugation and removal of the supernatant, followed by three consecutive washes with 0.05 M sodium-cacodylate buffer (pH 7.2) for 30 min at 25 °C (washing solution). Next, pollen samples were incubated with a solution of 1 mg/mL NBT in 50 mM Tris-HCl (pH 7.4) buffer, containing 0.2 mM MgCl2 and 1 mM CaCl2, for 5 min at RT. The incubation was stopped again by removing the supernatant after centrifugation, followed by three washes as above.
Samples were then post-fixed with 1% OsO4 in washing solution for 1 h at 4 °C and further rinsed (3×) in washing solution. Samples were then dehydrated through an ethanol series and embedded in Epon resin using standard procedures. Polymerization, generation of sections and contrast of Ni grids with uranyl acetate and lead citrate were performed as described by [28]. Observations were carried out in a JEM-1011 transmission electron microscope (Jeol Ltd., Tokyo, Japan) operating at 80 kV. Images were captured with a Mega View III camera using the iTEM software v 5.0 (Build 1032) (Soft Imaging System GmbH, Muenster, Germany).
Control samples were carried out by omitting the NBT incubation step. In addition, a second control was performed by incubating the samples with 200 µM DPI (prepared from a stock of 10 mM DPI in DMSO) for 30 min at RT prior to the incubation with the NBT solution.
Densitometry of electron-dense deposits close to the plasma membrane in NBT-treated pollen samples were plotted using the tool “Plot Lane” of the Quantity One 4.6.2 software (Bio-Rad, Hercules, CA, USA), and were compared with control DPI-treated samples.

2.6. Statistical Methods

All data are presented as the mean values ± standard deviation (SD). The normality of variables was assessed using Q-Q graphs. Non-parametric analysis (Mann–Whitney U test) were used to assess differences between control and DPI-treated samples. Statistical analyses were conducted at p < 0.05 level using the SPSS Statistics v27 software (IBM, Armonk, NY, USA).

3. Results

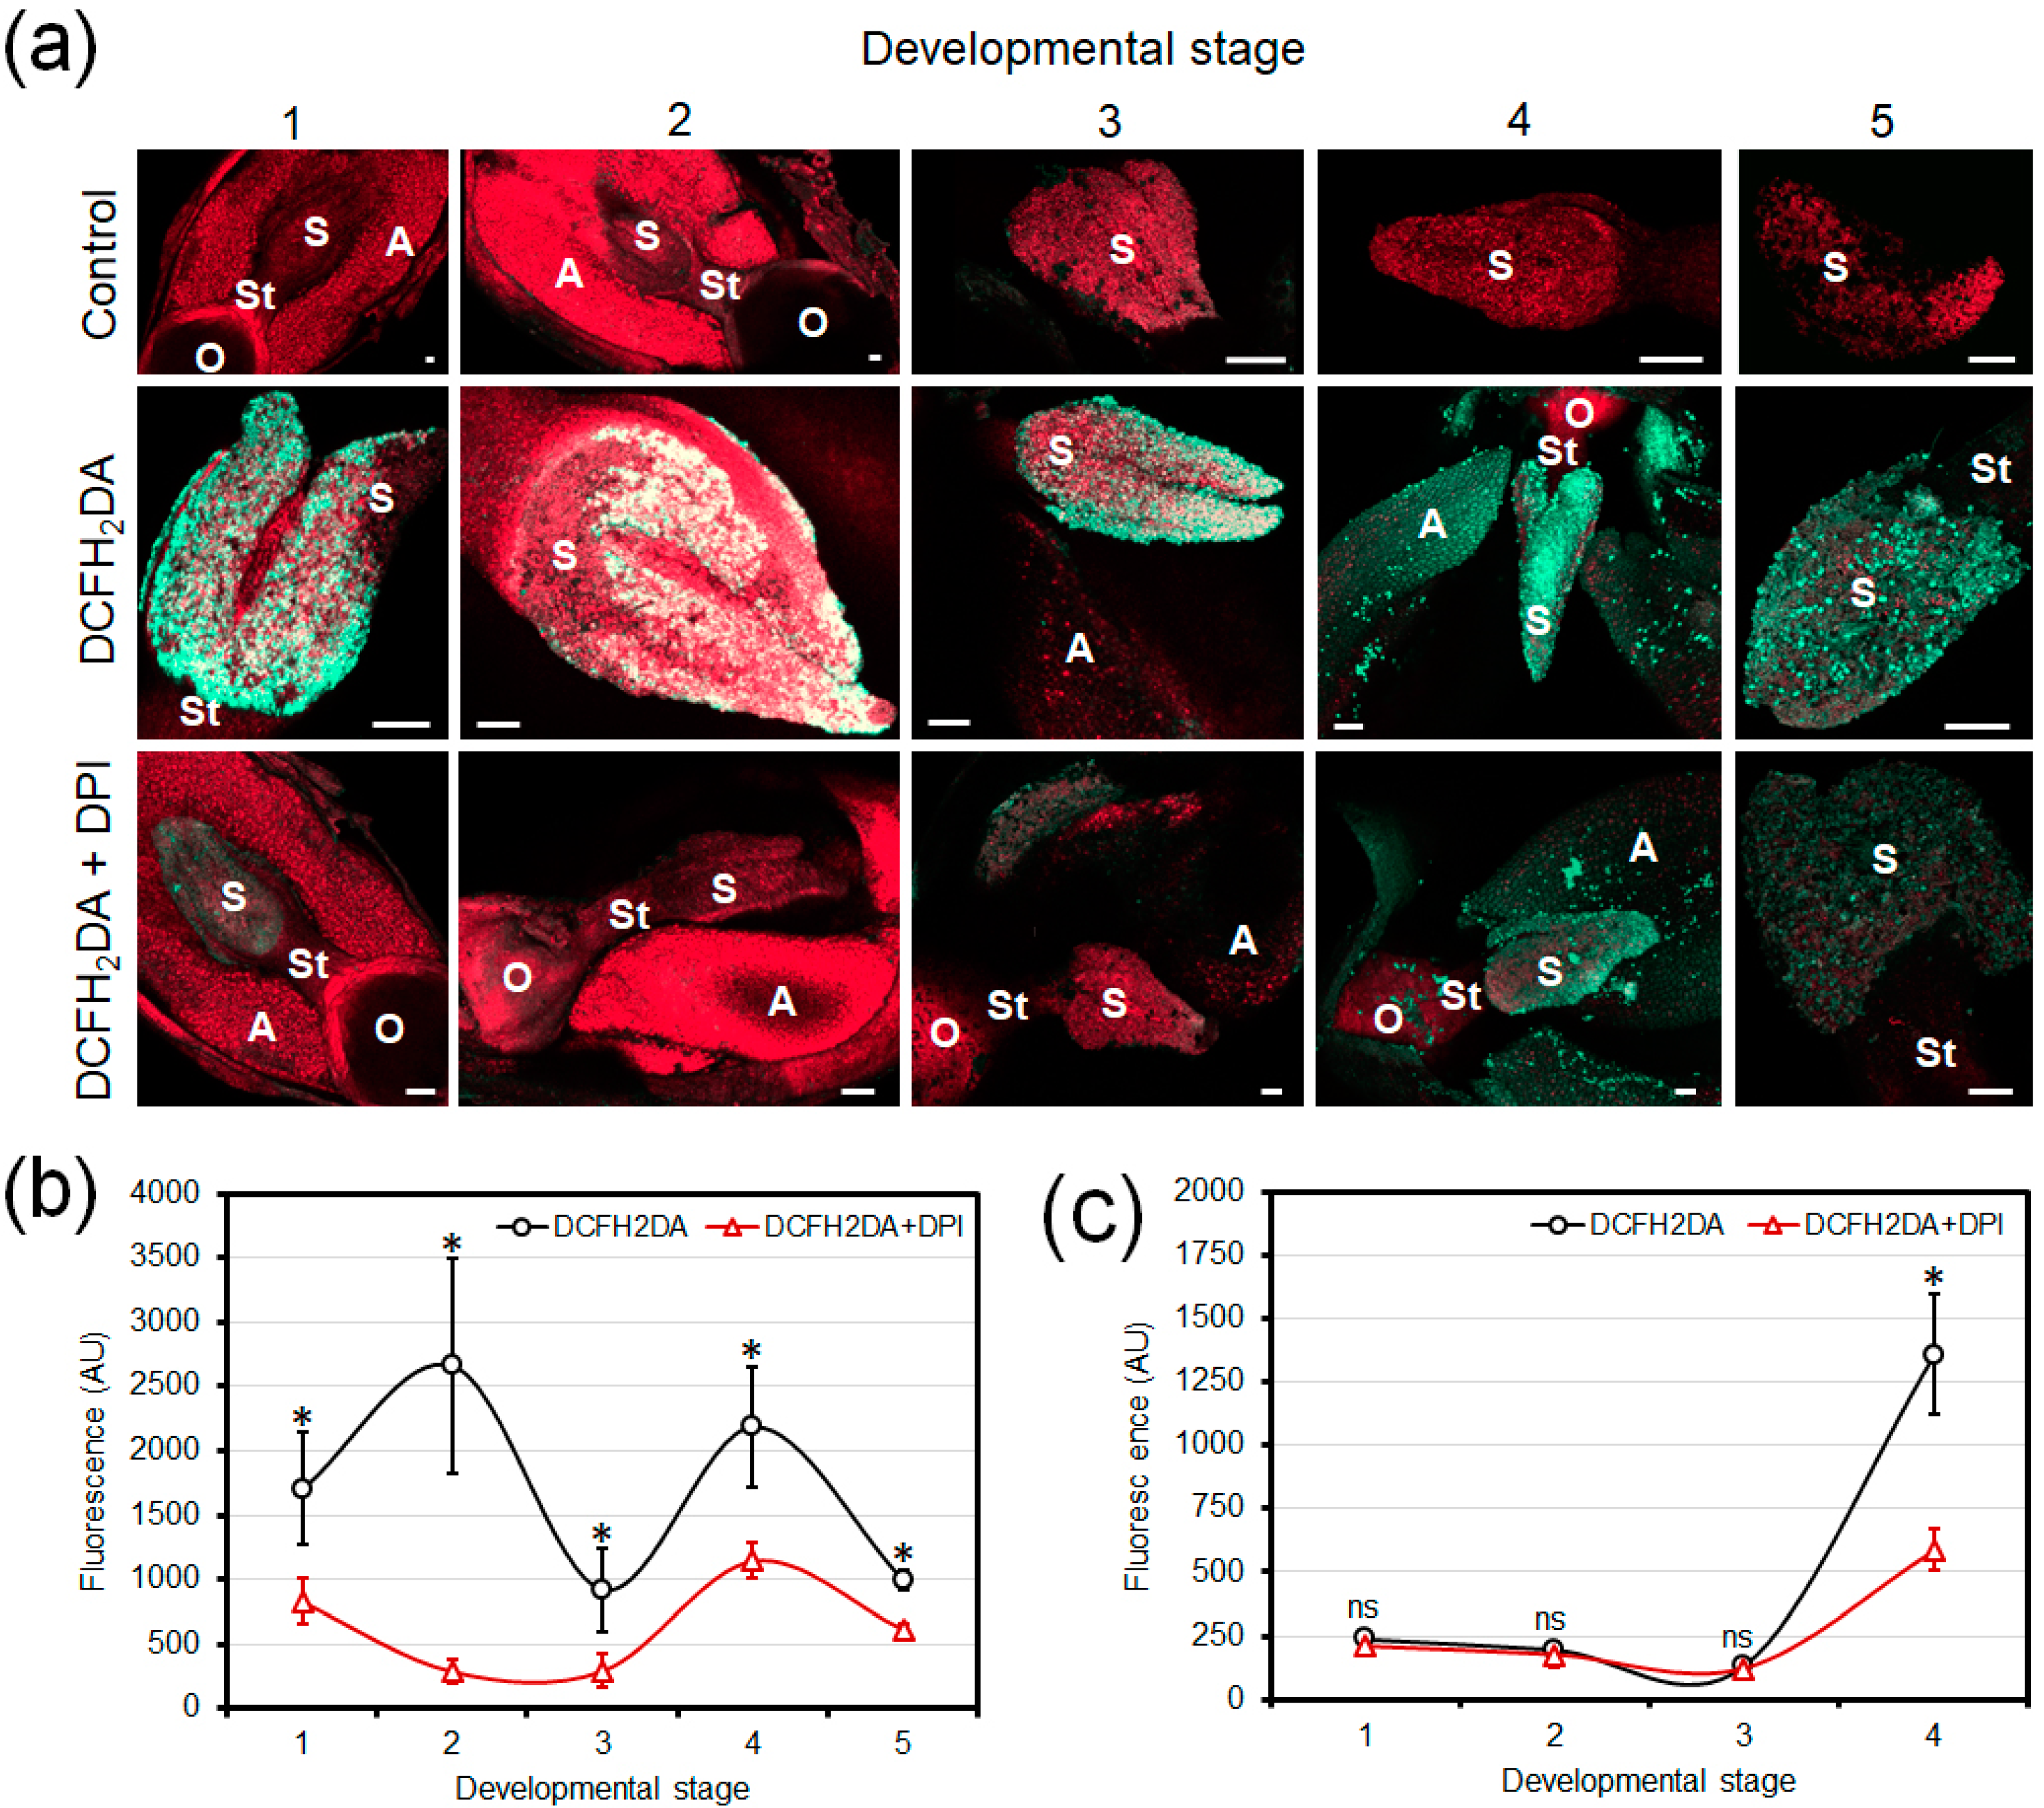
3.1. Fluorescence Detection of Developmental Production of ROS in Olive Floral Organs

Fluorescent signal was exclusively detected within the emission range of 515–560 nm (green color), indicating the oxidation of DCFH2-DA to DCF in those places of ROS production. Autofluorescence arising from the presence of chlorophyll and other pigments was also detected and labeled in red.
The incubation of the samples with DCFH2-DA revealed an accumulation of ROS in olive flower organs, mainly in the stigma surface and in the pollen grains attached to it. A changing pattern of fluorescence (i.e., ROS levels) in the stigma surface was observed, which varied throughout the different stages of flower development (Figure 1). Thus, two peaks of ROS production were detected, a first one at stage 2 (white bud), and a second peak, similar in intensity to the first, at stage 4 (dehiscent anther) to reach a minimum at the last developmental stage (senescent flower). Green fluorescence was specific of the stigma since no signal was detected in either the style or the ovary, independently of the stage visualized. On the other hand, ROS production only appeared to be significant at the time of dehiscence in the developing anthers (stage 4).
The incubation of samples with 200 µM DPI, a Rboh inhibitor, prior to DCFH2-DA treatment resulted in a sharp decrease of the green fluorescence present in the olive stigma surface at all stages of flower development analyzed, as well as in the dehiscent anthers (stage 4).

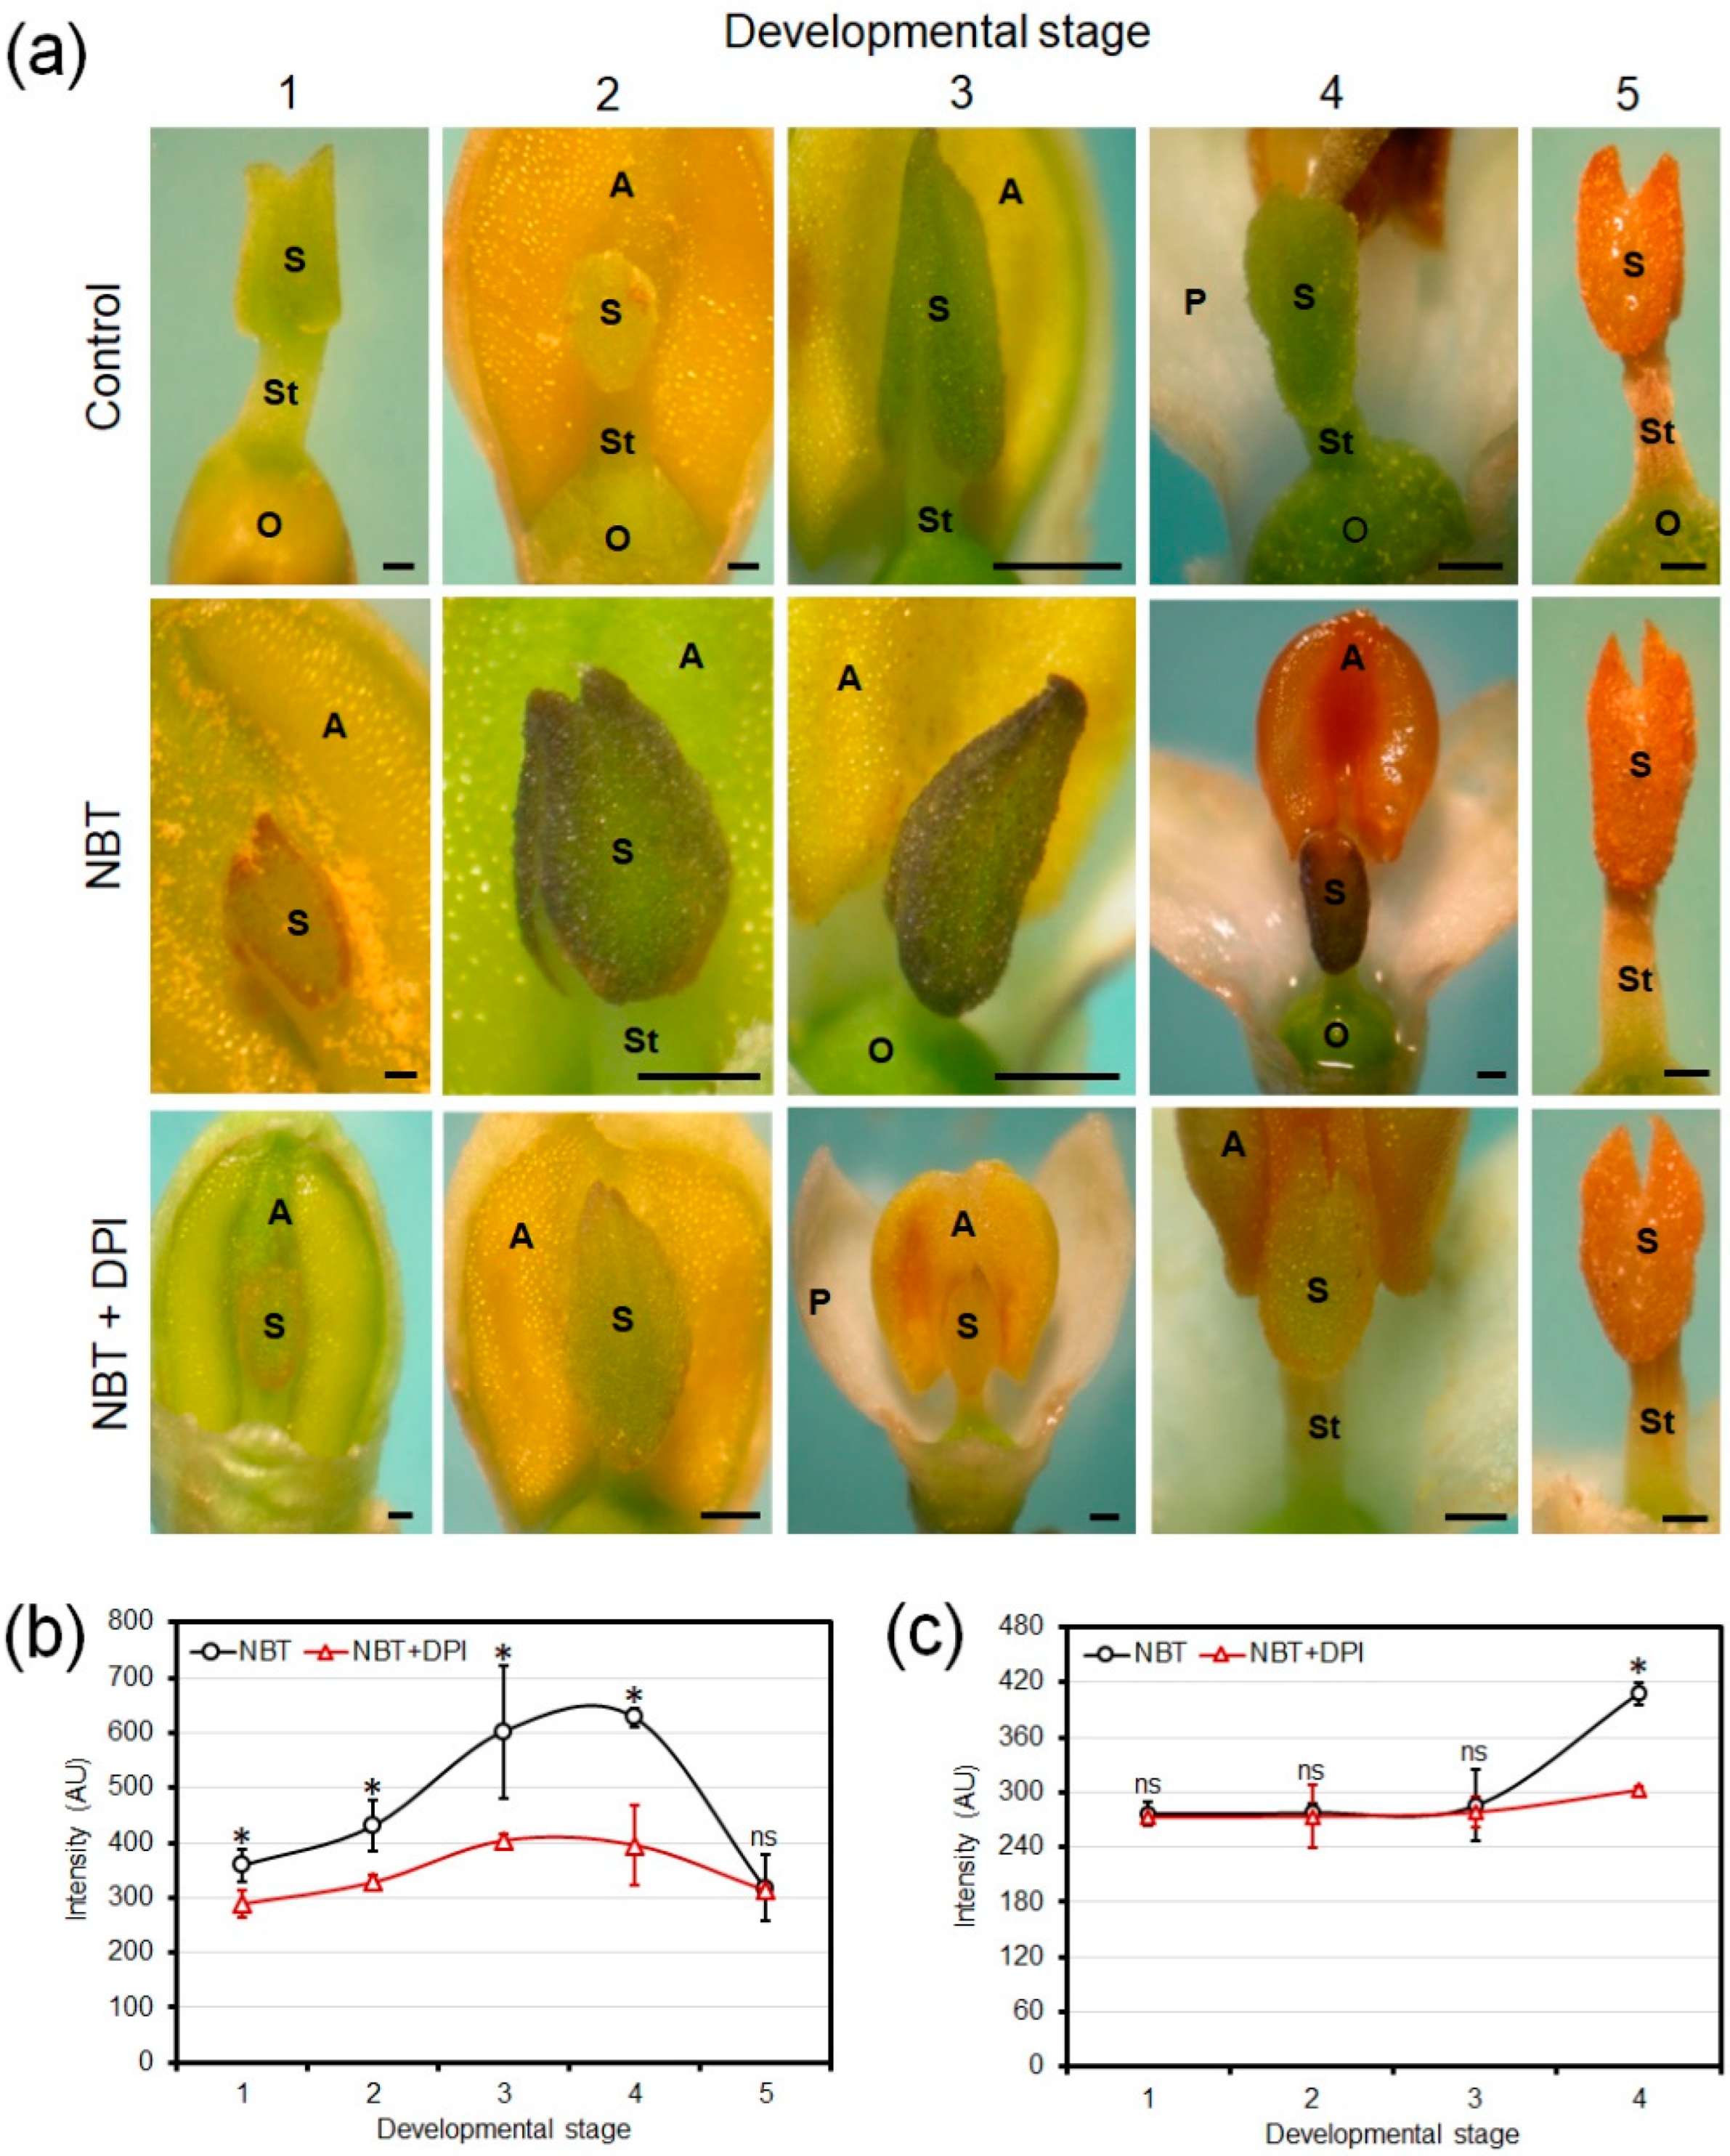
3.2. Chromogenic Detection of Developmental Production of Superoxide in Olive Floral Organs

Superoxide anion (O2●−) formation sites in olive reproductive organs were detected by NBT reduction. This compound is reduced by O2●− until it forms a blue formazan precipitate, indicating the places of superoxide production (Figure 2). A pattern was observed that varied in the different stages of development of the olive flower. In the same way that occurred with the detection of ROS by fluorescence, the location of a dark brown-purple precipitate was limited to the stigma, with no labeling marking the style or the ovary within the female organ. The intensity of the precipitate in treated stigmas gradually increased from stage 1 (green bud) until reaching a maximum at stage 4 (dehiscent anther), and then to decrease again reaching a minimum at stage 5 (senescent flower). In all floral stages, the decrease in signal intensity was evident when samples were preincubated with the DPI inhibitor.
In the anther, the presence of precipitate was only significant at stage 4 (dehiscent anther). Moreover, there was a noticeable decrease in the precipitate amount when incubating samples with DPI. Short and identical incubation times were used for all experiments, since an increase of the exposure time to tetrazolium salts produced the complete coloration of organs and its degradation.

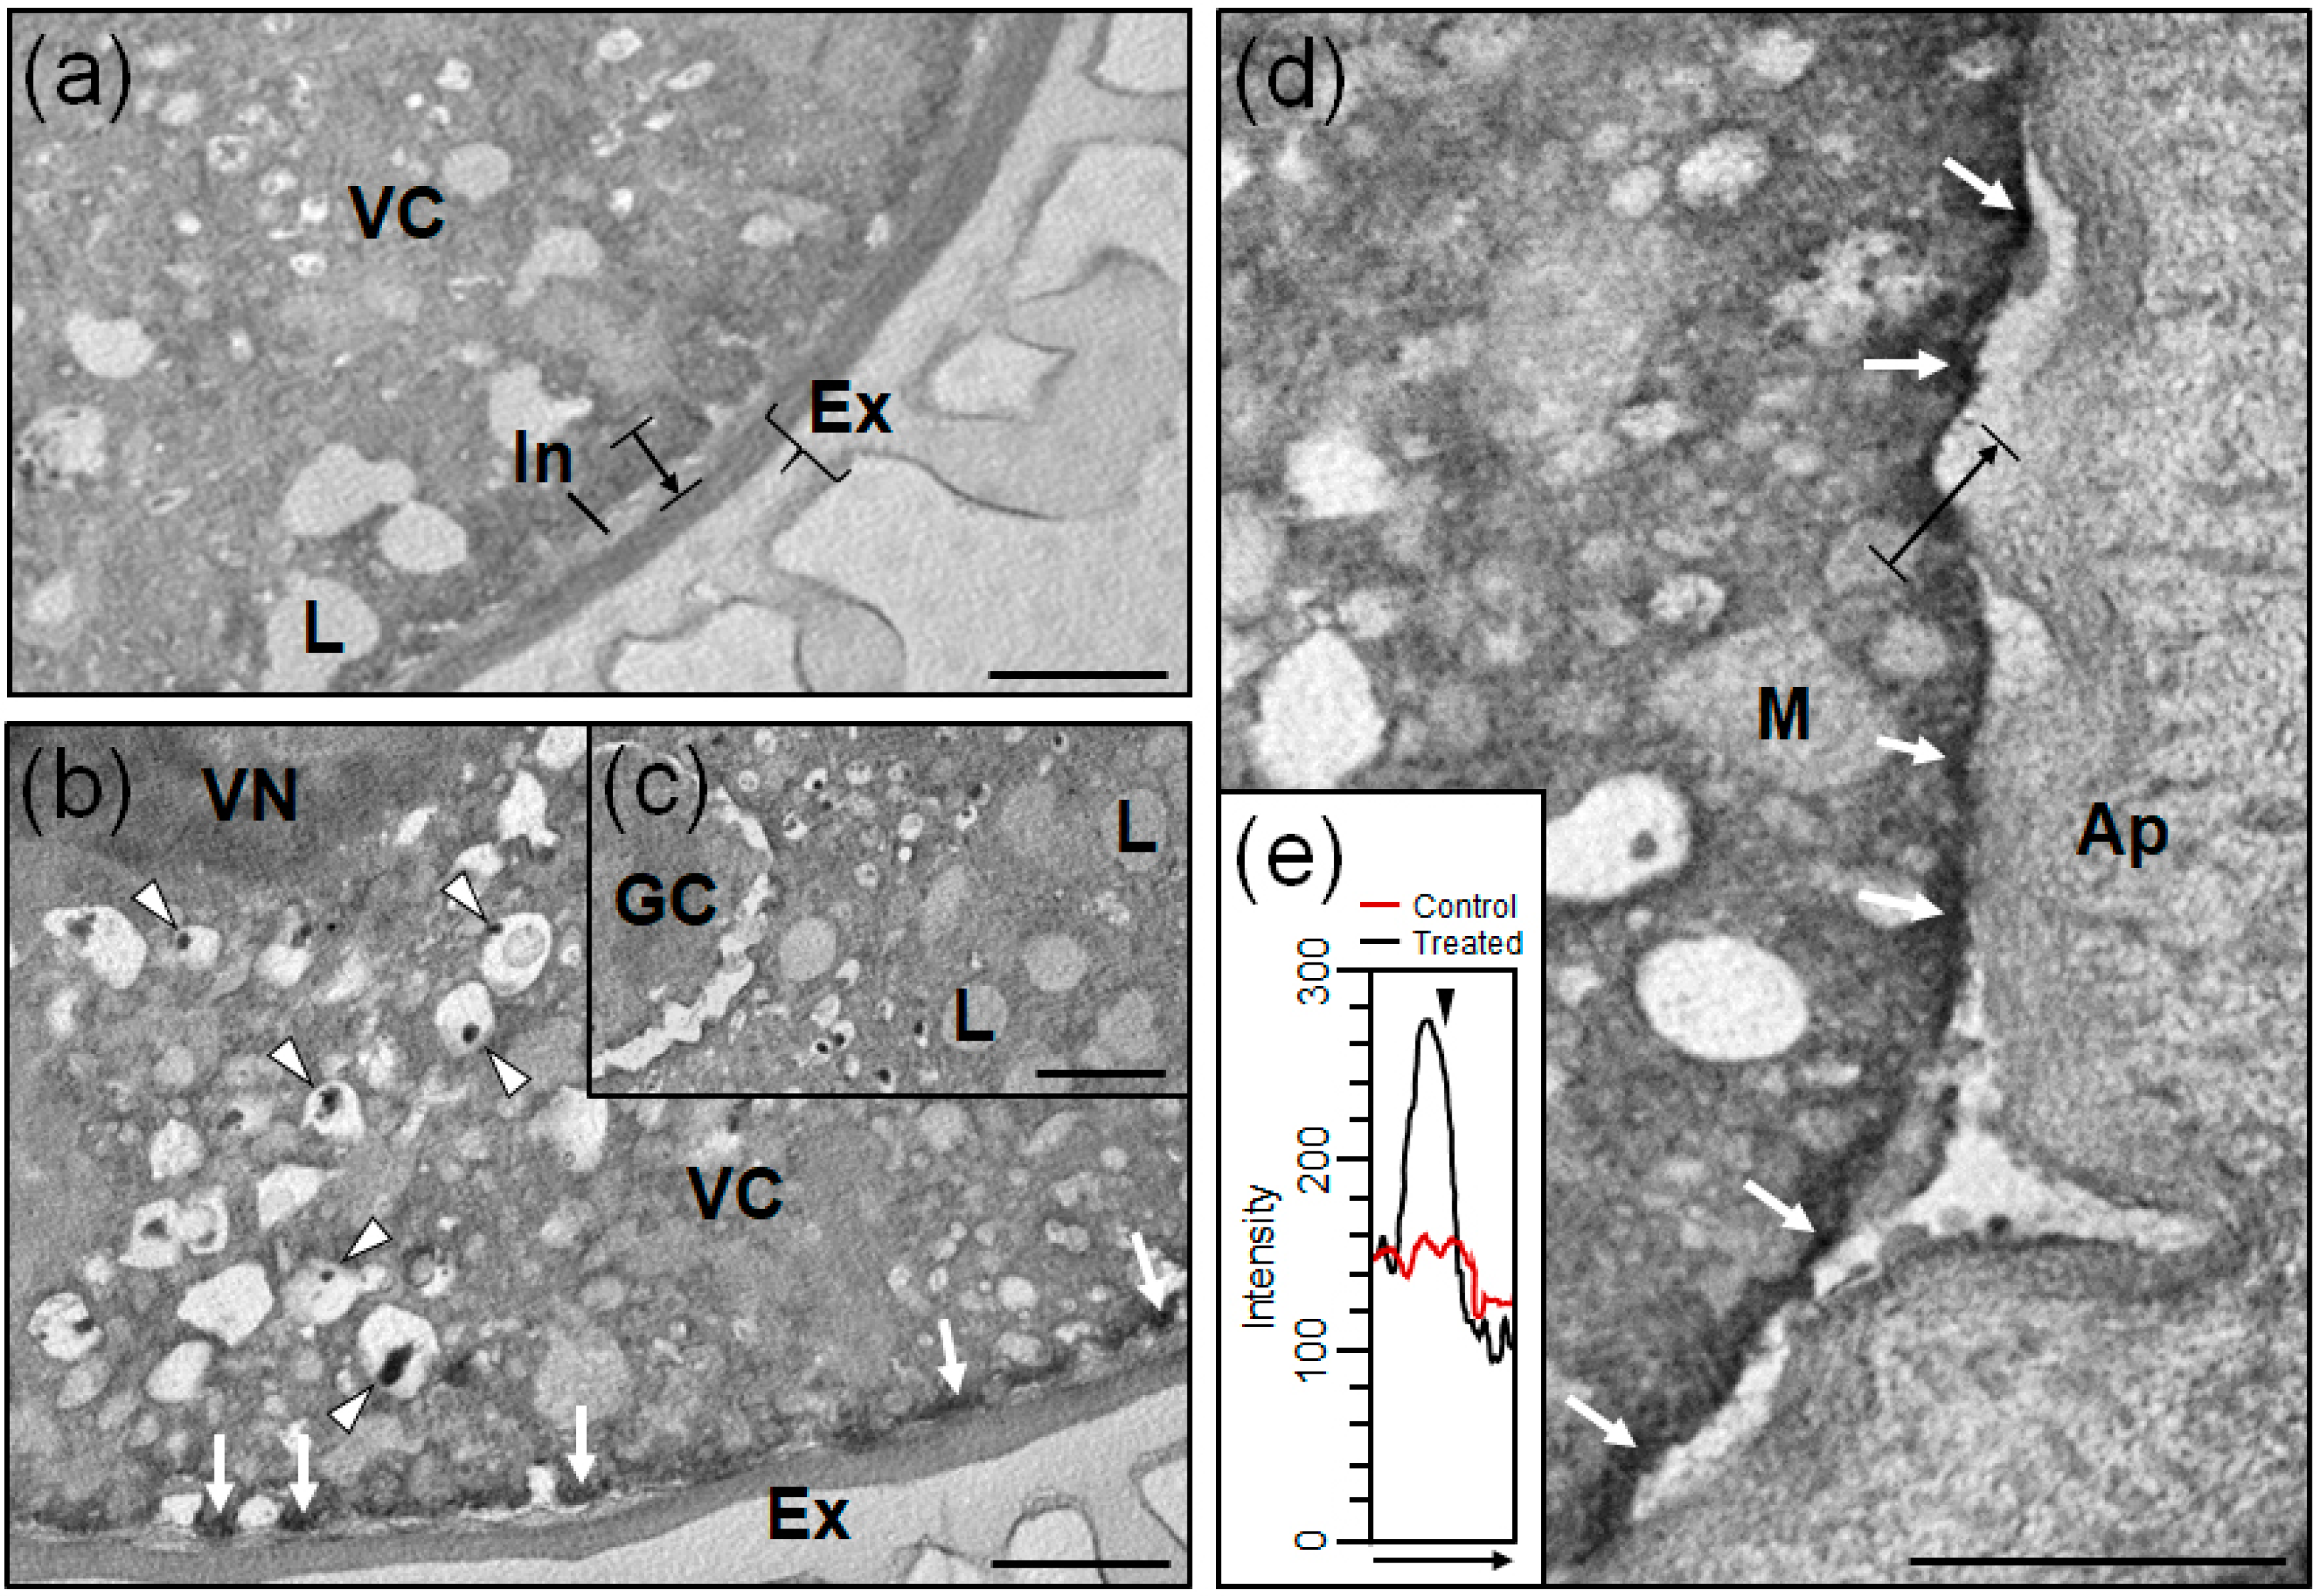
3.3. Ultrastructural Localization of Superoxide in Olive Pollen Grains

Subcellular localization of the O2●− molecule in the mature pollen grain was carried out by treatment of the olive pollen samples with nitroblue tetrazolium (NBT). Too long-time exposure to NBT reagent led to blackened images, so an optimal incubation time with NBT was critical. Overall, NBT-treated samples gave more contrasted images than control samples, probably due to a basal pattern of O2●− presence in the cytoplasm of the vegetative cell. Increased accumulation of O2●− in several regions of the mature pollen grains, likely representing the superoxide-generation sites prior to diffusion or further metabolism was visualized at the transmission electron microscope as deposits of higher electron-density (Figure 3), which were mostly located in close proximity with the plasma membrane, although some precipitate appeared in association with the outer region of vesicles. Other identified structures like the vegetative nuclei and the generative cell, lipid bodies, mitochondria or the pollen wall (i.e., intine and exine) only exhibited background electron density. Neither the sections corresponding to samples untreated with NBT nor those corresponding to DPI+NBT-treated samples (not shown) presented precipitate. These two types of samples were practically indistinguishable.

3.4. Ultrastructural Localization of Superoxide in Olive Pollen Tubes

The accumulation of O2●− in the germinated pollen was visualized at the TEM also as electron-dense deposits (Figure 4), which were also highly abundant in the protruding vegetative cell cytoplasm close to the plasma membrane. In this case, other subcellular structures like the endoplasmic reticulum (alone, or associated to storage lipids), and some organelles similar to undifferentiated mitochondria were labeled over the background (Figure 4). The vegetative nucleus, the generative cell, other organelles like lipid bodies and the pollen tube wall were clean of enhanced precipitate. As in the mature pollen grain, neither the sections corresponding to control (untreated with NBT) samples nor those corresponding to DPI+NBT-treated samples (not shown) presented precipitate.

4. Discussion

The localization of ROS in the reproductive tissues of the olive tree by means of DCFH2-DA shows that the stigma and anther tissues present high levels of these molecules. A large part of these ROS seems to correspond to superoxide anion (O2●−), as shown by NBT reduction experiments, although the massive presence of other reactive oxygen species, mainly H2O2, cannot be ruled out [24]. In addition to this specific spatial distribution, ROS undergo a clear temporal evolution throughout the development of floral organs, which seems to indicate that these molecules play important roles in reproductive biology. One of the questions that arise in relation to the presence of ROS in reproductive tissues deals with its origin. The superoxide anion (O2●−) is one of the most important ROS, as a product of the reduction of molecular oxygen by one electron, which occurs widely in nature. In the case of reproductive tissues, the marked reduction in the presence of ROS detectable with DCFH2-DA and of O2●− detectable with NBT after the addition of DPI suggests that much of this superoxide is generated by the action of a NADPH oxidase (Rboh) or other flavin oxidase activity. DPI has been described as a highly specific inhibitor of these enzymes in mammalian neutrophils by binding to the two structural components of the protein [29]. Our recent description of Rboh activity in olive pollen (OeRbohH, [22]), which displays sensitivity to DPI, may explain the changes in fluorescence and NBT histochemical analyses observed in pollen, as described here.
The present work describes differences between the localization patterns of ROS in general, and of superoxide in particular (as a marker of Rboh activity), throughout the stages of stigma development. The levels of both types of molecules does not maintain a parallel evolution throughout floral development. For example, the fluorescence due to ROS is maximum in the “white bud” stage and minimum in the “recently opened flower” stage, while in the case of superoxide, the maximum concentration is progressively reached in the “dehiscent anthers” stage. These differences may correspond essentially to the presence of other ROS such as H2O2 and undoubtedly reflect the activity of other antioxidant enzymes such as superoxide dismutase and peroxidase, which have yet to be established. The biological significance of the presence of these ROS may differ between the earliest stages of flower development (defense function, similar to the Rboh activity present in the redox cycle of nectaries, in which it actively participates in the protection against pathogens [27], the stages in which there is an intense pollen-pistil interaction and the stages in which tissue senescence begins [24].
The results of the use of both methods (fluorescence and chromogenic detection of superoxide) can be considered comparable, and similar trends were observed after quantification. However, slight differences like the presence of two peaks of superoxide generation observed after fluorescence quantification, which were not detected with the chromogenic substrate, may indicate a higher ability of the fluorochrome to detect minor changes, due to the high dynamic range of fluorescence detection in comparison with color detection of chromogens.
Both methods, which are here used at low magnifications, provide useful information regarding the distribution of these ROS in the different organs of the flower. However, they can deliver limited subcellular information only, even when used at higher magnifications [24]. As an example, pollen grains over the stigma surface can only be poorly distinguished at stages 4 and 5 of Figure 1 and Figure 2. This is the major reason of developing a specific method for identification of superoxide generation at ultrastructural level, based on the use of transmission electron microscopy.
At the subcellular level, the treatment of pollen with NBT allowed the localization of precipitate due to the presence of superoxide in the plasma membrane of the mature and germinated pollen, which has also been found in the endoplasmic reticulum and mitochondria. The origin of this O2●− can be diverse, and it is difficult to be determined due to the limited permeability of the pollen grain to inhibitors and even to NBT [30]. In this case, it is not excluded that the detection of superoxide generated in the electron transport chain of mitochondria may occur [31]. Such O2●− would not be a consequence of the activity of a NADPH oxidase in this case. The fractionation of plant tissues has shown that Rboh enzymes are located in the plasma membrane [19,32], and this distribution may be asymmetric [33]. Rbohs can even mediate the transfer of electrons to produce O2●− in the extracellular space, propagating these types of signals up to several cells away [34]. The plasma membrane is impermeable to superoxide in animals due to its negative charge at physiological pH (pKa is 4.8). In plants, the extracellular pH is close to 5, and 16% of the superoxide is in the form of hydroperoxyl capable of crossing the membrane. Once in the cytoplasm, SOD will dismutate superoxide to hydrogen peroxide. Our localization is fully compatible with these observations.
In humans, NOX5, which is the most structurally related form of Rboh in plants, has been detected inside the cell, specifically in the endoplasmic reticulum [35,36]. On the other hand, the main NOX2 subunits in endothelial cells colocalize with a perinuclear distribution, and exist as a functional intracellular complex associated with the cytoskeleton [37]. Rboh-active endosomes have also been identified in plants [38,39,40]. Such observations are also in good agreement with the localization of precipitate close to the vesicles boundaries that we describe here. Dark discrete electron-dense spots inside the vesicles should not be considered a consequence of superoxide generation, as they represent normal features of olive and other pollen grains ultrastructure, classically described before [41], and which are likely composed of calcium, magnesium and phosphorus salts [42].
The analysis of OeRbohH activity during pollen grain germination and pollen tube growth carried out by [22], offers a series of interesting results to determine the possible role of ROS in pollen functionality. Firstly, it is clear that OeRbohH activity is essential for pollen to germinate and generate an effective pollen tube, since treatment with the DPI inhibitor either prevents pollen grain germination or significantly reduces the elongation capacity of the pollen tube. Superoxide generation by OeRbohH is also quite polarized towards the apical growth zones of the tube, and is even focused to the apical end of the pollen tube segmented by callose plugs. This is a characteristic already observed in other species such as Nicotiana tabacum [14].
All these results probably relate the Rboh activity to the polar growth capacity of the pollen tube. There is a possible analogy with the growth of Arabidopsis root hairs, which requires the production of ROS by the Rboh homologue AtrbohC [33]. The methods described in the present work (e.g., subcellular analysis of superoxide accumulation) will enable further research into these aspects, and for example identify specific organelles involved in the accumulation of superoxide.
The future characterization of superoxide-generating activities in the stigma, whose tissues make the greatest contribution to the formation of this molecule (as shown in this report), is of crucial importance. The study of this activity is initially a challenge, given that there are a number of factors such as the limitation of the amount of material available, and the fact that gynoecium extracts contain a high level of secondary metabolites (phenols, lipids, polysaccharides) that require an additional fine-tuning of the procedures for biochemical and molecular analysis.

5. Conclusions

Several reproductive tissues (stigma and anthers) of the olive tree show high levels of reactive oxygen species, which are detectable either by fluorescence or by using histochemical stains, and display a specific spatial and temporal distribution. The intensity of the stain is highly modulated by DPI, a known inhibitor of NADPH oxidase (NOX) activity. Therefore, labeling can be associated to the generation of O2●−.
The accumulation of superoxide anion in the pollen grain at the subcellular level takes place in the plasma membrane of the mature and germinated pollen. Hydration and activation of pollen metabolism through germination induces additional localization of O2●− in the endoplasmic reticulum and mitochondria. The origin of this O2●− might be diverse and not only attributable to NOX activity.

Author Contributions

Conceptualization, J.d.D.A. and M.J.J.-Q.; Light Microscopy, M.J.J.-Q., E.L.-C.; Transmission Electron Microscopy, J.d.D.A. and A.J.C.; writing—original draft preparation, M.J.J.-Q.; writing—review and editing, J.d.D.A. and A.J.C.; funding acquisition, J.d.D.A. All authors have read and agreed to the published version of the manuscript.

Funding

This research was funded by research projects BFU-2016-77243-P, PID2020-113324GB-100 of the Spanish Ministry of Science, Innovation and Universities (MICIIN)/State Research Agency (AGE)/European Regional Development Fund (ERDF)/European Union (EU), and P18-RT-1577 and PYC20 RE 009 CSIC. EEZ of the Junta de Andalucía/European Regional Development Fund (ERDF)/European Union (EU).

Institutional Review Board Statement

Not applicable.

Informed Consent Statement

Not applicable.

Data Availability Statement

Not applicable.

Acknowledgments

The authors would like to acknowledge the support of the Confocal and Transmission Electron Microscopy (CTEM) facility of the EEZ-CSIC.

Conflicts of Interest

The authors declare no conflict of interest.

References

  1. Traverso, J.A.; Pulido, A.; Rodriguez-Garcia, M.I.; Alche, J.D. Thiol-based redox regulation in sexual plant reproduction: New insights and perspectives. Front. Plant Sci. 2013, 4, 465. [Google Scholar] [CrossRef] [PubMed] [Green Version]
  2. Domingos, P.; Prado, A.M.; Wong, A.; Gehring, C.; Feijo, J.A. Nitric oxide: A multitasked signaling gas in plants. Mol. Plant 2015, 8, 506–520. [Google Scholar] [CrossRef] [PubMed] [Green Version]
  3. Serrano, I.; Romero-Puertas, M.C.; Sandalio, L.M.; Olmedilla, A. The role of reactive oxygen species and nitric oxide in programmed cell death associated with self-incompatibility. J. Exp. Bot. 2015, 66, 2869–2876. [Google Scholar] [CrossRef] [Green Version]
  4. Breygina, M.; Klimenko, E. ROS and Ions in Cell Signaling during Sexual Plant Reproduction. Int. J. Mol. Sci. 2020, 21, 9476. [Google Scholar] [CrossRef]
  5. Sharma, P.; Jha, A.B.; Dubey, R.S.; Pessarakli, M. Reactive oxygen species, oxidative damage, and antioxidative defense mechanism in plants under stressful conditions. J. Bot. 2012, 2012, 217037. [Google Scholar] [CrossRef] [Green Version]
  6. Jimenez-Quesada, M.J.; Traverso, J.A.; Alché, J.D. NADPH oxidase dependent superoxide production in plant reproductive tissues. Front. Plant Sci. 2016, 7, 00359. [Google Scholar] [CrossRef] [Green Version]
  7. Hao, H.; Fan, L.; Chen, T.; Li, R.; Li, X.; He, Q.; Botella, M.A.; Lin, J. Clathrin and membrane microdomains cooperatively regulate RbohD dynamics and activity in Arabidopsis. Plant Cell 2014, 26, 1729–1745. [Google Scholar] [CrossRef] [Green Version]
  8. Takeda, S.; Gapper, C.; Kaya, H.; Bell, E.; Kuchitsu, K.; Dolan, L. Local positive feedback regulation determines cell shape in root hair cells. Science 2008, 319, 1241–1244. [Google Scholar] [CrossRef]
  9. Ogasawara, Y.; Kaya, H.; Hiraoka, G.; Yumoto, F.; Kimura, S.; Kadota, Y.; Hishinuma, H.; Senzaki, E.; Yamagoe, S.; Nagata, K.; et al. Synergistic activation of the Arabidopsis NADPH oxidase AtrbohD by Ca2+ and phosphorylation. J. Biol. Chem. 2008, 283, 8885–8892. [Google Scholar] [CrossRef] [PubMed] [Green Version]
  10. Drerup, M.M.; Schlücking, K.; Hashimoto, K.; Manishankar, P.; Steinhorst, L.; Kuchitsu, K.; Kudla, J. The calcineurin B-like calcium sensors CBL1 and CBL9 together with their interacting protein kinase CIPK26 regulate the Arabidopsis NADPH oxidase RBOHF. Mol. Plant 2013, 6, 559–569. [Google Scholar] [CrossRef] [Green Version]
  11. Ono, E.; Wong, H.L.; Kawasaki, T.; Hasegawa, M.; Kodama, O.; Shimamoto, K. Essential role of the small GTPase Rac in disease resistance of rice. Proc. Natl. Acad. Sci. USA 2001, 98, 759–764. [Google Scholar] [CrossRef] [PubMed]
  12. Zhang, Y.; Zhu, H.; Zhang, Q.; Li, M.; Yan, M.; Wang, R.; Wang, L.; Welti, R.; Zhang, W.; Wang, X. Phospholipase Dα1 and phosphatidic acid regulate NADPH oxidase activity and production of reactive oxygen species in ABA-mediated stomatal closure in Arabidopsis. Plant Cell 2009, 21, 2357–2377. [Google Scholar] [CrossRef] [Green Version]
  13. Yun, B.W.; Feechan, A.; Yin, M.; Saidi, N.B.; Le Bihan, T.; Yu, M.; Moore, J.W.; Kang, J.G.; Kwon, E.; Spoel, S.H.; et al. S-nitrosylation of NADPH oxidase regulates cell death in plant immunity. Nature 2011, 478, 264–268. [Google Scholar] [CrossRef]
  14. Potocký, M.; Jones, M.A.; Bezvoda, R.; Smirnoff, N.; Žárský, V. Reactive oxygen species produced by NADPH oxidase are involved in pollen tube growth. New Phytol. 2007, 174, 742–751. [Google Scholar] [CrossRef]
  15. Potocký, M.; Pejchar, P.; Gutkowska, M.; Jiménez Quesada, M.J.; Potocká, A.; Alché, J.D.; Kost, B.; Zárský, V. NADPH oxidase activity in pollen tubes is affected by calcium ions, signaling phospholipids and Rac/Rop GTPases. J. Plant Physiol. 2012, 169, 1654–1663. [Google Scholar] [CrossRef]
  16. Boisson-Dernier, A.; Lituiev, D.S.; Nestorova, A.; Franck, C.M.; Thirugnanarajah, S.; Grossniklaus, U. ANXUR receptor-like kinases coordinate cell wall integrity with growth at the pollen tube tip via NADPH oxidases. PLoS Biol. 2013, 11, e1001719. [Google Scholar] [CrossRef] [PubMed] [Green Version]
  17. Kaya, H.; Nakajima, R.; Iwano, M.; Kanaoka, M.M.; Kimura, S.; Takeda, S.; Kawarazaki, T.; Senzaki, E.; Hamamura, Y.; Higashiyama, T.; et al. Ca2+-activated reactive oxygen species production by Arabidopsis RbohH and RbohJ is essential for proper pollen tube tip growth. Plant Cell 2014, 26, 1069–1080. [Google Scholar] [CrossRef] [PubMed] [Green Version]
  18. Lassig, R.; Gutermuth, T.; Bey, T.D.; Konrad, K.R.; Romeis, T. Pollen tube NAD (P) H oxidases act as a speed control to dampen growth rate oscillations during polarized cell growth. Plant J. 2014, 78, 94–106. [Google Scholar] [CrossRef] [PubMed]
  19. Sagi, M.; Fluhr, R. Production of reactive oxygen species by plant NADPH oxidases. Plant Physiol. 2006, 141, 336–340. [Google Scholar] [CrossRef] [Green Version]
  20. Speranza, A.; Crinelli, R.; Scoccianti, V.; Geitmann, A. Reactive oxygen species are involved in pollen tube initiation in kiwifruit. Plant Biol. 2012, 14, 64–76. [Google Scholar] [CrossRef]
  21. Kaya, H.; Iwano, M.; Takeda, S.; Kanaoka, M.M.; Kimura, S.; Abe, M.; Kuchitsu, K. Apoplastic ROS production upon pollination by RbohH and RbohJ in Arabidopsis. Plant Signal. Behav. 2015, 10, e989050. [Google Scholar] [CrossRef] [PubMed] [Green Version]
  22. Jiménez-Quesada, M.J.; Traverso, J.A.; Potocký, M.; Zarsky, V.; Alché, J.D. Generation of superoxide by OeRbohH, a NADPH oxidase activity during olive (Olea europaea L.) pollen development and germination. Front. Plant Sci. 2019, 10, 1149. [Google Scholar] [CrossRef] [PubMed] [Green Version]
  23. Zafra, A.; Rejón, J.D.; Hiscock, S.J.; Alché, J.D. Patterns of ROS Accumulation in the Stigmas of Angiosperms and Visions into Their Multi-Functionality in Plant Reproduction. Front. Plant Sci. 2016, 7, 1112. [Google Scholar] [CrossRef] [PubMed] [Green Version]
  24. Zafra, A.; Rodríguez-García, M.I.; Alché, J.D. Cellular localization of ROS and NO in olive reproductive tissues during flower development. BMC Plant Biol. 2010, 10, 36. [Google Scholar] [CrossRef] [Green Version]
  25. M’rani-Alaoui, M.; Castro, A.; Alché, J.D.; Wang, W.; Fernández, M.C.; Rodríguez-García, M.I. Expression of ole E 1, the major olive pollen allergen, during in-vitro pollen germination. Acta Hortic. 2002, 586, 465–468. [Google Scholar] [CrossRef] [Green Version]
  26. McInnis, S.M.; Desikan, R.; Hancock, J.T.; Hiscock, S.J. Production of ROS and RNS by angiosperm stigmas and pollen: Potential signalling crosstalk? New Phytol. 2006, 172, 221–228. [Google Scholar] [CrossRef]
  27. Carter, C.; Healy, R.; O’Tool, N.M.; Naqvi, S.S.; Ren, G.; Park, S.; Beattie, G.A.; Horner, H.T.; Thornburg, R.W. Tobacco nectaries express a novel NADPH oxidase implicated in the defense of floral reproductive tissues against microorganisms. Plant Physiol. 2007, 143, 389–399. [Google Scholar] [CrossRef]
  28. Rodriguez-Garcia, M.I.; Fernandez, M.C.; Alché, J.D.; Olmedilla, A. Endoplasmic reticulum as a storage site for allergenic proteins in pollen grains of several Oleaceae. Protoplasma 1995, 197, 111–116. [Google Scholar] [CrossRef]
  29. Doussiere, J.; Gaillard, J.; Vignais, P.V. The heme component of the neutrophil NADPH oxidase complex is a target for aryliodonium compounds. Biochemistry 1999, 38, 3694–3703. [Google Scholar] [CrossRef]
  30. Bernas, T.; Dobrucki, J.W. The role of plasma membrane in bioreduction of two tetrazolium salts, MTT and CTC. Arch. Biochem. Biophys. 2000, 380, 108–116. [Google Scholar] [CrossRef]
  31. Overmyer, K.; Brosché, M.; Kangasjärvi, J. Reactive oxygen species and hormonal control of cell death. Trends Plant Sci. 2003, 8, 335–342. [Google Scholar] [CrossRef]
  32. Sagi, M.; Fluhr, R. Superoxide production by plant homologues of the gp91phox NADPH oxidase. Modulation of activity by calcium and by tobacco mosaic virus infection. Plant Physiol. 2001, 126, 1281–1290. [Google Scholar] [CrossRef] [Green Version]
  33. Foreman, J.; Demidchik, V.; Bothwell, J.H.; Mylona, P.; Miedema, H.; Torres, M.A.; Linstead, P.; Costa, S.; Brownlee, C.; Jones, J.D.G.; et al. Reactive oxygen species produced by NADPH oxidase regulate plant cell growth. Nature 2003, 422, 442–446. [Google Scholar] [CrossRef]
  34. Allan, A.C.; Fluhr, R. Two distinct sources of elicitated reactive oxygen species in tobacco epidermal cells. Plant Cell 1997, 9, 1559–1572. [Google Scholar] [CrossRef] [PubMed]
  35. Jagnandan, D.; Church, J.E.; Bánfi, B.; Stuehr, D.J.; Marrero, M.B.; Fulton, D.J. Novel mechanism of activation of NADPH oxidase 5. Calcium sensitization via phosphorylation. J. Biol. Chem. 2007, 282, 6494–6507. [Google Scholar] [CrossRef] [PubMed] [Green Version]
  36. Ambasta, R.K.; Kumar, P.; Griendling, K.K.; Schmidt, H.H.; Busse, R.; Brandes, R.P. Direct interaction of the novel Nox proteins with p22phox is required for the formation of a functionally active NADPH oxidase. J. Biol. Chem. 2004, 279, 45935–45941. [Google Scholar] [CrossRef] [Green Version]
  37. Li, J.M.; Shah, A.M. Intracellular localization and pre-assembly of the NADPH oxidase complex in cultured endothelial cells. JBC 2002, 277, 19952–19960. [Google Scholar] [CrossRef] [Green Version]
  38. Leshem, Y.; Melamed-Book, N.; Cagnac, O.; Ronen, G.; Nishri, Y.; Solomon, M.; Cohen, G.; Levine, A. Suppression of Arabidopsis vesicle-SNARE expression inhibited fusion of H2O2-containing vesicles with tonoplast and increased salt tolerance. Proc. Natl. Acad. Sci. USA 2006, 103, 18008–18013. [Google Scholar] [CrossRef] [Green Version]
  39. Leshem, Y.; Seri, L.; Levine, A. Induction of phosphatidylinositol 3-kinase-mediated endocytosis by salt stress leads to intracellular production of reactive oxygen species and salt tolerance. Plant J. 2007, 51, 185–197. [Google Scholar] [CrossRef]
  40. Fluhr, R. Reactive Oxygen-Generating NADPH oxidases in plants. In Reactive Oxygen Species in Plant Signaling; Del Río, L.A., Puppo, A., Eds.; Springer: Berlin/Heidelberg, Germany, 2009; pp. 1–25. [Google Scholar]
  41. Rodríguez-García, M.I.; Fernández, M.C. Ultrastructural evidence of endoplasmic reticulum changes during the maturation of the olive pollen grain (Olea europaea L., Oleaceae). Plant Syst. Evol. 1990, 171, 221–231. [Google Scholar] [CrossRef]
  42. Butowt, R.; Rodríguez-García, M.I.; Alché, J.D.; Gorska-Brylass, A. Calcium in electron-dense globoids during pollen grain maturation in Chlorophytum elatum R. Br. Planta 1997, 203, 413–421. [Google Scholar] [CrossRef] [Green Version]
Figure 1. Developmental localization of ROS potentially produced by Rboh in olive reproductive tissues using the fluorochrome DCFH2-DA. (a) Low-magnification CLSM observation of fluorescence in olive floral structures at stages 1 to 5. Upper row: control samples (without treatment). Tissues show autofluorescence are labeled in red only. Central row: samples treated with DCFH2-DA. ROS localization is shown with green fluorescence. Lower row: samples preincubated with DPI (an Rboh inhibitor) prior to treatment with DCFH2-DA. A reduction in green fluorescence compared to upper row can be observed. (b) Quantification of the green fluorescence intensity per unit area in the stigma surface throughout the different stages of floral development. Note the reduction in intensity in the samples pre-incubated with DPI. (c) Quantification of the green fluorescence intensity in anthers. Fluorescence is only relevant at stage 4. In addition, in this case there is a significant reduction in the green fluorescence of the samples when incubated with the DPI inhibitor. Asterisks indicate a significant difference at p < 0.05; ns, no significant difference. Bars = 250 µm; A: anthers; AU: arbitrary units; O: ovary; S: stigma; St: style.
Oxygen 02 00007 g001
Figure 2. Developmental localization of superoxide potentially produced by Rboh activity in olive reproductive organs by NBT reduction. (a) Low-magnification stereomicroscopy observation of olive floral structures at stages 1 to 5. Upper row: control samples (without treatment). Tissues did not show precipitate at all. Central row: samples treated with NBT. Dark brown-purple precipitate can be observed showing the presence of O2●−. Lower row: samples preincubated with DPI (Rboh inhibitor) prior to treatment with NBT. A reduction of the precipitate to nearly disappear is observed. (b) Quantification of the precipitate intensity per unit area throughout the stages of floral development in the stigma. Relevant differences between the different stages of development can be observed. Note the reduction in intensity in the samples pre-incubated with DPI. (c) In anthers, precipitate is only relevant at stage 4. In addition, in this case there is a significant reduction in the density of the precipitate when samples were incubated with the DPI inhibitor. Asterisks indicate a significant difference at p < 0.05; ns, no significant difference. Bars = 0.5 mm; A: anthers; AU: arbitrary units; O: ovary; S: stigma; St: style.
Oxygen 02 00007 g002
Figure 3. TEM detection of superoxide anion in mature pollen. (a) Control reaction. No precipitate is observed. (bd) NBT-treated mature pollen grains showing electron-dense regions corresponding to NBT precipitate (O2●−). General views (b,c) showing precipitates (white arrows) close to the plasma membrane and vesicles (arrowheads), whereas the remaining structures do not associate to enhanced electron density. Image at higher magnification (d) showing electron-dense precipitates in the vicinity of the plasma membrane (white arrows). (e) Densitometric plots corresponding to the linear black arrows from (a,d). A peak showing an electron-dense deposit close to the plasma membrane can be observed in NBT-treated samples (black arrowhead). Bars = 1 µm. Ap: aperture; Ex: exine; GC: generative cell; In: intine; L: lipid body; M, mitochondrion; VC: vegetative cell; VN: vegetative nucleus.
Oxygen 02 00007 g003
Figure 4. TEM detection of superoxide in olive pollen tubes. (a) Control. No precipitate is observed. (be) NBT-treated pollen tubes showing electron-dense regions corresponding to NBT precipitate (O2●−). General view (b) with enhanced level of precipitate appearing close to the plasma membrane (white arrows) and the endoplasmic reticulum (arrowheads). (c) Densitometric plots corresponding to the linear black arrows from (a,b). A peak showing an electron-dense deposit close to the plasma membrane can be observed in NBT-treated samples (black arrowhead). Higher magnification views of the vegetative cell cytoplasm protruded through the pollen tube (c,d) with labeled undifferentiated mitochondria (c) and endoplasmic reticulum (arrowheads) associated to lipids (d), respectively. Other organelles like the Golgi apparatus, lipid bodies, as well as the generative cell and the vegetative nucleus appeared unlabeled over the background. Bars = 0.5 µm. CW: pollen tube cell wall; Cy: pollen tube cytoplasm; G: Golgi apparatus; L: lipid body; M: mitochondrion; VN: vegetative nucleus; VNu: vegetative nucleolus.
Oxygen 02 00007 g004
Publisher’s Note: MDPI stays neutral with regard to jurisdictional claims in published maps and institutional affiliations.

