Article

Spatial Heterogeneity of Microplastic Contamination in a Tropical Sandy Beach: Influence of Management Regimes and Recreational Use


by
Kanokporn Kaewsong
1,*,
Jetsada Wongprom
2,
Adisak Ngiamsanoi
3 and
Surinthon Bunrod
4
1
Department of Conservation, Faculty of Forestry, Kasetsart University, Bangkok 10900, Thailand
2
Department of Silviculture, Faculty of Forestry, Kasetsart University, Bangkok 10900, Thailand
3
Protected Areas Regional Office 3, Department of National Parks, Wildlife and Plant Conservation, Bangkok 10900, Thailand
4
Natural Resources and Environmental Institute, Rajamangala University of Technology Srivijaya, Trang 92150, Thailand
*
Author to whom correspondence should be addressed.
Coasts 2026, 6(3), 26; https://doi.org/10.3390/coasts6030026
Submission received: 21 April 2026 / Revised: 17 June 2026 / Accepted: 25 June 2026 / Published: 29 June 2026

Abstract

Microplastic contamination is a growing environmental concern in coastal ecosystems, particularly on recreational beaches where human activities may influence plastic inputs. This study investigated microplastic abundance and particle characteristics across five recreational zones along Hatwanakorn Beach in the Gulf of Thailand, focusing on fine-scale variability within a spatially continuous beach system and across management regimes. Supratidal sediments were collected using a quadrat-based approach, and polymer types were identified using Fourier Transform Infrared spectroscopy (FTIR). Fibers were the predominant particle type, followed by fragments, and most particles were classified as large microplastics (1–5 mm). Significant spatial differences in abundance were observed among recreational zones (Kruskal–Wallis test, χ2 = 13.37, p = 0.0096). At the management regime scale, a negative binomial generalized linear model also indicated significant differences (χ2 = 30.58, p < 0.001), with higher abundance in the Hatwanakorn Forestry Research and Student Training Station (HWK Station) and Community regimes than in the National Park regime. These results indicate that microplastic distribution can be spatially heterogeneous even within a continuous recreational beach system, underscoring the importance of accounting for fine-scale spatial variability when assessing microplastic contamination in coastal environments.

1. Introduction

Microplastic pollution is increasingly recognized as a significant environmental issue in coastal environments worldwide [1,2,3,4]. Microplastics, commonly defined as plastic particles smaller than 5 mm [5,6], originate from the fragmentation of larger plastic debris as well as from primary sources [7,8,9]. Their widespread occurrence across marine, freshwater, and terrestrial systems [10,11,12,13] has raised growing concern regarding ecosystem integrity and environmental quality [14]. In coastal environments, sandy beach sediments often function as accumulation zones where microplastics can persist and accumulate over time [13,15,16]. Understanding their spatial distribution within beach sediments is therefore essential for developing coastal monitoring and management strategies [17,18].
Recreational beaches represent dynamic socio-ecological interfaces where human activities associated with tourism and beach recreation may influence the input and redistribution of plastic materials. Such activities may influence the quantity and characteristics of plastic inputs to beach sediments [17,19,20,21]. For instance, Chen and Chen [21] reported microplastic abundances ranging from 80 to 480 items kg−1 dry weight (d.w.) on sandy beaches along the coast of the Hengchun Peninsula, Taiwan. However, most previous studies have focused on geographically separated beaches [22,23,24,25], making it difficult to distinguish the effects of human use from broader environmental differences among sites [26,27,28,29]. These environmental differences can obscure the role of human activity in shaping microplastic distribution patterns. Consequently, the extent to which spatial variability in microplastics is driven by within-beach differences in human use, under relatively comparable environmental conditions, remains insufficiently understood.
Within a single recreational beach system, spatial heterogeneity in human use creates functionally distinct zones characterized by differences in dominant activity types and patterns of use. In this study, “recreational zones” refer to areas distinguished by dominant patterns of human use rather than formal recreational designations. These include accommodation, camping, general-use, research- and education-oriented, and community-use zones. Recreational activities occur across all zones; however, their dominant functions and patterns of use vary spatially. Although management classifications are widely used to describe gradients of human influence in coastal environments [26,30,31], they often mask finer-scale variability arising from specific functional uses within individual beaches. Disentangling functional use-driven variability from broader management regimes is therefore critical for understanding how human activities shape microplastic distribution at the local scale. Despite its importance, such within-beach variability remains less well understood than comparisons among geographically separated beaches.
Hatwanakorn Beach, a tropical sandy beach in the Gulf of Thailand, provides a suitable setting to examine these relationships. The study area represents a continuous coastal system in which different forms of human activity are spatially organized, ranging from tourism-oriented areas within Hatwanakorn National Park to research and training activities at the Hatwanakorn Forestry Research and Student Training Station (HWK Station), and community-based coastal use in adjacent areas. This configuration creates a natural gradient of recreational use and management regimes within a single beach system, allowing the examination of microplastic variability under broadly comparable environmental conditions. This study therefore provides an opportunity to investigate fine-scale spatial variability within a continuous beach system while minimizing large-scale environmental differences among sites.
In this context, we investigate microplastic abundance and characteristics in beach sediments across five recreational zones along Hatwanakorn Beach—Accommodation, Camping, General-use, HWK Station, and Community-use—representing distinct functional uses and management contexts within a single coastal system. Specifically, the study addresses the following questions: (1) Does microplastic abundance differ among the five recreational zones? (2) How do microplastic characteristics vary among these zones in terms of size, shape, color, and polymer type? (3) Does microplastic abundance differ among the three broader management regimes?

2. Materials and Methods

2.1. Study Area and Sampling Sites

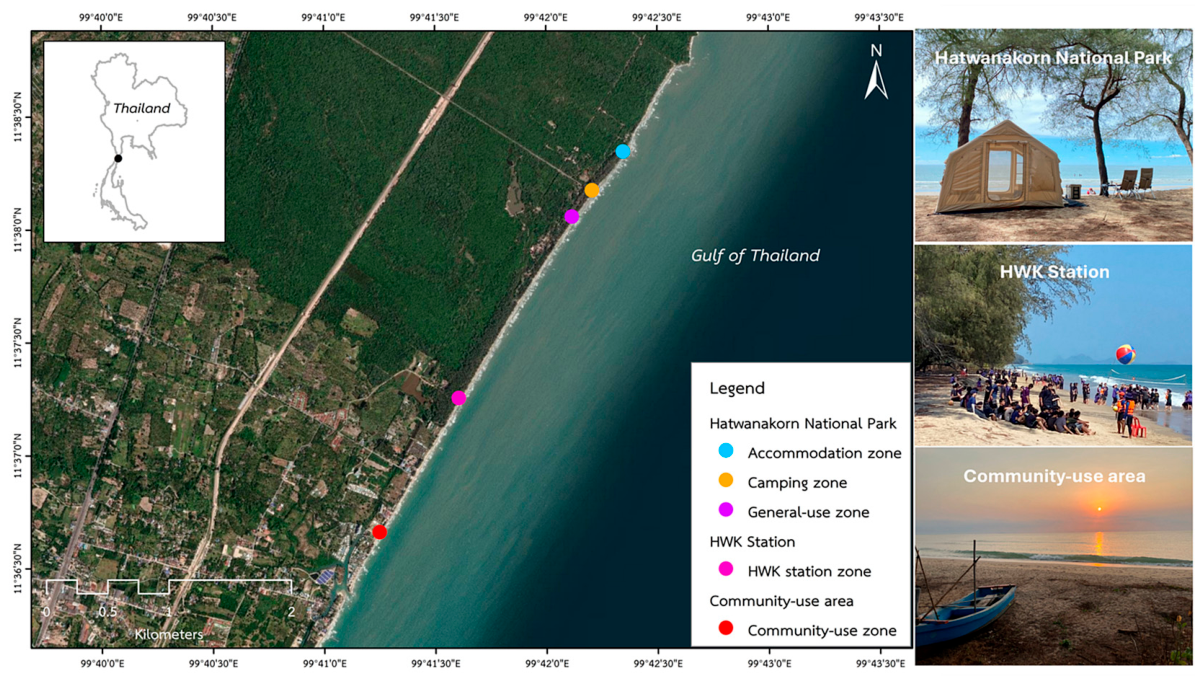
This study was conducted along Hatwanakorn Beach, Prachuap Khiri Khan Province, located on the Gulf of Thailand (11°38′10.88″ N, 99°42′10.97″ E). The study area comprises a predominantly sandy beach, which allows for the comparison of spatial variation in microplastic contamination under relatively similar physical conditions. Hatwanakorn Beach is part of Hatwanakorn National Park, which extends approximately 7 km along the sandy coastline of the Gulf of Thailand [32]. The coastline continues beyond the national park boundary into areas managed by HWK Station and nearby communities, forming a continuous coastline of approximately 8 km in total. The study area encompasses three broader management regimes, representing areas under different management approaches and dominant patterns of coastal use: Hatwanakorn National Park (a protected area with conservation-oriented management and regulated recreational activities), HWK Station (an area managed by HWK Station for research, educational activities, and recreational use), and a community-use area (an area managed by local communities and relevant local authorities, characterized by community-based activities and diverse small-scale coastal uses). The community-use area includes cultural and religious activities associated with a nearby coastal temple. The temple periodically hosts community gatherings and public events, some of which take place in adjacent beach areas. Small-scale fishing and other public uses also occur within this area. Within these three management regimes, the study area was classified into five recreational zones based on dominant patterns of human use (Figure 1). Although recreational use occurs throughout the beach, these zones differ in their dominant functions, patterns of use, and typical duration of human activities, ranging from tourism and overnight camping to research-related activities and community-based coastal uses.
Three of these zones are located within Hatwanakorn National Park: the Camping zone (tent-based overnight recreation, supporting both daytime and overnight use and attracting the largest number of visitors among the recreational zones included in this study), the Accommodation zone (lodging facilities for overnight visitors with associated beach use and typically receiving fewer visitors than the Camping zone), and the General-use zone (an area primarily used for daytime recreational activities). The HWK Station zone is managed by HWK Station, where research, educational programs, and recreational use are permitted, including organized student groups, training programs, and public visitors. The Community-use zone corresponds to the community-use area described above, which is primarily used by local residents. The five recreational zones were further grouped according to these management regimes: Hatwanakorn National Park (Camping, Accommodation, and General-use zones), HWK Station, and the Community-use area. This classification allowed comparisons of microplastic variability at both the recreational-zone and management-regime levels.

2.2. Sample Collection

Sediment samples were collected from the supratidal zone along the vegetation line, located landward of regular wave influence to minimize direct tidal influence. Sampling was conducted in October–November 2025. At each site, a 0.5 × 0.5 m wooden quadrat frame was used to delineate the sampling area. Surface sediment was collected to a depth of 5 cm using a stainless-steel scoop. Approximately 2 kg of sediment per site was collected and immediately transferred to clean containers for transport to the laboratory. Each recreational zone included six sampling sites (n = 6), resulting in a total of 30 sediment samples distributed across the five zones. This sampling design enabled the assessment of spatial variability within each recreational zone while maintaining comparable sampling effort. Sampling sites within each zone were distributed at approximately equal intervals to capture spatial heterogeneity along the shoreline.

2.3. Sample Preparation and Density Separation

In the laboratory, sediments were dried at 60 °C for 24 h. A 1 kg d.w. subsample was used for microplastic analysis. Dried sediment was sieved through a 0.425 mm stainless-steel sieve. Particles retained on the sieve were visually inspected under a stereomicroscope (5–10× magnification), and suspected microplastics were manually extracted. The material passing through the sieve (<0.425 mm fraction) was subjected to density separation. For density separation, 300 mL of 5 M NaCl solution was added to the sediment in a 1000 mL glass beaker. The mixture was stirred, covered with aluminum foil to prevent airborne contamination, and allowed to settle for 24 h. The supernatant containing potential microplastics was carefully collected. Organic matter was digested using 50% hydrogen peroxide (H2O2), which was added in 20 mL aliquots until visible organic material was removed. The digested supernatant was then filtered onto glass microfiber filters (Whatman GF/C, 1.2 µm; Cytiva, Marlborough, MA, USA). The filters were dried at 60 °C prior to microscopic examination. Microplastic particle size was determined based on the longest observable dimension. Methods for microplastic extraction followed established protocols [16], with minor modifications.

2.4. Microplastic Quantification, Polymer Identification, and Contamination Control

Filters were examined under a stereomicroscope (LABOMED Luxeo 6Z Stereo Microscope, Labomed Inc., Los Angeles, CA, USA) at 8×–50× magnification for identification and enumeration of microplastic particles. Microplastic abundance was expressed as items kg−1 d.w. Particles were classified according to shape (fibers, fragments, spheres, and rods) [33,34], color (red, blue, white, black, green, brown, and purple), and size class. Size classes were defined as 50–<500 µm, 500 µm–<1 mm, and 1–5 mm. The lower size limit for visual identification was approximately 50 µm. All suspected particles were subsequently analyzed by Fourier Transform Infrared Spectroscopy (FTIR) using a LUMOS II FTIR Microscope (Bruker Optics GmbH, Ettlingen, Germany) for polymer confirmation. The obtained spectra were compared with reference libraries integrated into OPUS Spectroscopy Software version 8.0 (Bruker Optics GmbH, Ettlingen, Germany), and a minimum spectral similarity of 90% was required to confirm polymer identity. Only particles confirmed by FTIR were included in the reported microplastic counts and polymer classification. Representative FTIR spectra are provided in the Supplementary Materials (Figure S1).
Quality assurance procedures were implemented throughout sample processing to minimize contamination. All equipment was made of glass and rinsed with distilled water prior to use. Laboratory personnel wore cotton lab coats and gloves, and work surfaces were cleaned prior to sample processing. Samples were kept covered with lids during processing to minimize airborne contamination. Three procedural blanks, consisting of filtered distilled water, were processed alongside the sample batches and subjected to the same density separation, filtration, and drying procedures. Blank filters were examined under a stereomicroscope, and no evidence of microplastic contamination was detected.

2.5. Statistical Analysis

Statistical analyses were conducted at two spatial scales: (1) among five recreational zones and (2) among three management regimes. For comparisons among the five recreational zones, normality and homogeneity of variances were assessed using the Shapiro–Wilk test and Levene’s test, respectively. When these assumptions were satisfied, differences among groups were tested using one-way analysis of variance (ANOVA) followed by Tukey’s honestly significant difference (HSD) test. When the assumptions were not met, the nonparametric Kruskal–Wallis test was applied, followed by Dunn’s post hoc test with Bonferroni correction. To evaluate differences among the three management regimes, a generalized linear model (GLM) with a negative binomial distribution was applied to account for overdispersion in the count data. Management regime was included as a fixed effect. Pairwise comparisons among regimes were conducted using estimated marginal means with Tukey adjustment, implemented using the R packages emmeans and MASS. Statistical significance was determined at p < 0.05. All statistical analyses were performed using R version 4.5.1 [35].

3. Results

3.1. Microplastic Abundance Across Five Recreational Zones

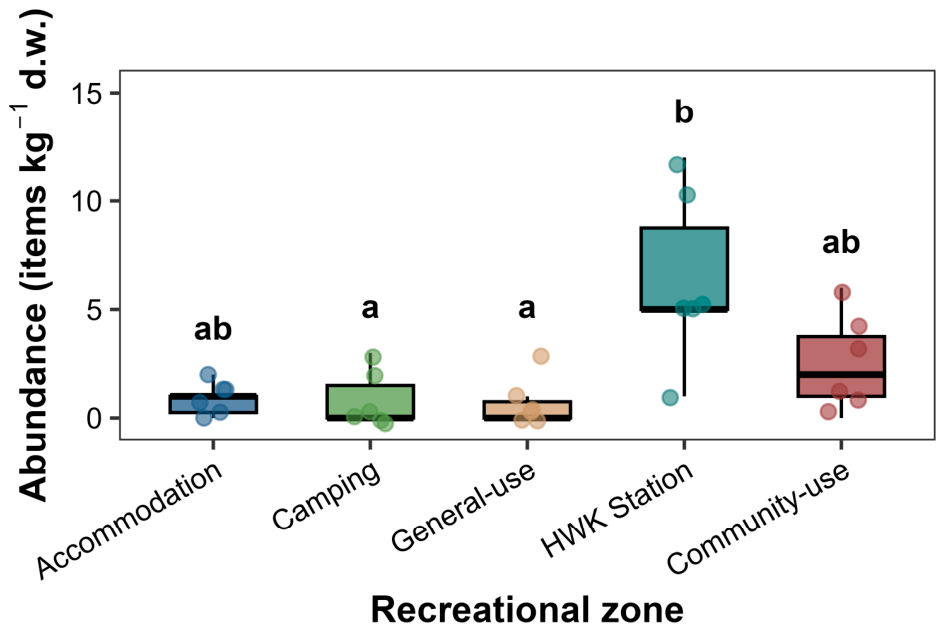
A total of 67 microplastic particles were detected in the 30 sediment samples collected from five recreational zones. Microplastic abundance differed significantly among the five recreational zones (Kruskal–Wallis test, χ2 = 13.37, df = 4, p = 0.0096; Figure 2). Pairwise comparisons using Dunn’s test with Bonferroni correction showed that abundance at the HWK Station zone was significantly higher than that in the Camping (p = 0.0338) and General-use zones (p = 0.0205). Microplastic abundance differed among zones, with the highest mean value observed in the HWK Station zone. Mean ± SD values and sample sizes are provided in Table S1.

3.2. Microplastic Characteristics Across Five Recreational Zones

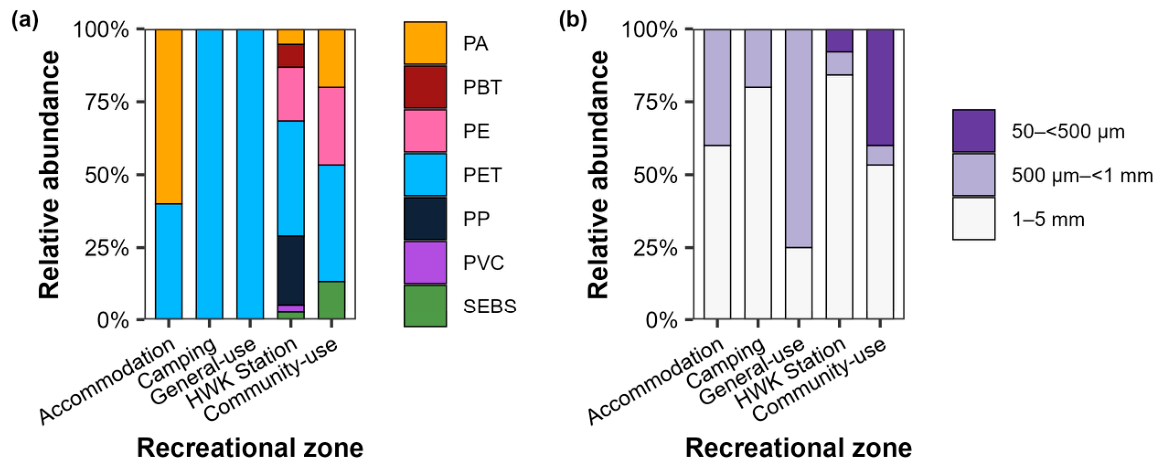
Polymer composition varied among recreational zones (Figure 3; see Figure S2 for overall microplastic characteristics). Polyethylene terephthalate (PET) was the dominant polymer in the Camping and General-use zones and was also common in the Community-use and HWK Station zones. In contrast, the Accommodation zone was dominated by polyamide (PA), while the HWK Station zone showed the greatest polymer diversity. Particle size distribution was generally dominated by the 1–5 mm size class across most zones, whereas the General-use zone was primarily characterized by particles in the 500 µm–<1 mm size range (Figure 3b).
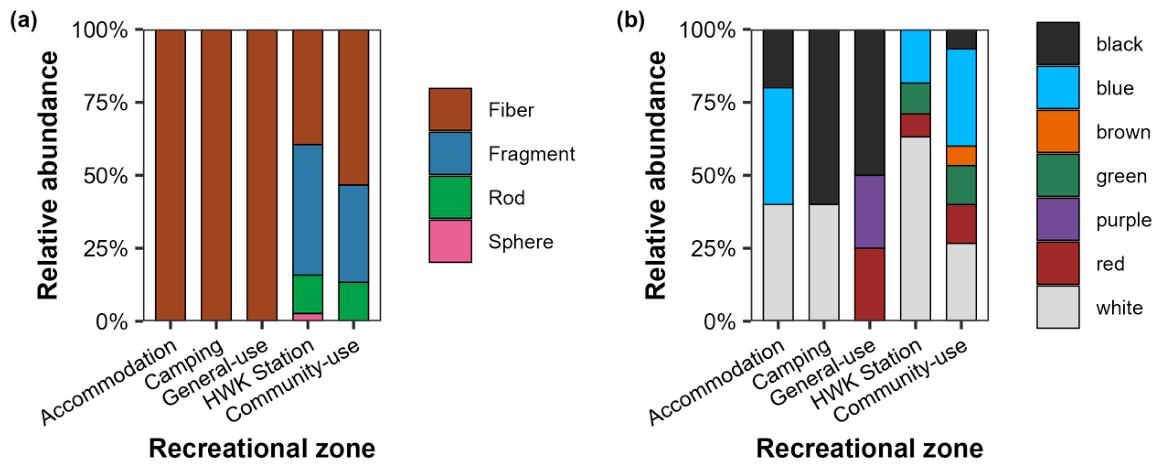
Particle shape was most frequently represented by fibers across the recreational zones. In the Accommodation, Camping, and General-use zones, fibers were the only shape observed (Figure 4a and Table S1). Additional shapes, including fragments, rods, and spheres, were primarily observed in the HWK Station zone. Color composition also varied among zones (Figure 4b). White particles strongly dominated the HWK Station zone, while other zones showed more variable color distributions. Representative examples of microplastic particles identified in this study are presented in Figure 5.

3.3. Comparison of Microplastic Abundance Among Management Regimes

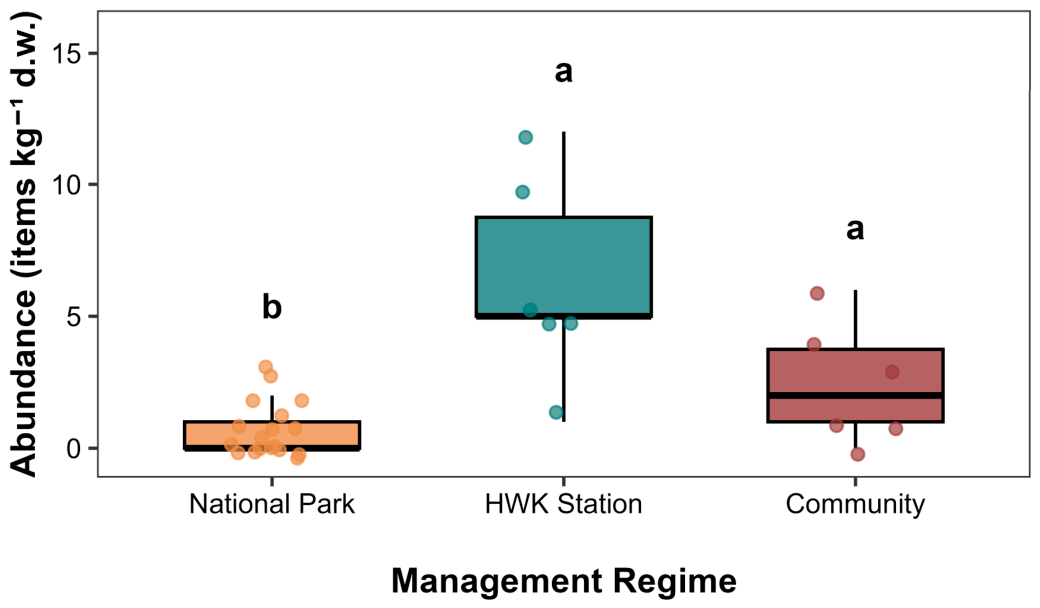
Microplastic abundance differed significantly among management regimes (negative binomial GLM, χ2 = 30.58, df = 2, p < 0.001; Figure 6). Post hoc Tukey pairwise comparisons revealed that microplastic abundance was significantly higher in the HWK Station regime than in the National Park regime (p < 0.001). Similarly, the Community regime showed significantly higher abundance than the National Park regime (p = 0.027). In contrast, no significant difference was detected between the Community and HWK Station regimes (see Table S2 for detailed pairwise comparisons).

4. Discussion

4.1. Spatial Variability in Microplastic Abundance Associated with Recreational Use and Management Regimes

This study was conducted within a spatially continuous beach sediment system, which allows the examination of fine-scale spatial variability in microplastic distribution. Microplastic abundance exhibited clear fine-scale spatial variability. Although overall concentrations were relatively low (0.67–6.33 items kg−1 d.w.; Table S1), consistent spatial differences were observed among sampling zones. Comparable abundance levels have been reported in other tropical coastal systems, including the Gulf of Thailand (4–17 items kg−1 d.w.) [36] and Can Gio coast, Vietnam (0–6.58 items kg−1 d.w.) [4]. Although the concentrations observed here were within the range reported for tropical sandy beaches in Southeast Asia, they were relatively low compared with some previously reported recreational beaches [21,37]. Importantly, significant differences were detected among recreational zones and management regimes, indicating the presence of fine-scale spatial heterogeneity even within a continuous beach system.
At the zone scale, higher microplastic abundance in the HWK Station compared with the Camping and General-use zones may reflect episodic or concentrated human use associated with structured activities (e.g., research and training) and may be linked to higher localized abundance, rather than overall visitor density alone. This is consistent with evidence that microplastic abundance is not always directly proportional to recreational pressure [37].
At the management regime scale, lower microplastic abundance in the National Park regime compared with the HWK Station and Community-use regimes indicates that differences in access regulation and management practices may be associated with spatial variation in microplastic distribution across management regimes. In summary, these results suggest that microplastic distribution is spatially structured and associated with human activity patterns and management regimes.

4.2. Microplastic Characteristics, Potential Sources, and Transport Pathways

Fibers dominated across all zones and were the only particle shape observed in the Accommodation, Camping, and General-use zones. However, microplastic abundance in these zones was low, suggesting that the observed shape composition may partly reflect the limited number of detected particles rather than a clear dominance of fibers. Nevertheless, the overall predominance of fibers is consistent with findings from many coastal sediment studies [6,22,38,39,40], suggesting multiple potential input pathways in coastal environments. Their prevalence is consistent with possible sources such as synthetic textiles and fishing-related activities [13,41,42], and their low density facilitates both atmospheric and hydrodynamic transport, allowing deposition even in supratidal sediments with limited direct local inputs [11,12]. Polymer composition also suggests multiple potential sources. PET was dominant in several zones, consistent with packaging and textile-related inputs associated with tourism [7,13,15,36,43]. PA detected in the Accommodation zone likely reflects microfiber release associated with clothing use and domestic washing activities [8,15,36,44]. Higher polymer diversity in the HWK Station zone suggests a broader range of potential input sources in areas with mixed land use.
Particle size distribution was dominated by large microplastics (1–5 mm) [29,45], followed by particles in the 500 µm–<1 mm size range. This pattern suggests two non-exclusive pathways: direct input of particles already present in the environment in larger size classes, and in situ fragmentation through environmental weathering processes. Exposure to ultraviolet radiation and mechanical abrasion can contribute to the gradual deterioration of plastic particles, causing embrittlement and surface cracking that increase susceptibility to fragmentation and the production of smaller particles [7,8]. Repeated wetting–drying cycles may further promote fragmentation of weathered plastic surfaces through swelling and delamination processes, increasing their susceptibility to subsequent physical breakdown [46]. In sandy beach environments, continuous contact between plastic particles and sediment grains, together with wave- and wind-driven abrasion, can further contribute to fragmentation into smaller size classes [47]. The physical properties of microplastics, including particle size, shape, and density, may influence their transport, settling behavior, and residence time within coastal sediments [48]. Collectively, these weathering and transport processes may contribute to the fragmentation and distribution of microplastics in beach sediments over time. Color variation among zones likely reflects differences in source materials as well as environmental weathering processes. White particles were dominant in the HWK Station zone, which may reflect weathering-related color alteration as well as the presence of originally light-colored plastic materials, while other zones exhibited more diverse color compositions, potentially reflecting multiple sources and varying degrees of environmental weathering [15,21,49,50].

4.3. Ecological Implications and Management Relevance

Although microplastic abundance was relatively low compared with heavily impacted coastal environments [20,21,51], their widespread occurrence suggests that supratidal sediments may function as accumulation zones for plastic particles [52,53,54]. In the supratidal zone, routine wave activity does not typically reach these sediments, which suggests that they are likely associated with land-based inputs and recreational use. However, episodic high-energy events (e.g., storm-driven surges) may play a secondary role in transporting marine-derived debris inland and facilitating intermittent exchange between nearshore and supratidal environments [28,55].
Ecologically, microplastics may influence sediment microbial communities [56,57] and key ecosystem processes, including organic matter decomposition [58,59] and nutrient cycling [56,59,60]. However, the magnitude of these effects remains uncertain in this system. Even at low concentrations, microplastics may create localized exposure pathways within coastal sediments.
Differences among regimes suggest that variation in access regulation and waste-management practices may contribute to the observed spatial patterns. Lower abundance in the National Park regime is consistent with the possibility that structured management and restricted access may be associated with reduced microplastic abundance, although these factors were not directly evaluated in the present study. Residual presence may also reflect historical accumulation of plastics prior to current management measures [7,9].
Taken together, these findings indicate that microplastic distribution is associated with spatial variation in human activity patterns and management regimes, highlighting the importance of integrated coastal management approaches for addressing spatially heterogeneous coastal pollution [31,61,62,63]. Community-based monitoring approaches, including citizen science initiatives, may complement environmental surveillance efforts [64,65], particularly in areas where existing research infrastructure and regular human presence facilitate long-term monitoring (e.g., HWK Station).

4.4. Limitations and Future Research

This study represents a single-season assessment of microplastic contamination, and seasonal variability associated with monsoons or storm events was not examined. The analytical method used a lower detection limit of approximately 50 µm, which may exclude smaller microplastic particles. Variability in reported detection limits reflects differences in methodological approaches across studies [15,36], which should be considered in cross-study comparisons. Although a NaCl solution was used for density separation, its density may limit the recovery of some high-density polymers [15]. Consequently, polymers with densities higher than the NaCl solution, such as PET and PVC, may have been underestimated. However, both polymer types were detected in the present study, indicating that at least a portion of the high-density fraction was recovered. Although polymer identification was conducted using FTIR, the study did not quantify contributions from specific local sources such as fishing activities, tourism-related waste, or atmospheric deposition. Accordingly, the observed spatial patterns reflect associations rather than causal mechanisms. Future research should incorporate multi-season sampling, expanded spatial coverage, and visitor-use data, alongside advanced source-tracing techniques, to better resolve the dynamics of microplastic distribution in tropical sandy beach systems.

5. Conclusions

This study examined the spatial distribution and characteristics of microplastics in beach sediments along a tropical sandy beach. Microplastic abundance ranged from 0.67 to 6.33 items kg−1 d.w. and differed significantly among recreational zones and management regimes. Fibers were the predominant particle type, followed by fragments, while PET was the most frequently identified polymer. The observed patterns, together with the dominance of specific polymer types, suggest that spatial differences may be associated with variations in human use and management context, although exact sources could not be explicitly resolved based on the present data. These findings underscore the importance of incorporating spatial and management heterogeneity when assessing microplastic contamination in coastal sediments. They further highlight the need for context-specific monitoring approaches to better inform coastal management strategies aimed at reducing plastic inputs into tropical coastal environments.

Supplementary Materials

The following supporting information can be downloaded at: https://www.mdpi.com/article/10.3390/coasts6030026/s1, Figure S1: Representative FTIR spectra of microplastic particles: (a) PET, (b) PE, (c) PP, and (d) PA; Figure S2: Overall characteristics of microplastics based on all identified particles pooled across the five recreational zones: (a) polymer composition, (b) size-class distribution, (c) particle shape, and (d) color composition; Table S1: Mean (±SD) microplastic abundance in beach sediment across the five recreational zones; Table S2: Pairwise comparisons of microplastic abundance among management regimes based on the negative binomial GLM.

Author Contributions

Conceptualization, K.K.; methodology, K.K. and S.B.; software, K.K.; validation, K.K. and S.B.; formal analysis, K.K.; investigation, K.K., J.W. and S.B.; resources, K.K., J.W., A.N. and S.B.; data curation, K.K.; writing—original draft preparation, K.K.; writing—review and editing, K.K., J.W., A.N. and S.B.; visualization, K.K.; supervision, K.K.; project administration, K.K.; funding acquisition, K.K. All authors have read and agreed to the published version of the manuscript.

Funding

This research was funded by the Forestry Research Center, Faculty of Forestry, Kasetsart University.

Data Availability Statement

The data presented in this study are available in the article and in the Supplementary Materials. Additional data related to this study are available from the corresponding author upon request.

Acknowledgments

The authors gratefully acknowledge the staff of Hatwanakorn National Park, under the Department of National Parks, Wildlife and Plant Conservation, for their assistance with field sampling and for providing information related to the study area, as well as experts in recreation and the community sector for their valuable guidance and insightful contributions.

Conflicts of Interest

The authors declare no conflicts of interest.

Abbreviations

The following abbreviations are used in this manuscript:
d.w.dry weight
FTIRFourier-Transform Infrared spectroscopy
HWK StationHatwanakorn Forestry Research and Student Training Station
mmmillimeter
µmmicrometer
PApolyamide
PBTpolybutylene terephthalate
PEpolyethylene
PETpolyethylene terephthalate
PPpolypropylene
PVCpolyvinyl chloride
SEBSstyrene–ethylene–butylene–styrene

References

  1. Jambeck, J.R.; Geyer, R.; Wilcox, C.; Siegler, T.R.; Perryman, M.; Andrady, A.; Narayan, R.; Law, K.L. Plastic waste inputs from land into the ocean. Science 2015, 347, 768–771. [Google Scholar] [CrossRef] [Scilit] [PubMed]
  2. McGlade, J.; Fahim, I.; Green, D.; Landrigan, P.; Andrady, A.; Costa, M.; Geyer, R.; Gomes, R.; Tan Shau Hwai, A.; Jambeck, J.; et al. From Pollution to Solution: A Global Assessment of Marine Litter and Plastic Pollution; United Nations Environment Programme: Nairobi, Kenya, 2021. [Google Scholar]
  3. Thompson, R.C.; Olsen, Y.; Mitchell, R.P.; Davis, A.; Rowland, S.J.; John, A.W.G.; McGonigle, D.; Russell, A.E. Lost at Sea: Where Is All the Plastic? Science 2004, 304, 838. [Google Scholar] [CrossRef] [Scilit] [PubMed]
  4. Nhon, N.T.T.; Nguyen, N.T.; Hai, H.T.N.; Hien, T.T. Distribution of Microplastics in Beach Sand on the Can Gio Coast, Ho Chi Minh City, Vietnam. Water 2022, 14, 2779. [Google Scholar] [CrossRef] [Scilit]
  5. Laglbauer, B.J.L.; Franco-Santos, R.M.; Andreu-Cazenave, M.; Brunelli, L.; Papadatou, M.; Palatinus, A.; Grego, M.; Deprez, T. Macrodebris and microplastics from beaches in Slovenia. Mar. Pollut. Bull. 2014, 89, 356–366. [Google Scholar] [CrossRef] [Scilit] [PubMed]
  6. Lots, F.A.E.; Behrens, P.; Vijver, M.G.; Horton, A.A.; Bosker, T. A large-scale investigation of microplastic contamination: Abundance and characteristics of microplastics in European beach sediment. Mar. Pollut. Bull. 2017, 123, 219–226. [Google Scholar] [CrossRef] [Scilit] [PubMed]
  7. Andrady, A.L. Microplastics in the marine environment. Mar. Pollut. Bull. 2011, 62, 1596–1605. [Google Scholar] [CrossRef] [Scilit] [PubMed]
  8. Cole, M.; Lindeque, P.; Halsband, C.; Galloway, T.S. Microplastics as contaminants in the marine environment: A review. Mar. Pollut. Bull. 2011, 62, 2588–2597. [Google Scholar] [CrossRef] [Scilit] [PubMed]
  9. Geyer, R.; Jambeck, J.R.; Law, K.L. Production, use, and fate of all plastics ever made. Sci. Adv. 2017, 3, e1700782. [Google Scholar] [CrossRef] [Scilit] [PubMed]
  10. Eerkes-Medrano, D.; Thompson, R.C.; Aldridge, D.C. Microplastics in freshwater systems: A review of the emerging threats, identification of knowledge gaps and prioritisation of research needs. Water Res. 2015, 75, 63–82. [Google Scholar] [CrossRef] [Scilit] [PubMed]
  11. Allen, S.; Allen, D.; Phoenix, V.R.; Le Roux, G.; Durántez Jiménez, P.; Simonneau, A.; Binet, S.; Galop, D. Atmospheric transport and deposition of microplastics in a remote mountain catchment. Nat. Geosci. 2019, 12, 339–344. [Google Scholar] [CrossRef] [Scilit]
  12. Brahney, J.; Hallerud, M.; Heim, E.; Hahnenberger, M.; Sukumaran, S. Plastic Rain in Protected Areas of the United States. Science 2020, 368, 1257–1260. [Google Scholar] [CrossRef] [Scilit] [PubMed]
  13. Browne, M.A.; Crump, P.; Niven, S.J.; Teuten, E.; Tonkin, A.; Galloway, T.; Thompson, R. Accumulation of microplastic on shorelines worldwide: Sources and sinks. Environ. Sci. Technol. 2011, 45, 9175–9179. [Google Scholar] [CrossRef] [Scilit] [PubMed]
  14. Beaumont, N.J.; Aanesen, M.; Austen, M.C.; Börger, T.; Clark, J.R.; Cole, M.; Hooper, T.; Lindeque, P.K.; Pascoe, C.; Wyles, K.J. Global ecological, social and economic impacts of marine plastic. Mar. Pollut. Bull. 2019, 142, 189–195. [Google Scholar] [CrossRef] [Scilit] [PubMed]
  15. Hidalgo-Ruz, V.; Gutow, L.; Thompson, R.C.; Thiel, M. Microplastics in the Marine Environment: A Review of the Methods Used for Identification and Quantification. Environ. Sci. Technol. 2012, 46, 3060–3075. [Google Scholar] [CrossRef] [Scilit] [PubMed]
  16. Masura, J.; Baker, J.E.; Foster, G.D.; Arthur, C.; Herring, C. Laboratory Methods for the Analysis of Microplastics in the Marine Environment: Recommendations for Quantifying Synthetic Particles in Waters and Sediments; National Oceanic and Atmospheric Administration: Silver Spring, MD, USA, 2015.
  17. Wu, X.; Zhong, C.; Wang, T.; Zou, X.; Zang, Z.; Li, Q.; Chen, H. Occurrence and distribution of microplastics on recreational beaches of Haichow Bay, China. Environ. Sci. Pollut. Res. 2021, 28, 6132–6145. [Google Scholar] [CrossRef] [Scilit] [PubMed]
  18. Rahman, S.M.A.; Robin, G.S.; Momotaj, M.; Uddin, J.; Siddique, M.A.M. Occurrence and spatial distribution of microplastics in beach sediments of Cox’s Bazar, Bangladesh. Mar. Pollut. Bull. 2020, 160, 111587. [Google Scholar] [CrossRef] [Scilit] [PubMed]
  19. Gül, M.R. Short-term tourism alters abundance, size, and composition of microplastics on sandy beaches. Environ. Pollut. 2023, 316, 120561. [Google Scholar] [CrossRef] [Scilit] [PubMed]
  20. Balestra, V.; Trunfio, F.; Akyıldız, S.H.; Marini, P.; Bellopede, R. Microparticles of anthropogenic origin (microplastics and microfibers) in sandy sediments: A case study from Calabria, Italy. Environ. Monit. Assess. 2024, 196, 993. [Google Scholar] [CrossRef] [Scilit] [PubMed]
  21. Chen, M.-C.; Chen, T.-H. Spatial and seasonal distribution of microplastics on sandy beaches along the coast of the Hengchun Peninsula, Taiwan. Mar. Pollut. Bull. 2020, 151, 110861. [Google Scholar] [CrossRef] [Scilit] [PubMed]
  22. Urban-Malinga, B.; Zalewski, M.; Jakubowska, A.; Wodzinowski, T.; Malinga, M.; Pałys, B.; Dąbrowska, A. Microplastics on sandy beaches of the southern Baltic Sea. Mar. Pollut. Bull. 2020, 155, 111170. [Google Scholar] [CrossRef] [Scilit] [PubMed]
  23. Azaaouaj, S.; Nachite, D.; Anfuso, G.; Er-Ramy, N. Abundance and distribution of microplastics on sandy beaches of the eastern Moroccan Mediterranean coast. Mar. Pollut. Bull. 2024, 200, 116144. [Google Scholar] [CrossRef] [Scilit] [PubMed]
  24. Zahari, N.Z.; Vincent, S.D.; Cleophas, F.N.; Budin, K.; Sabullah, M.K. Abundance, Distribution, and Characterization of Microplastics on Two Recreational Beaches in Kota Kinabalu, Sabah, Malaysia. Water 2023, 15, 2681. [Google Scholar] [CrossRef] [Scilit]
  25. Nel, H.A.; Froneman, P.W. A quantitative analysis of microplastic pollution along the south-eastern coastline of South Africa. Mar. Pollut. Bull. 2015, 101, 274–279. [Google Scholar] [CrossRef] [Scilit] [PubMed]
  26. Nguyen, M.Y.; Vanreusel, A.; Ngo, X.Q.; Vercauteren, M.; Asselman, J.; Van Colen, C. Microplastic pollution in Vietnamese sandy beaches: Exploring the role of beach morphodynamics and local management. Mar. Pollut. Bull. 2025, 214, 117838. [Google Scholar] [CrossRef] [Scilit] [PubMed]
  27. Wilson, D.R.; Godley, B.J.; Haggar, G.L.; Santillo, D.; Sheen, K.L. The influence of depositional environment on the abundance of microplastic pollution on beaches in the Bristol Channel, UK. Mar. Pollut. Bull. 2021, 164, 111997. [Google Scholar] [CrossRef] [Scilit] [PubMed]
  28. Graca, B.; Szewc, K.; Zakrzewska, D.; Dołęga, A.; Szczerbowska-Boruchowska, M. Sources and fate of microplastics in marine and beach sediments of the Southern Baltic Sea—A preliminary study. Environ. Sci. Pollut. Res. 2017, 24, 7650–7661. [Google Scholar] [CrossRef] [Scilit] [PubMed]
  29. Eo, S.; Hong, S.H.; Song, Y.K.; Lee, J.; Lee, J.; Shim, W.J. Abundance, composition, and distribution of microplastics larger than 20 μm in sand beaches of South Korea. Environ. Pollut. 2018, 238, 894–902. [Google Scholar] [CrossRef] [Scilit] [PubMed]
  30. Bayo, J.; Rojo, D.; Olmos, S. Abundance, morphology and chemical composition of microplastics in sand and sediments from a protected coastal area: The Mar Menor lagoon (SE Spain). Environ. Pollut. 2019, 252, 1357–1366. [Google Scholar] [CrossRef] [Scilit] [PubMed]
  31. Rangel-Buitrago, N.; Giarrizzo, T.; Brabo, L.; Silva Filho, F.J.; Cooper, J.A.G.; Neal, W.J. Updating coastal beach classification: A cluster-based typology for contemporary human use and management. Ocean Coast. Manag. 2026, 273, 108064. [Google Scholar] [CrossRef] [Scilit]
  32. Department of National Parks, Wildlife and Plant Conservation. Management Plan for Hatwanakorn National Park (2023–2027); Department of National Parks, Wildlife and Plant Conservation: Bangkok, Thailand, 2023. [Google Scholar]
  33. Hartmann, N.B.; Hüffer, T.; Thompson, R.C.; Hassellöv, M.; Verschoor, A.; Daugaard, A.E.; Rist, S.; Karlsson, T.; Brennholt, N.; Cole, M.; et al. Are We Speaking the Same Language? Recommendations for a Definition and Categorization Framework for Plastic Debris. Environ. Sci. Technol. 2019, 53, 1039–1047. [Google Scholar] [CrossRef] [Scilit] [PubMed]
  34. Rosal, R. Morphological description of microplastic particles for environmental fate studies. Mar. Pollut. Bull. 2021, 171, 112716. [Google Scholar] [CrossRef] [Scilit] [PubMed]
  35. R Core Team. R: A Language and Environment for Statistical Computing; R Foundation for Statistical Computing: Vienna, Austria, 2025. [Google Scholar]
  36. Jualaong, S.; Pransilpa, M.; Pradit, S.; Towatana, P. Type and Distribution of Microplastics in Beach Sediment along the Coast of the Eastern Gulf of Thailand. J. Mar. Sci. Eng. 2021, 9, 1405. [Google Scholar] [CrossRef] [Scilit]
  37. Ronda, A.C.; Menéndez, M.C.; Tombesi, N.; Álvarez, M.; Tomba, J.P.; Silva, L.I.; Arias, A.H. Microplastic levels on sandy beaches: Are the effects of tourism and coastal recreation really important? Chemosphere 2023, 316, 137842. [Google Scholar] [CrossRef] [Scilit] [PubMed]
  38. Sajorne, R.E.; Cayabo, G.D.B.; Gajardo, L.J.A.; Mabuhay-Omar, J.A.; Creencia, L.A.; Bacosa, H.P. Disentangling Microplastic Pollution on Beach Sand of Puerto Princesa, Palawan Island, Philippines: Abundance and Characteristics. Sustainability 2022, 14, 15303. [Google Scholar] [CrossRef] [Scilit]
  39. Li, Y.; Zhang, Y.; Chen, G.; Xu, K.; Gong, H.; Huang, K.; Yan, M.; Wang, J. Microplastics in Surface Waters and Sediments from Guangdong Coastal Areas, South China. Sustainability 2021, 13, 2691. [Google Scholar] [CrossRef] [Scilit]
  40. Bouzekry, A.; Mghili, B.; Mancuso, M.; Bouadil, O.; Bottari, T.; Aksissou, M. Anthropogenic Microparticles Abundance in Sandy Beach Sediments along the Tetouan Coast (Morocco Mediterranean). Environments 2024, 11, 83. [Google Scholar] [CrossRef] [Scilit]
  41. Sait, S.T.L.; Sørensen, L.; Kubowicz, S.; Vike-Jonas, K.; Gonzalez, S.V.; Asimakopoulos, A.G.; Booth, A.M. Microplastic fibres from synthetic textiles: Environmental degradation and additive chemical content. Environ. Pollut. 2021, 268, 115745. [Google Scholar] [CrossRef] [Scilit] [PubMed]
  42. Karadurmuş, U.; Bilgili, L. Environmental impacts of synthetic fishing nets from manufacturing to disposal: A case study of Türkiye in life cycle perspective. Mar. Pollut. Bull. 2024, 198, 115889. [Google Scholar] [CrossRef] [Scilit] [PubMed]
  43. Lionetto, F.; Esposito Corcione, C. An Overview of the Sorption Studies of Contaminants on Poly(Ethylene Terephthalate) Microplastics in the Marine Environment. J. Mar. Sci. Eng. 2021, 9, 445. [Google Scholar] [CrossRef] [Scilit]
  44. Das, B.K.; Das, S.; Kumar, V.; Roy, S.; Mitra, A.; Mandal, B. Microplastics in ecosystems: Ecotoxicological threats and strategies for mitigation and governance. Front. Mar. Sci. 2025, 12, 1672484. [Google Scholar] [CrossRef] [Scilit]
  45. Buoninsegni, J.; Anfuso, G.; Tessari, U.; Giro, V.; Marrocchino, E.; Vaccaro, C. Seasonal and Cross-Shore Assessment of Large and Small Microplastics Collected on the Ferrara Coast (Italy). Microplastics 2026, 5, 15. [Google Scholar] [CrossRef] [Scilit]
  46. Andrady, A.L. The plastic in microplastics: A review. Mar. Pollut. Bull. 2017, 119, 12–22. [Google Scholar] [CrossRef] [Scilit] [PubMed]
  47. Corcoran, P.L.; Biesinger, M.C.; Grifi, M. Plastics and beaches: A degrading relationship. Mar. Pollut. Bull. 2009, 58, 80–84. [Google Scholar] [CrossRef] [Scilit] [PubMed]
  48. Chubarenko, I.; Bagaev, A.; Zobkov, M.; Esiukova, E. On some physical and dynamical properties of microplastic particles in marine environment. Mar. Pollut. Bull. 2016, 108, 105–112. [Google Scholar] [CrossRef] [Scilit] [PubMed]
  49. Azaaouaj, S.; Er-Ramy, N.; Nachite, D.; Anfuso, G. Presence, Spatial Distribution, and Characteristics of Microplastics in Beach Sediments Along the Northwestern Moroccan Mediterranean Coast. Water 2025, 17, 1646. [Google Scholar] [CrossRef] [Scilit]
  50. Gewert, B.; Plassmann, M.M.; MacLeod, M. Pathways for degradation of plastic polymers floating in the marine environment. Environ. Sci. Process. Impacts 2015, 17, 1513–1521. [Google Scholar] [CrossRef] [Scilit] [PubMed]
  51. Luo, Y.; Sun, C.; Li, C.; Liu, Y.; Zhao, S.; Li, Y.; Kong, F.; Zheng, H.; Luo, X.; Chen, L.; et al. Spatial Patterns of Microplastics in Surface Seawater, Sediment, and Sand Along Qingdao Coastal Environment. Front. Mar. Sci. 2022, 9, 916859. [Google Scholar] [CrossRef] [Scilit]
  52. Esiukova, E.; Lobchuk, O.; Haseler, M.; Chubarenko, I. Microplastic contamination of sandy beaches of national parks, protected and recreational areas in southern parts of the Baltic Sea. Mar. Pollut. Bull. 2021, 173, 113002. [Google Scholar] [CrossRef] [Scilit] [PubMed]
  53. Whitmire, S.L.; Van Bloem, S.J.; Toline, C.A.; McCreedy, C. Quantification of Microplastics on National Park Beaches; National Oceanic and Atmospheric Administration: Washington, DC, USA, 2018.
  54. Garcia, Y.; Ribeiro, V.V.; do Prado, C.C.A.; Mansor, M.T.C.; Turra, A.; Gomes, R.S.; Fernandes, A.N.; Castro, Í.B. Microplastics in a mosaic of Marine Protected Areas from southeastern Brazil: An assessment based on filter-feeding bivalves. Mar. Pollut. Bull. 2026, 225, 119250. [Google Scholar] [CrossRef] [Scilit] [PubMed]
  55. Kim, S.; Kim, D.-H. Short-term buoyant microplastic transport patterns driven by wave evolution, breaking, and orbital motion in coast. Mar. Pollut. Bull. 2024, 201, 116248. [Google Scholar] [CrossRef] [Scilit] [PubMed]
  56. Seeley, M.E.; Song, B.; Passie, R.; Hale, R.C. Microplastics affect sedimentary microbial communities and nitrogen cycling. Nat. Commun. 2020, 11, 2372. [Google Scholar] [CrossRef] [Scilit] [PubMed]
  57. Li, W.; Wang, Z.; Li, W.; Li, Z. Impacts of microplastics addition on sediment environmental properties, enzymatic activities and bacterial diversity. Chemosphere 2022, 307, 135836. [Google Scholar] [CrossRef] [Scilit] [PubMed]
  58. Xiao, M.; Shahbaz, M.; Liang, Y.; Yang, J.; Wang, S.; Chadwicka, D.R.; Jones, D.; Chen, J.; Ge, T. Effect of microplastics on organic matter decomposition in paddy soil amended with crop residues and labile C: A three-source-partitioning study. J. Hazard. Mater. 2021, 416, 126221. [Google Scholar] [CrossRef] [Scilit] [PubMed]
  59. Lin, J.; Cheng, Q.; Kumar, A.; Zhang, W.; Yu, Z.; Hui, D.; Zhang, C.; Shan, S. Effect of degradable microplastics, biochar and their coexistence on soil organic matter decomposition: A critical review. TrAC Trends Anal. Chem. 2025, 183, 118082. [Google Scholar] [CrossRef] [Scilit]
  60. Cheng, Y.; Wang, F.; Huang, W.; Liu, Y. Response of soil biochemical properties and ecosystem function to microplastics pollution. Sci. Rep. 2024, 14, 28328. [Google Scholar] [CrossRef] [Scilit] [PubMed]
  61. Cicin-Sain, B.; Belfiore, S. Linking marine protected areas to integrated coastal and ocean management: A review of theory and practice. Ocean Coast. Manag. 2005, 48, 847–868. [Google Scholar] [CrossRef] [Scilit]
  62. Cicin-Sain, B.; Knecht, R.W. Integrated Coastal and Ocean Management: Concepts and Practices; Island Press: Washington, DC, USA, 1998. [Google Scholar]
  63. UNEP. Guidelines for Integrated Management of Coastal and Marine Areas—With Special Reference to the Mediterranean Basin, United Nations Environment Programme Regional Seas Report and Studies No. 161; UNEP: Nairobi, Kenya, 1995. [Google Scholar]
  64. Hidalgo-Ruz, V.; Thiel, M. The Contribution of Citizen Scientists to the Monitoring of Marine Litter. In Marine Anthropogenic Litter; Bergmann, M., Gutow, L., Klages, M., Eds.; Springer International Publishing: Cham, Switzerland, 2015; pp. 429–447. [Google Scholar]
  65. Walther, B.A.; Pasolini, F.; Korez Lupše, Š.; Bergmann, M. Microplastic detectives: A citizen-science project reveals large variation in meso- and microplastic pollution along German coastlines. Front. Environ. Sci. 2024, 12, 1458565. [Google Scholar] [CrossRef] [Scilit]
Figure 1. Map of the study area along Hatwanakorn Beach, Prachuap Khiri Khan Province, Thailand, showing five recreational zones classified into three broader management regimes. The inset map of Thailand indicates the location of the study area, marked by a black dot. Photographs on the right show representative views of the three management regimes.
Coasts 06 00026 g001
Figure 2. Boxplots of microplastic abundance across five recreational zones (n = 6 samples per zone), with whiskers extending to 1.5× the interquartile range. Jittered points represent individual samples, slightly offset to avoid overlap. Letters above the boxplots indicate significant differences among zones based on post hoc pairwise comparisons (p < 0.05). Different letters above the boxes indicate statistically significant differences among recreational zones.
Coasts 06 00026 g002
Figure 3. Relative composition (%) of (a) polymer types and (b) size classes of microplastics across five recreational zones. Bar heights represent the proportion of each category within each zone, expressed as percentages of total identified particles per zone. Abbreviations: PA (polyamide); PBT (polybutylene terephthalate); PE (polyethylene); PET (polyethylene terephthalate); PP (polypropylene); PVC (polyvinyl chloride); SEBS (styrene–ethylene–butylene–styrene).
Coasts 06 00026 g003
Figure 4. Relative composition (%) of (a) particle shapes and (b) color categories of microplastics across five recreational zones. Bar heights represent the proportion of each category within each zone, expressed as percentages of total identified particles per zone.
Coasts 06 00026 g004
Figure 5. Examples of microplastic particles observed in sediment samples, including (a) a green fiber, (b) a green fiber bundle consisting of multiple intertwined fibers, (c) a blue fragment, and (d) a blue fragment with visible sediment grains attached.
Coasts 06 00026 g005
Figure 6. Boxplots of microplastic abundance across three management regimes (National Park, n = 18; HWK Station, n = 6; Community, n = 6). Whiskers extend to 1.5× the interquartile range. Jittered points represent individual samples, slightly offset to avoid overlap. Differences among management regimes were assessed using a generalized linear model, and pairwise comparisons indicated significantly higher microplastic abundance in the HWK Station regime compared with the National Park regime (p < 0.05). Different letters above the boxes indicate statistically significant differences among management regimes.
Coasts 06 00026 g006
Disclaimer/Publisher’s Note: The statements, opinions and data contained in all publications are solely those of the individual author(s) and contributor(s) and not of MDPI and/or the editor(s). MDPI and/or the editor(s) disclaim responsibility for any injury to people or property resulting from any ideas, methods, instructions or products referred to in the content.