Article

Fine-Scale Patterns in Bacterial Communities on a Gulf Coast Beach

Department of Biology, University of Mississippi, Oxford, MS 38677, USA
*
Author to whom correspondence should be addressed.
Coasts 2025, 5(3), 34; https://doi.org/10.3390/coasts5030034
Submission received: 28 July 2025 / Revised: 30 August 2025 / Accepted: 5 September 2025 / Published: 9 September 2025

Abstract

Despite being low-resource environments, sandy beaches can contain diverse bacterial assemblages. In this study we examined the spatial heterogeneity of bacterial communities in sand on a beach on the Mississippi Gulf Coast, USA. 16S ribosomal RNA gene sequencing was used to characterize bacterial communities in surface sand along 10 m transects from dry sand towards the upper beach to fully submerged sand, as well as up to 0.4 m deep into the sand. There were clear gradients in bacterial community structure based on position on the beach and depth, and community richness and diversity was greater in moist sand subject to tidal influence than drier sand. Bacterial communities in sand higher up the beach were characterized by members of the phyla Bacillota and Actinomycetota, whereas there was an increased presence of picocyanobacteria (phylum Cyanobacteriota) in sand closer to the water and greater diversity overall. Along with gradients in community structure, microbial activity also showed spatial patterns, with microbial extracellular enzyme activity being greatest in surface sand at intermediate positions along the beach transects that were subject to tidal influences but not fully submerged. This research supports the idea of beaches containing diverse bacterial communities and demonstrates that the existence of gradients in beach environments means that these communities show clear patterns in their spatial distribution.

1. Introduction

Coastal ecosystems are dynamic interfaces between terrestrial and marine environments, and microbial communities in these systems play important roles in biogeochemical cycling [1]. Globally, beaches account for over 1/3 of coastal ecosystems that are free of ice [2], although historically little was known about the composition or activity of bacterial communities in sandy beach sediments. The low-resource nature of sandy beaches means that they have been thought of as ecological deserts [3]. However, more widespread use of 16S rRNA gene sequencing has shown that sandy environments are not desolate in terms of their bacterial communities [4]. Beach bacterial communities can be diverse, show geographic and temporal variation, and differ in composition between freshwater and marine beaches [5,6,7].
At a finer scale, within a beach, microbial communities in beach sands are subject to strong environmental gradients. Bacterial community composition varies along these spatial gradients, particularly across the shifting boundaries of the intertidal zone, and transitions from the submerged zone to the dry upper shore can influence microbial composition, activity, and nutrient dynamics [7,8]. Moisture is a potential driver of microbial activity and composition in soils [9], and gradients in moisture content, along with variation in salinity, oxygen and organic matter availability likely drive changes in beach microbial community structure [7]. Submerged and lower shore sand supports different bacterial groups than drier, more oxygen-rich upper beach sands [7,10], and such differences in community composition may also reflect differences in functional capacity. While these trends are increasingly recognized, detailed studies examining fine-scale transitions in bacterial communities across beach transects remain limited, particularly in the context of moisture-driven gradients. Depth in sand provides the potential for variation in beach bacterial communities along an additional dimension, and the activity and composition of bacterial communities in resource-rich, high organic matter content soils have been found to vary with depth, likely because of depth-related gradients in resources, moisture, and redox status [11,12]. Less is known about how microbial communities change with depth in resource-poor environments such as in the sandy soils of beaches, and there is a general lack of knowledge of how bacterial communities are structured along fine-scale vertical and horizontal gradients in these systems. Given the importance of bacterial communities to the biogeochemistry of marine systems [13,14], such fine-scale patterns could have broader implications for processes such as nutrient cycling and how coastal systems respond to environmental change.
While studies have begun to describe patterns in the natural bacterial communities of a variety of beaches, those of the U.S. Gulf coast are relatively underexplored. The northern Gulf of Mexico is bordered by five U.S. states and is important for economic activity in these coastal areas [15,16]. Gulf habitats support diverse wildlife, absorb flood waters, and filter runoff from the Mississippi River, but the region has faced environmental problems from natural and anthropogenic disturbances [16]. Of note, the Deepwater Horizon accident discharged almost 5 million barrels of crude oil into the Gulf of Mexico in 2010, and a portion of this reached coastal ecosystems, impacting over 800 km of beaches on the northern Gulf of Mexico [17]. This led to interest in the microbial community of these beaches for potential bioremediation, and there were increases in the abundance and activity of hydrocarbon-degrading bacteria in these systems after the Deepwater Horizon accident [18,19,20,21]. However, despite this interest, our knowledge of the spatial distribution of natural bacterial communities on many Gulf coast beaches is lacking.
This study examined spatial patterns in natural bacterial communities in sand on a beach on the Mississippi Gulf Coast. Sand was sampled along a gradient from submerged sand in the intertidal zone to dry sand higher up the beach, as well as at different depths. The composition of the beach bacterial community was determined via 16S rRNA gene sequencing and the functional capability of the community as related to carbon, nitrogen, and phosphorus cycling was assessed through assays of microbial extracellular enzyme activity. We hypothesized that beach bacterial communities would vary along beach gradients, showing differences in community composition and diversity at different positions and depths. Further, we hypothesized that microbial activity would differ based on beach position, with moister sand in the intertidal zone showing the greatest enzyme activity. Our results show that position on the beach does significantly influence enzyme activity and beach bacterial community diversity; however, bacterial communities were generally more active and diverse at positions of intermediate moisture. Depth in sand also influenced bacterial community composition, with gradients in bacterial community structure present even over depths of 0.1–0.4 m. Our research provides important information on the bacterial communities of a northern Gulf of Mexico beach and shows that these communities can show substantial variation over fine spatial scales.

2. Materials and Methods

2.1. Sampling and Processing of Beach Sediments

Sampling occurred at Biloxi East Beach, Biloxi, MS, USA, on the Mississippi Gulf Coast (Figure 1; specific GPS coordinates 30.392795, −88.876912). Sampling occurred on 7 August 2024, from 11:00 am to 12:00 pm. Four transects were established, 5 m apart (a distance judged to be far enough such that sampling one transect would not affect another), each starting in dry sand (gravimetric moisture content determined to be <1%) at 0 m and extending 10 m toward the water. Surface sand was collected at five sampling positions (0, 2.5, 5, 7.5, and 10 m) within each transect, representing a gradient from dry sand (0 m) to fully submerged sand (10 m), to give 20 surface sand samples in total. Sand was collected by scooping sand into sterile 50 mL centrifuge tubes. Additional samples (16) were collected from different sampling depths (0.1, 0.2, 0.3, and 0.4 m below the surface) at the central (5 m) position of the spatial gradient. To reach each of the sampling depths, a shovel was sterilized with 70% ethanol and used to dig to the correct depth. Once the correct depth was reached, sterile 50 mL centrifuge tubes were used to collect sand from each depth. Water parameters (pH, conductivity, salinity, temperature, and dissolved oxygen) and air temperature were measured at the time of sampling. Sand samples were placed on ice immediately after collection and transported to the laboratory for sample processing (6 h after sampling).
A subsample (0.5 g) of each sand sample was frozen (−20 °C) for subsequent DNA extraction. A second subsample (about 5 g) of each surface sand sample was weighed, dried (70 °C, 48 h), reweighed, then burned (500 °C, 2 h) and reweighed [22,23,24] to determine gravimetric moisture and organic matter content along each transect. Other subsamples of all sand samples were assayed for microbial extracellular enzyme activity.

2.2. Assays of Microbial Extracellular Enzyme Activity

Sand samples were assayed for the activity of microbial extracellular enzymes involved in carbon, nitrogen, and phosphorus cycling using artificial substrates. Activities were determined for β-glucosidase, N-acetylglucosaminidase (NAGase), and phosphatase following p-nitrophenyl (pNP) substrate protocols adapted from Jackson et al. [24], and for phenol oxidase and peroxidase following protocols adapted from Jackson et al. [25]. pNP substrate solutions (5 mM of pNP-phosphate and pNP-β-glucopyranoside, 2 mM of pNP-β-N-acetylglucosaminide) were prepared in sterile water, with 300 µL used in each assay. Phenol oxidase and peroxidase were assayed using 300 µL of 5 mM solutions of L-3,4-dihydroxyphenylalanine (L-DOPA) also prepared in sterile water, with peroxidase assays also including 30 µL of 0.03% H2O2. Each assay included three replicates of each sample (approximately 1 g sand per replicate), two substrate controls, and two sample controls. Assays were conducted in microcentrifuge tubes, which were mixed after the substrate solutions were added and incubated at room temperature for 3 h (NAGase), 2 h (peroxidase and phenol oxidase), or 1 h (β-glucosidase and phosphatase). After incubation, microcentrifuge tubes were centrifuged (2 min, 10,000× g), and 150 µL of supernatant transferred from each tube to microplates containing 150 µL of 0.067 M NaOH (pNP assays) or 150 µL of sterile water (L-DOPA assays). Absorbance was recorded with a Synergy H1 microplate reader (BioTek, Winooski, VT, USA) at 410 nm (pNP assays) or 460 nm (L-DOPA assays), and enzyme activity was determined in nmol substrate consumed h−1 g−1 dry sand as described by Jackson et al. [24].

2.3. DNA Extraction, Amplification, and Sequencing

DNA was extracted from frozen sand using a PowerSoil Pro DNA extraction kit (Qiagen, Germantown, MD, USA), and a 250-base pair (bp) section of the V4 region of the bacterial 16S rRNA gene was amplified as described by Jackson et al. [26]. A dual-index barcoding approach was used for Illumina next-generation sequencing [27], where each primer was tagged with a specific 8-nucleotide barcode. Following amplification, barcoded amplicons were standardized using SequalPrep plates (Life Technologies, Grand Island, NY, USA) and pooled prior to sequencing. The assembled library was spiked with 20% PhiX [26] and sequenced using an Illumina NextSeq (Illumina, San Diego, CA, USA) at the University of Mississippi Medical Center’s (UMMC) Molecular and Genomics Core Facility.
Raw sequence fastq files were processed using the standard 16S rRNA pipeline of the DADA2 package version 1.26.0 within R version 4.2.2 [28]. Sequences were trimmed at truncLen = c(280,220) bp and the quality profile plots were inspected to ensure proper quality of the trimmed reads. Forward and reverse reads were merged with minLen = 135 bp, and sequences shorter than 250 bp or longer than 256 bp were removed. Sequences were classified against the SILVA database [29] v138.1 (released August 2020) using phyla nomenclature based on valid lists [30,31,32]. Sequences identified as potential chimeras were removed using the removeBimeraDenovo function of DADA2, followed by the filtered removal of sequences identified as chloroplasts, mitochondria, Archaea, or Eukarya. The remaining bacterial sequences were clustered into amplicon sequence variants (ASVs). After clustering of sequences into ASVs, all samples were rarefied by randomly subsampling each to the lowest sequence count observed across all samples (6773 sequences) to normalize sequencing depth for downstream analyses. Good’s coverage score was calculated using the phyloseq_coverage function of the metagMisc v.0.5.0 R package [33] to determine the effective sequencing depth of each sample.

2.4. Statistical Analyses

The calculated enzyme activity (nmol h−1 g−1) of each sand sample was compared between sampling position and sampling depth using separate one-way analysis of variance (ANOVA) and significant differences were further analyzed using TukeyHSD post hoc tests. Linear regressions were used to assess the influence of sand moisture content on the activity of all measured enzymes. Alpha diversity of each sand sample was determined as bacterial species richness (species observed) and species diversity (Inverse Simpson’s index), each calculated using the estimate_richness function of the phyloseq R package [34]. Alpha diversity metrics were compared between sampling position and sampling depths using one-way ANOVA and TukeyHSD. Permutational analysis of variance (PERMANOVA) was used to assess differences in bacterial community composition based on Bray–Curtis dissimilarity scores and visualized with non-metric multidimensional scaling (NMDS). The pairwise.adonis function from the pairwiseAdonis package [35] was used for post hoc analyses. Relative abundances of dominant bacterial taxa (those accounting for >1.0% of the 16S rRNA gene sequences in the entire dataset) were compared between sand samples using multivariate analysis of variance (MANOVA). Correlations between Bray–Curtis dissimilarity scores of sand bacterial communities and the most dominant ASVs (those comprising >0.3% of all bacterial sequences) were assessed with the envfit function from the vegan R package [36]. The abundance of these dominant ASVs were compared between sand samples using MANOVA. Pearson correlations were used to assess positive associations between the relative abundance of dominant phyla or ASVs in the sand bacterial community and enzymatic activity, using r = 0.5 as an indication of a potential moderate correlation.

3. Results

Water parameters at the time of sampling were pH: 8.06, conductivity: 38.0 µS cm−1, salinity: 19 ppt, temperature: 31.5 °C, and dissolved oxygen: 74.1 mg L−1. The air temperature was 34 °C. Moisture content of sand increased along the 10 m sampling transects (Figure 2A; F4,14 = 183.3, p < 0.001). In terms of specific comparisons between sample positions, sand moisture content at 0 and 2.5 m was not significantly different from each other (p-adj > 0.05), and neither was moisture content at 7.5 and 10 m (p-adj > 0.05), but all other pairwise comparisons of positions had significantly different sand moisture content (Figure 2A). Organic matter content in sand was consistently <3% of the total dry weight and also differed based on transect position (F4,14 = 6.74, p < 0.01), tending to increase down the transects towards the water (Figure 2B), with sand at the 2.5 m position having significantly less organic matter than sand at 5, 7.5, and 10 m (p-adj < 0.05 for all).
Microbial enzyme activity varied based on position along the beach transects (Figure 3A) with position having a significant effect on the activity of NAGase (ANOVA; F4,14 = 4.88, p < 0.05), phosphatase (F4,14 = 8.56, p < 0.01), and phenol oxidase (F4,14 = 36.9, p < 0.001). While position on the beach significantly affected enzyme activity, linear relationships between sand moisture content and the activity of each enzyme were not significant (p > 0.05 for each enzyme), and enzyme activity typically peaked at the central sampling point which had intermediate moisture content (Figure 3A). Sampling depth significantly affected the activity of phosphatase (F4,15 = 3.92, p < 0.05) and phenol oxidase (F4,15 = 23.9, p < 0.001), with activities of each decreasing with depth (Figure 3B). Notably, surface sand collected at the central 5 m position (the position where depth was examined) exhibited the highest enzyme activity among all samples (TukeyHSD; p-adj < 0.05 for all pairwise comparisons).
Sand samples had a mean (±standard error) of 194,793 ± 34,011 bacterial sequence reads recovered, which were clustered into 22,984 ASVs. After rarefaction and removal of singletons, 11,161 ASVs were used for downstream analysis, with a final Good’s coverage score of 92.4%.
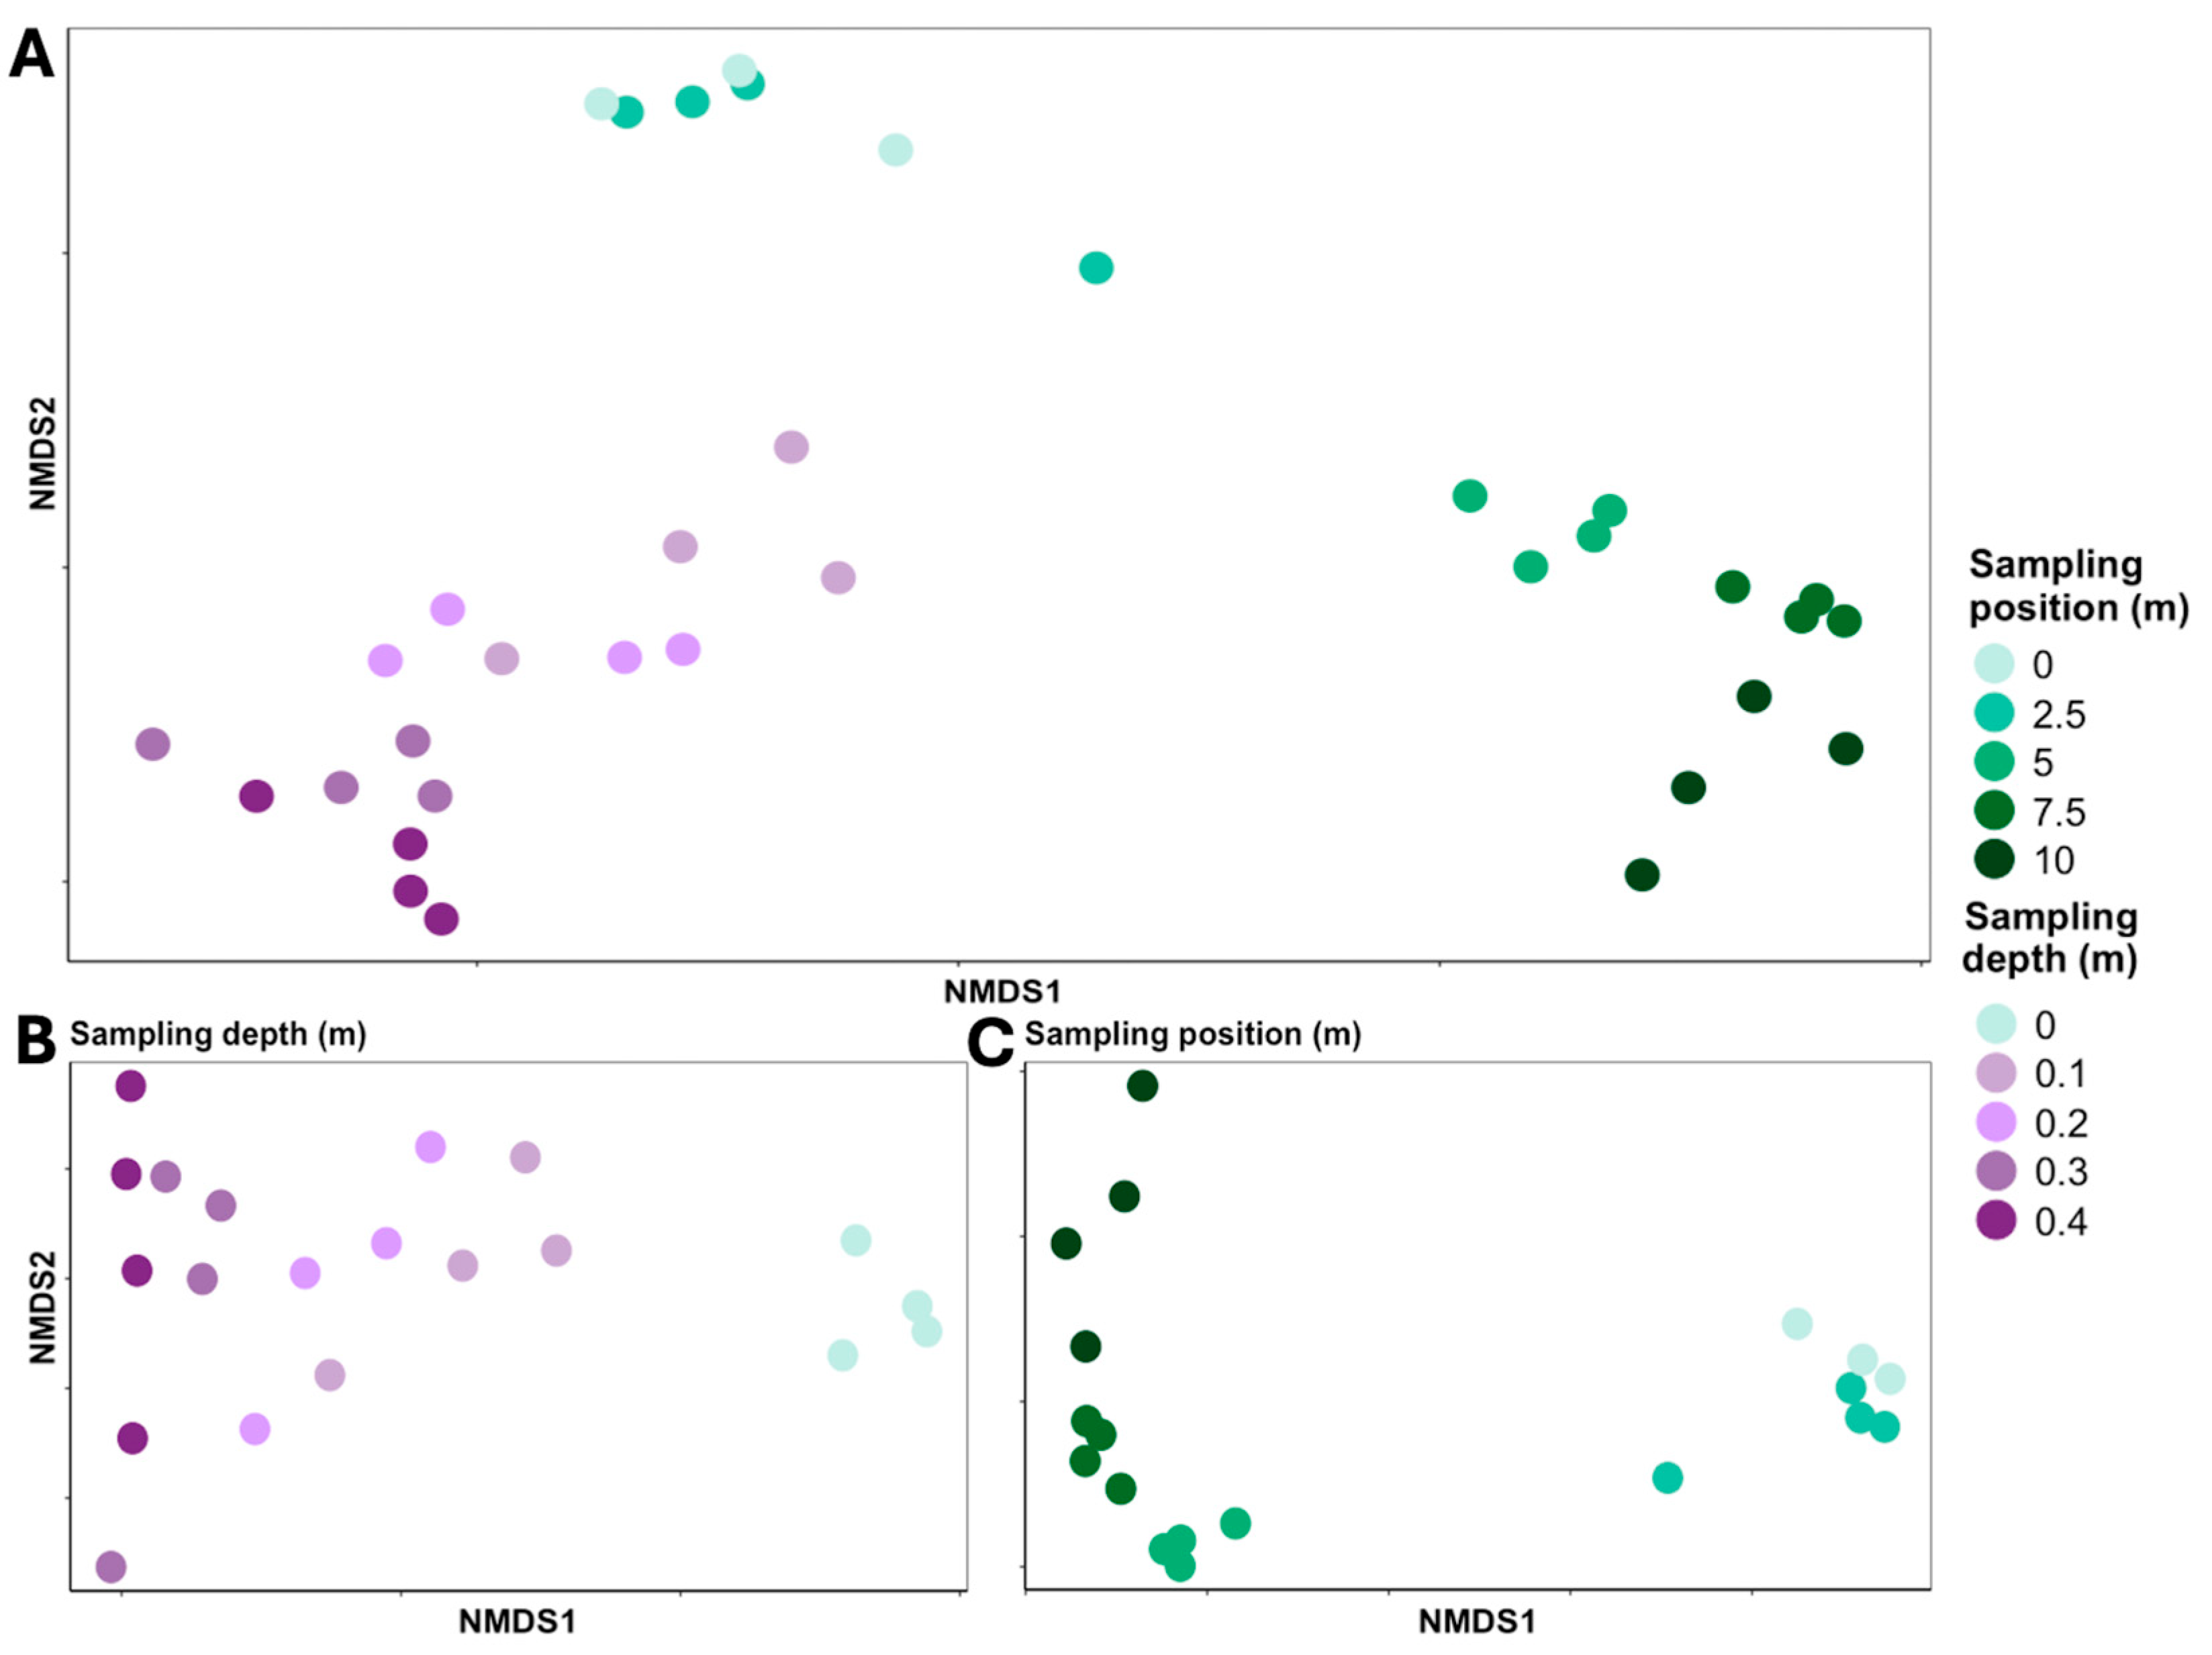
The overall composition of the sand bacterial community varied significantly between sampling position along each transect and with depth (PERMANOVA; F8,23 = 8.28, R2 = 0.70, p < 0.001) but not between sampling transects (p > 0.05; Figure 4). Along the sampling transects, bacterial community composition of surface sand differed significantly based on sampling position (F4,14 = 9.33, R2 = 0.73, p < 0.001), although no pairwise comparisons between two specific positions were significant (pairwise.adonis; p-adj > 0.05). Similarly, overall bacterial community composition at the 5 m position varied significantly with sampling depth (F4,15 = 5.06, R2 = 0.57, p < 0.001), but there were no pairwise comparisons between specific depths that were significant (p-adj > 0.05). For sampling position and depth, NMDS ordinations showed that bacterial communities generally followed a gradient as they transitioned by position along the transects or deeper into the sand (Figure 4).
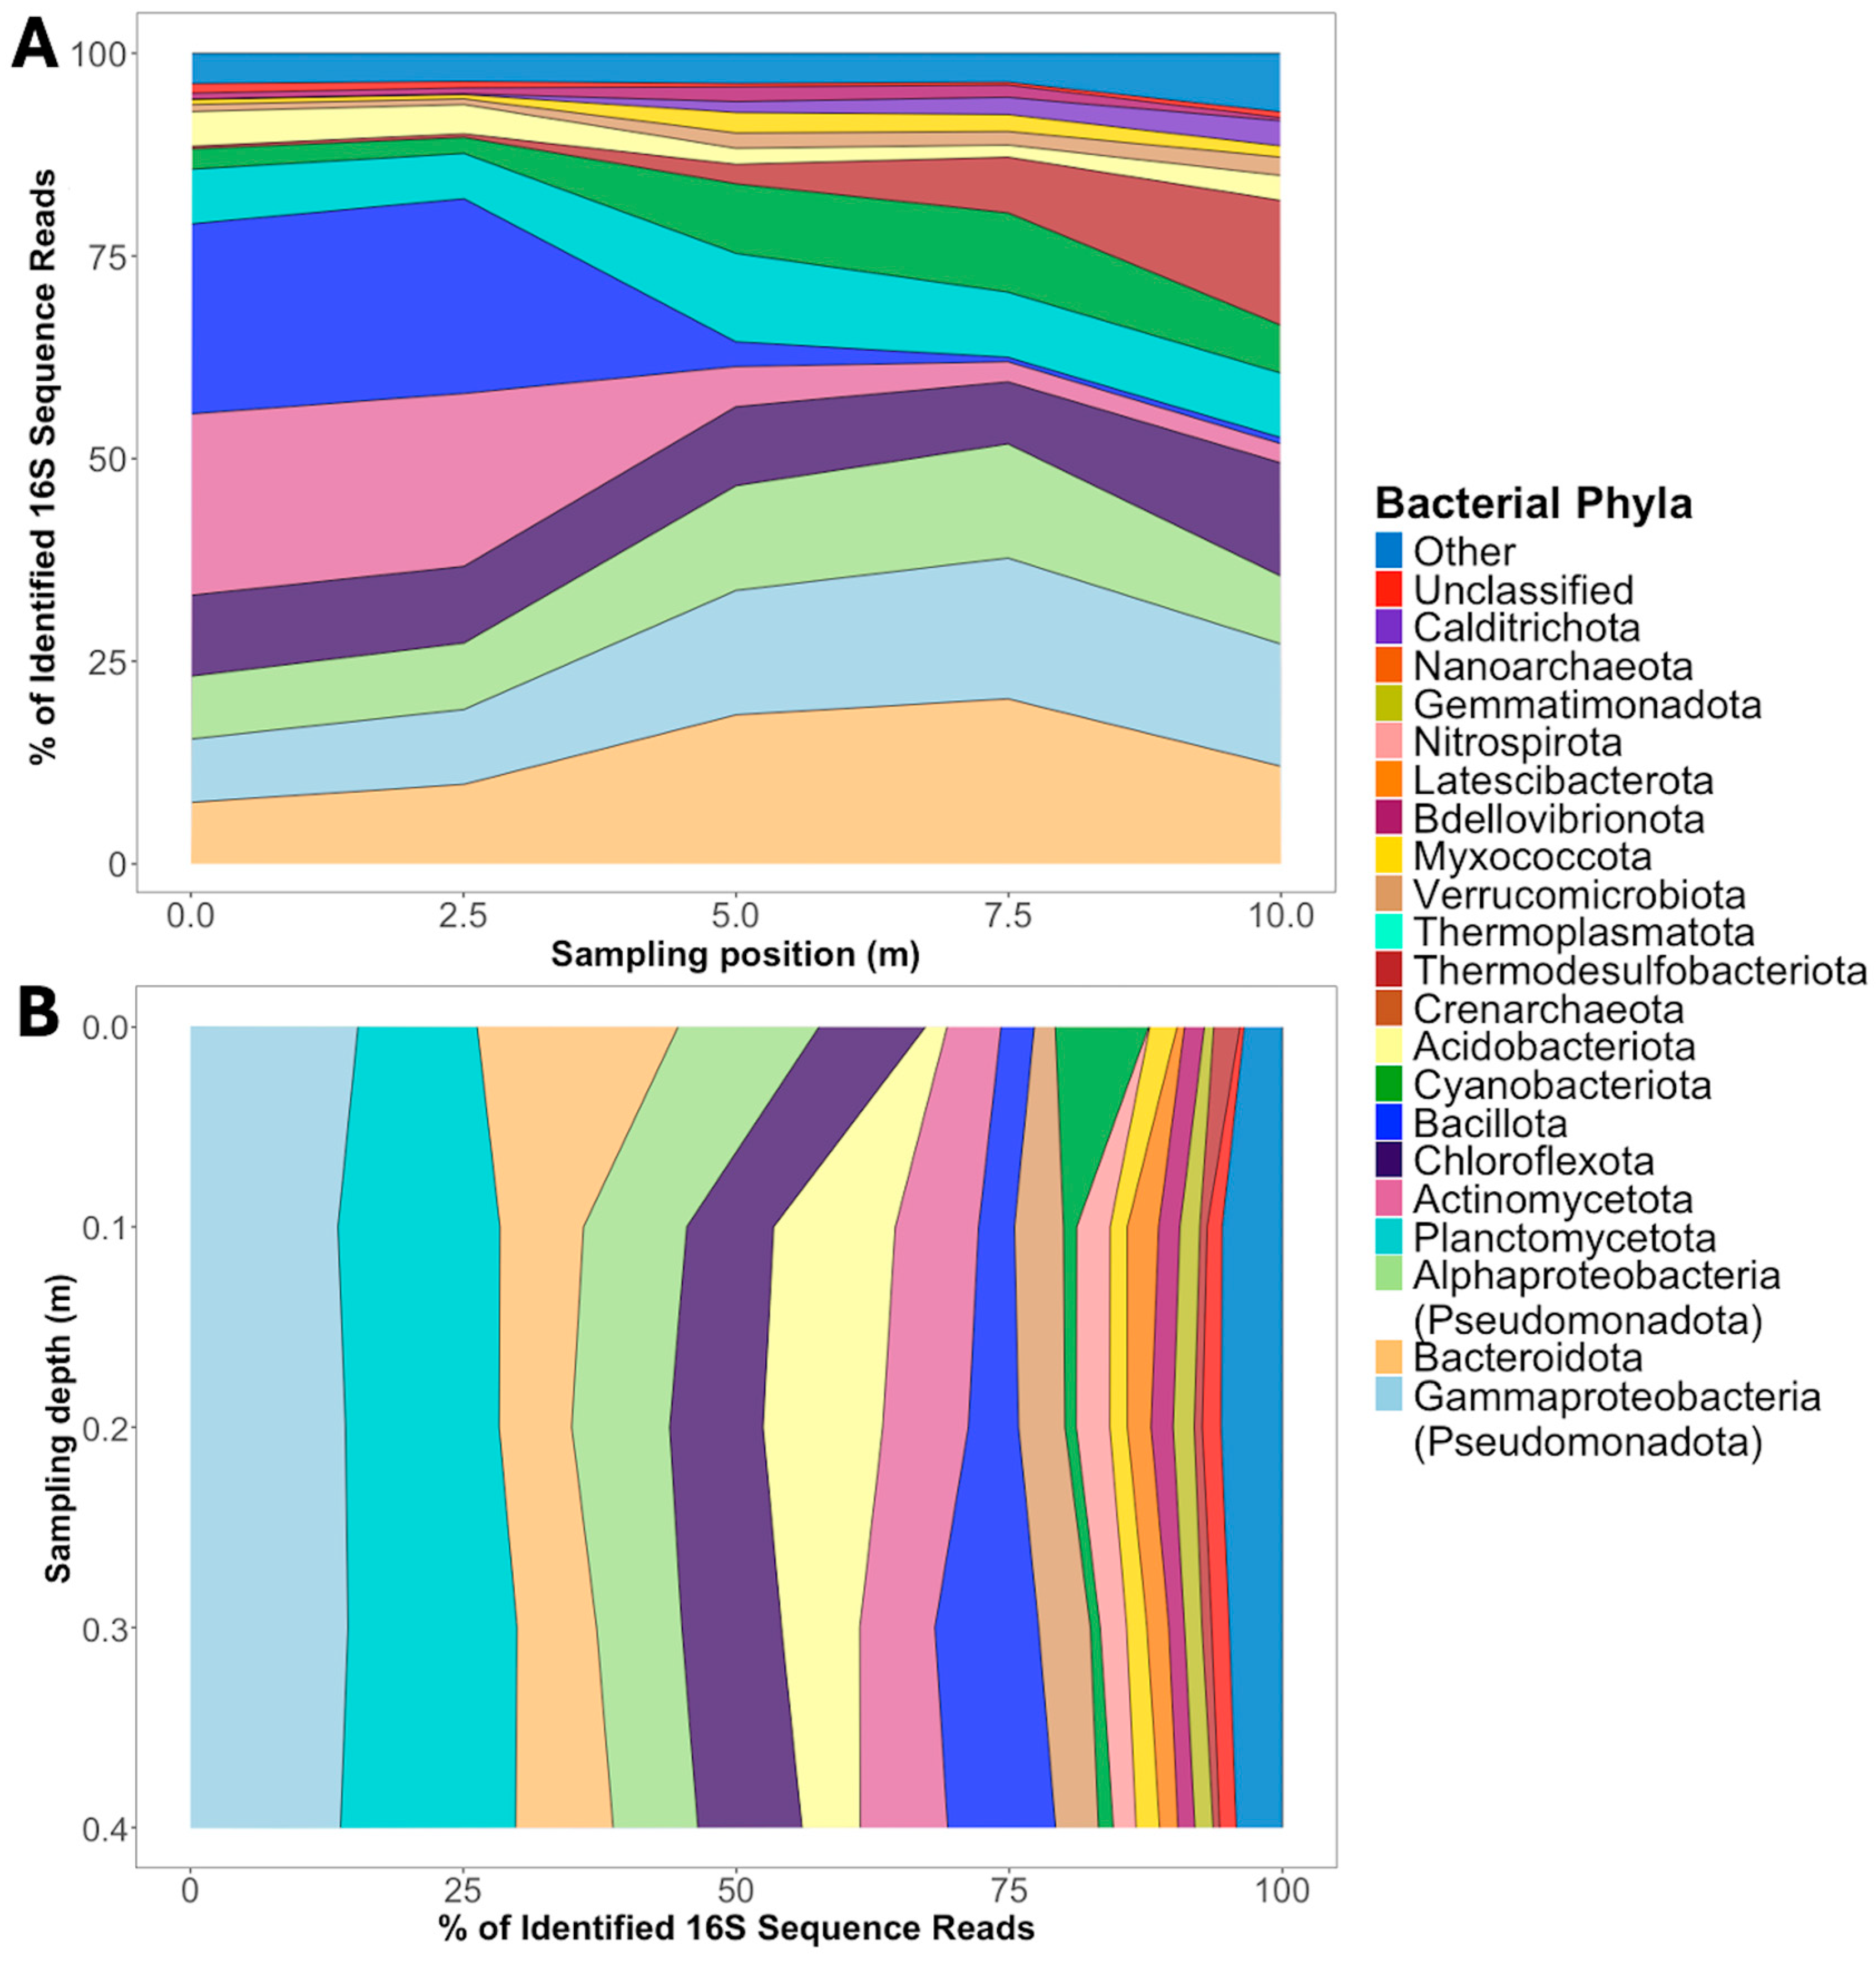
Based on composition of 16S rRNA gene sequences, the most abundant bacterial phyla (those comprising >1% of sequences overall) in surface sand were Bacteroidota (14.0% of sequences), classes Gammaproteobacteria (13.3%) and Alphaproteobacteria (10.4%) in the Pseudomonadota, Chloroflexota (10.2%), Actinomycetota (10.1%), Bacillota (9.7%), Planctomycetota (7.9%), Cyanobacteriota (5.9%), Thermodesulfobacteriota (5.3%), Acidobacteriota (2.8%), Verrucomicrobiota (1.5%), Myxococcota (1.5%), Calditrichota (1.4%), and Bdellovibrionota (1.1%), with 0.62% of sequences being unclassified to a phylum (Figure 5A). The proportions of these dominant phyla in the sand community differed significantly between sampling positions (MANOVA; F4,14 = 3.85–79.9, p < 0.001–0.05) but not between transects (p > 0.05). Of the 10 specific pairwise comparisons between the different beach positions (0, 2.5, 5, 7.5, and 10 m) for each phylum (i.e., 140 total pairwise comparisons across these dominant taxa), the proportions of Bacteroidota, Alphaproteobacteria, Actinomycetota, Bacillota, Planctomycetota, Thermodesulfobacteriota, Acidobacteriota, Verrucomicrobiota, Myxococcota, Calditrichota, and Bdellovibrionota differed significantly (p < 0.001–0.05) for most (≥5) specific pairwise comparisons of beach position, whereas proportions of Gammaproteobacteria, Chloroflexota, and Cyanobacteriota differed (p < 0.01–0.05) between just a few specific pairs of positions (typically between 0 or 2.5 and 10 m). Of particular note, the proportions of Bacillota and Actinomycetota in the bacterial community were much higher at the 0 and 2.5 m positions than further down the transects, whereas the Bdellovibrionota were relatively more abundant at 7.5 and 10 m, and groups such as the Bacteroidota and Gammaproteobacteria accounted for a greater proportion of the surface sand community from 5 m onward (Figure 5A).
In sand samples collected from different depths at the 5 m position, 16 bacterial phyla each accounted for >1% of the 16S rRNA sequences recovered: Gammaproteobacteria (Pseudomonadota; 14.3% of sequences), Planctomycetota (14.3%), Bacteroidota (9.8%), Alphaproteobacteria (Pseudomonadota; 9.4%), Chloroflexota (9.0%), Acidobacteriota (7.3%), Actinomycetota (7.1%), Bacillota (6.1%), Verrucomicrobiota (3.9%), Cyanobacteriota (2.6%), Nitrospirota (2.1%), Myxococcota (2.0%), Latescibacterota (1.9%), Bdellovibrionota (1.8%), Gemmatimonadota (1.6%), and Thermodesulfobacteriota (1.1%; Figure 5B). Unclassified sequences accounted for 1.3% of the total. There were significant differences in the proportions of these phyla in the sand bacterial community based on depth, but not transect, with the relative abundances of all phyla except Gammaproteobacteria, Chloroflexota, and Bdellovibrionota showing depth-related differences in relative abundance (F4,15 = 3.22–70.4, p < 0.001–0.05; Figure 5B).
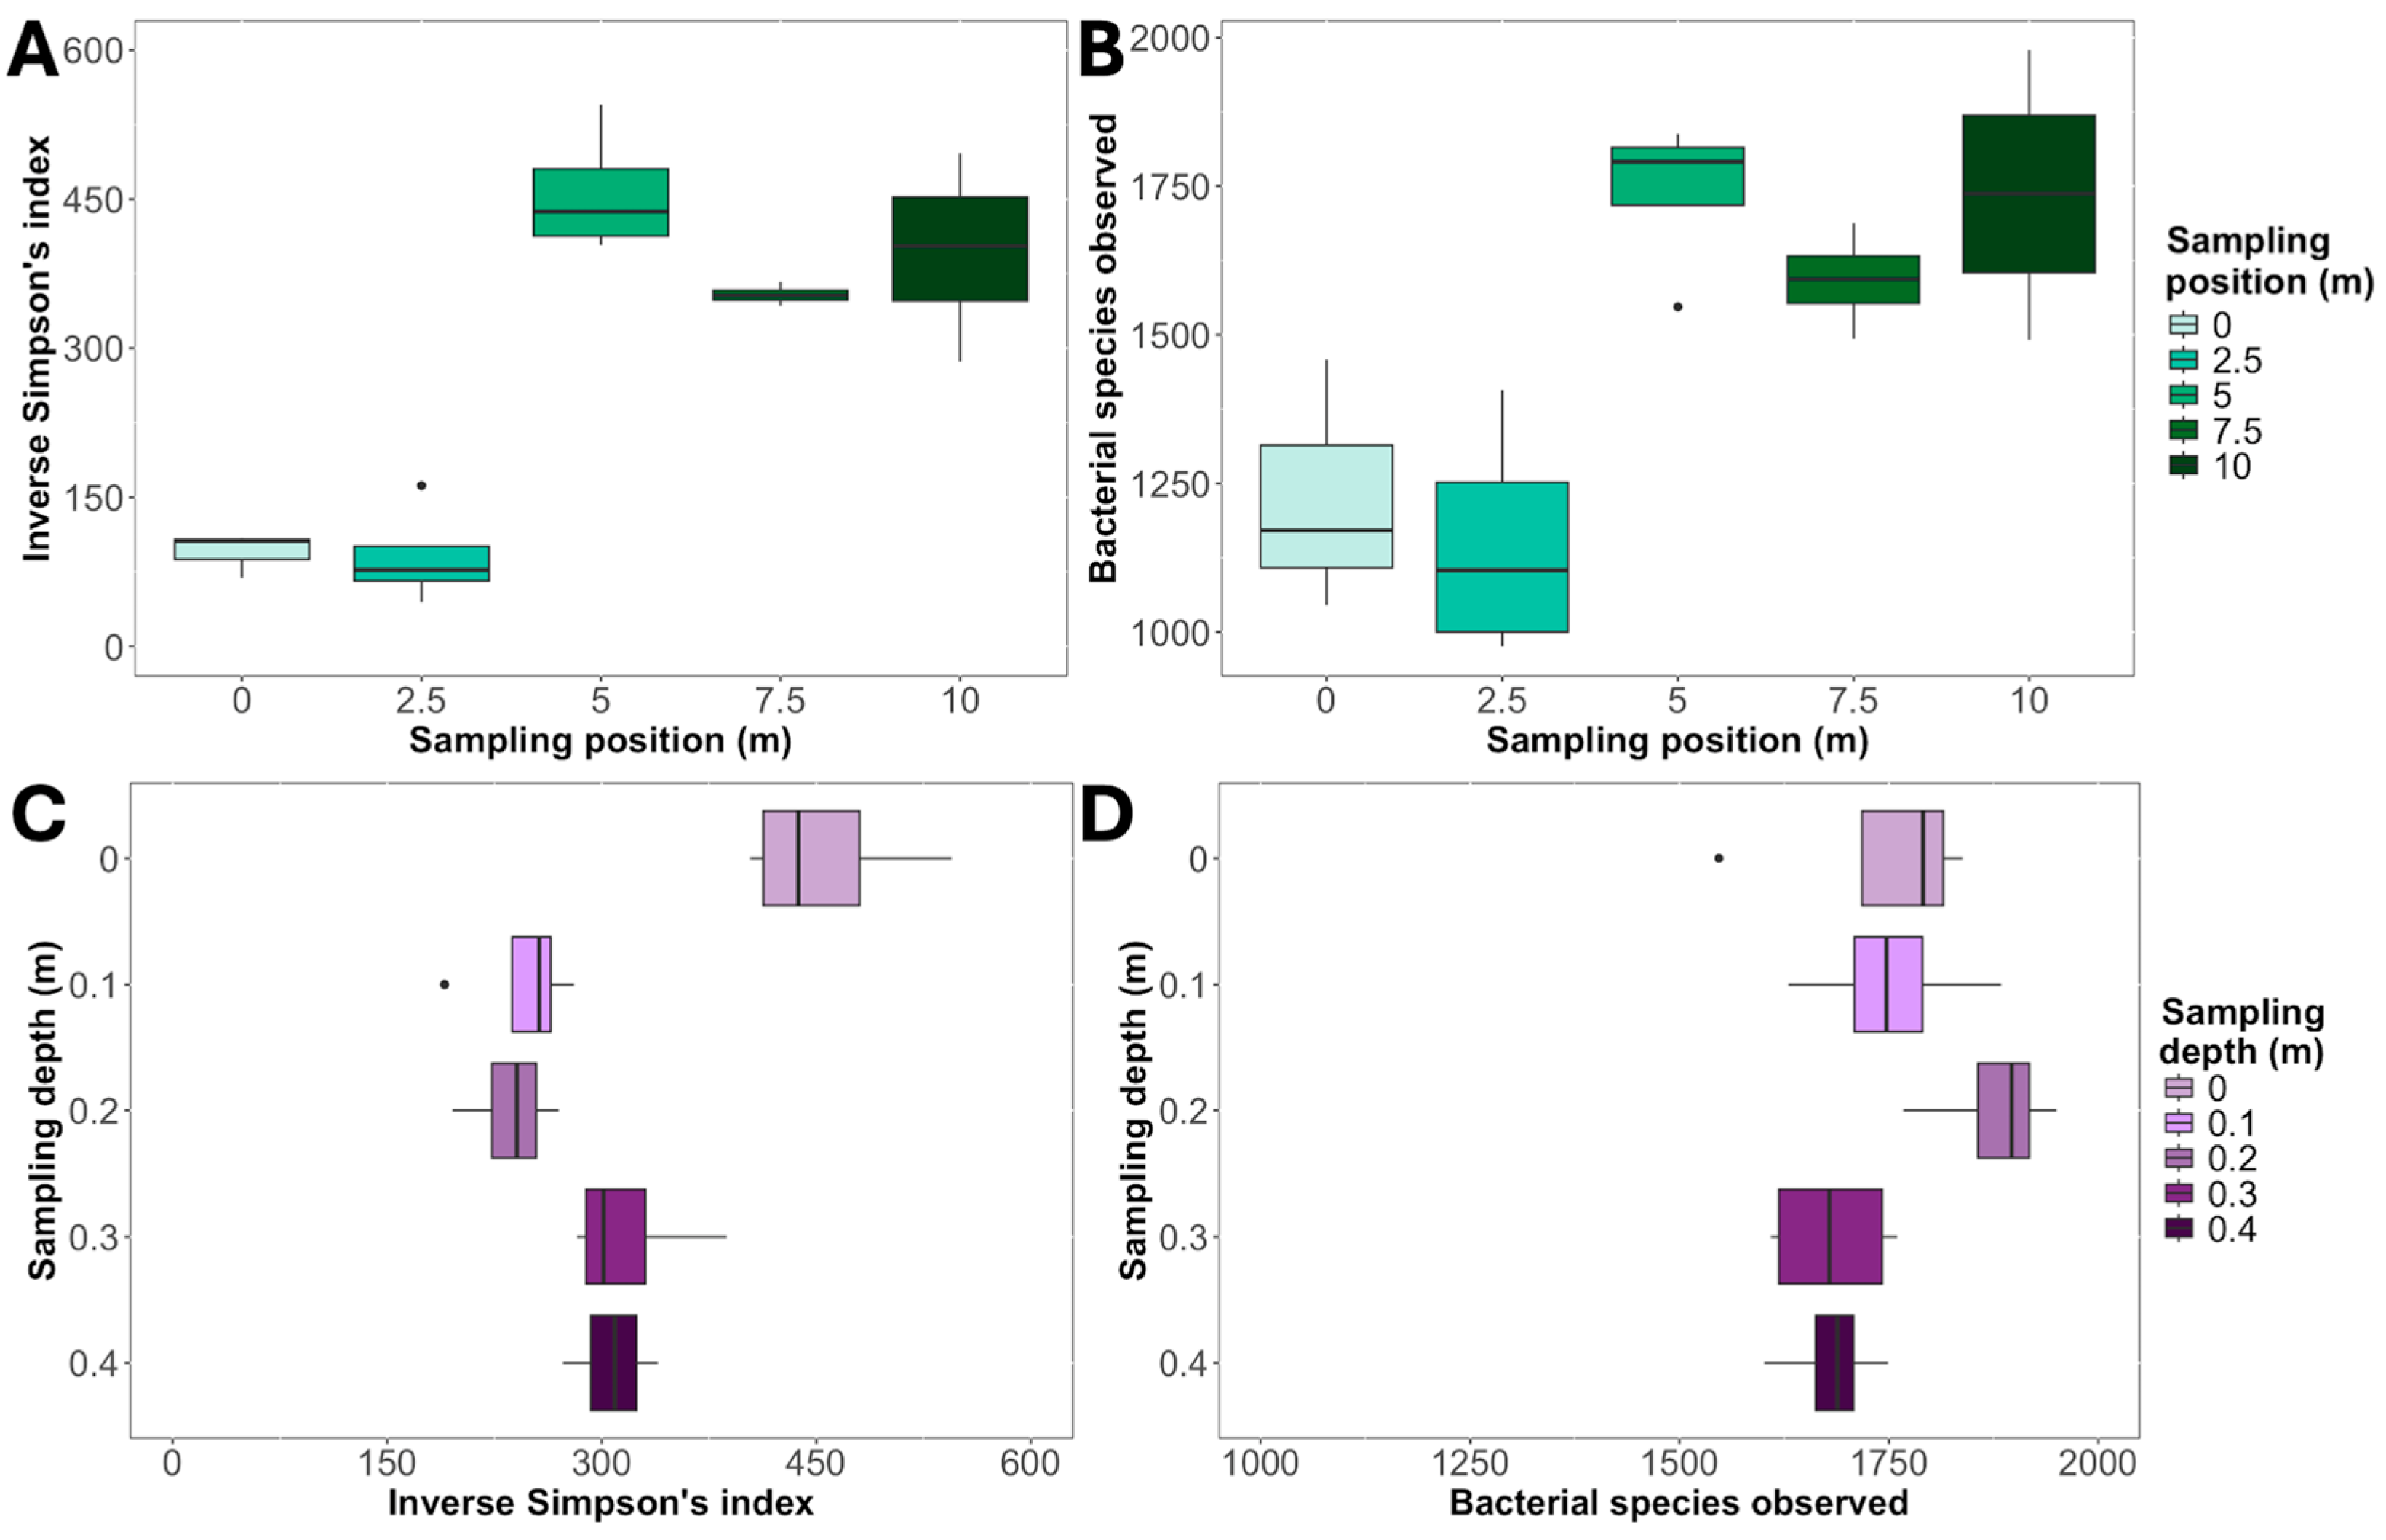
Bacterial species diversity in surface sand (the 0.0 m depth) as measured by the Inverse Simpson’s index and bacterial species richness (calculated as species observed in the dataset) differed significantly based on sampling position along the beach transects (ANOVA; F4,14 = 34.3, p < 0.001 and F4,14 = 10.2, p < 0.001, respectively; Figure 6A,B). Sampling depth also significantly affected species diversity (F4,15 = 15.9, p < 0.001; Figure 6C), but not species richness (p > 0.05; Figure 6D). There were no significant differences in bacterial species diversity or richness between transects (p > 0.05). Along the transects, bacterial species diversity and richness was higher at the 5, 7.5 and 10 m positions compared to the 0 and 2.5 m positions further up the beach. In terms of depth, the surface sand had higher bacterial diversity than that collected at 0.1, 0.2, 0.3, and 0.4 m (Figure 6).
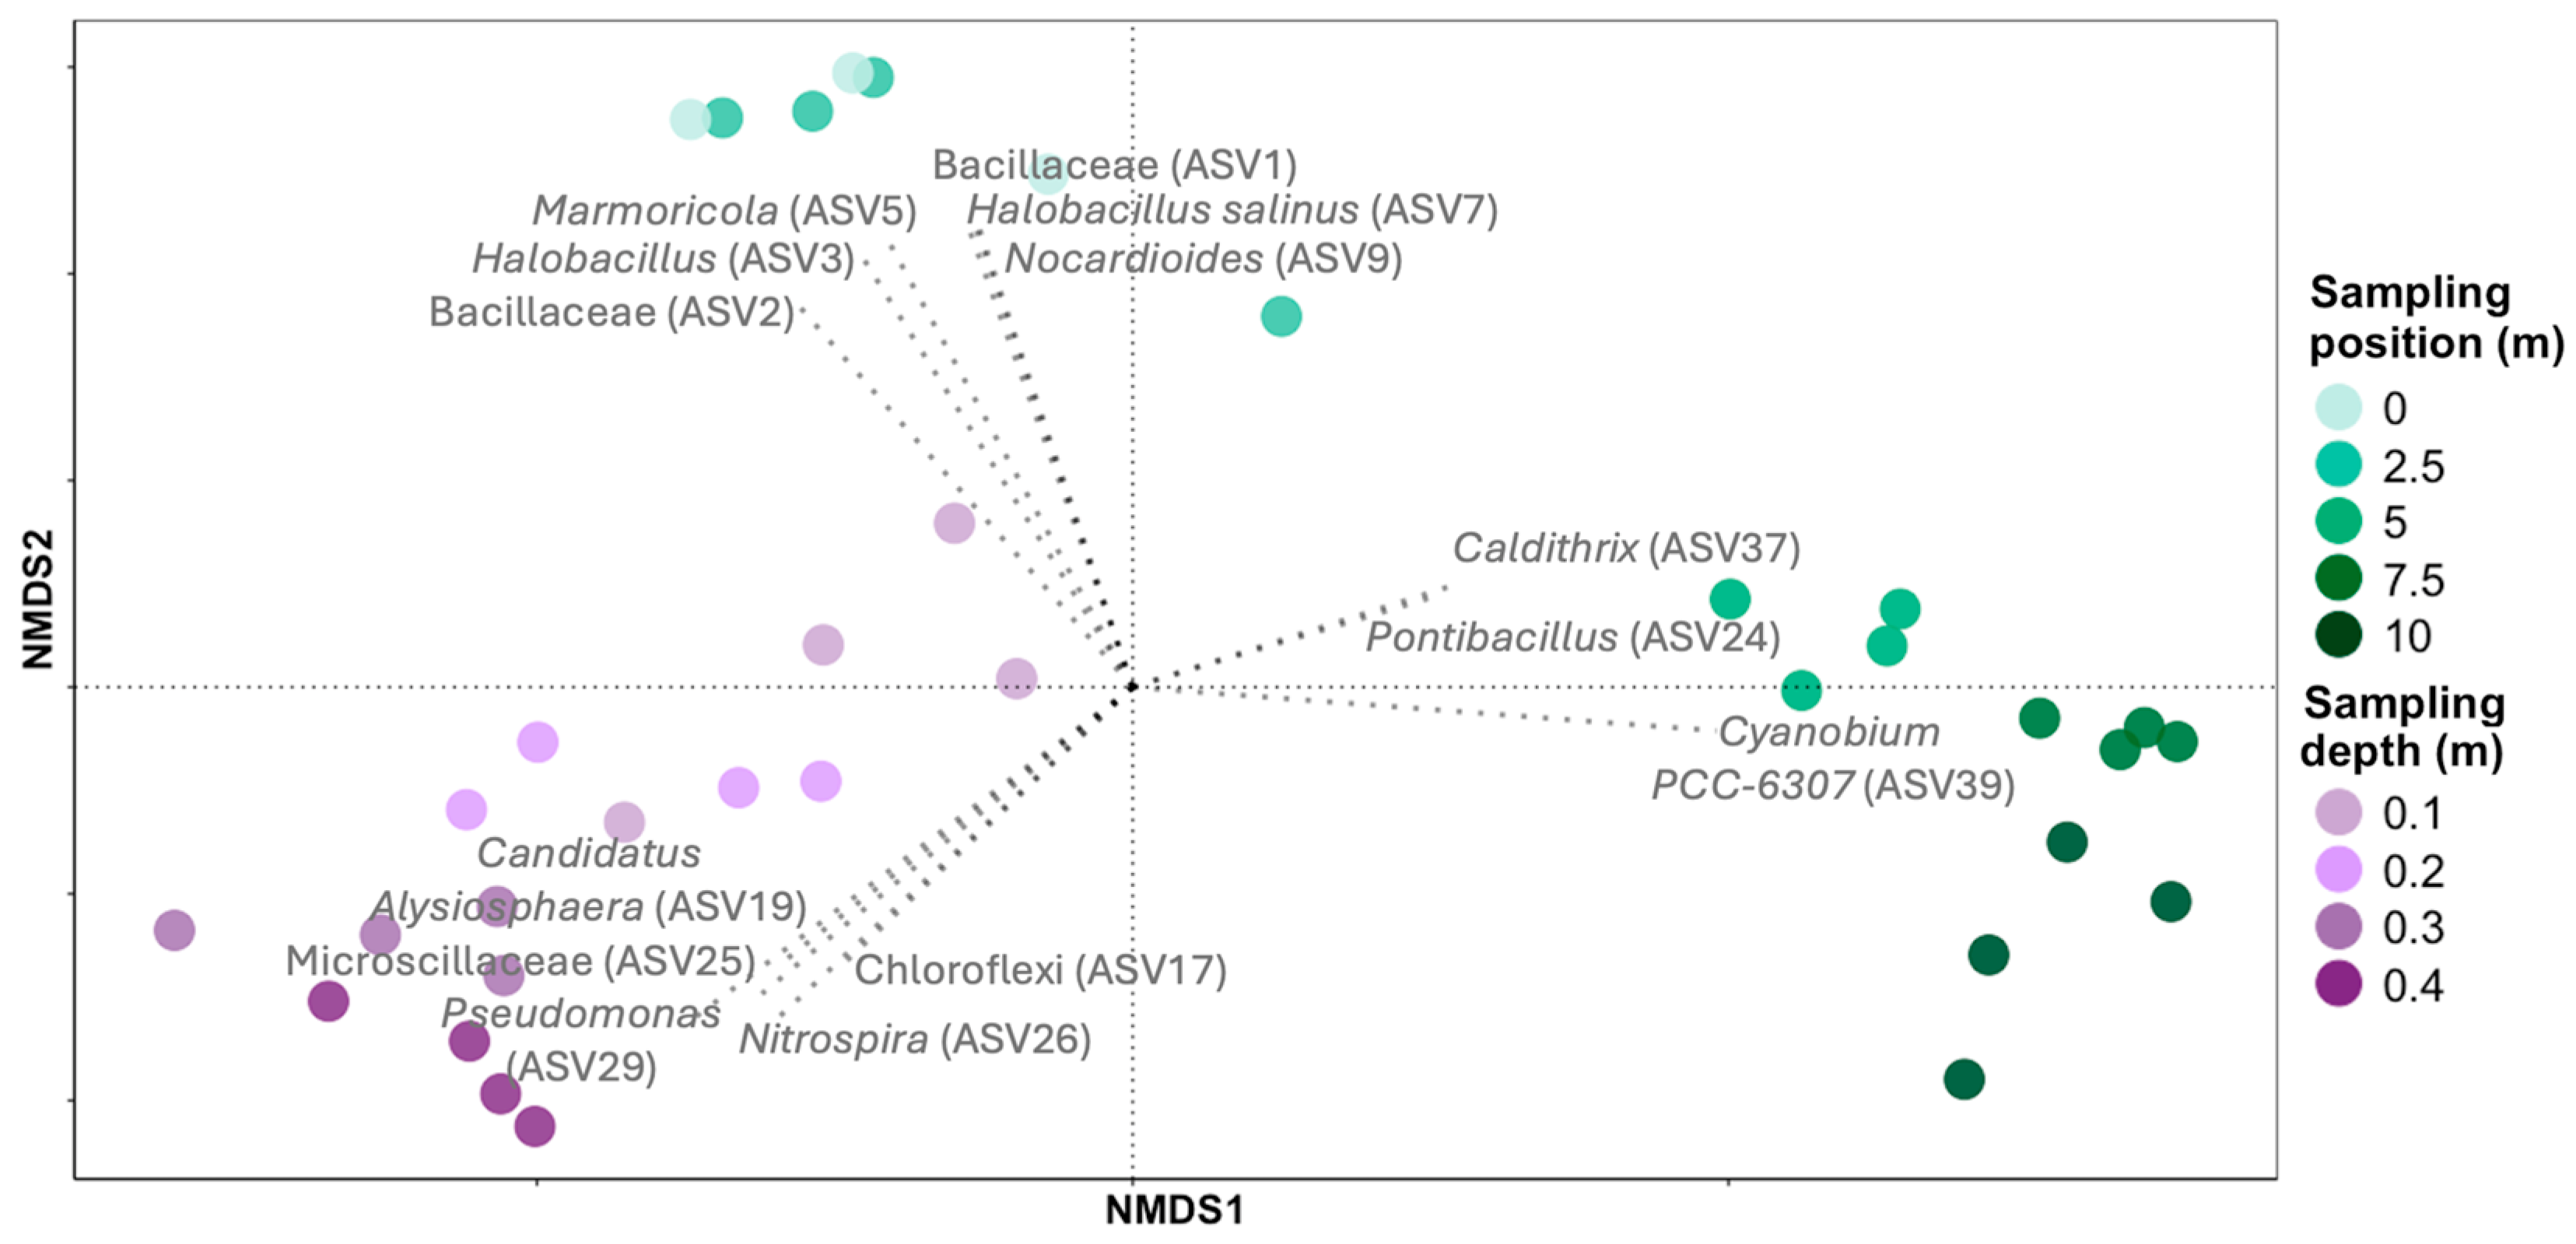
Of the 11,161 ASVs used in the final dataset, 15 each accounted for >0.3% of the 16S rRNA gene sequences analyzed. Of these, 14 were identified as significantly influencing the composition of the sand bacterial community and separating samples in NMDS ordinations (envfit; R2 = 0.19–0.89; p < 0.001–0.05; Figure 7). Three ASVs identified as Bacillaceae (Bacillota) were associated with surface samples at positions 0 and 2.5 m (Bacillaceae (ASV1, ASV2), Halobacillus (ASV3), Halobacillus salinus (ASV7)), as were two additional ASVs identified as Nocardioidaceae (Actinomycetota; Marmoricola (ASV5), Nocardioides (ASV9)). ASVs identified as Pontibacillus (Bacillota; ASV24), Caldithrix (Calditrichota; ASV 37), and Cyanobium PCC-6307 (Cyanobacteriota; ASV39) were more associated with saturated samples at positions 7.5 and 10 m. ASVs associated with samples collected from deeper depths in the sand were identified as Chloroflexota (ASV17), Candidatus Alysiosphaera (Alphaproteobacteria; ASV19), Microscillaceae (Bacteroidota; ASV25), Nitrospira (Nitrospirota; ASV26), and Pseudomonas (Gammaproteobacteria; ASV29; Figure 7).
Of the 14 most abundant ASVs identified in sand samples, seven exhibited significant differences in abundance based on transect position (MANOVA; F4,14 = 4.84–40.6, p < 0.001–0.05; Figure 8A). Similar to their influence on the overall bacterial community composition of surface sand, ASVs identified as Bacillaceae (ASV1, ASV2, Halobacillus (ASV3), Halobacillus salinus (ASV7)) or Nocardioidaceae (Marmoricola (ASV5), Norcardioides (ASV9)) were most abundant at positions 0 and 2.5 m of the transects and their abundance decreased down the beach towards the water, whereas the relative abundance of ASV39 (Cyanobium PCC-6307) increased. The abundances of most ASVs also varied significantly by collection depth (F4,14 = 3.17–48.3, p < 0.001–0.05), exceptions being ASV17, ASV19, ASV24, and ASV37 (p > 0.05 for all). ASV39 (Cyanobium PCC-6307) continued to decrease in abundance as sample depth increased (Figure 8B), whereas the other ASVs that showed significant differences in abundance based on depth tended to peak in abundance at 0.1 and 0.2 m (Figure 8B).
Of the five enzymes assayed, phosphatase showed the most correlations with the relative abundance of specific bacterial phyla, and its activity was positively correlated with the relative abundance of Bacteroidota (r = 0.64, p < 0.01), Gammaproteobacteria (r = 0.57, p < 0.05), Alphaproteobacteria (r = 0.63, p < 0.01), Planctomycetota (r = 0.76, p < 0.01), Verrucomicrobiota (r = 0.54, p < 0.01), Myxococcota (r = 0.82, p < 0.001), and Bdellovibrionota (r = 0.59, p < 0.01) along surface transects, and with Bacteroidota (r = 0.76, p < 0.001), Alphaproteobacteria (r = 0.60, p < 0.01), Cyanobacteriota (r = 0.57, p < 0.01), Thermodesulfobacteriota (r = 0.59, p < 0.01), Myxococcota (r = 0.63, p < 0.01), and Calditrichota (r = 0.70, p < 0.001) when depth profiles were considered. NAGase showed some of these same correlations, with its activity being positively correlated with the relative abundance of Bacteroidota (r = 0.63, p < 0.01), Gammaproteobacteria (r = 0.51, p < 0.05), Alphaproteobacteria (r = 0.68, p < 0.01), Planctomycetota (r = 0.72, p < 0.001), Cyanobacteriota (r = 0.61, p < 0.01), Myxococcota (r = 0.83, p < 0.001), and Bdellovibrionota (r = 0.64, p < 0.01) along surface transects, and with Bacteroidota (r = 0.67, p < 0.01) and Myxococcota (r = 0.59, p < 0.01) across depth gradients. The carbon-acquiring enzymes showed fewer positive correlations to specific phyla, although phenol oxidase activity was correlated with the relative abundance of Bacteroidota (r = 0.56, p < 0.01), Alphaproteobacteria (r = 0.54, p < 0.01), Planctomycetota (r = 0.84, p < 0.001), Myxococcota (r = 0.77, p < 0.001), and Bdellovibrionota (r = 0.61, p < 0.01) in surface sand, and with Bacteroidota (r = 0.82, p < 0.001), Alphaproteobacteria (r = 0.67, p < 0.01), Cyanobacteriota (r = 0.88, p < 0.001), Thermodesulfobacteriota (r = 0.91, p < 0.001), and Calditrichota (r = 0.75, p < 0.001) when considering depth. Activities of β-glucosidase and peroxidase exhibited much fewer associations with bacterial phyla, with β-glucosidase showing a positive correlation to the relative abundance of Bdellovibrionota (r = 0.59, p < 0.01) along transects, and peroxidase activity correlating with the relative abundance of Verrucomicrobiota (r = 0.66, p < 0.01). Neither enzyme showed any strong correlations to bacterial phyla when considering depth.
There were fewer substantive positive correlations between enzyme activity and the relative abundance of dominant ASVs. Phosphatase activity was positively correlated with the relative abundance of ASV39 (r = 0.50, p < 0.05) along transects and with ASV24 (r = 0.63, p < 0.01) and ASV39 (r = 0.53, p < 0.01) when examined with depth. NAGase activity did not correlate positively with the relative abundance of dominant ASVs along transects but correlated strongly with the relative abundance of ASV24 (r = 0.74, p < 0.001) with depth. β-glucosidase activity correlated with the relative abundance of ASV17 (r = 0.59, p < 0.01) when examined along surface transects, and strongly with ASV24 (r = 0.87, p < 0.001) across depth gradients. Phenol oxidase activity correlated with the relative abundance of ASV39 along transects (r = 0.59, p < 0.01) and depth gradients (r = 0.87, p < 0.001), where it also correlated with ASV37 (r = 0.57, p < 0.01). As with correlations to major phyla, peroxidase activity was only minimally correlated with the relative abundance of dominant ASVs, limited to a moderate correlation with ASV9 (r = 0.50, p < 0.05) when examined across sand depths.

4. Discussion

Our knowledge of natural bacterial communities (environmental microbiomes) has increased over the last few decades with advances in technology such as high-throughput next generation 16S rRNA gene sequencing. When analyzing environmental 16S rRNA genes, DNA is extracted directly from samples, and the 16S rRNA genes amplified and sequenced to determine the composition and diversity of bacteria that are present without the need for culturing, thus avoiding biases related to choice of culture media and conditions [26]. This approach is being increasingly used to study bacterial communities on sandy beaches [5,6,7], even though these coastal systems have historically been considered as resource- and microbe-poor environments. In this study we used high-throughput sequencing to characterize the bacterial communities along a 10 m gradient of a beach ecosystem, spanning dry to submerged sand, and examined how beach bacterial communities change over a shorter gradient of up to 0.4 m deep into damp sand.
The composition of bacterial communities is affected by environmental factors such as pH, salinity, and temperature, as well as the availability of resources [37,38,39,40]. Based on the prevailing environmental conditions, different groups of bacteria can dominate the microbiome, usually by being metabolically more active than other taxa [41]. This can lead to variation in bacterial abundance, activity, and community composition even over small scales [7,11,42]. With beach systems being defined by obvious transitions from drier areas at the top of the beach to moister areas subject to tidal influence on the lower beach, we expected that a gradient in sand moisture content would be an important factor influencing microbial metabolism along our sampling transects, with potential differences in microbial community composition both along transects and deeper into the sand. We found that beach bacterial communities showed substantial changes in their structure and diversity over spatial and depth gradients, and that there were also changes in the functional potential of these communities in terms of carbon, nitrogen, and phosphorus cycling.
One indicator of microbial metabolism is extracellular enzyme activity, and the activities of extracellular enzymes reflect microbial nutrient demand, substrate availability, and biogeochemical processes [43]. The activity of N-acetylglucosaminidase (NAGase), phosphatase, and phenol oxidase all varied along the beach transects, peaking at the intermediate position where sand was exposed but was being wetted by the tide. Phosphatase helps release soluble inorganic phosphate from a variety of organophosphates [44], while NAGase plays a key role in breaking down chitin, making both carbon and nitrogen available for microorganisms to utilize [45], such that greater activity of these enzymes implies higher rates of organic phosphorus and nitrogen mineralization. Phenol oxidase is important in lignin and polyphenolic compound degradation [46], and while higher activity of this enzyme in the intermediate section of beach transects could suggest higher rates of organic matter degradation in that part of the beach, we did not see that spatial pattern for β-glucosidase, an important enzyme in cellulose degradation [47,48]. Enzyme activity did not correlate linearly with sand moisture content which, as expected, increased as samples were taken down the transect towards and into the water. Rather, for enzymes that showed spatial patterns, activity was greatest at the intermediate moisture levels seen at the central point of our beach transects. Microbial activity in soils follows a similar non-linear relationship, and, while soil enzyme activity is lower in drier soils [49,50], it is typically the greatest under wet (i.e., approaching field capacity) but not saturated conditions [51]. The same is likely true of beach sands where exposure to moisture, but not continuous inundation, may present a balance of moisture availability and accessibility to oxygen and other resources, such that there is something of a hump-backed relationship between enzyme activity and sand moisture content. To some extent, this interplay between moisture, potential oxygen availability, and microbial activity is supported by the patterns in enzyme activity with depth, with activities of phosphatase and phenol oxidase (which relies on the availability of oxygen for its activity) decreasing significantly with depth, likely reflecting reduced oxygen availability and redox potential, and all enzymes showed greatest activity at the sand surface.
As with microbial enzyme activity, bacterial community diversity showed spatial patterns related to position on the beach and depth in sand. Bacterial species richness and overall diversity were greater at sample points lower on the beach, and diversity (but not richness) also declined with depth into the sand. Depth-related declines in bacterial diversity likely represent reduced oxygen, redox potential, and substrate availability with depth and have been reported for other soils [11,52,53], and depth may be more important than spatial distance between samples in its effects on bacterial community structure [53]. The latter is supported by our findings where just 0.1 m differences in depth exerted influences on community diversity that were comparable to distances of 2.5–5 m along the beach. Greater bacterial community diversity in surface sands further down the beach likely reflect enhanced organismal diversity in dynamic zones that are experiencing tidal influences and have more variable and more favorable environmental conditions [54].
While differences in bacterial diversity along our beach transects showed discrete differences between the 0 and 2.5 m positions and those further down the beach (positions 5, 7.5, and 10 m), differences in bacterial community structure and community composition were more continuous. Representation of the bacterial community in each sand sample in NMDS ordination showed clear spatial transitions in community structure down the 10 m section of beach and a similar gradient of shifts in bacterial community structure were apparent over the 0.4 m of depth into sand. This reinforces the idea that beaches harbor transitional bacterial communities across intertidal zones, despite tidal flow that presumably disrupts and redistributes sand each day [7]. This gradient in community structure was at least partially driven by changes in the relative abundance of dominant bacterial species, as inferred from ASVs. Along the beach transects, ASVs identified as members of the Gram-positive bacterial families Bacillaceae (including multiple types of Halobacillus) and Nocardioidaceae (including the genera Marmoricola and Norcardioides) were associated with drier positions further up the beach and showed clear declines in their relative abundances in the surface sand community towards the shoreline. This was also reflected in much higher proportions of Bacillota (the bacterial phylum containing the Bacillaceae) and Actinomycetota (which contains the Nocardioidaceae) in the bacterial community at positions 0 and 2.5 m compared to the wetter 5, 7.5 and 10 m sampling points. These taxa are typically associated with dry environments and are often either halophilic or require salt for their growth [55,56,57,58], both properties likely explaining their greater presence in the bacterial community in more exposed, drier sand further up the beach.
Fewer ASVs showed increases in their representation in the community in moister surface sand closer to the water, where the overall bacterial community was richer and more diverse. An ASV identified as the picocyanobacterium Cyanobium PCC-6307 (Cyanobium gracile) showed the most dramatic increase in its abundance at the 5, 7.5, and 10 m positions along our transects and was one of the main drivers distinguishing bacterial communities in those samples from those at positions 0 and 2.5 m. Picocyanobacteria (predominantly Synechococcus, Prochlorococcus, and Cyanobium) are common and ubiquitous in marine and freshwater environments and account for a large proportion of marine primary production [59,60,61]. Thus, their increased abundance in moist or submerged surfaces likely reflects inputs from seawater and a preference for aquatic habitats. These taxa also showed dramatic declines in their abundance in the bacterial community with depth into the sand as would be expected for photosynthetic organisms or those arriving in the sand community from tidal inputs. Phylum Cyanobacteriota as a whole showed one of the most dramatic declines in abundance with depth, accounting for only a minor portion of the sand bacterial community at 0.1 m and deeper despite being almost 10% of the community in moist surface sand. In contrast, deeper sand might be expected to show a greater prevalence of potentially anaerobic taxa, and although none of the dominant ASVs that were associated with deeper depths are recognized as strict anaerobes, phylum Bacillota (which includes a variety of facultative and obligate anaerobic taxa) did account for a greater proportion of the bacterial community at the 0.3 and 0.4 m depths than closer to the sand surface.
While inference of function from taxonomy may be possible for some microbial taxa (e.g., photosynthesis for Cyanobacteriota), 16S rRNA gene data alone cannot confirm metabolic activity. However, relating taxonomic patterns to realized enzyme activity may allow some relationships between community composition and biogeochemical activity to be explored. Phosphatase activity correlated with the proportions of various phyla in the sand bacterial community, potentially reflecting the broad nature of this enzyme [44]. NAGase activity was also correlated with various groups, but activities of both of these nutrient-acquiring enzymes most strongly correlated (r values > 0.7) with the abundance of Myxococcota and Planctomycetota in the community, phyla that also showed correlations to phenol oxidase activity. Myxococcota typically average roughly 1.5–2.5% of the sediment bacterial community [62,63], about the same percentage found in this study. Members of this phylum produce a variety of secondary metabolites and play important roles in microbial ecosystems, including the production of various enzymes that they use cooperatively for predation and degradation or organic material [64]. Planctomycetota are also important in carbon and nitrogen cycling [65,66], especially in marine environments. Thus, correlations between the presence of these two phyla and enzyme activity in beach sediments are not surprising. Potential relationships between the abundance of more specific bacterial taxa (ASVs) and enzyme activity were less clear, although the correlation between phosphatase activity and the abundance of an ASV identified as Cyanobium PCC-6307 is interesting given that picocyanobacteria have been found to produce specific phosphatases that allow them to occupy low-nutrient environments [67]. Similarly, marine Cyanobacteriota can also produce phenol oxidases/laccases [68,69], and this ASV was also correlated to phenol oxidase activity, especially with depth. The relationships seen between taxa and enzyme activity in this study are, however, just correlative, and, while they suggest potential relationships between community composition and biogeochemistry, they should not definitively be assumed to be causal.
Overall, we found clear shifts in bacterial community structure in sand along small (10 m) sections of beach and even smaller (<0.5 m) depths into the sand. Bacterial community diversity was greatest in surface sand under moist conditions, with bacterial communities in drier sand further up the beach typically being dominated by more desiccation-resistant taxa and those further down the beach showing increased representation of photosynthetic taxa such as picocyanobacteria. Interestingly, microbial enzymatic activity was greatest in sand at intermediate sections of the beach between these extremes, suggesting that parts of the beach subject to tidal influence but not fully submerged are the areas with the greatest functional potential in terms of biogeochemical cycling. This study was, however, limited to a single section of beach on one day, and, while we determined fine-scale spatial patterns in enzyme activity and bacterial community composition, additional measurements such as variations in nutrient availability and actual microbial gene expression (i.e., transcriptomics) could more fully explore biogeochemical and community relationships. That said, this research supports ongoing research that shows that, while sandy beaches have sometimes been considered as ecological deserts, they actually contain diverse bacterial communities that show a high degree of heterogeneity along spatial gradients. Such heterogeneity is potentially important when considering nutrient cycling in coastal environments and the resilience of these ecosystems to environmental perturbations.

Author Contributions

Conceptualization, E.B., S.N.V. and C.R.J.; methodology, E.B., S.N.V., J.C.P., H.R. and C.R.J.; formal analysis, E.B., S.N.V., J.C.P. and C.R.J.; investigation, E.B., S.N.V., J.C.P., H.R. and C.R.J.; resources, C.R.J.; data curation, S.N.V. and C.R.J.; writing—original draft preparation, E.B., H.R. and C.R.J. writing—review and editing, E.B., S.N.V., J.C.P., H.R. and C.R.J.; visualization, S.N.V.; supervision, S.N.V. and C.R.J.; project administration, C.R.J.; funding acquisition, C.R.J. All authors have read and agreed to the published version of the manuscript.

Funding

This project was paid for with federal funding from the U.S. Department of the Treasury, the Mississippi Department of Environmental Quality, and the Mississippi Based RESTORE Act Center of Excellence under the Resources and Ecosystems Sustainability, Tourist Opportunities, and Revived Economies of the Gulf Coast States Act of 2012 (RESTORE Act). The statements, findings, conclusions, and recommendations are those of the author(s) and do not necessarily reflect the views of the Department of the Treasury, the Mississippi Department of Environmental Quality, or the Mississippi Based RESTORE Act Center of Excellence. The work performed through the UMMC Molecular and Genomics Facility is supported, in part, by funds from the NIGMS, including the Molecular Center of Health and Disease-COBRE (P20GM144041), Mississippi INBRE (P20GM103476) and Obesity, Cardiorenal and Metabolic Diseases-COBRE (P30GM149404) and Mississippi Center of Perinatal Research (1P20GM121334).

Data Availability Statement

The original data presented in the study are openly available in NCBI Sequence Reads Archive under BioProject ID PRJNA1294970 at https://www.ncbi.nlm.nih.gov/bioproject/?term=PRJNA1294970 (accessed on 28 July 2025).

Conflicts of Interest

The authors declare no conflicts of interest. The funders had no role in the design of the study; in the collection, analyses, or interpretation of data; in the writing of the manuscript; or in the decision to publish the results.

References

  1. Brick, S.; Niggemann, J.; Reckhardt, A.; Könneke, M.; Engelen, B. Interstitial microbial communities of coastal sediments are dominated by Nanoarchaeota. Front. Microbiol. 2025, 16, 1532193. [Google Scholar] [CrossRef]
  2. Luijendijk, A.; Hagenaars, G.; Ranasinghe, R.; Baart, F.; Donchyts, G.; Aarninkhof, S. The state of the World’s beaches. Sci. Rep. 2018, 8, 6641. [Google Scholar] [CrossRef]
  3. McLachlan, A.; Defeo, O. The Ecology of Sandy Shores, 3rd ed.; Academic Press: London, UK, 2017; pp. 1–4. [Google Scholar]
  4. Whitman, R.L.; Harwood, V.J.; Edge, T.A.; Nevers, M.B.; Byappanahalli, M.; Vijayavel, K.; Brandão, J.; Sadowsky, M.J.; Alm, E.W.; Crowe, A.; et al. Microbes in beach sands: Integrating environment, ecology and public health. Rev. Environ. Sci. Biotechnol. 2014, 13, 329–368. [Google Scholar] [CrossRef]
  5. Staley, C.; Sadowsky, M.J. Regional similarities and consistent patterns of local variation in beach sand bacterial communities throughout the Northern Hemisphere. Appl. Environ. Microbiol. 2016, 82, 2751–2762. [Google Scholar] [CrossRef] [PubMed]
  6. Taylor, H.B.; Kurtz, H.D. Microbial community structure shows differing levels of temporal stability in intertidal beach sands of the grand strand region of South Carolina. PLoS ONE 2020, 15, e0229387. [Google Scholar] [CrossRef] [PubMed]
  7. Okamoto, N.; Keeling, P.J.; Leander, B.S.; Tai, V. Microbial communities in sandy beaches from the three domains of life differ by microhabitat and intertidal location. Mol. Ecol. 2022, 31, 3210–3227. [Google Scholar] [CrossRef]
  8. Cui, H.; Yang, K.; Pagaling, E.; Yan, T. Spatial and temporal variation in enterococcal abundance and its relationship to the microbial community in Hawaii beach sand and water. Appl. Environ. Microbiol. 2013, 79, 3601–3609. [Google Scholar] [CrossRef]
  9. Fierer, N.; Schimel, J.P.; Holden, P.A. Variations in microbial community composition through two soil depth profiles. Soil Biol. Biochem. 2003, 35, 167–176. [Google Scholar] [CrossRef]
  10. Halliday, E.; McLellan, S.L.; Amaral-Zettler, L.A.; Sogin, M.L.; Gast, R.J. Comparison of bacterial communities in sands and water at beaches with bacterial water quality violations. PLoS ONE 2014, 9, e90815. [Google Scholar] [CrossRef] [PubMed]
  11. Jackson, C.R.; Liew, K.C.; Yule, C.M. Structural and functional changes with depth in microbial communities in a tropical Malaysian peat swamp forest. Microb. Ecol. 2019, 57, 402–412. [Google Scholar] [CrossRef]
  12. Stone, M.M.; DeForest, J.L.; Plante, A.F. Changes in extracellular enzyme activity and microbial community structure with soil depth at the Luquillo Critical Zone Observatory. Soil Biol. Biochem. 2014, 75, 237–247. [Google Scholar] [CrossRef]
  13. Strom, S.L. Microbial ecology of ocean biogeochemistry: A community perspective. Science 2008, 320, 1043–1045. [Google Scholar] [CrossRef] [PubMed]
  14. Zhang, Z.; Zhang, Q.; Chen, B.; Yu, Y.; Wang, T.; Xu, N.; Fan, X.; Penuelas, J.; Fu, Z.; Deng, Y.; et al. Global biogeography of microbes driving ocean ecological status under climate change. Nat. Commun. 2024, 15, 4657. [Google Scholar] [CrossRef]
  15. Turner, R.E.; Rabalais, N.N. The Gulf of Mexico. In World Seas: An Environmental Evaluation, 2nd ed.; Sheppard, C., Ed.; Academic Press: London, UK, 2019; Volume 1, pp. 445–464. [Google Scholar]
  16. McKinney, L.D.; Shepherd, J.G.; Wilson, C.A.; Hogarth, W.T.; Chanton, J.; Murawski, S.A.; Sandifer, P.A.; Sutton, T.; Yoskowitz, D.; Wowk, K.; et al. The Gulf of Mexico: An overview. Oceanography 2021, 34, 30–43. [Google Scholar] [CrossRef]
  17. Michel, J.; Owens, E.H.; Zengel, S.; Graham, A.; Nixon, Z.; Allard, T.; Holton, W.; Reimer, P.D.; Lamarche, A.; White, M.; et al. Extent and degree of shoreline oiling: Deepwater Horizon Oil Spill, Gulf of Mexico, USA. PLoS ONE 2013, 8, e65087. [Google Scholar] [CrossRef] [PubMed]
  18. Kostka, J.E.; Prakash, O.; Overholt, W.A.; Green, S.J.; Freyer, G.; Canion, A.; Delgardio, J.; Norton, N.; Hazen, T.C.; Huettel, M. Hydrocarbon-degrading bacteria and the bacterial community response in Gulf of Mexico beach sands impacted by the deepwater horizon oil spill. Appl. Environ. Microbiol. 2011, 77, 7962–7974. [Google Scholar] [CrossRef]
  19. Joye, S.B.; Teske, A.P.; Kostka, J.E. Microbial dynamics following the Macondo oil well blowout across Gulf of Mexico environments. BioScience 2014, 64, 766–777. [Google Scholar] [CrossRef]
  20. Rodriguez-R, L.M.; Overholt, W.A.; Hagan, C.; Huettel, M.; Kostka, J.E.; Konstantinidis, K.T. Microbial community successional patterns in beach sands impacted by the Deepwater Horizon oil spill. ISME J. 2015, 9, 1928–1940. [Google Scholar] [CrossRef]
  21. Huettel, M.; Overholt, W.A.; Kostka, J.E.; Hagan, C.; Kaba, J.; Wells, W.B.; Dudley, S. Degradation of Deepwater Horizon oil buried in a Florida beach influenced by tidal pumping. Mar. Pollut. Bull. 2018, 126, 488–500. [Google Scholar] [CrossRef]
  22. Rietl, A.J.; Jackson, C.R. Effects of the ecological restoration practices of prescribed burning and mechanical thinning on soil microbial enzyme activities and leaf litter decomposition. Soil Biol. Biochem. 2012, 50, 47–57. [Google Scholar] [CrossRef]
  23. Rietl, A.J.; Overlander, M.E.; Nyman, A.J.; Jackson, C.R. Microbial community composition and extracellular enzyme activities associated with Juncus roemerianus and Spartina alterniflora vegetated sediments in Louisiana saltmarshes. Microb. Ecol. 2016, 71, 290–303. [Google Scholar] [CrossRef]
  24. Jackson, C.R.; Tyler, H.L.; Millar, J.J. Determination of microbial extracellular enzyme activity in waters, soils, and sediments using high throughput microplate assays. J. Vis. Exp. 2013, 80, 50399. [Google Scholar] [CrossRef]
  25. Jackson, E.F.; Echlin, H.L.; Jackson, C.R. Changes in the phyllosphere community of the resurrection fern, Polypodium polypodioides, associated with rainfall and wetting. FEMS Microbiol. Ecol. 2006, 58, 236–246. [Google Scholar] [CrossRef]
  26. Jackson, C.R.; Stone, B.W.; Tyler, H.L. Emerging perspectives on the natural microbiome of fresh produce vegetables. Agriculture 2015, 5, 170–187. [Google Scholar] [CrossRef]
  27. Kozich, J.J.; Westcott, S.L.; Baxter, N.T.; Highlander, S.K.; Schloss, P.D. Development of a dual-index sequencing strategy and curation pipeline for analyzing amplicon sequence data on the MiSeq Illumina sequencing platform. Appl. Environ. Microbiol. 2013, 79, 5112–5120. [Google Scholar] [CrossRef]
  28. Callahan, B.J.; McMurdie, P.J.; Rosen, M.J.; Han, A.W.; Johnson, A.J.A.; Holmes, S.P. DADA2: High-resolution sample inference from Illumina amplicon data. Nat. Methods 2016, 13, 581–583. [Google Scholar] [CrossRef]
  29. Quast, C.; Pruesse, E.; Yilmaz, P.; Gerken, J.; Schweer, T.; Yarza, P.; Peplies, J.; Glöckner, F.O. The SILVA ribosomal RNA gene database project: Improved data processing and web-based tools. Nucleic Acids Res. 2013, 41, D590–D596. [Google Scholar] [CrossRef] [PubMed]
  30. Oren, A.; Garrity, G.M. Valid publication of the names of forty-two phyla of prokaryotes. Int. J. Syst. Evol. Microbiol. 2021, 71, 005056. [Google Scholar] [CrossRef] [PubMed]
  31. Oren, A.; Mareš, J.; Rippka, R. Validation of the names Cyanobacterium and Cyanobacterium stanieri, and proposal of Cyanobacteriota phyl. nov. Int. J. Syst. Evol. Microbiol. 2022, 72, 005528. [Google Scholar] [CrossRef]
  32. Oren, A.; Göker, M. Candidatus List. Lists of names of prokaryotic Candidatus phyla. Int. J. Syst. Evol. Microbiol. 2023, 73, 005821. [Google Scholar] [CrossRef] [PubMed]
  33. Mikryukov, V. metagMisc: Miscellaneous Functions for Metagenomic Analysis. Zenodo. 2017. Available online: https://zenodo.org/ (accessed on 1 May 2025).
  34. McMurdie, P.J.; Holmes, S. phyloseq: An R package for reproducible interactive analysis and graphics of microbiome census data. PLoS ONE 2013, 8, e61217. [Google Scholar] [CrossRef] [PubMed]
  35. Martinez Arbizu, P. Pairwiseadonis: Pairwise Multilevel Comparison Using Adonis. R Package Version 0.4. 2020. Available online: https://github.com/pmartinezarbizu/pairwiseAdonis (accessed on 1 May 2025).
  36. Oksanen, J. Vegan: Community Ecology Package; R Package Version 2.6-2. 2022. Available online: https://cran.r-project.org/web/packages/vegan/vegan.pdf (accessed on 1 May 2025).
  37. Mougi, A. pH adaptation stabilizes bacterial communities. NPJ Biodivers. 2024, 3, 32. [Google Scholar] [CrossRef]
  38. Dong, Y.; Zhang, J.; Chen, R.; Zhong, L.; Lin, X.; Feng, Y. Microbial community composition and activity in saline soils of coastal agroecosystems. Microorganisms 2022, 10, 835. [Google Scholar] [CrossRef]
  39. Weedon, J.T.; Bååth, E.; Rijkers, R.; Reischke, S.; Sigurdsson, B.D.; Oddsdottir, E.; van Hal, J.; Aerts, R.; Janssens, I.A.; van Bodegom, P.M. Community adaptation to temperature explains abrupt soil bacterial community shift along a geothermal gradient on Iceland. Soil Biol. Biochem. 2023, 177, 108914. [Google Scholar] [CrossRef]
  40. Craig, H.; Antwis, R.E.; Cordero, I.; Ashworth, D.; Robinson, C.H.; Osborne, T.Z.; Bardgett, R.D.; Rowntree, J.K.; Simpson, L.T. Nitrogen addition alters composition, diversity, and functioning of microbial communities in mangrove soils: An incubation experiment. Soil Biol. Biochem. 2021, 153, 108076. [Google Scholar] [CrossRef]
  41. Langenheder, S.; Prosser, J.I. Resource availability influences the diversity of a functional group of heterotrophic soil bacteria. Environ. Microbiol. 2008, 10, 2245–2256. [Google Scholar] [CrossRef] [PubMed]
  42. Franklin, R.B.; Blum, L.K.; McComb, A.C.; Mills, A.L. A geostatistical analysis of small-scale spatial variability in bacterial abundance and community structure in salt marsh creek bank sediments. FEMS Microbiol. Ecol. 2002, 42, 71–80. [Google Scholar] [CrossRef]
  43. Sinsabaugh, R.L.; Belnap, J.; Findlay, S.G.; Shah, J.J.F.; Hill, B.H.; Kuehn, K.A.; Kuske, C.R.; Litvak, M.E.; Martinez, N.G.; Moorhead, D.L.; et al. Extracellular enzyme kinetics scale with resource availability. Biogeochemistry 2014, 121, 287–304. [Google Scholar] [CrossRef]
  44. Dalai, R.C. Soil organic phosphorus. Adv. Agron. 1977, 29, 83–117. [Google Scholar] [CrossRef]
  45. Sinsabaugh, R.L.; Moorhead, D.L. Resource allocation to extracellular enzyme production: A model for nitrogen and phosphorus control of litter decomposition. Soil Biol. Biochem. 1994, 26, 1305–1311. [Google Scholar] [CrossRef]
  46. Sinsabaugh, R.L. Phenol oxidase, peroxidase and organic matter dynamics of soil. Soil Biol. Biochem. 2010, 42, 391–404. [Google Scholar] [CrossRef]
  47. Sinsabaugh, R.L.; Antibus, R.K.; Linkins, A.E.; McClaugherty, C.A.; Rayburn, L.; Repert, D.; Weiland, T. Wood decomposition over a first-order watershed: Mass loss as a function of lignocellulase activity. Soil Biol. Biochem. 1992, 24, 743–749. [Google Scholar] [CrossRef]
  48. Ljungdahl, L.G.; Eriksson, K.E. Ecology of microbial cellulose degradation. In Advances in Microbial Ecology; Marshall, K.C., Ed.; Springer: Boston, MA, USA, 1985; Volume 8, pp. 237–299. [Google Scholar] [CrossRef]
  49. Qu, Q.; Wang, Z.; Gan, Q.; Liu, R.; Xu, H. Impact of drought on soil microbial biomass and extracellular enzyme activity. Front. Plant Sci. 2023, 14, 1221288. [Google Scholar] [CrossRef]
  50. Bogati, K.; Walczak, M. The impact of drought stress on soil microbial community, enzyme activities, and plants. Agronomy 2022, 12, 189. [Google Scholar] [CrossRef]
  51. Gomez, E.J.; Delgado, J.A.; Gonzalez, J.M. Environmental factors affect the response of microbial extracellular enzyme activity in soils when determined as a function of water availability and temperature. Ecol. Evol. 2020, 10, 10105–10115. [Google Scholar] [CrossRef]
  52. Hao, J.; Chai, Y.N.; Lopes, L.D.; Ordóñez, R.A.; Wright, E.E.; Archontoulis, S.; Schachtman, D.P. The effects of soil depth on the structure of microbial communities in agricultural soils in Iowa, USA. Appl. Environ. Microbiol. 2021, 87, e02673-20. [Google Scholar] [CrossRef] [PubMed]
  53. Jiang, P.; Wan, X.; Che, M.; Li, L.; Liu, M. Soil depth exerts greater effect on bacterial community than spatial structure in Longmenshan fault zone. Appl. Environ. Microbiol. 2025, 91, e01161-24. [Google Scholar] [CrossRef] [PubMed]
  54. Arboleda-Baena, C.; Freilich, M.; Pareja, C.B.; Logares, R.; De la Iglesia, R.; Navarrete, S.A. Microbial community and network responses across strong environmental gradients: How do they compare with macroorganisms? FEMS Microbiol. Ecol. 2024, 100, fiae017. [Google Scholar] [CrossRef]
  55. Urzì, C.; Salamone, P.; Schumann, P.; Stackebrandt, E. Marmoricola aurantiacus gen. nov., sp. nov., a coccoid member of the family Nocardioidaceae isolated from a marble statue. Int. J. Syst. Evol. Microbiol. 2000, 2, 529–536. [Google Scholar] [CrossRef]
  56. Ma, Y.; Wang, J.; Liu, Y.; Wang, X.; Zhang, B.; Zhang, W.; Chen, T.; Liu, G.; Xue, L.; Cui, X. Nocardioides: “Specialists” for hard-to-degrade pollutants in the environment. Molecules 2023, 28, 7433. [Google Scholar] [CrossRef]
  57. Saadouli, I.; Marasco, R.; Mejri, L.; Hamden, H.; Guerfali, M.M.S.; Stathopoulou, P.; Daffonchio, D.; Cherif, A.; Ouzari, H.I.; Tsiamis, G.; et al. Diversity and adaptation properties of actinobacteria associated with Tunisian stone ruins. Front. Microbiol. 2022, 13, 997832. [Google Scholar] [CrossRef]
  58. Gurung, S.; Lee, C.M.; Weon, H.Y.; Han, S.R.; Oh, T.J. Comparative genome analysis of three Halobacillus strains isolated from saline environments reveal potential salt tolerance and algicidal mechanisms. Environ. Microbiol. Rep. 2025, 17, e70121. [Google Scholar] [CrossRef]
  59. Felföldi, T.; Somogyi, B.; Márialigeti, K.; Vörös, L. Notes on the biogeography of non-marine planktonic picocyanobacteria: Re-evaluating novelty. J. Plankton Res. 2011, 33, 1622–1626. [Google Scholar] [CrossRef]
  60. Flombaum, P.; Gallegos, J.L.; Gordillo, R.A.; Rincón, J.; Zabala, L.L.; Jiao, N.; Karl, D.M.; Li, W.K.; Lomas, M.W.; Veneziano, D.; et al. Present and future global distributions of the marine Cyanobacteria Prochlorococcus and Synechococcus. Proc. Natl. Acad. Sci. USA 2013, 110, 9824–9829. [Google Scholar] [CrossRef] [PubMed]
  61. Callieri, C.; Cabello-Yeves, P.J.; Bertoni, F. The “Dark Side” of Picocyanobacteria: Life as we do not know it (yet). Microorganisms 2022, 10, 546. [Google Scholar] [CrossRef]
  62. Wang, J.; Wang, J.; Wu, S.; Zhang, Z.; Li, Y. Global geographic diversity and distribution of the myxobacteria. Microbiol. Spectr. 2021, 9, e00012-21. [Google Scholar] [CrossRef] [PubMed]
  63. Zou, D.; Zhang, C.; Liu, Y.; Li, M. Biogeographical distribution and community assembly of Myxococcota in mangrove sediments. Environ. Microbiome 2024, 19, 47. [Google Scholar] [CrossRef]
  64. Muñoz-Dorado, J.; Marcos-Torres, F.J.; García-Bravo, E.; Moraleda-Muñoz, A.; Pérez, J. Myxobacteria: Moving, killing, feeding, and surviving together. Front. Microbiol. 2016, 7, 781. [Google Scholar] [CrossRef] [PubMed]
  65. Fuerst, J.; Sagulenko, E. Beyond the bacterium: Planctomycetes challenge our concepts of microbial structure and function. Nat. Rev. Microbiol. 2011, 9, 403–413. [Google Scholar] [CrossRef]
  66. Wiegland, S.; Jogler, M.; Jogler, C. On the maverick Planctomycetes. FEMS Microbiol. Rev. 2018, 42, 739–760. [Google Scholar] [CrossRef]
  67. Torcello-Requena, A.; Murphy, A.R.J.; Lidbury, I.D.E.A.; Pitt, F.D.; Stark, R.; Millard, A.D.; Puxty, R.J.; Chen, Y.; Scanlan, D.J. A distinct, high-affinity, alkaline phosphatase facilitates occupation of P-depleted environments by marine picocyanobacteria. Proc. Natl. Acad. Sci. USA 2024, 121, e2312892121. [Google Scholar] [CrossRef] [PubMed]
  68. Palanisami, S.; Saha, S.K.; Lakshmanan, U. Laccase and polyphenol oxidase activities of marine cyanobacteria: A study with Poly R-478 decolorization. World J. Microbiol. Biotechnol. 2010, 26, 63–69. [Google Scholar] [CrossRef]
  69. Behl, K.; Devi, A.; Yadav, Y.; Jaiswal, P. Chapter 14-Cyanobacteria: A precious resource for bioremediation. In Cyanobacteria: Metabolisms to Molecules; Mishra, A.K., Singh, S.S., Eds.; Academic Press: Boston, MA, USA, 2023; pp. 341–382. [Google Scholar] [CrossRef]
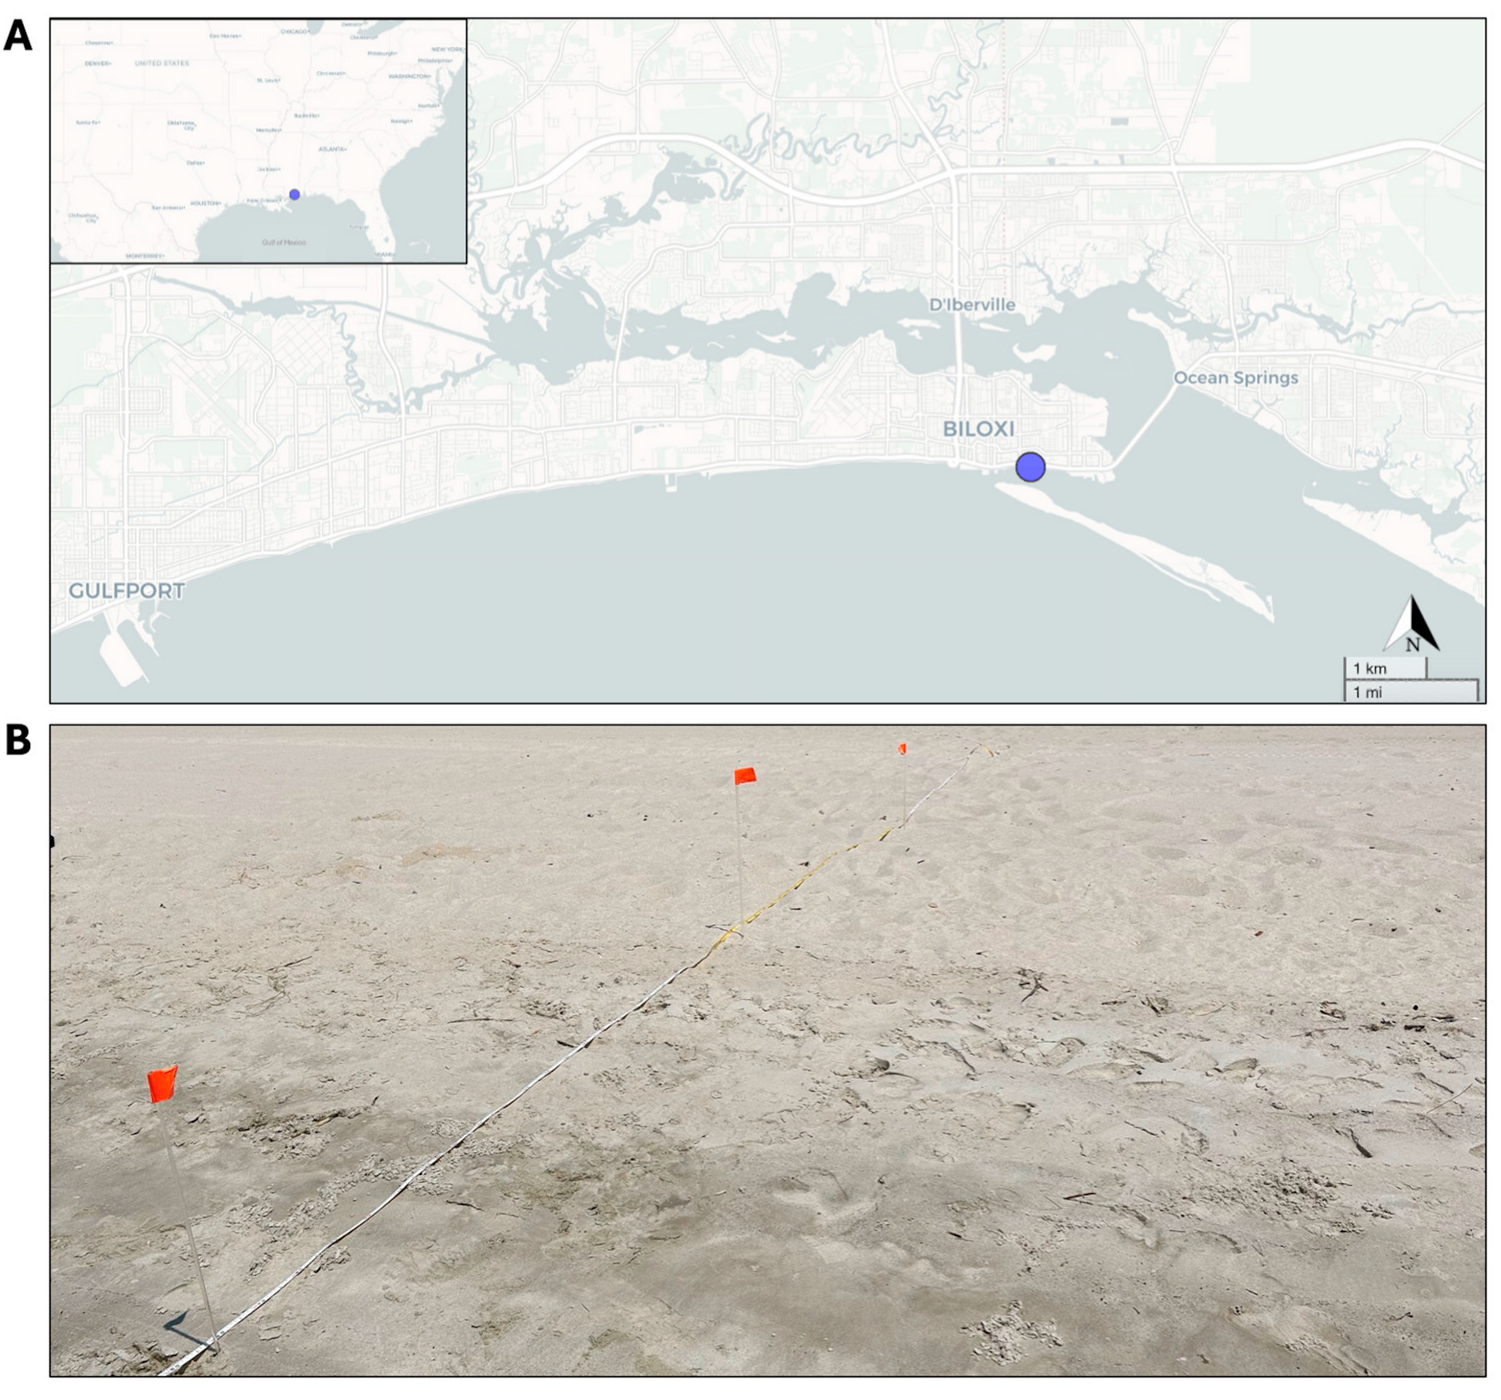
Figure 1. Location of Biloxi East Beach, Biloxi, MS, USA (A) along with photograph (B) of a section of a representative sampling transect (of four) from which sand was collected for determination of microbial activity and bacterial community structure. The photograph shows sand positions 0 (upper right), 2.5, and 5.0 m (lower left).
Coasts 05 00034 g001
Figure 2. Mean (±standard deviation) moisture content (A) and organic matter content (B) in sand at Biloxi East Beach, Mississippi, USA. Sand was sampled at five positions along four transects, representing a gradient from dry sand towards the upper beach (0 m) to submerged sand in the water (10 m), with points 2.5 m apart. Bars with different lower-case letters indicate positions that were significantly different (p < 0.05) in terms of sand moisture (A) or organic matter content (B).
Coasts 05 00034 g002
Figure 3. Activity of the microbial enzymes β-glucosidase, NAGase, phophatase, phenol oxidase, and peroxidase in sand samples collected at Biloxi East Beach, MS, USA. (A) Enzyme activity in surface sand along 10 m transects (n = 4) from driest (0 m) to fully submerged (10 m) sand. (B) Enzyme activity in sand at different depths (0–0.4 m; y-axis) at the 5 m position along each transect. Enzyme activity is expressed in nmol h1 g1 dry sand. Values represent mean activity for each enzyme at that position, and error bars indicate standard error.
Coasts 05 00034 g003
Figure 4. NMDS ordinations based on Bray–Curtis dissimilarity scores of bacterial communities from sand samples collected at Biloxi East Beach, Biloxi, MS, USA. Samples are grouped by color based on surface sand collected from different sampling positions along four 10 m long transects, where 0 m represents the driest sand and 10 m represents completely submerged sand and by sand sampled from additional depths (0.1, 0.2, 0.3, and 0.4 m) at the 5 m position of each transect. Panels show the entire dataset (A) and samples separated solely by depth (B) or position (C).
Coasts 05 00034 g004
Figure 5. Proportions of dominant bacterial phyla in the bacterial community of sand samples collected at Biloxi East Beach, Biloxi, MS, USA. (A) Stacked area plot showing the percentages of 16S rRNA gene sequences identified as different bacterial phyla in surface sand along 10 m transects (x axis, averages of four transects) from driest (0 m) to fully submerged (10 m) sand. (B) Stacked area plot showing the percentages of 16S rRNA gene sequences identified as different bacterial phyla at different depths (0–0.4 m; y-axis) collected at the 5 m position along same transects. Only phyla comprising >1% of identified 16S rRNA gene sequences are shown with less abundant phyla grouped as “Other”. Classes Alphaproteobacteria and Gammaproteobacteria within phylum Pseudomonadota are shown separately.
Coasts 05 00034 g005
Figure 6. Bacterial species diversity (Inverse Simpson’s index) and species richness (species observed) of sand samples collected at Biloxi East Beach, Biloxi, MS, USA. Samples are surface sand collected along 10 m transects (n = 4) from driest (0 m) to fully submerged (10 m) sand (A,B), and from sand collected at different depths (0–0.4 m) from the 5 m position along same transects (C,D). Boxes show the interquartile ranges/distributions of values measured in each metric, with the central line representing the median value from that sample type. Lines outside the boxes represent the highest and lowest values associated with each grouping variable and dots represent any outliers from each group.
Coasts 05 00034 g006
Figure 7. NMDS ordination based on Bray–Curtis dissimilarity scores of bacterial communities from sand samples collected at Biloxi East Beach, Biloxi, MS, USA. Samples are grouped by color based on surface sand collecting from different sampling positions along four 10 m long transects, where 0 m represents the driest sand and 10 m represents completely submerged sand, and by sand sampled from additional depths (0.1, 0.2, 0.3, and 0.4 m) at the 5 m position of each transect. ASVs (14) that had >0.3% relative abundance of all bacterial sequences and significantly influenced the bacterial community composition of samples are shown as vectors where length and direction of each line are proportionate to their effect size and association to samples. ASVs are annotated at their finest taxonomic identification.
Coasts 05 00034 g007
Figure 8. Mean abundance of dominant ASVs (i.e., >0.3% relative abundance of all bacterial sequences) in sand samples collected at Biloxi East Beach, Biloxi, MS, USA. (A) Line plot showing the log-transformed mean absolute abundance of dominant ASVs (14) identified in surface sand along 10 m transects (x axis, averages of four transects) from driest (0 m) to fully submerged (10 m) sand. (B) Line plot showing the log-transformed mean absolute abundance of dominant ASVs (14) identified in sand at different depths (0–0.4 m; y-axis) collected at the 5 m position along same transects. ASVs are separated by color and annotated to their finest taxonomic classification.
Coasts 05 00034 g008
Disclaimer/Publisher’s Note: The statements, opinions and data contained in all publications are solely those of the individual author(s) and contributor(s) and not of MDPI and/or the editor(s). MDPI and/or the editor(s) disclaim responsibility for any injury to people or property resulting from any ideas, methods, instructions or products referred to in the content.