Article

Vegetation Index Comparison for Estimating Above-Ground Carbon (Cag) in Mangrove Forests Using Sentinel-2 Imagery: Case Study from West Bali, Indonesia

by
I Gede Agus Novanda
1,
Martiwi Diah Setiawati
2,3,*,
I Putu Sugiana
1,
I Gusti Ayu Istri Pradnyandari Dewi
4,
Anak Agung Eka Andiani
4,
Made Wirakumara Kamasan
5,
I Putu Echa Priyaning Aryunisha
1 and
Abd. Rahman As-syakur
1,6,*
1
Center for Environmental Research (PPLH), Udayana University, Jalan PB Sudirman, Denpasar 80232, Bali, Indonesia
2
Institute for the Advanced Study of Sustainability (UNU-IAS), United Nations University, Jingumae 5-53-70, Shibuya-ku 1508925, Tokyo, Japan
3
Research Center for Oceanography, National Research and Innovation Agency (BRIN), Jl. Pasir Putih I, Ancol Timur, North Jakarta 14430, Jakarta, Indonesia
4
Graduate Program of Marine Science, School of Graduates, IPB University, IPB Dramaga Campus, Bogor 16680, West Java, Indonesia
5
Graduate School of Sciences and Technology for Innovation, Yamaguchi University, 2-16-1 Tokiwadai, Ube-shi 755-8611, Yamaguchi, Japan
6
Marine Science Department, Faculty of Marine and Fisheries, Udayana University, Bukit Jimbaran Campus, Badung 80361, Bali, Indonesia
*
Authors to whom correspondence should be addressed.
Coasts 2025, 5(3), 33; https://doi.org/10.3390/coasts5030033 (registering DOI)
Submission received: 23 April 2025 / Revised: 8 July 2025 / Accepted: 3 September 2025 / Published: 5 September 2025

Abstract

Remote sensing offers an effective alternative for estimating mangrove carbon stocks by analyzing the relationship between satellite pixel values and field-based carbon measurements. This research was carried out in the mangrove forests of western Bali, Indonesia, encompassing three areas situated in a non-conservation mangrove forest area. This study assessed 32 remote sensing vegetation indices derived from Sentinel-2 satellite imagery to identify the optimal model for quantifying the above-ground carbon (Cag) content in mangrove ecosystems. Field data were collected using stratified random sampling and were used to develop regression models linking the Cag with vegetation indices. The Simple Ratio (SR) index exhibited the highest correlation (r = 0.847, R2 = 0.707), while the Three Index Vegetation Above-Ground Carbon (TrIVCag) model, combining the SR, Specific Leaf Area Vegetation Index (SLAVI), and Transformed Ratio Vegetation Index (TRVI) indices, achieved the best performance (r = 0.870, R2 = 0.728). The model validation results confirmed the reliability of the TrIVCag model, as indicated by a correlation of 0.852 between the model estimates and measured Cag values from independent field data. In 2023, the mangrove area in western Bali (excluding West Bali National Park) was estimated at 376.85 ha, with a total above-ground carbon stock of 34,994.55 tonC/ha. Region A had the highest average Cag at 98.97 tonC/ha, followed by Regions B (66.58 tonC/ha) and C (86.98 tonC/ha). This model offers a practical and scalable approach to carbon monitoring and is expected to play a valuable role in supporting blue carbon conservation efforts and contributing to climate change mitigation.

1. Introduction

Mangrove forests play a vital role in mitigating climate change due to their capacity to sequester carbon at rates significantly higher than most terrestrial ecosystems [1,2], with the ability to store carbon four times more than other vegetation types [3]. The substantial carbon absorption is attributed to photosynthesis, which is then stored in the form of biomass, including above-ground biomass (Bag) or on the soil surface (leaves, stems, branches, flowers) and below-ground biomass (Bbg) or beneath the soil surface (roots) [4]. Above-ground carbon storage can be measured either through direct field methods or remote sensing techniques [5]. Direct measurements yield high accuracy but are not practical and efficient when conducted in extensive mangrove areas [6]. As a result, indirect estimation methods utilizing allometric equations based on tree characteristics, such as the diameter at breast height (DBH), have become a widely accepted alternative [7].
Remote sensing and Geographic Information System (GIS) technologies have become essential for mapping and monitoring mangrove forests, particularly in complex coastal environments [8,9]. The estimation of above-ground carbon (Cag) values can be mapped using satellite imagery data, using both the original bands and spectral transformations from various satellite image types [10]. The accuracy level of models generated from the use of a single band or a single vegetation index varies, as demonstrated by Wicaksono et al. [10], who obtained a standard estimation error of 11.39–14.23 kg C/m2 and Purnamasari et al. [11], with a standard error of 31.41 tonC/ha, while Kamal et al. [12] achieved a model accuracy of 53.83% using a generic allometric equation. In summary, different vegetation indices and spectral bands yield varying levels of accuracy in carbon stock modeling. These inconsistencies highlight the need for more comprehensive approaches that can better capture the heterogeneity and biophysical complexity of mangrove vegetation.
One of the crucial aspects of remote sensing-based mangrove biomass and carbon stock estimation is the selection of appropriate satellite imagery. In this study, the Sentinel-2 imagery was chosen due to its superior spectral resolution, free accessibility, and frequent revisit time compared to other satellite missions. Sentinel-2, developed by the European Space Agency (ESA), provides high-resolution multispectral imagery with 13 bands covering the visible, near-infrared (NIR), and shortwave infrared (SWIR) regions [13]. These spectral characteristics are particularly advantageous for mangrove studies, as they enable the derivation of various vegetation indices that enhance the differentiation of plant health, biomass estimation, and carbon stock assessments [14]. The red-edge bands in Sentinel-2 (bands 5, 6, and 7) significantly improve the detection of vegetation characteristics, including the chlorophyll content and canopy structure, which are critical factors in estimating biomass and carbon stocks [15].
Additionally, Sentinel-2 offers a 10–20 m spatial resolution in key spectral bands, which is considerably higher than other freely available satellite imagery, such as Landsat-8 (30 m resolution) [16]. This higher spatial resolution allows for more precise mapping of the mangrove extent and structure, reducing errors associated with mixed-pixel issues in heterogeneous coastal environments. Moreover, Sentinel-2 has a five-day revisit time, ensuring a higher probability of obtaining cloud-free images in tropical regions prone to frequent cloud cover, such as Indonesia [17]. The consistent and high-frequency image acquisition also supports the temporal analysis of mangrove dynamics, which is essential for long-term carbon monitoring and climate change mitigation efforts [18].
While previous studies have employed satellite imagery and vegetation indices to estimate above-ground carbon (Cag) in mangrove ecosystems, models based on a single index often suffer from inconsistent accuracy [10,11,12] due to their limited ability to reflect the complex biophysical characteristics of the mangrove vegetation. To address this limitation, the present study proposed an innovative, integrative modeling approach that combines multiple spectral transformations specifically, a suite of thirty-two vegetation indices, to enhance the precision, stability, and spatial coherence of the Cag estimation. By leveraging the diverse sensitivity of these indices to vegetation properties—such as the canopy density, leaf pigment concentration, and structural heterogeneity—the model aims to provide a more comprehensive representation of mangrove conditions. This study first establishes statistical relationships between field-measured Cag values and each spectral index to identify key predictors, which are then integrated into a robust estimation model. This model is subsequently applied to generate spatially explicit maps of mangrove carbon stocks, allowing for refined assessments of the carbon distribution across heterogeneous landscapes. Ultimately, this research advances remote sensing techniques for blue carbon monitoring and contributes critical insights for ecosystem accounting and climate change mitigation.

2. Materials and Methods

2.1. Research Location

This research was conducted in the mangrove area of West Bali, situated on the island of Bali, Indonesia, as illustrated in Figure 1. Data collection was carried out from June to August 2023 in three locations: Area A, which includes the villages of Perancak, Pengambengan, Loloan Timur, Sangkaragung, Air Kuning, Lelateng and Budeng; Area B, covering the villages of Banyu Biru, Tuwed, and Candikesuma; and Area C, encompassing the villages of Pejarakan, Pemuteran, and Sumberkima. Administratively, Areas A and B fall within Jembrana Regency, while Area C is part of Buleleng Regency. These three sites represent mangrove zones that are not designated as conservation areas on Bali, whereas all other mangrove regions on the island have been officially designated as conservation areas by the Indonesian Ministry of Forestry.

2.2. Field Samples

The determination of sampling points was conducted using stratified random sampling and proportional sampling methods. Stratified random sampling is widely used in ecological studies to ensure that samples represent the heterogeneity of the study area while reducing sampling bias [19,20]. This method involves dividing the population into strata based on specific characteristics such as vegetation density, tidal influence, and soil composition [1,21]. Proportional sampling ensured that each stratum contributed field plots in accordance with its area, thereby enhancing representativeness and minimizing error. This approach is particularly important in mangrove ecosystems where variation in structure and hydrology strongly influences biomass and carbon storage.
Meanwhile, proportional sampling was applied to ensure that each stratum contributed to the final dataset in accordance with its area coverage. This approach is especially relevant in mangrove ecosystems, where variations in structure and function can significantly impact carbon storage, biogeochemical processes, and ecological dynamics [22,23]. The number of samples taken from each stratum was proportional to its area to enhance statistical robustness and minimize errors in ecological estimations [24].
The GPS coordinates of each sampling point were recorded to ensure spatial accuracy and repeatability. This method follows best practices from previous studies in mangrove ecosystems [25,26]. By implementing these combined methods, this study aims to obtain representative and reliable data on the condition of the mangrove ecosystem in the study area, thereby supporting effective conservation and management efforts.
Field data collection was carried out by measuring tree and sapling circumference of individual mangrove at breast height (CBH 1.3 m above ground level) within square transect plots measuring 10 m × 10 m, located at predetermined sampling points. The recorded circumference values were then converted to diameter at breast height (DBH) under the assumption that the tree stem cross-section is circular (Equation (1)). The resulting DBH data were subsequently used to estimate above-ground carbon (CAG) using allometric equations as presented in Equations (2) and (3).
DBH = CBH/π
where DBH is diameter at breast height, CBH is circumference at breast height, and π is constant with value 3.14.
In the present study, a total of 45 plots were sampled, with 18 located in Area A, 8 in Area B, and 19 in Area C. For subsequent analysis, data from 30 of these plots were used to develop the model, while the remaining 15 plots (representing a 66.67%/33.33% split) were used for model validation. This partitioning was adopted due to the relatively small size of the dataset (n < 100), as this proportion was anticipated to strike a balance between providing adequate data for robust model construction, thereby mitigating potential bias, and ensuring a sufficient independent dataset for evaluating the model’s generalization performance and controlling variance. As Kuhn and Johnson [27] note, a training-to-validation split of 60% to 80% is a common and adaptable practice, often guided by the dataset’s size and complexity. Furthermore, Gebremedhin et al. [28] employed a similar division (60% to 80% for model building) with vegetation index data and reported comparable accuracy levels across the different proportions.

2.3. Image Data Processing

To assess the spectral sensitivity of vegetation indices to above-ground carbon (Cag) in mangrove forests, 32 remotely sensed vegetation indices derived from Sentinel-2 imagery were selected. These indices were selected based on their documented relevance in previous studies of biomass, chlorophyll, and vegetation structure, as well as their spectral compatibility with available Sentinel-2 bands [8,29]. Some indices are known for their performance in forest monitoring, such as Normalized Difference Vegetation Index (NDVI) and Enhanced Vegetation Index (EVI) [30], while others such as Specific Leaf Area Vegetation Index (SLAVI) and Chlorophyll Index Red Edge (CIRE) utilize spectral bands that capture structural or biochemical variations [31,32]. Table 1 presents a list of the vegetation indices used, including their formulas.
Sentinel-2 imagery was chosen for its high spatial (10–20 m) and spectral resolution, particularly in red-edge and NIR bands, which are crucial for estimating above-ground carbon (Cag) in mangrove forests. Compared to Landsat-8 (30 m resolution), Sentinel-2 provides more detailed canopy analysis, reducing uncertainty in carbon estimation. Its 2-day revisit period ensures better temporal consistency, minimizing seasonal variations. Academically, Sentinel-2’s 12-bit radiometric resolution has been widely validated for mangrove studies, offering superior species differentiation and biomass assessment, making it the most suitable dataset for this research. In this study, the bands used in calculating the vegetation index consisted of 7 bands, with the specifications of their names and spatial resolutions as shown in Table 1.
To minimize potential spatial bias resulting from differences in spatial resolution among spectral bands used in vegetation index calculations, all bands with lower spatial resolution, specifically RedEdge 1, and 2 and Swir2, originally at 20 m were resampled to a spatial resolution of 10 m using bilinear interpolation. This resampling was conducted to standardize the spatial grid across all image bands, ensuring that each pixel represents an equivalent ground area. However, it should be noted that the accuracy of the spectral information remains constrained by the original resolution of each band. The standardization of spatial resolution is essential to ensure that all vegetation indices are calculated based on spatially consistent pixels, thereby allowing for meaningful integration and comparison in subsequent analyses, such as the development of above-ground carbon (Cag) estimation models. Moreover, harmonizing the resolution helps prevent index value distortions caused by pixel misalignments between bands, which could otherwise lead to errors in both quantitative and spatial interpretation
Sentinel-2 imagery used in this study was processed based on the standard scientific products from Level 2 Multispectral Instrument images available on the Google Earth Engine (GEE) web catalog. The primary Sentinel-2 L2 data was downloaded from Copernicus, followed by executing the sen2cor procedure to produce a dataset of processed images on GEE. Image processing on GEE was conducted using JavaScript programming language to generate pixel values for each vegetation index in the form of “GeoTif” data format. Data used in calculating the values for each vegetation index were image data captured during the period from January to October 2023, with the synthesis of median image data. This preprocessing reduced cloud interference and spectral inconsistencies caused by tidal effects. Image cropping was performed to reduce the area (according to the research scope) and file size before downloading. The vegetation index used in this study and its equation can be seen in Table 2.

2.4. Data Analysis

Carbon stocks are analyzed using allometric equations, which represent the relationship between the DBH and wood density for each mangrove species. Carbon stock of each stand is calculated from the biomass. Above-ground biomass is calculated using a non-destructive method employing an ordinary allometric equation that involves the relationship between diameter at breast height and wood density ( ρ ) [7]. The wood density values for each mangrove species are referenced from the International Centre for Research in Agroforestry (ICRAF). The above-ground carbon stock of mangroves, in terms of tons of carbon per hectare (tonC/ha), is estimated based on 46.82% of its biomass value as per the following equation [33].
W t o p = 0.251 × ρ × D 2.46
C t o p = 46.82 % × W t o p
where Wtop is the above-ground biomass (kg), ρ is the density of each mangrove species (g/cm3), D is the diameter at breast height (cm), and Ctop is the above-ground carbon or Cag (tonC/ha).
Moreover, linear regression and multiple linear regression methods were applied to develop models that describe the relationship between vegetation index values and above-ground carbon (Cag). Linear regression is a widely used statistical technique for estimating the relationship between a dependent variable, Cag in this case, and one or more independent variables, namely the vegetation indices. Model parameters were estimated using the least squares method (Kern et al., 2018) [34]. A simple linear regression model was used when only one predictor variable was involved, while multiple linear regression was employed when two or more predictors were included. The models were constructed through statistical analysis linking vegetation indices to Cag, following an approach adopted in previous studies, e.g., [35].
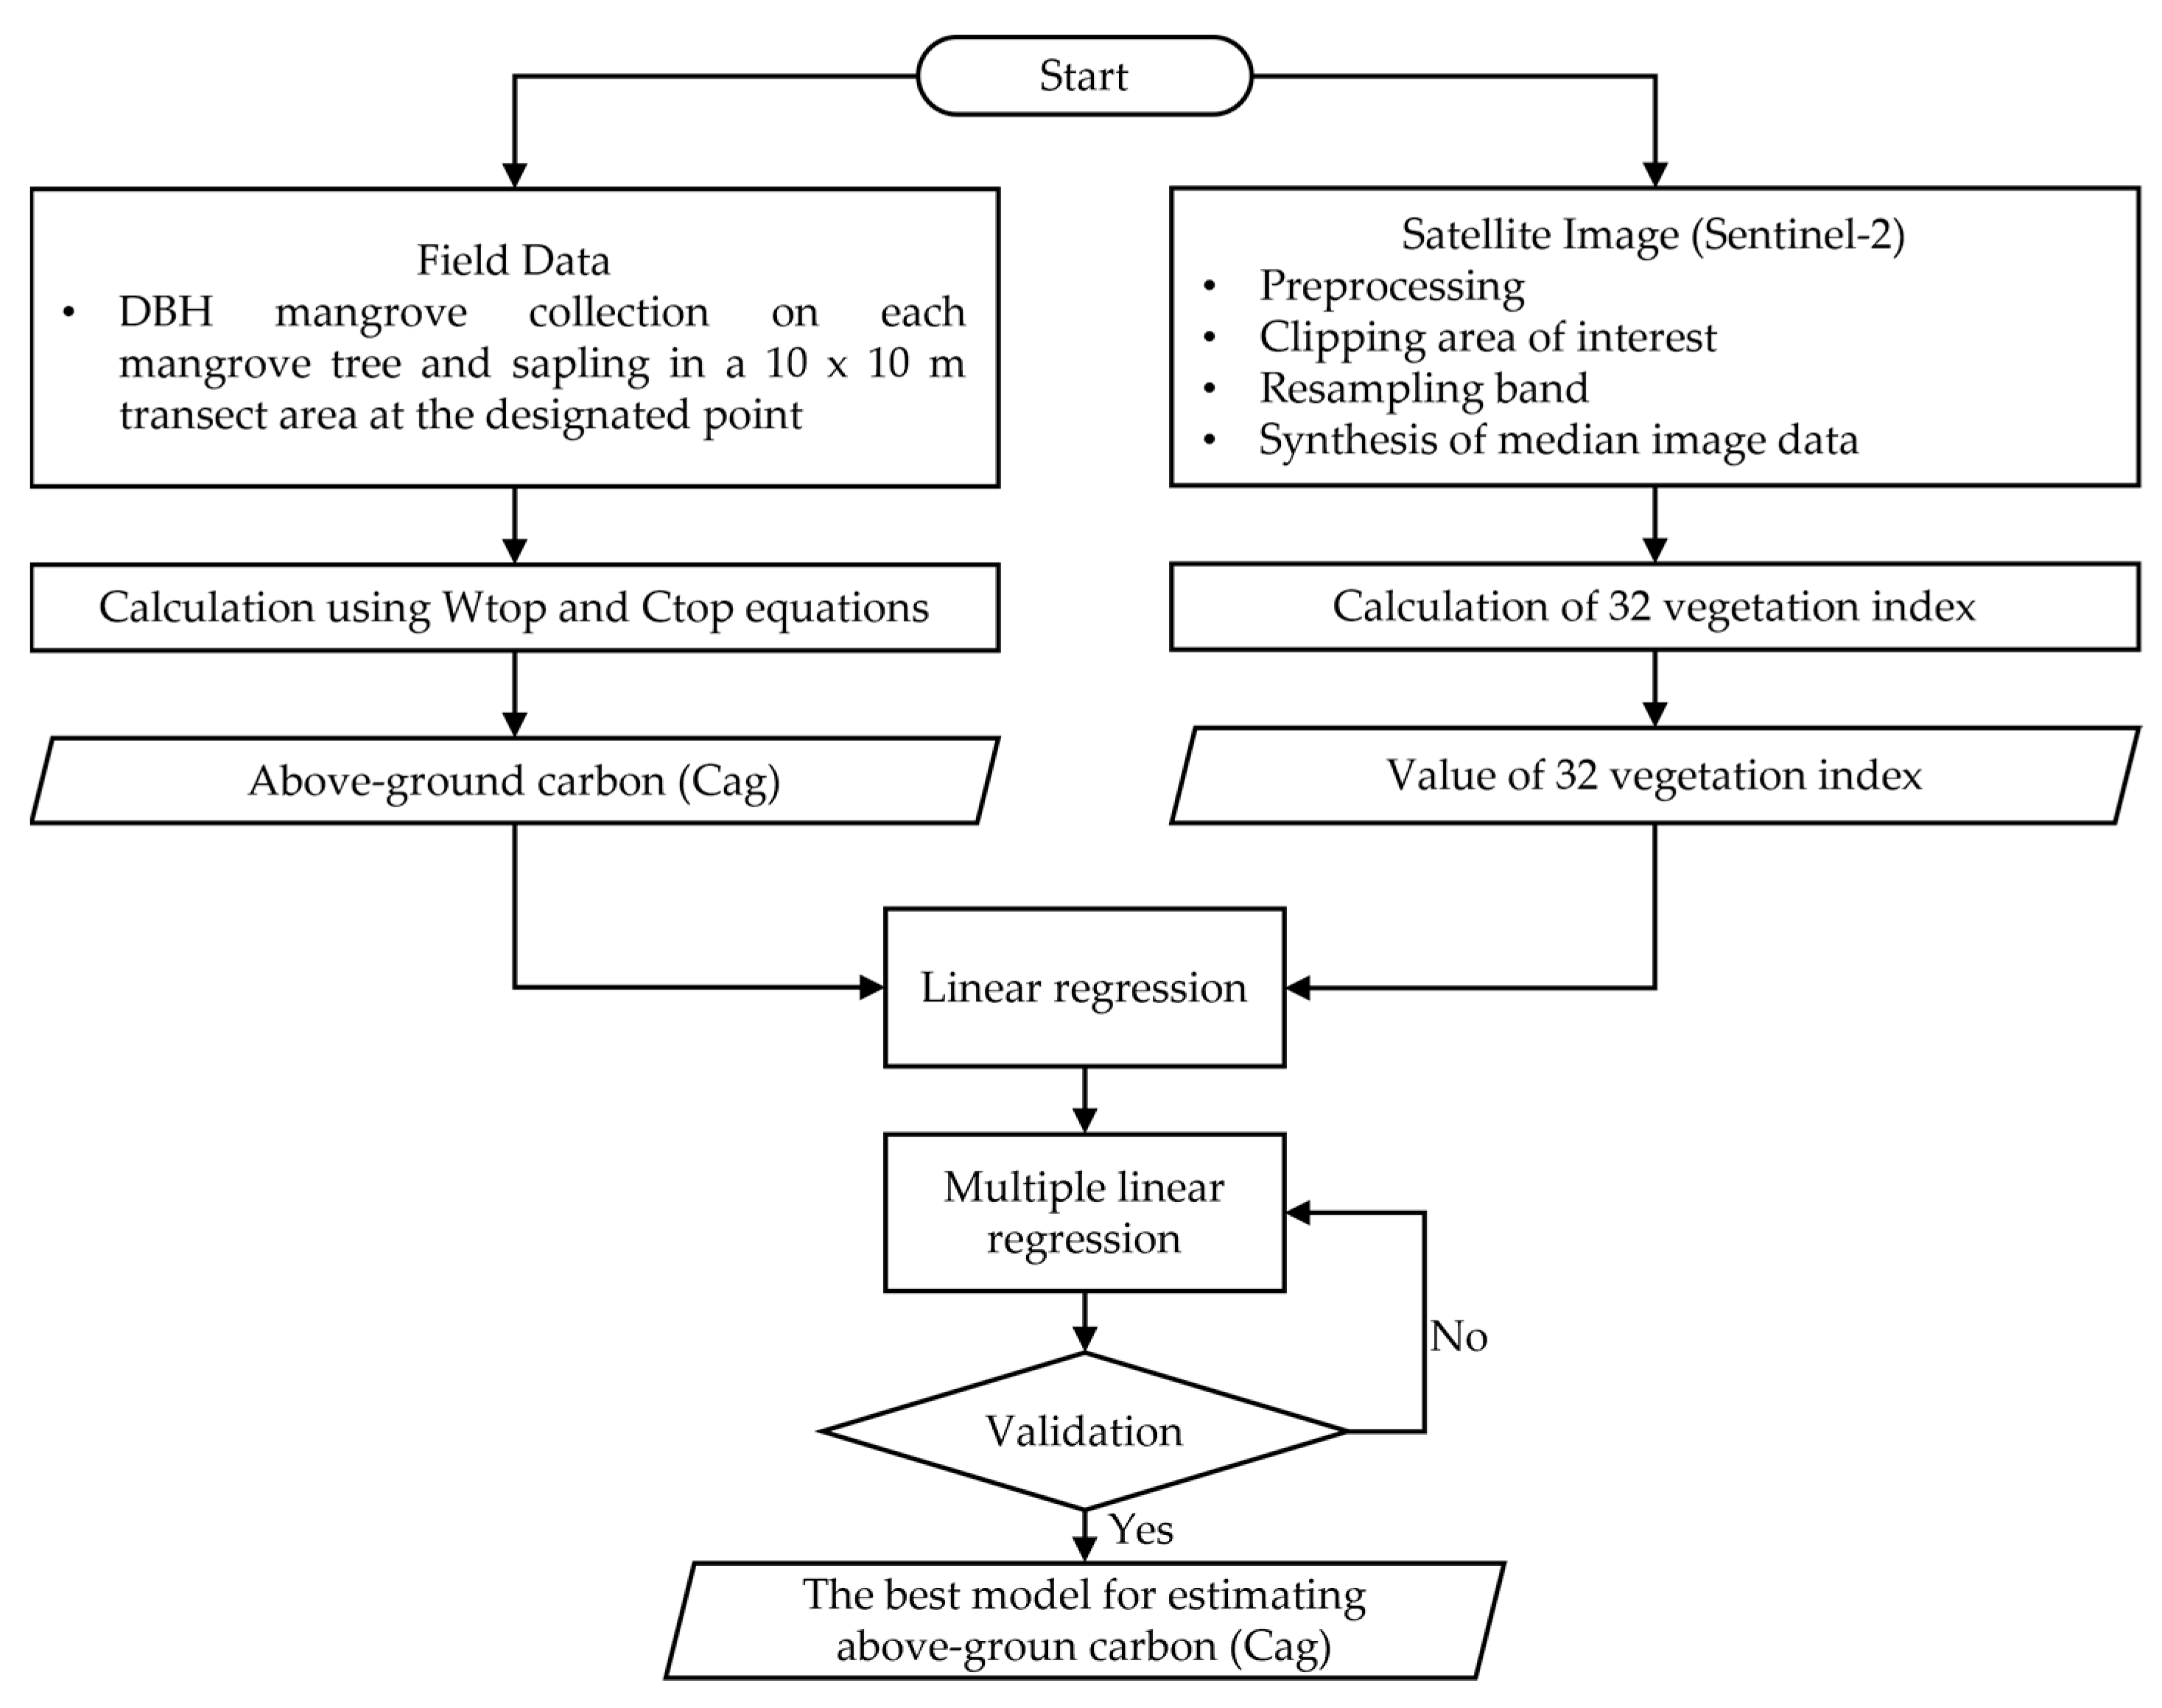
To evaluate model performance, two key statistical metrics were used: the coefficient of determination (R2) and the Root Mean Square Error (RMSE). The R2 value measures how well the model explains the variability in the observed data, whereas the RMSE quantifies the average deviation between predicted and actual values [34]. A reliable model is indicated by a high R2 and a low RMSE, with a lower RMSE suggesting more accurate predictions. In addition to these numerical metrics, residual plots were used to visually inspect the model’s validity by plotting residuals against predicted values. Any visible patterns in these plots could indicate violations of key regression assumptions, such as linearity or homoscedasticity [36]. Further validation was carried out through scatter plots comparing predicted values with actual field observations to assess the model’s ability to represent real-world conditions accurately. The statistical significance of both the LR and MLR models was tested using a p-value threshold of 0.05, corresponding to a 95% confidence level. Based on these assessments, the best-performing vegetation index-based model for estimating Cag was selected, and this model was subsequently used to spatially estimate Cag across the study area using Sentinel-2 imagery. In general, the flow of the research stages can be seen in Figure 2.

3. Results and Discussion

3.1. Vegetation Index-Based Above-Ground Carbon (Cag) Model

The western part of Bali has mangrove areas scattered along the coast of the Jembrana and Buleleng Regencies. The average of Cag in mangroves in the western part of Bali is 89.596 tonC/ha. This result is significantly smaller than the Cag in the mangrove area of the Ngurah Rai Forest Park (TAHURA) in Bali, which averages 193.450 tonC/ha [4]. This condition is closely related to the differences in the species dominance, stem diameter, and health [3], where in the western Bali region, Rhizophora sp. and Avicennia sp. dominate with an average DBH of 5.06 cm. Meanwhile, the mangrove area of TAHURA, Bali, is dominated by Soneratia sp. and Rhizophora sp., with an average DBH of 10.85 cm. The difference in the tree diameter also influences the biomass value. Tree diameter is positively correlated with stored biomass, with larger diameters indicating greater storage [37].
The tabulation of carbon storage data on the field surface is then compared with each vegetation index value collected to determine the relationship between the spectral weight of vegetation indices and carbon storage values on the surface of mangroves. This analysis leads to the development of a linear regression model designed to estimate carbon storage on the surface in the western region of the Bali mangrove area, outside the national park. The model, derived from data collected from thirty plots, is evaluated using the coefficient of determination and RMSE tests to determine its effectiveness in explaining the carbon storage present on the surface. The results of the regression model and the accuracy level of the vegetation index for aboveground carbon in the mangrove area of West Bali are presented in full in Table 3.
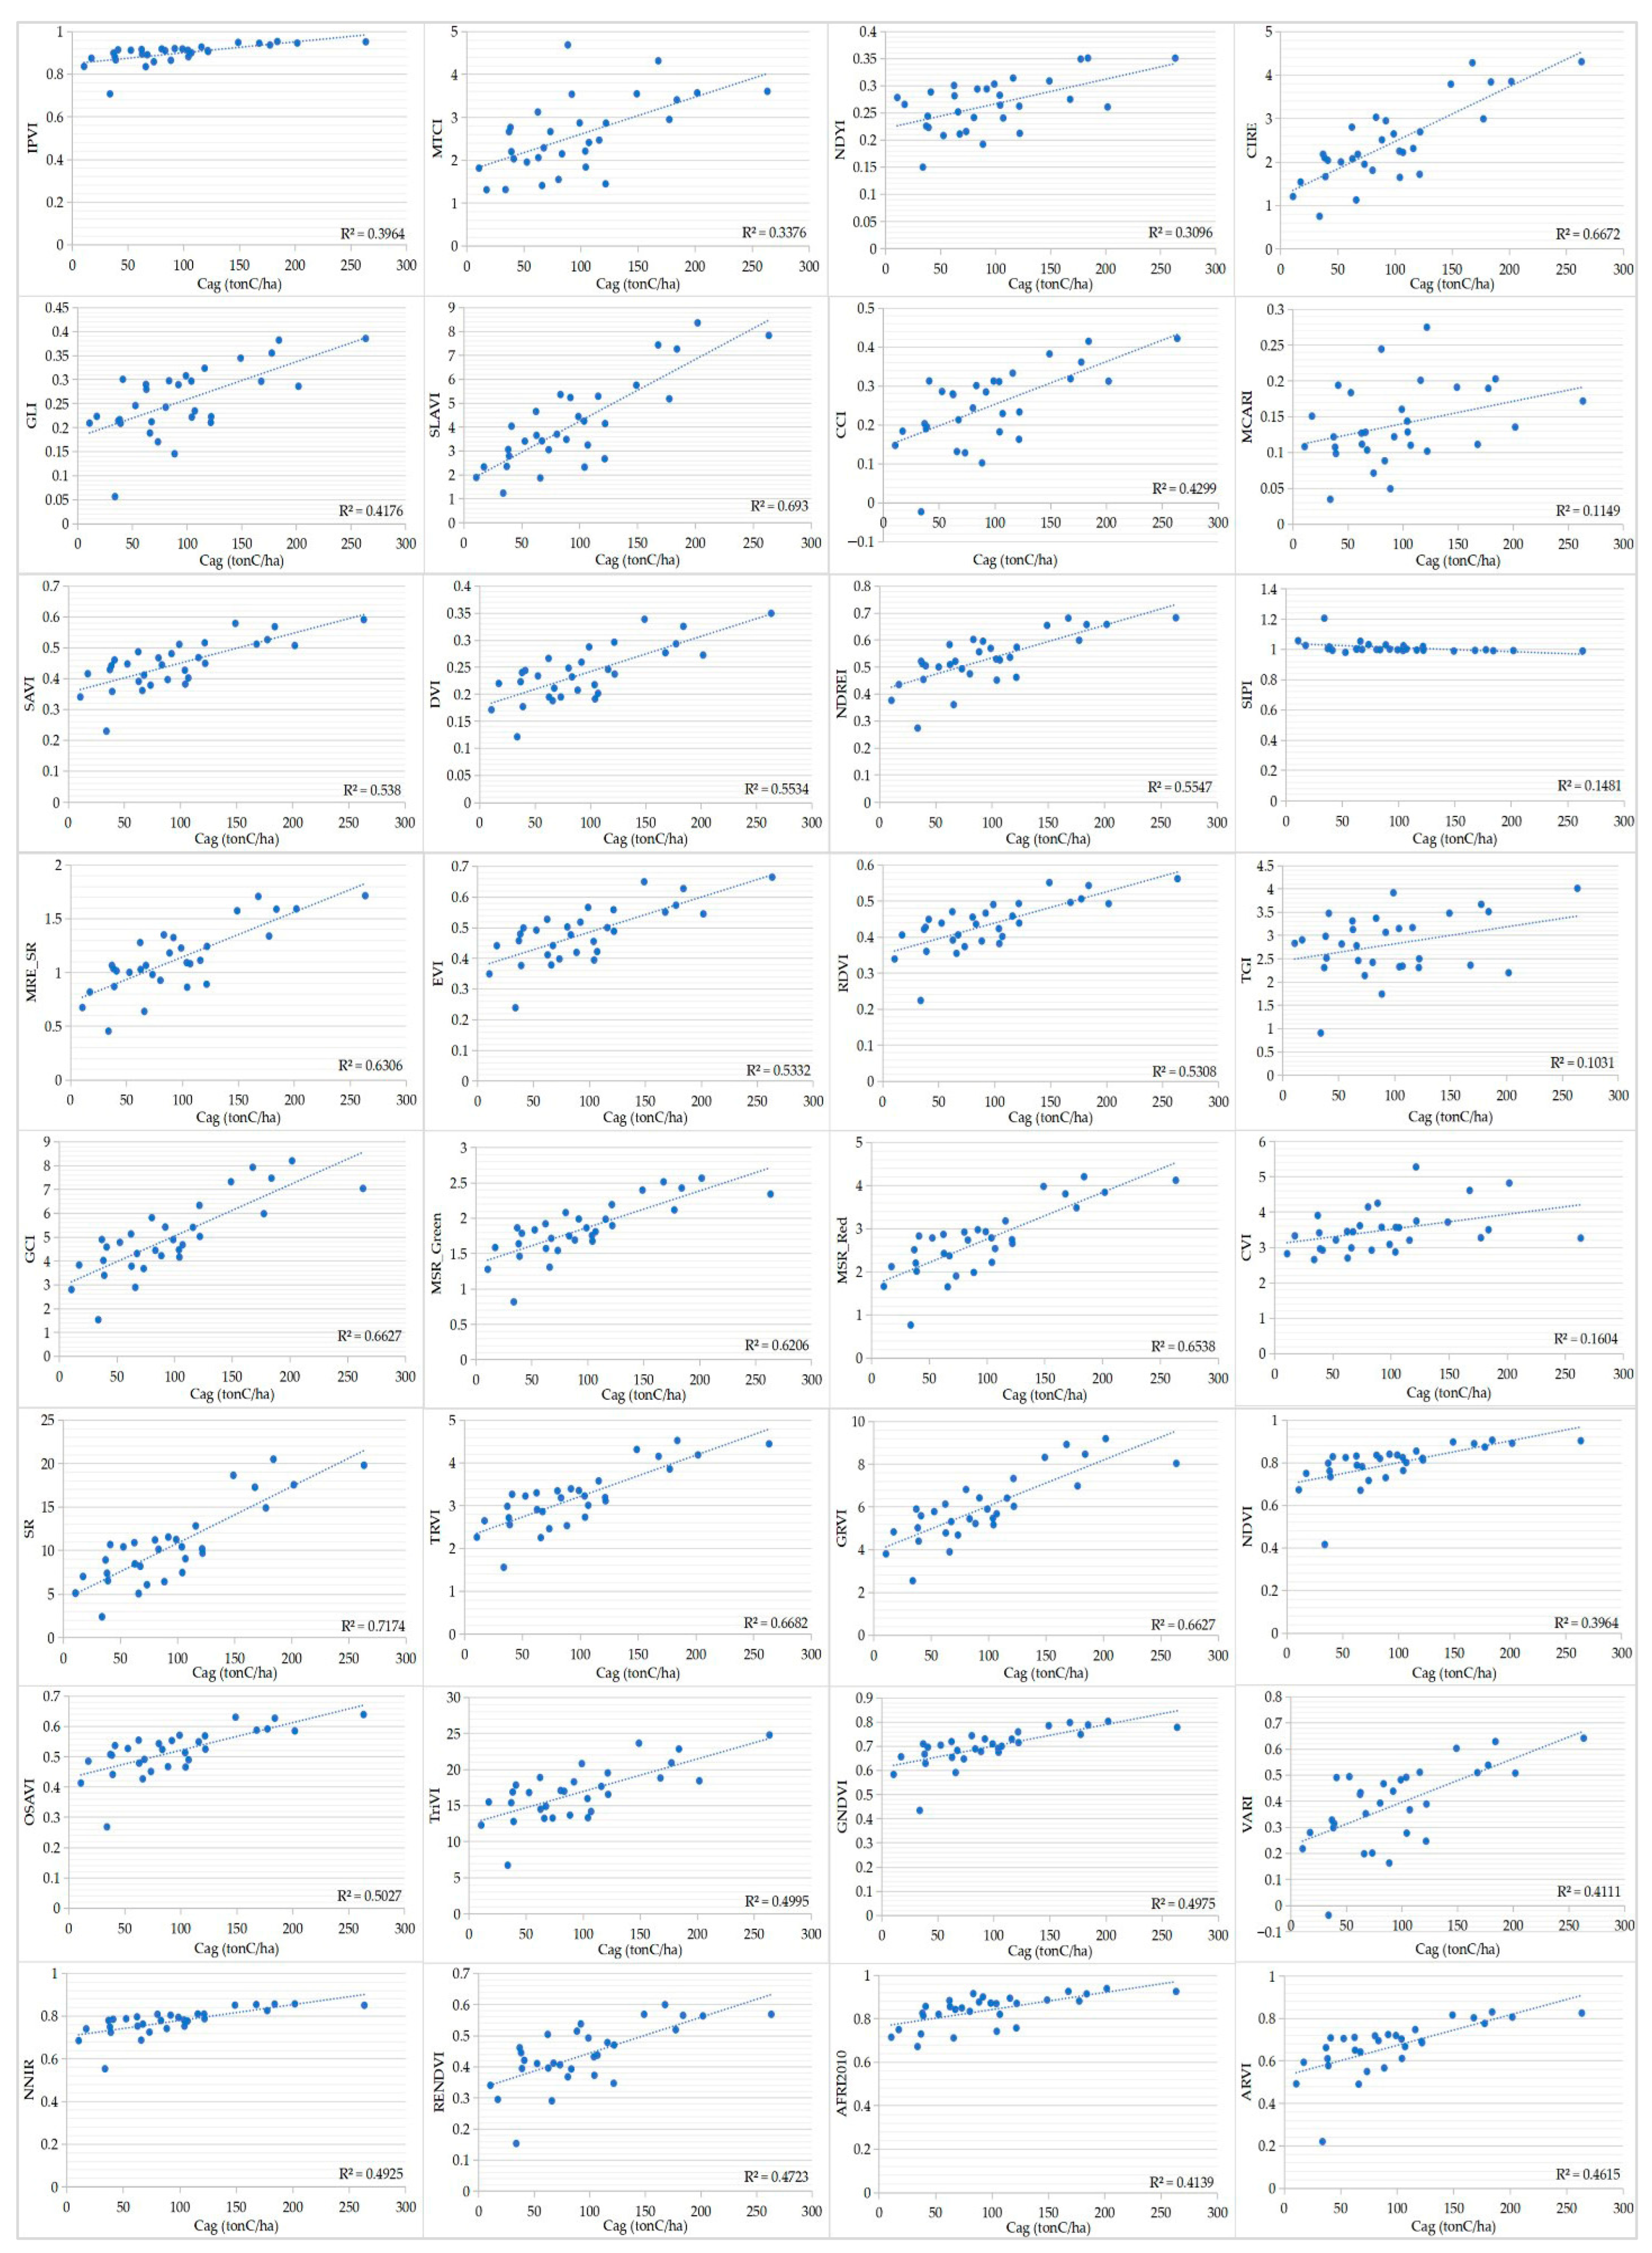
The results of the Sentinel-2 spectral transformation from thirty-two vegetation indices were then correlated with the surface carbon storage in the field, yielding a range of correlation values (r) from −0.385 to 0.847. Seven vegetation indices exhibited correlation (r) values > 0.80 and determination coefficients (R2) > 0.640, namely the MSR-Red, GCI, GRVI, CIRE, TRVI, SLAVI, and SR, with the SR index showing the most significant relationship, indicated by an r = 0.847 and an R2 = 0.707 (the highest among the indices). To provide a clearer understanding, Figure 3 displays the distribution of the Cag (tonC/ha) for each vegetation index.
Using the best-performing indices, a combined model was developed to explore the collective relationship of these indices with Cag using the multiple regression. The results indicated that the combination of three vegetation indices, namely the SR, SLAVI, and TRVI, exhibited a stronger correlation with the r = 0.870 and R2 = 0.728. In other words, the combined effect of these three vegetation indices (SR, SLAVI, and TRVI) could explain 72.79% of the variation in Cag, while other factors influenced the remaining 27.21%. The obtained equation is as follows:
T r I V C a g = 109.725 + ( 19.732 S R ) + ( 10.882 S L A V I ) ( 84.210 T R V I )
The equation is subsequently referred to as the Three Index Vegetation Above-Ground Carbon equation (TrIVCag). Figure 4 shows the linear relationship between the estimated Cag values generated by the TrIVCag equation and the observed Cag values measured in the field. This figure illustrates the ability of the model to accurately reflect real-world carbon variations in mangrove stands.
In this study, we also validated the Cag estimation based on the equation composed of three TrIVCag indices, which are the SR, SLAVI, and TRVI. The validation was conducted using 15 different field sample points that were distinct from those used in model development but still fell within the same study area and timeframe. The validation results indicated that the TrIVCag estimation model exhibited the highest correlation, with a value of 0.852, and the lowest RMSE value of 92.399 tonC/ha. In comparison, the SRand TRVI yielded correlation values of 0.827, and 0.817, respectively, with corresponding RMSE values of 95.137 and 95.289 tonC/ha. This suggests that the TrIVCag model effectively and accurately explains the surface carbon stock in mangrove areas. Furthermore, this model shows a significant improvement over the previous research conducted by Ramadhan and Siman [38], which explored the relationship between mangrove biomass and the NDVI, achieving an r value of 0.640 and an R2 value of 0.505. These findings demonstrate that the TrIVCag model offers a more robust and reliable approach for estimating above-ground carbon in mangrove forests, outperforming conventional vegetation indices in both accuracy and consistency.
The TrIVCag has a better accuracy because combining several indices in compiling the model will increase the effectiveness of each channel that compiles the model compared to using a single index. Each single index has its own level of effectiveness, such as the SLAVI, which mainly informs a good Leaf Area Index [29]. The SR vegetation index and the TRVI both utilize wavelengths in the NIR and Red bands, while the SLAVI incorporates three bands: NIR, Red, and SWIR2. The Red band (664.5 nm/S2A) is often employed to measure chlorophyll pigments in plants. Chlorophyll absorbs red light and reflects most of the green light, causing plant leaves to appear green in the Red band. Changes in the chlorophyll content and plant conditions can be reflected in the reflectance in the Red band. The NIR band (835.1 nm/S2A) is susceptible to plant cell structures and the water content in plant tissues. Healthy and thriving plants tend to exhibit high reflectance in the NIR band because water in plant cells absorbs NIR light. The NIR band is used in vegetation indices to measure the vegetation density and health. On the other hand, the SWIR band, which operates at 1613.7 nm (S2A), is sensitive to deeper plant components, including the soil moisture and chemical properties of plants. The SWIR band can also be used to detect the leaf water content and soil surface quality [39].
To enhance the scientific interpretation of the TrIVCag model parameters, we further explain the physical and ecological significance of the selected vegetation indices: the SR (Simple Ratio), SLAVI (Specific Leaf Area Vegetation Index), and TRVI (Transformed Ratio Vegetation Index). The SR index (NIR/Red) measures the ratio of near-infrared reflectance, which is typically high in healthy vegetation, to the red reflectance, which chlorophyll absorbs [40]. This makes the SR a reliable indicator of the vegetation vigor and canopy density. The SLAVI combines the NIR, Red, and SWIR2 bands to estimate the specific leaf area, reflecting the photosynthetic surface area and, indirectly, biomass accumulation [41,42]. The inclusion of SWIR2 enhances the sensitivity to the water content and leaf structure, which are critical components of biomass in mangrove ecosystems. The TRVI, derived from the square root of NIR/Red, stabilizes the index’s response and reduces noise, particularly under variable illumination or canopy conditions [43,44]. These indices offer a comprehensive approach: the SR accounts for the chlorophyll content and canopy greenness, the SLAVI reflects structural and biochemical conditions, and the TRVI enhances spectral robustness. By integrating these indices, the TrIVCag model strengthens its predictive accuracy by encompassing multiple aspects of the vegetation health and structure relevant to above-ground carbon storage.
The use of a simple correlation through linear and multiple regression approaches in this study aimed to produce statistically interpretable results [45,46] regarding the relationship between field-measured Cag values and each vegetation index. The selection of the best index combination was based on the highest linear correlation rankings, followed by exploratory combinations to develop the most suitable regression model reflecting field conditions, as demonstrated through basic validation procedures. This approach offers several advantages, including the ease of application and interpretation, transparency in assessing the influence of each variable statistically, and computational efficiency, which is particularly useful during the initial exploratory phase [47,48,49]. Additionally, the use of a simple correlation allows the resulting equation to be applied more generally in areas with similar characteristics, although further model updates or additional testing may be necessary to improve accuracy and generalizability.
However, this method has limitations in capturing non-linear relationships and complex interactions among vegetation indices, which means it may not fully represent the individual tendencies of each index with respect to the Cag variation. Therefore, we acknowledge that alternative methods, such as random forests, are highly recommended for future research development. A random forest is not only more effective in handling non-linear relationships but is also capable of objectively identifying the importance of each vegetation index through a feature importance analysis. This method is also more robust against overfitting (condition where a model overly fits the training data and loses its predictive capability on new, unseen data) [50,51]. Consequently, applying the random forest method in follow-up studies may provide a stronger foundation for selecting the most influential vegetation indices before constructing a more accurate and representative simulation model of above-ground biomass carbon in mangrove forests.

3.2. Spatial Distribution of Above-Ground Carbon (Cag)

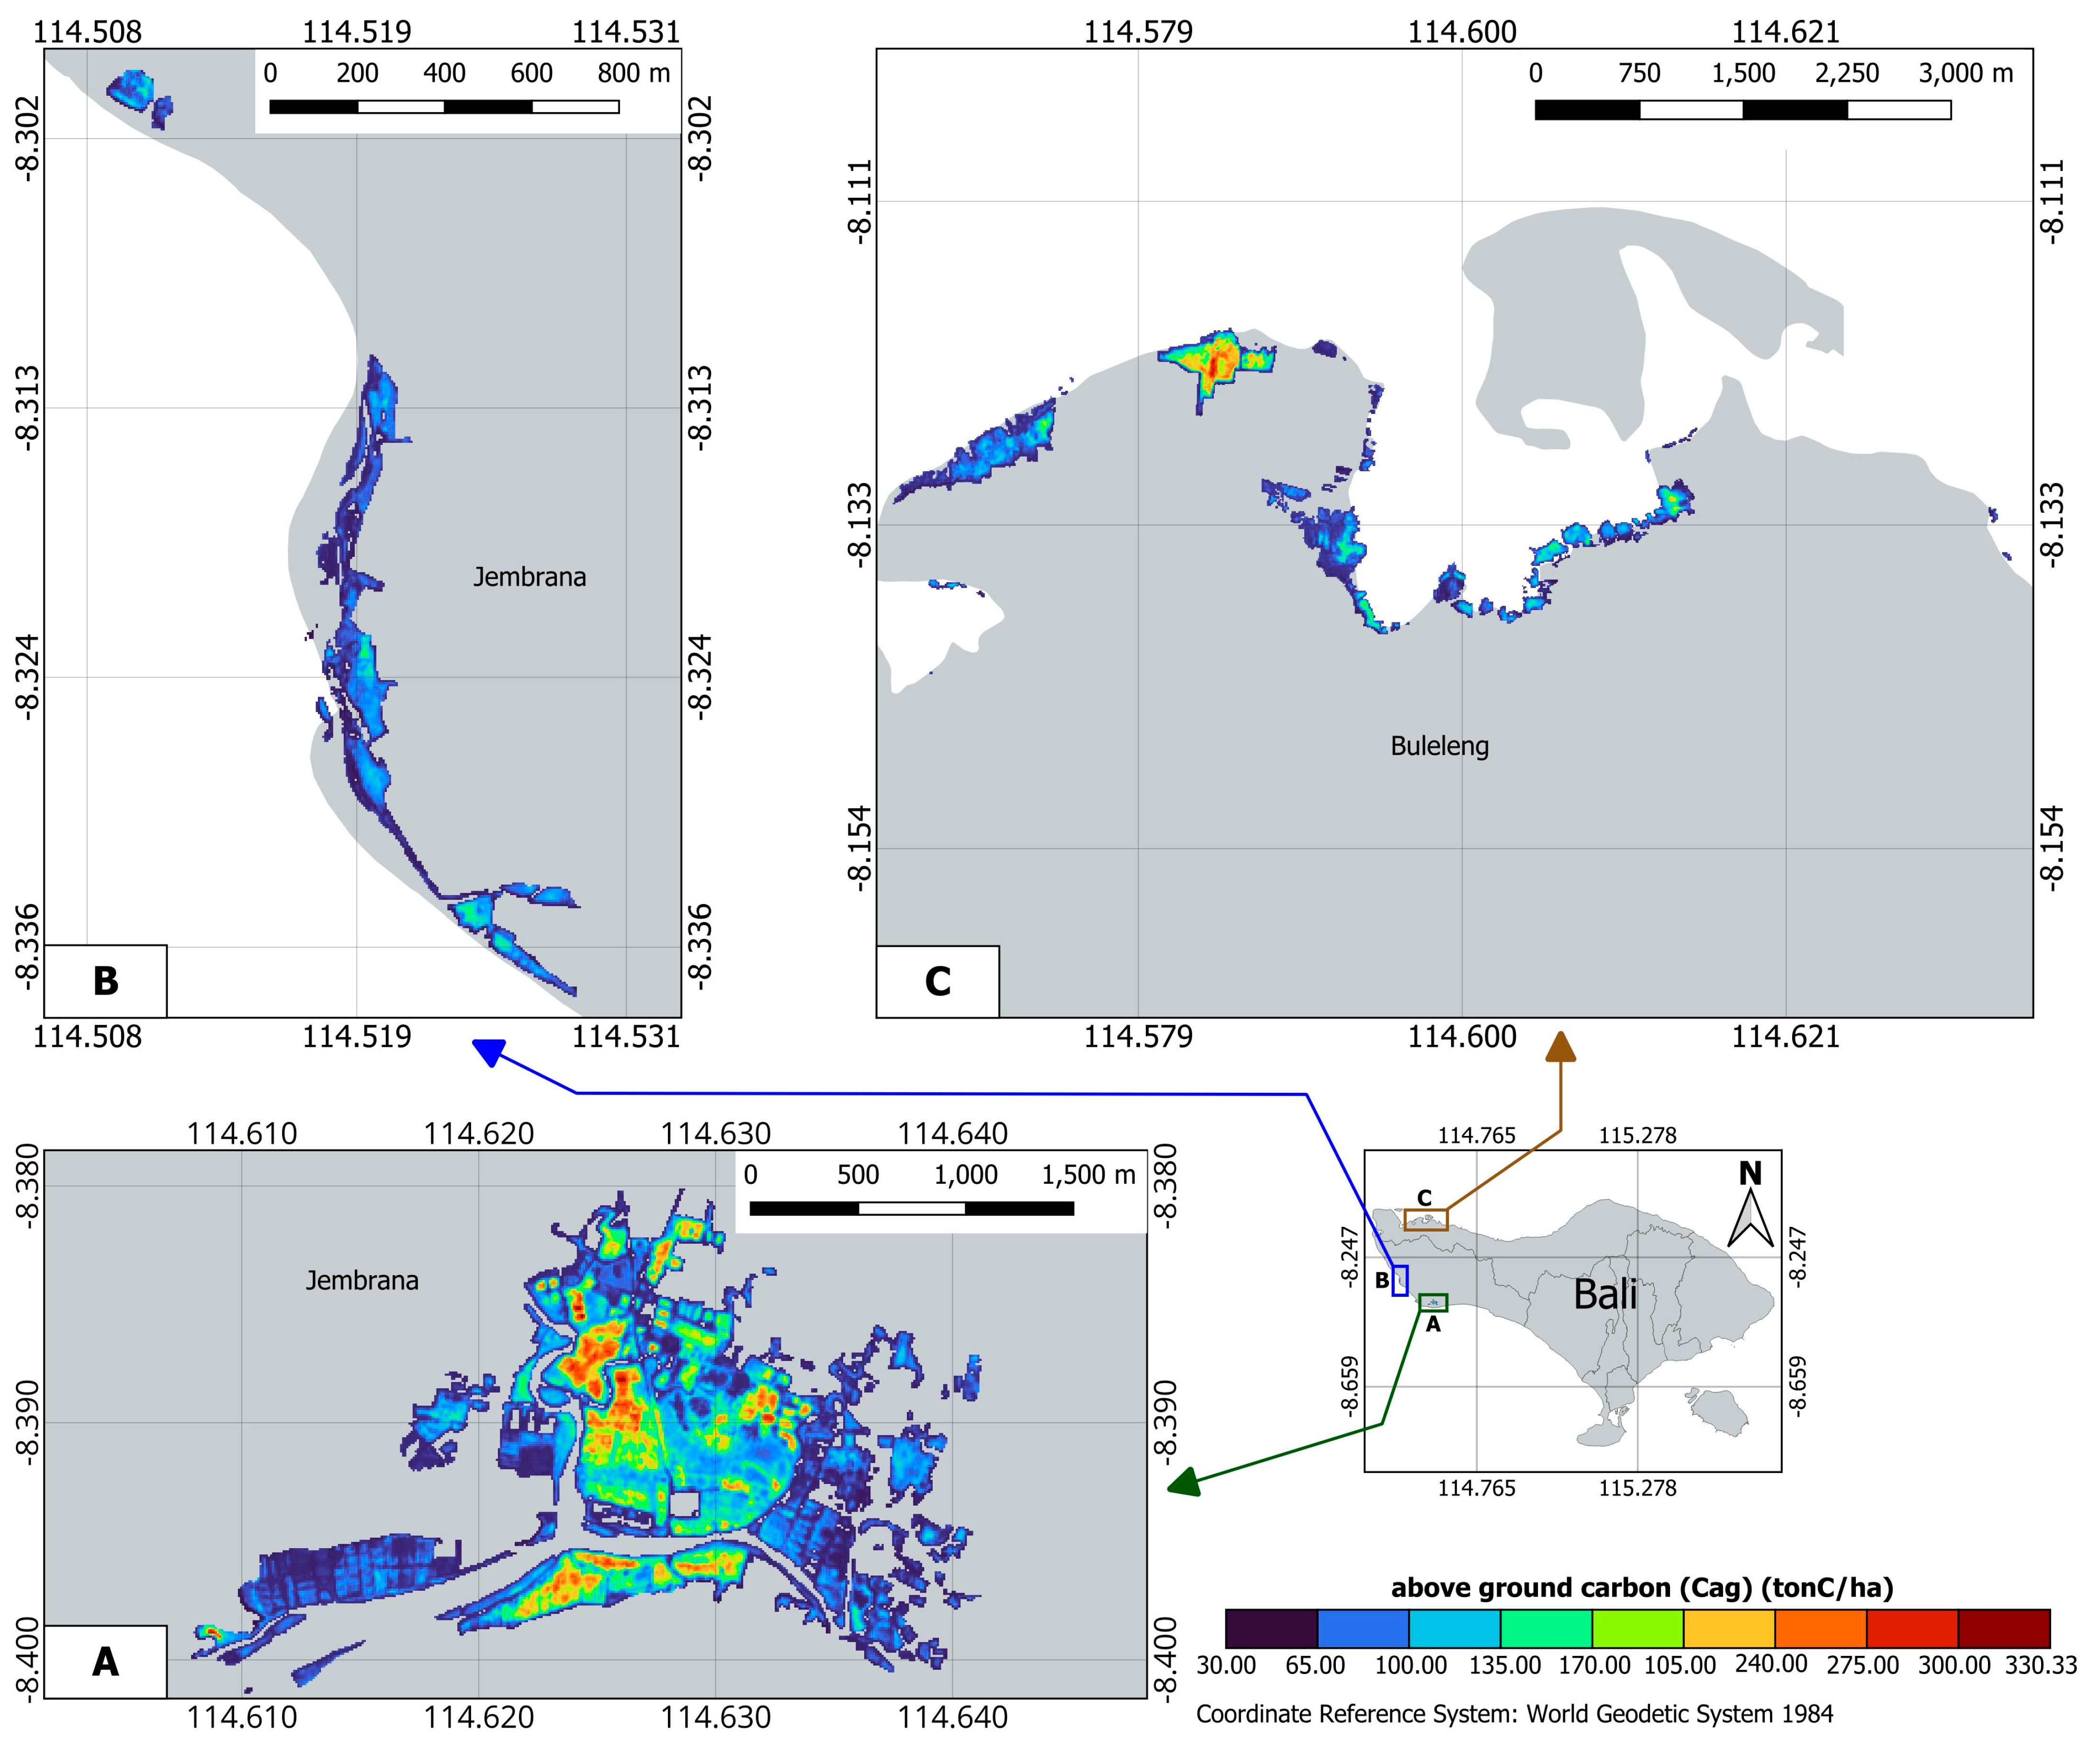
The calculation of the Cag storage potential in mangrove ecosystems using the TrIVCag model equation Equation (4) for the western part of Bali is presented in Table 4 and Figure 5. In 2023, the mangrove area in this region, excluding the West Bali National Park, covered 376.85 hectares, with an estimated total carbon storage of 34,994.55 tons of carbon (tonC). Region A exhibited the highest average above-ground carbon (Cag) at 98.97 tonC/ha, while Regions B and C had average values of 66.58 tonC/ha and 86.98 tonC/ha, respectively. The higher average Cag in Region A compared to Regions B and C may be attributed to differences in dominant species and tree diameters. For further details, please refer to Table 4 as well as Figure 5, which illustrates the spatial distribution of the Cag at the research site.
To improve the quality of the Cag estimation obtained in this study, an uncertainty analysis was performed by considering the variability in vegetation index measurements and the regression models used. This uncertainty analysis includes the assessment of estimation errors caused by various factors, such as remote sensing uncertainties, atmospheric conditions, and spectral variations between different images. We also conducted an accuracy analysis of the model’s calculations using a linear regression analysis and RMSE testing to assess the accuracy level and error value of the model’s results based on 15 predefined validation sample points. The correlation results indicate that the model has a relationship with field values of 0.852 or 85.2%, with an error value (RMSE) of 92.40 tonC/ha. The Cag estimation using this model effectively represents the field Cag conditions, as evidenced by the high correlation value and the excellent accuracy level of the model. By performing the uncertainty analysis, we can provide a clearer picture of the reliability of the developed estimation model and its contribution to improving the accuracy of future mangrove carbon stock monitoring.
The differences in the Cag distribution will undoubtedly be strongly influenced by differences in the mangrove density, dominant species, and tree diameter size. A higher density and a larger stem diameter tend to result in greater biomass and carbon reserves. The majority of carbon storage occurs in the stem, and the percentage of the carbon stock increases with biomass growth [52,53]. The relationship between the carbon stock and biomass content is proportional. The greater the biomass content, the larger the stored carbon stock [54]. Additionally, variations in dominant species also affected the Cag, which is related to the biomass of each species [55].

4. Conclusions

This study highlights a novel, multi-index regression-based approach to estimate above-ground carbon (Cag) in mangrove forests using Sentinel-2 imagery, addressing the urgent need for accurate, scalable, and accessible blue carbon assessment tools in tropical coastal ecosystems. Through a comprehensive evaluation of thirty-two vegetation indices, seven indices (MSR-Red, GCI, GRVI, CIRE, TRVI, SLAVI, and SR) demonstrated strong correlations with the field-measured Cag, with the SR index emerging as the most individually predictive (r = 0.847, R2 = 0.707). This study’s key innovation lies in developing the TrIVCag model, which combines the SR, SLAVI, and TRVI into a single multiple regression framework. This model achieved the best overall performance (r = 0.8695, R2 = 0.7279), accurately explaining 72.79% of the variation in the above-ground carbon. The model validation using 15 independent field plots confirmed its robustness, with a correlation of r = 0.852 and an RMSE of 92.40 tonC/ha. This study estimated that the mangrove area in western Bali, excluding the West Bali National Park, covered approximately 376.85 ha in 2023, with a total above-ground carbon stock of 34,994.55 tonC. Region A recorded the highest Cag value with an average of 98.97 tonC/ha (with a total amount of 24,332.38 tonC), followed by Regions B and C with 66.58 tonC/ha (with a total amount of 2390.82 tonC) and 86.98 tonC/ha (with a total amount of 8271.35 tonC), respectively.
The TrIVCag model represents a practical and statistically interpretable tool for estimating mangrove carbon stocks using only spectral information from freely available Sentinel-2 imagery. Its novelty lies in the strategic combination of spectral indices that capture both biochemical and structural vegetation properties, offering a more reliable estimation than single-index models typically used in prior studies. As such, this research contributes a replicable and adaptable framework for rapid carbon estimation in mangrove regions that lack high-resolution structural datasets or expensive field campaigns. Nevertheless, several limitations must be acknowledged. The relatively small sample size for model validation (15 plots) may affect the spatial representativeness of the results. Additionally, although Sentinel-2 offers high-resolution multispectral imagery, it lacks the vertical sensitivity needed to characterize key forest structure elements, such as the canopy height and sub-canopy biomass. The TrIVCag model may therefore underrepresent above-ground carbon in more structurally complex stands. Despite this, the model’s accuracy level remains within acceptable bounds and compares favorably to similar studies using global or regional data.
To build upon these findings, future research should aim to increase the quantity and spatial diversity of ground validation data, integrate 3D structural information from LiDAR or Sentinel-1 SAR to enhance vertical accuracy, and apply time-series analyses to account for seasonal dynamics. Incorporating machine learning approaches such as random forests or Gradient Boosting can further improve the predictive capacity and feature selection. Overall, this study provides a promising foundation for efficient mangrove carbon monitoring using remote sensing, with significant implications for coastal ecosystem management, climate change mitigation, and national greenhouse gas accounting initiatives.

Author Contributions

Conceptualization, A.R.A.-s. and I.G.A.N.; methodology, I.G.A.N. and A.R.A.-s.; software, I.G.A.N., I.P.S. and I.P.E.P.A.; validation, I.G.A.N., I.P.E.P.A., I.G.A.I.P.D. and A.A.E.A.; formal analysis, I.G.A.N., I.P.S., M.W.K., I.P.E.P.A., I.G.A.I.P.D. and A.A.E.A.; investigation, I.G.A.N., I.P.E.P.A., I.G.A.I.P.D. and A.A.E.A.; data curation, I.G.A.N., I.G.A.I.P.D. and A.A.E.A.; writing—original draft preparation, I.G.A.N., I.P.S., A.R.A.-s., M.D.S. and M.W.K.; writing—review and editing, A.R.A.-s., M.D.S. and I.G.A.N.; visualization, I.G.A.N.; supervision, A.R.A.-s. and M.D.S.; funding acquisition, A.R.A.-s. and M.D.S. All authors have read and agreed to the published version of the manuscript.

Funding

A.R.A.-s. received founding from the Program Penelitian Pascasarjana-Penelitian Tesis Magister (PPS-PPM) 2023 Kemendikbudristek, Indonesia, through research grant number B/603-1/UN14.4.A/PT.01.03/2023.

Institutional Review Board Statement

Not applicable.

Informed Consent Statement

Not applicable.

Data Availability Statement

The datasets used and analyzed during this study are available from the corresponding author on reasonable request.

Acknowledgments

The authors wish to thank the Center for Environmental Research (PPLH) at Udayana University for their support through the provision of facilities and valuable discussions, which greatly facilitated the application of our expertise in advancing this study. We are also grateful to the European Space Agency (ESA) for supplying and processing the Sentinel-2 data. Additionally, we acknowledge the Google Earth Engine (GEE) development team and community for their assistance through the online forum.

Conflicts of Interest

The authors declare no conflicts of interest.

References

  1. Donato, D.C.; Kauffman, J.B.; Murdiyarso, D.; Kurnianto, S.; Stidham, M.; Kanninen, M. Mangroves among the most carbon-rich forests in the tropics. Nat. Geosci. 2011, 4, 293–297. [Google Scholar] [CrossRef]
  2. de Lacerda, L.D.; Borges, R.; Ferreira, A.C. Neotropical mangroves: Conservation and sustainable use in a scenario of global climate change. Aquat. Conserv. Mar. Freshw. Ecosyst. 2019, 29, 1347–1364. [Google Scholar] [CrossRef]
  3. Dinilhuda, A.; Akbar, A.A.; Herawaty, H. Potentials of mangrove ecosystem as storage of carbon for global warming mitigation. Biodiversitas 2020, 21, 5353–5362. [Google Scholar] [CrossRef]
  4. Andiani, A.A.E.; Karang, I.W.G.A.; Putra, I.N.G.; Dharmawan, I.W.E. Hubungan antar parameter struktur tegakan mangrove dalam estimasi simpanan karbon aboveground pada skala komunitas. J. Ilmu Teknol. Kelaut. Trop. 2021, 13, 483–496. [Google Scholar] [CrossRef]
  5. Campbell, A.D.; Fatoyinbo, T.; Charles, S.P.; Bourgeau-Chavez, L.L.; Goes, J.; Gomes, H.; Lagomasino, D. A review of carbon monitoring in wet carbon systems using remote sensing. Environ. Res. Lett. 2022, 17, 025009. [Google Scholar] [CrossRef]
  6. As-syakur, A.R.; Aryunisha, P.E.P.; Wijana, I.M.S.; Novanda, I.G.A.; Dewi, I.G.A.I.P.; Andiani, A.A.E.; Sugiana, I.P. Comparison of mangrove canopy covering accuracy using Landsat 8 and Landsat 9 imagery based on several vegetation indices in West Bali National Park. In Proceedings of the E3S Web of Conferences, Denpasar-Bali, Indonesia, 6–7 June 2023; Volume 442, p. 03001. [Google Scholar]
  7. Komiyama, A.; Poungparn, S.; Kato, S. Common allometric equations for estimating the tree weight of mangroves. J. Trop. Ecol. 2005, 21, 471–477. [Google Scholar] [CrossRef]
  8. Pham, T.D.; Xia, J.; Ha, N.T.; Bui, D.T.; Le, N.N.; Takeuchi, W. A review of remote sensing approaches for monitoring blue carbon ecosystems: Mangroves, seagrasses and salt marshes during 2010–2018. Sensors 2019, 19, 1933. [Google Scholar] [CrossRef]
  9. Maurya, K.; Mahajan, S.; Chaube, N. Remote sensing techniques: Mapping and monitoring of mangrove ecosystem—A review. Complex Intell. Syst. 2021, 7, 2797–2818. [Google Scholar] [CrossRef]
  10. Wicaksono, P. Mangrove above-ground carbon stock mapping of multi-resolution passive remote-sensing systems. Int. J. Remote Sens. 2017, 38, 1551–1571. [Google Scholar] [CrossRef]
  11. Purnamasari, E.; Kamal, M.; Wicaksono, P. Comparison of vegetation indices for estimating above-ground mangrove carbon stocks using PlanetScope image. Reg. Stud. Mar. Sci. 2021, 44, 101730. [Google Scholar] [CrossRef]
  12. Kamal, M.; Hidayatullah, M.F.; Mahyatar, P.; Ridha, S.M. Estimation of aboveground mangrove carbon stocks from WorldView-2 imagery based on generic and species-specific allometric equations. Remote Sens. Appl. Soc. Environ. 2022, 26, 100748. [Google Scholar] [CrossRef]
  13. Phiri, D.; Simwanda, M.; Salekin, S.; Nyirenda, V.R.; Murayama, Y.; Ranagalage, M. Sentinel-2 data for land cover/use mapping: A review. Remote Sens. 2020, 12, 2291. [Google Scholar] [CrossRef]
  14. Tran, T.V.; Reef, R.; Zhu, X. A review of spectral indices for mangrove remote sensing. Remote Sens. 2022, 14, 4868. [Google Scholar] [CrossRef]
  15. Mngadi, M.; Odindi, J.; Mutanga, O. The utility of Sentinel-2 spectral data in quantifying above-ground carbon stock in an urban reforested landscape. Remote Sens. 2021, 13, 4281. [Google Scholar] [CrossRef]
  16. Du, J.; Zhang, Y.; Liang, Z.; Song, K. Enhancing precision in crop residue cover estimation: A comparative analysis of Sentinel-2 MSI and Landsat 8 OLI data. Preprints 2024. [Google Scholar] [CrossRef]
  17. Li, H.; Zhao, L.; Sun, L.; Li, X.; Wang, J.; Han, Y.; Chen, J. Capability of phenology-based Sentinel-2 composites for rubber plantation mapping in a large area with complex vegetation landscapes. Remote Sens. 2022, 14, 5338. [Google Scholar] [CrossRef]
  18. Binh, N.A.; Hauser, L.T.; Salinero-Delgado, M.; Hoa, P.V.; Thao, G.T.P.; Verrelst, J. Monitoring mangrove traits through optical Earth observation: Towards spatio-temporal scalability using cloud-based Sentinel-2 continuous time series. ISPRS J. Photogramm. Remote Sens. 2024, 214, 135–152. [Google Scholar] [CrossRef]
  19. Alongi, D.M. The impact of climate change on mangrove forests. Curr. Clim. Change Rep. 2015, 1, 30–39. [Google Scholar] [CrossRef]
  20. Kauffman, J.B.; Heider, C.; Norfolk, J.; Payton, F. Carbon stocks of intact mangroves and carbon emissions arising from their conversion in the Dominican Republic. Ecol. Appl. 2014, 24, 518–527. [Google Scholar] [CrossRef]
  21. Huxham, M.; Whitlock, D.; Githaiga, M.; Dencer-Brown, A. Carbon in the coastal seascape: How interactions between mangrove forests, seagrass meadows and tidal marshes influence carbon storage. Curr. For. Rep. 2018, 4, 101–110. [Google Scholar] [CrossRef]
  22. Lovelock, C.E.; Ruess, R.W.; Feller, I.C. CO2 efflux from cleared mangrove peat. PLoS ONE 2011, 6, e21279. [Google Scholar] [CrossRef]
  23. Simard, M.; Fatoyinbo, L.; Smetanka, C.; Rivera-Monroy, V.H.; Castañeda-Moya, E.; Thomas, N.; Van der Stocken, T. Mangrove canopy height globally related to precipitation, temperature and cyclone frequency. Nat. Geosci. 2019, 12, 40–45. [Google Scholar] [CrossRef]
  24. Kristensen, E.; Bouillon, S.; Dittmar, T.; Marchand, C. Organic carbon dynamics in mangrove ecosystems: A review. Aquat. Bot. 2008, 89, 201–219. [Google Scholar] [CrossRef]
  25. Bordoloi, R.; Das, B.; Tripathi, O.P.; Sahoo, U.K.; Nath, A.J.; Deb, S.; Tajo, L. Satellite based integrated approaches to modelling spatial carbon stock and carbon sequestration potential of different land uses of Northeast India. Environ. Sustain. Indic. 2022, 13, 100166. [Google Scholar] [CrossRef]
  26. Twilley, R.R.; Rovai, A.S.; Riul, P. Coastal morphology explains global blue carbon distributions. Front. Ecol. Environ. 2018, 16, 503–508. [Google Scholar] [CrossRef]
  27. Kuhn, M.; Johnson, K. Applied Predictive Modeling; Springer: New York, NY, USA, 2013. [Google Scholar]
  28. Gebremedhin, A.; Badenhorst, P.; Wang, J.; Giri, K.; Spangenberg, G.; Smith, K. Development and validation of a model to combine NDVI and plant height for high-throughput phenotyping of herbage yield in a perennial ryegrass breeding program. Remote Sens. 2019, 11, 2494. [Google Scholar] [CrossRef]
  29. Muhsoni, F.F.; Sambah, A.B.; Mahmudi, M.; Wiadnya, D.G.R. Comparison of different vegetation indices for assessing mangrove density using Sentinel-2 imagery. GEOMATE J. 2018, 14, 42–51. [Google Scholar]
  30. Huete, A.; Didan, K.; Miura, T.; Rodriguez, E.P.; Gao, X.; Ferreira, L.G. Overview of the radiometric and biophysical performance of the MODIS vegetation indices. Remote Sens. Environ. 2002, 83, 195–213. [Google Scholar] [CrossRef]
  31. Lymburner, L.; Beggs, P.J.; Jacobson, C.R. Estimation of canopy-average surface-specific leaf area using Landsat TM data. Photogramm. Eng. Remote Sens. 2000, 66, 183–192. [Google Scholar]
  32. Gitelson, A.A.; Keydan, G.P.; Merzlyak, M.N. Three-band model for noninvasive estimation of chlorophyll, carotenoids, and anthocyanin contents in higher plant leaves. Geophys. Res. Lett. 2006, 33, L11402. [Google Scholar] [CrossRef]
  33. Rahman, Y.; Wardiatno, Y.; Yulianda, F.; Rusmana, I. Socio-ecological system of carbon-based mangrove ecosystem on the coast of West Muna Regency, Southeast Sulawesi-Indonesia. Aquac. Aquar. Conserv. Legis. 2020, 13, 518–528. [Google Scholar]
  34. Kern, A.; Barcza, Z.; Marjanović, H.; Árendás, T.; Fodor, N.; Bónis, P.; Bognár, P.; Lichtenberger, J. Statistical modelling of crop yield in Central Europe using climate data and remote sensing vegetation indices. Agric. For. Meteorol. 2018, 260, 300–320. [Google Scholar] [CrossRef]
  35. Filho, M.G.; Kuplich, T.M.; Quadros, F.L.D. Estimating natural grassland biomass by vegetation indices using Sentinel 2 remote sensing data. Int. J. Remote Sens. 2020, 41, 2861–2876. [Google Scholar] [CrossRef]
  36. Anscombe, F.J. Graphs in statistical analysis. Am. Stat. 1973, 27, 17–21. [Google Scholar] [CrossRef]
  37. Lembang, R.K.; Huliselan, S.; Adji, F. Pendugaan biomassa dan karbon tersimpan mangrove Rhizophora apiculata dan Sonneratia alba di Desa Simau. J. Hutan Pulau-Pulau Kecil 2019, 3, 68–72. [Google Scholar] [CrossRef]
  38. Ramadhan, A.; Suwadji, S. Model penduga biomassa hutan mangrove menggunakan citra satelit Sentinel-2A di Kabupaten Rembang Jawa Tengah. J. Wana Trop. 2023, 13, 72–84. [Google Scholar] [CrossRef]
  39. Jiang, Q.; Tang, Z.; Zhou, L.; Hu, G.; Deng, G.; Xu, M.; Sang, G. Mapping paddy rice planting area in Dongting Lake area combining time series Sentinel-1 and Sentinel-2 images. Remote Sens. 2023, 15, 2794. [Google Scholar] [CrossRef]
  40. Xing, N.; Huang, W.; Xie, Q.; Shi, Y.; Ye, H.; Dong, Y.; Wu, M.; Sun, G.; Jiao, Q. A transformed triangular vegetation index for estimating winter wheat leaf area index. Remote Sens. 2019, 12, 16. [Google Scholar] [CrossRef]
  41. Morcillo-Pallarés, P.; Rivera-Caicedo, J.P.; Belda, S.; De Grave, C.; Burriel, H.; Moreno, J.; Verrelst, J. Quantifying the robustness of vegetation indices through global sensitivity analysis of homogeneous and forest leaf-canopy radiative transfer models. Remote Sens. 2019, 11, 2418. [Google Scholar] [CrossRef]
  42. Barati, S.; Rayegani, B.; Saati, M.; Sharifi, A.; Nasri, M. Comparison the accuracies of different spectral indices for estimation of vegetation cover fraction in sparse vegetated areas. Egypt. J. Remote Sens. Space Sci. 2011, 14, 49–56. [Google Scholar] [CrossRef]
  43. Suardana, A.M.A.P.; Anggraini, N.; Nandika, M.R.; Aziz, K.; As-Syakur, A.R.; Ulfa, A.; Wijaya, A.D.; Prasetio, W.; Winarso, G.; Dewanti, R. Estimation and mapping above-ground mangrove carbon stock using sentinel-2 data derived vegetation indices in Benoa Bay of Bali Province, Indonesia. For. Soc. 2023, 7, 116–134. [Google Scholar] [CrossRef]
  44. Hidayati, I.N.; Suharyadi, R.; Danoedoro, P. Exploring spectral index band and vegetation indices for estimating vegetation area. Indones. J. Geogr. 2018, 50, 211–221. [Google Scholar] [CrossRef]
  45. Roustaei, N. Application and interpretation of linear-regression analysis. Med. Hypothesis Discov. Innov. Ophthalmol. 2024, 13, 151. [Google Scholar] [CrossRef]
  46. Ziglari, L. Statistical approaches to interpret multiple regression results. Methods Psychol. 2024, 10, 100136. [Google Scholar] [CrossRef]
  47. James, G.; Witten, D.; Hastie, T.; Tibshirani, R.; Taylor, J. Linear regression. In An Introduction to Statistical Learning: With Applications in Python; Springer International Publishing: Cham, Switzerland, 2023; pp. 69–134. [Google Scholar]
  48. Karang, I.W.G.A.; Nuarsa, I.W.; Hendrawan, I.G.; Dewi, N.M.N.B.S.; Yasa, P.K.; Krisnanda, I.M.D. Satellite remote sensing techniques for mapping and estimating mangrove carbon stocks in the small island of Gili Meno, West Nusa Tenggara, Indonesia. Biodiversitas J. Biol. Divers. 2024, 25, 3189–3200. [Google Scholar] [CrossRef]
  49. Meng, Y.; Bai, J.; Gou, R.; Cui, X.; Feng, J.; Dai, Z.; Diao, X.; Zhu, X.; Lin, G. Relationships between above-and below-ground carbon stocks in mangrove forests facilitate better estimation of total mangrove blue carbon. Carbon Balance Manag. 2021, 16, 8. [Google Scholar] [CrossRef]
  50. Barreñada, L.; Dhiman, P.; Timmerman, D.; Boulesteix, A.L.; Van Calster, B. Understanding overfitting in random forest for probability estimation: A visualization and simulation study. Diagn. Progn. Res. 2024, 8, 14. [Google Scholar] [CrossRef]
  51. Salman, H.A.; Kalakech, A.; Steiti, A. Random forest algorithm overview. Babylon. J. Mach. Learn. 2024, 2024, 69–79. [Google Scholar] [CrossRef] [PubMed]
  52. Merilä, P.; Lindroos, A.J.; Helmisaari, H.S.; Hilli, S.; Nieminen, T.M.; Nöjd, P.; Ukonmaanaho, L. Carbon stocks and transfers in coniferous boreal forests along a latitudinal gradient. Ecosystems 2024, 27, 151–167. [Google Scholar] [CrossRef]
  53. Gebeyehu, G.; Soromessa, T.; Bekele, T.; Teketay, D. Carbon stocks and factors affecting their storage in dry Afromontane forests of Awi Zone, northwestern Ethiopia. J. Ecol. Environ. 2019, 43, 7. [Google Scholar] [CrossRef]
  54. Oktaviona, S.; Amin, B.; Ghalib, M. Carbon stock assessment on mangrove forest ecosystem in Jorong Ujuang Labuang District, Agam, West Sumatera Province. JOM Perikan. Ilmu Kelaut. 2017, 4, 1–12. [Google Scholar]
  55. Manafe, G.; Kaho, M.R.; Risamasu, F.; Adisucipto, J. Estimasi biomassa permukaan dan stok karbon pada tegakan pohon Avicennia marina dan Rhizophora mucronata di perairan pesisir Oebelo Kabupaten Kupang. J. Bumi Lestari 2016, 16, 163–173. [Google Scholar] [CrossRef]
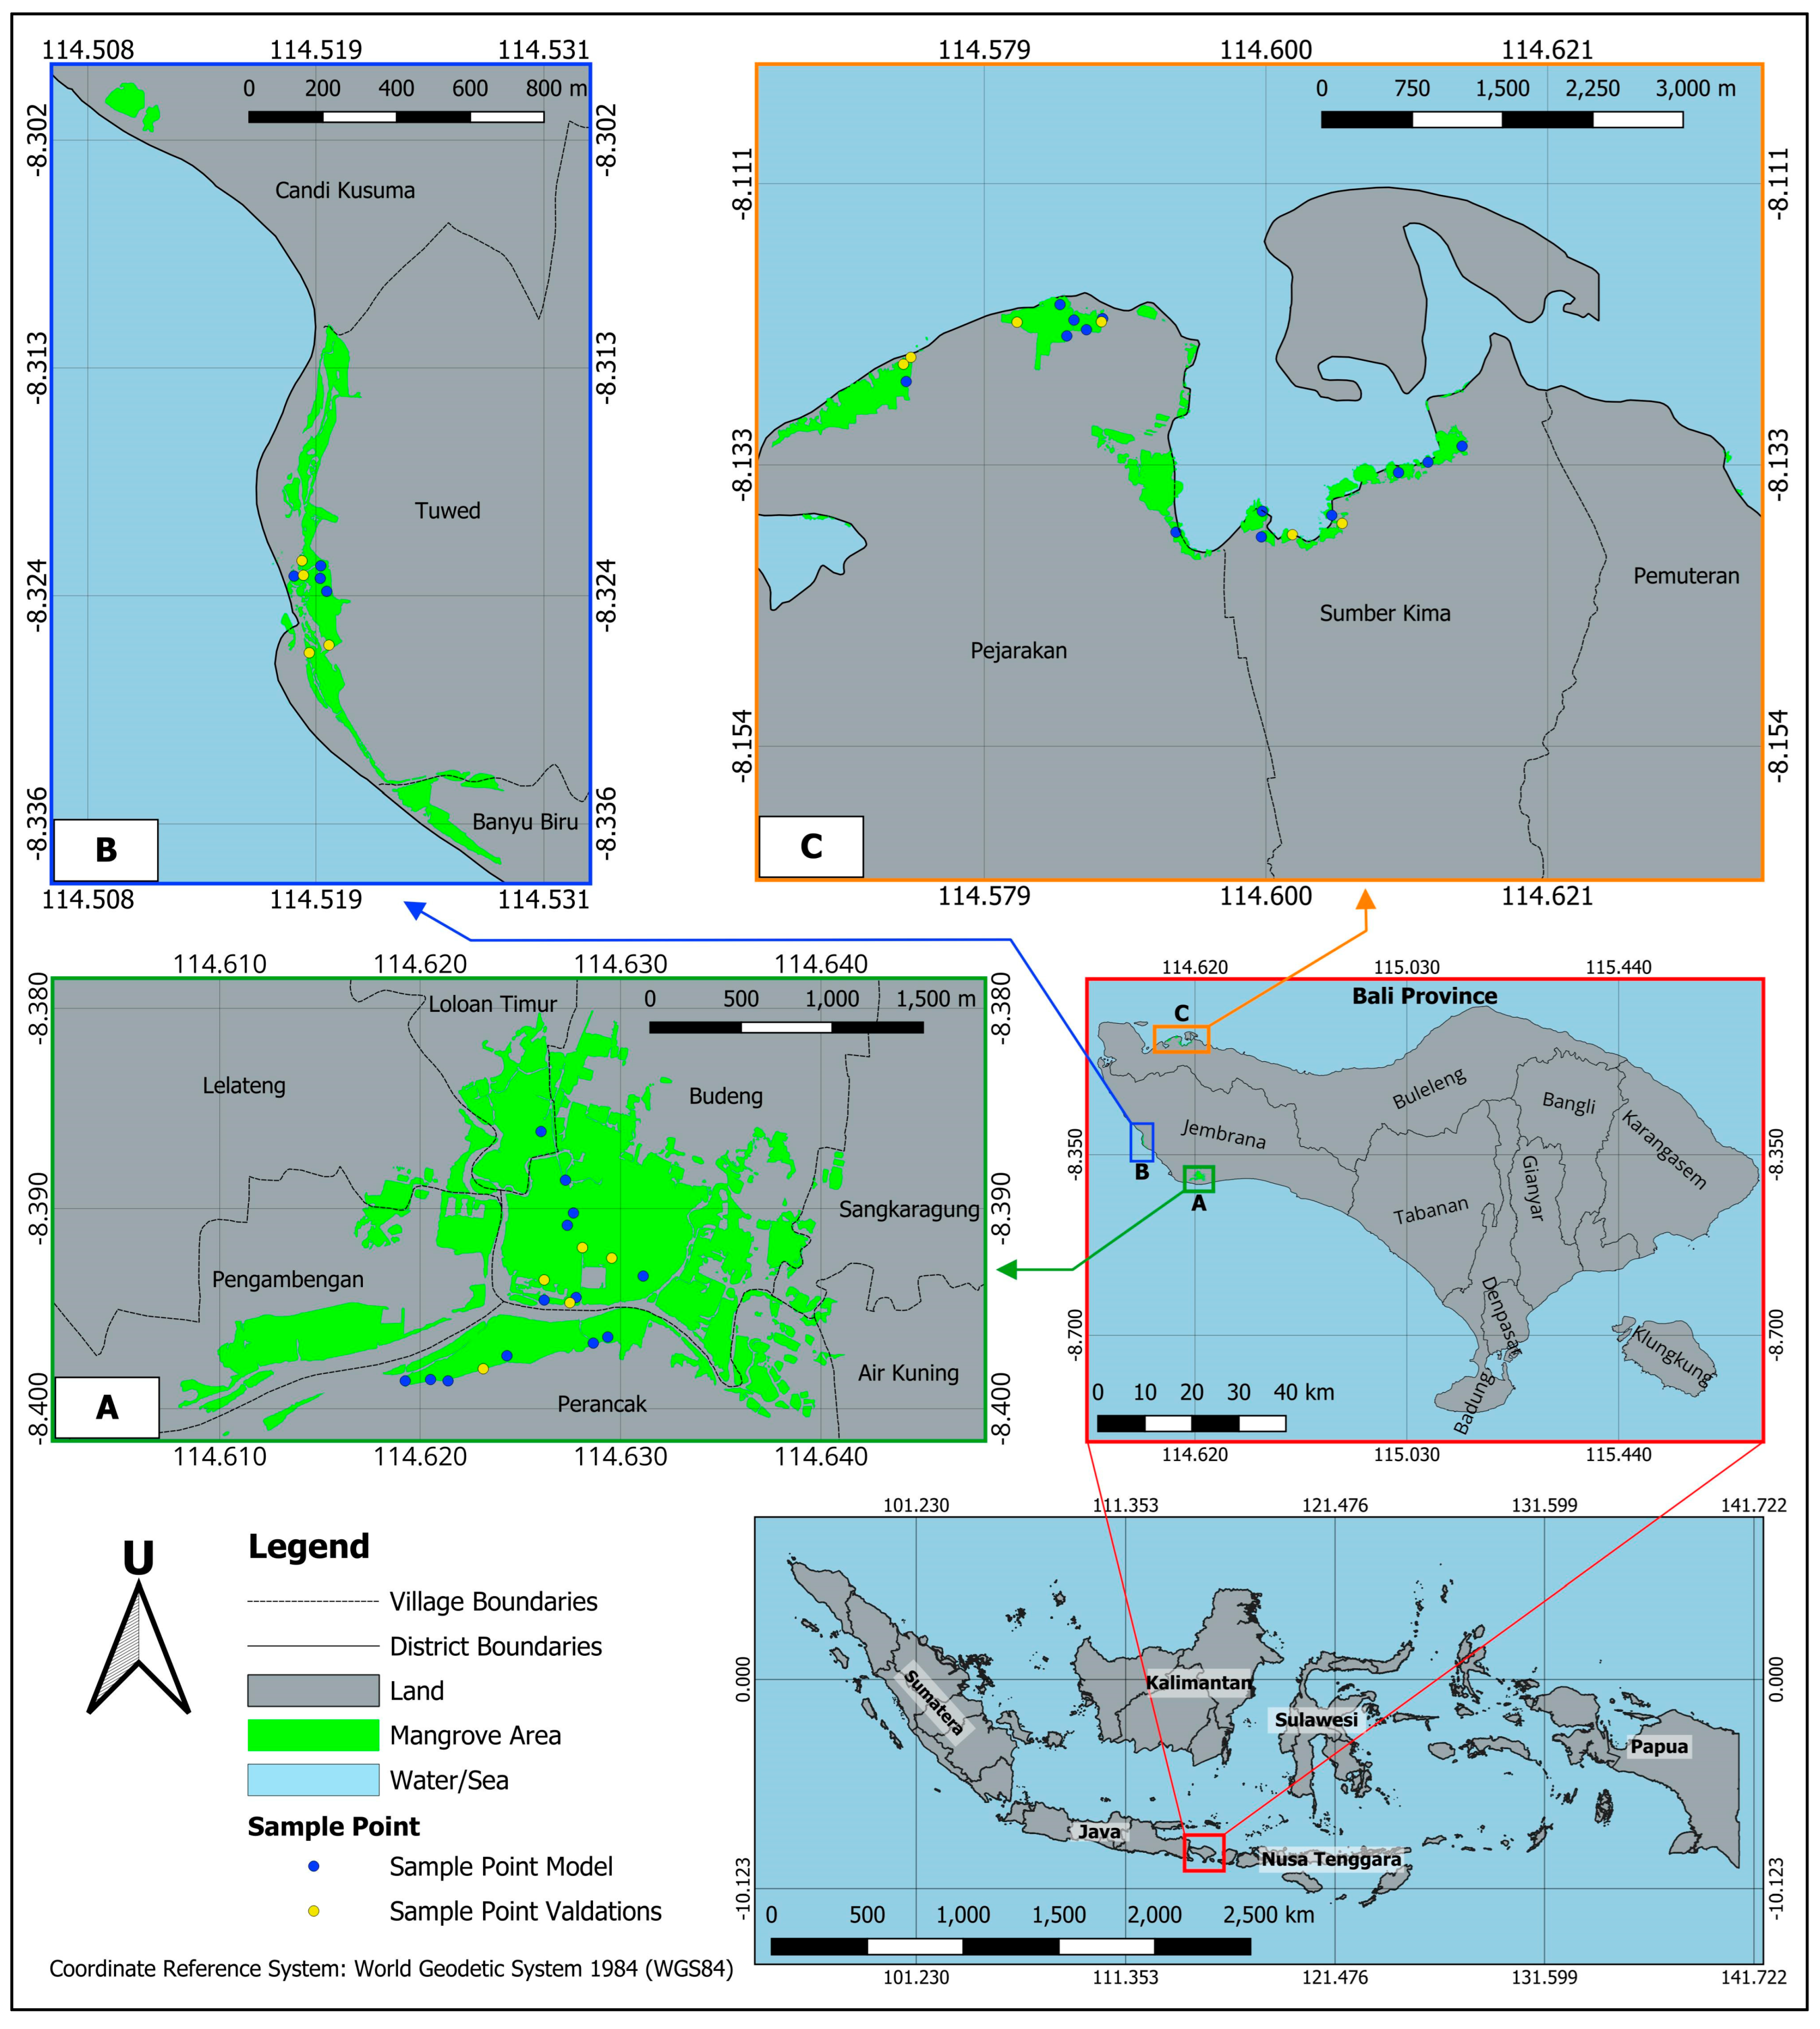
Figure 1. Research locations, highlighting the sampling locations used for model construction (indicated by blue dots) and validation (indicated by yellow dots) in the research area (green mangrove areas) located in (A) (Perancak, Pengambengan, East Loloan, and Budeng Villages); (B) (Banyu Biru, Tuwed, and Candikesuma Villages); and (C) (Pejarakan and Sumberkima Villages).
Coasts 05 00033 g001
Figure 2. Research flow for estimating the best model for Cag.
Coasts 05 00033 g002
Figure 3. Distribution of Cag (tonC/ha) against each vegetation index.
Coasts 05 00033 g003
Figure 4. Comparison of the distribution of field-observed and estimated Cag values (tonC/ha) using the TrIVCag equation.
Coasts 05 00033 g004
Figure 5. Spatial distribution of above-ground carbon (Cag) (tonC/ha) in (A) (Villages of Perancak, Pengambengan, Loloan Timur, and Budeng); (B) (Villages of Banyu Biru, Tuwed, and Candikesuma); and (C) (Villages of Pejarakan and Sumberkima).
Coasts 05 00033 g005
Table 1. Spatial resolution of each band used for the calculation of thirty-two vegetation indices.
No.Name BandDescriptionSpatial Resolution
1B2Blue10 m
2B3Green10 m
3B4Red10 m
4B5RedEdge120 m
5B6RedEdge220 m
6B8Nir10 m
7B12Swir220 m
Table 2. Vegetation index used in this study.
Vegetation IndicesFormula
NDVI (Normalized Difference Vegetation Index)(NIR − Red)/(NIR + Red)
EVI (Enhanced Vegetation Index)2.5 × ((NIR − Red)/(NIR + (6 × Red) − (7.5 × Blue) + 1))
SAVI (Soil-Adjusted Vegetation Index)((NIR − Red)/(NIR + Red + 0.5)) × (1 + 0.5)
ARVI (Atmospherically Resistant Vegetation Index)(NIR − (2 × Red) + Blue)/(NIR + (2 × Red) + Blue)
VARI (Visible Atmospherically Resistant Index)(Green − Red)/(Green + Red − Blue)
GCI (Green Chlorophyll Index)(NIR/Green) − 1
OSAVI (Optimized Soil-Adjusted Vegetation Index)(NIR − Red)/(NIR + Red + 0.16)
NNIR (Normalized Near Infrared)NIR/(NIR + Red + Green)
CVI (Chlorophyll Vegetation Index)(NIR × Red)/(Green2)
SIPI (Structure Insensitive Pigment Index)(NIR − Blue)/(NIR − Red)
GRVI (Green Ratio Vegetation Index)(NIR/Green)
GNDVI (Green Normalized Vegetation Index)(NIR − Green)/(NIR + Green)
TRVI (Transformed Ratio Vegetation Index)(NIR/Red)1/2
SR (Simple Ratio Index)NIR/Red
MSR Green (Modified Green
Simple Ratio)
((NIR/Green) − 1)/((NIR/Green) + 1)1/2
MSR Red (Modified Red Simple
Ratio)
((NIR/Red) − 1)/((NIR/Red) + 1)1/2
NDREI (Normalized Difference Red-Edge Index)(NIR − RedEdge1)/(NIR + RedEdge1)
GLI (Green Leaf Index)((2 × Green) − Blue − Red)/((2 × Green) + Blue + Red)
MCARI (Modified Chlorophyll Absorption Ratio Index)((RedEdge1 − Red) − 0.2) × (RedEdge1 − Green) × (RedEdge1/Red)
NDYI (Normalized Difference Yellowness Index)(Green − Blue)/(Green + Blue)
RENDVI (Red Edge Normalized Difference Vegetation Index)(RedEdge2 − RedEdge1)/(RedEdge2 + RedEdge1)
CIRE (Chlorophyll Index Red Edge)(NIR/RedEdge1) − 1
TriVI (Triangular Vegetation Index)0.5 × (120 × (NIR − Green)) − 200 × (Red − Green)
CCI (Chlorophyll Carotenoid Index)(Green − Red)/(Green + Red)
RDVI (Renormalized Difference Vegetation Index)(NIR − Red)/((NIR + Red)0.5)
DVI (Difference Vegetation Index)NIR − Red
IPVI (Infrared Percentage Vegetation Index)NIR/(NIR + Red)
TGI (Triangular Greenness Index)−0.5 × (190 × (Red − Green) − 120 × (Green − Blue))
mRE-SR (Modified Red Edge-Simple Ratio)((NIR/RedEdge1)−1)/((NIR/RedEdge1) + 1)1/2
MTCI (MERIS Terrestrial Chlorophyll Index)(RedEdge2 − RedEdge1)/(RedEdge1 − Red)
SLAVI (Specific Leaf Area Vegetation Index)NIR/(Red + SWIR2)
AFRI2100 (Aerosol Free Vegetation Index (2100 nm))(NIR − (0.5) × SWIR2)/(NIR + (0.5) × SWIR2)
Table 3. Regression model and accuracy level among vegetation indices with carbon storage on the surface in the western part of the mangrove area in Bali.
Vegetation IndicesLinear Regression Equation (r) (Where y = Cag Count, x = Vegetation Index Value)Correlation Coefficient (r)Coefficient of Determination (R2)Significant Level
SIPIY = 656.64 − 553.71 X−0.3850.118ns
TGIY = 16.12 + 28.27 X0.3210.071ns
MCARIY = 44.13 + 368.80 X0.3390.083ns
CVIY = −36.65 + 37.77 X0.4000.130*
NDYIY = −85.34 + 682.35 X0.5560.285**
MTCIY = −5.07 + 39.09 X0.5810.314**
IPVIY = −598.74 + 772.84 X0.6300.375**
NDVIY = −212.32 + 386.42 X0.6300.375**
VARIY = −0.419 + 246.56 X0.6410.390**
AFRI2100Y = −344.57 + 524.48 X0.6430.393**
GLIY = −40.71 + 532.74 X0.6460.397**
CCIY = −1.42 + 390.45 X0.6560.410**
ARVIY = −118.16 + 320.06 X0.6790.442**
RENDVIY = −84.21 + 409.33 X0.6870.453**
NNIRY = −416.94 + 660.02 X0.7020.474**
GNDVIY = −291.99 + 555.69 X0.7050.480**
TriVIY = −90.70 + 11.10 X0.7070.482**
OSAVIY = −190.49 + 552.38 X0.7090.485**
RDVIY = −171.17 + 612.25 X0.7290.514**
EVIY = −128.47 + 465.91 X0.7300.516**
SAVIY = −154.30 + 559.40 X0.7340.522**
DVIY = −107.30 + 848.068 X0.7440.537**
NDREIY = −147.15 + 458.55 X0.7450.539**
MSR GreenY = −126.25 + 119.97 X0.7880.607**
mRE-SRY = −74.16 + 150.64 X0.7940.617**
MSR RedY = −67.98 + 60.29 X0.8090.641**
GCIY = −57.17 + 30.81 X0.8140.651**
GRVIY = −87.98 + 30.81 X0.8140.651**
CIREY = −32.80 + 53.014 X0.8170.655**
TRVIY = −124.13 + 69.18 X0.8170.656**
SLAVIY = −15.08 + 26.75 X0.8320.682**
SRY = −20.46 + 10.99 X0.8470.707**
ns: non-significance; *: 0.05 significance level; and **: 0.01 significance level.
Table 4. Estimation of above-ground carbon (Cag).
RegionMangrove Area (ha)Estimation of Above-Ground Carbon (Cag) (tonC)
A245.8524,332.38
B35.912390.82
C95.098271.35
Total376.8534,994.55
Disclaimer/Publisher’s Note: The statements, opinions and data contained in all publications are solely those of the individual author(s) and contributor(s) and not of MDPI and/or the editor(s). MDPI and/or the editor(s) disclaim responsibility for any injury to people or property resulting from any ideas, methods, instructions or products referred to in the content.