Article

Measurement and Modelling of Beach Response to Storm Waves: A Case Study of Brandon Bay, Ireland

1
Oceanography, Faculty of Earth Science and Technology, Bandung Institute of Technology, Bandung 40132, Indonesia
2
Centre for Coastal and Marine Development, Bandung Institute of Technology, Bandung 40132, Indonesia
3
Discipline of Geography, College of Arts, Social Sciences, and Celtic Studies, University of Galway, H91 TK33 Galway, Ireland
4
Ryan Institute for Environmental, Marine and Energy Research, University of Galway, H91 TK33 Galway, Ireland
5
Civil Engineering, University College Cork (UCC), T12 K8AF Cork, Ireland
6
Research Ireland MaREI Centre for Energy, Climate and Marine Research, University of Galway, H91 TK33 Galway, Ireland
7
Civil Engineering, College of Science & Engineering, University of Galway, H91 TK33 Galway, Ireland
*
Author to whom correspondence should be addressed.
Coasts 2025, 5(3), 32; https://doi.org/10.3390/coasts5030032
Submission received: 8 June 2025 / Revised: 9 August 2025 / Accepted: 1 September 2025 / Published: 3 September 2025

Abstract

This study analyses the impacts of winter storms on beach response, as well as the subsequent recovery during spring and summer, at a dissipative sandy beach in Brandon Bay, Ireland. Shoreline dynamics were assessed through the integration of field data from five survey campaigns conducted between October 2021 and November 2022 with a 1D Xbeach (version 1.23) numerical model. Cross-sectional profiles were measured at seven locations, revealing pronounced erosion during winter, followed by recovery in calmer seasons, especially in the lower beach zone. The model effectively simulated short-term storm-induced morphological changes, demonstrating that rates of shoreline retreat and profile alteration are higher in the eastern bay, where wave energy is greater. Most morphological changes occurred between the low and high astronomical tide marks, characterized by upper beach erosion and lower beach accretion. Models were subsequently employed to examine future climate scenarios, including sea level rise and increased storm intensity. The projections indicated an exponential increase in erosion rates, correlated with higher storm wave heights and frequencies. These results highlight the dynamic response of dissipative beaches to extreme events and reinforce the necessity for adaptive coastal management strategies to address the escalating risks posed by climate change.

1. Introduction

Many coasts depend on sandy beach-dune systems for natural protection. Dunes act as barriers against flooding from storms [1]. Winter storms significantly contribute to beach and dune erosion, posing a substantial safety concern. Shoreline erosion may also be exacerbated by climate change through increasing frequency of storms and rising sea levels [2,3,4,5]. Storms generate large waves and surges that can damage dunes. The extent of this damage is influenced by the storm’s duration, direction, and intensity [1]. Higher water levels from tides and surges can allow waves to reach dunes, leading to erosion and flooding. When dunes are inundated, the land behind them becomes more vulnerable to floods, increasing risk to the local community and infrastructure [3]. Although storms can damage beaches, they are capable of naturally recovering over time as sediment moves back onshore during the calmer seasons, typically in spring and summer [2]. While recovery generally takes longer than erosion, it can occasionally occur swiftly [6]. However, the vulnerability of a beach is determined not only by the severity of erosion but also by the speed of its recovery [6], where the natural capability to recover can lessen the impact of future storms [1]. Without recovery, the initial storm leaves the beach more susceptible to subsequent ones due to the flattening of the shores [1]. A series of frequent storms or storm clusters can lead to greater erosion than a single intense storm [1]. Therefore, the impact of storms on the beach is influenced by recovery time, storm frequency, and storm characteristics.
Beaches are commonly classified based on their ability to transform wave energy in the surfzone [7]. Reflective beaches reflect wave energy, dissipative beaches absorb and dissipate it, and intermediate beaches exhibit characteristics of both. Dissipative beaches are typically wide, gently sloping and sandy, and exposed to high wave energy environments [7,8]. These systems exhibit significant morphological changes during storm events, including offshore sediment transport, bar formation, and beachface erosion, driven by intense wave forcing and undertow [9]. Individual storms often result in rapid profile lowering, upper foreshore and dune toe erosion, and sandbar development [10,11]. Recovery typically occurs during post-storm calm periods, when wave conditions favour onshore sediment transport and bar migration landward [12]. On longer timescales, these beaches exhibit seasonal cycles, with winter erosion followed by summer accretion and profile recovery [8,9,13,14]. However, repeated storm impacts or sediment deficits may prevent full recovery, leading to long-term shoreline retreat under changing climatic conditions [15,16].
In recent years, beach and dune erosion due to storm phenomena has been studied extensively using numerical modelling and statistical analysis [2,17,18,19]. Coastal morphology models such as XBeach have been used to simulate beach and dune erosion due to storm waves [2,20,21,22]. While 2D models simulate cross-shore and along-shore sediment transport together, 1D models simulate one or the other. Two-dimensional models may be more realistic, but they can be costly, time-consuming, and complex as they require many datasets that can be difficult to obtain and parameterisation introduces additional sources of error that can adversely affect model accuracy. Despite their process limitations, 1D models offer benefits such as simplicity and lower computational cost. They can achieve good accuracy when calibrated [21] and require significantly reduced bathymetry due to their 1D nature [23]. This study uses a 1D XBeach model [10] to simulate storm impact on coastal morphodynamics in Brandon Bay, a semi-enclosed bay on the southwest coast of Ireland.
In 1D mode, XBeach can simulate the impact of storm waves on beach cross-section profiles. It has been successfully applied to simulate beach and dune response to storm waves on sandy beaches [2,3,13,14]. It has been shown to accurately simulate the setup and swash zone process with correct parameterisation [23] and includes specific swash zone processes through both long and short waves [24]. It uses an avalanching mechanism to predict dune collapse events due to undercutting with different rates depending on the sand’s characteristics [3]. Sensitivity analyses in the literature have studied parameterisation of various XBeach input coefficients (e.g., ‘facua’ which adjusts the contribution of wave asymmetry and skewness in driving time-averaged flows and ‘wetslope’ which governs submerged slope stability in the swash zone) [25], the mathematical description or inclusion/exclusion of governing processes (e.g., ‘form’ which specifies the type of equilibrium sediment concentration formulation and ‘gwf’ which includes/excludes groundwater flow) [25], the prescription of beach properties such as the D50 of the littoral material [25] and the prescription of the forcing wave and tide data [26,27].
This study investigates the beach morphodynamics and climate resilience of Brandon Bay, Ireland. It explores the impact of winter storm events on the erosion of the beach and dune system, as well as the timing and location of natural recovery, assessing whether the recovery rates are sufficient to maintain the profiles. The impact of varying wave energy levels within the bay on the morphological changes of the beach and shoreline is also examined. It provides a comparative analysis of the more dynamic eastern side with the western side. The research identifies which vertical sections of the beach, particularly between the low and high tide lines, are most affected by erosion and deposition. The 1D XBeach model is evaluated to assess its efficacy in predicting short-term morphological changes induced by storm events and its alignment with empirical survey data; this includes an assessment of model sensitivity to the accuracy of the prescribed wave forcing data and sediment characteristics. The model was also used to investigate the potential impacts of future scenarios, such as rising sea levels and the increased intensity and frequency of storms, on erosion trends.

2. Description of Study Area

Brandon Bay (Figure 1) is located on the west coast of Ireland and is directly exposed to energetic waves, swells and storms from the Atlantic Ocean. It is a semi-independent headland-embayment compartment with a 12 km stretch of sandy beach, rocky headlands at both ends and a freshwater supply from the Owenmore River estuary in the southwest (Figure 1). The beach is backed by a system of sand dunes which reach 20 elevation in some places. A natural lagoon, approximately 2 km long and less than 0.5 m deep, is located behind the dunes in the east of the bay; however, it does not affect the bay as it drains into the adjacent Tralee Bay. Because of its natural features and beauty, Brandon Bay is estimated to add over €9 million to the local economy through tourism during the summer season based on RTE report in 2020 [28]; however, recent storms have caused erosion of its beachfront and sand dunes which are the primary natural protection of local communities, particularly in the northeast of the bay along the Maharees peninsula [28].
Analysis of national meteorological records [29] revealed 47 wind storms occurred between 2016 and 2021, where 19 of them reached their peak wind speed at the two met stations nearest the study area (Valentia and Mace Head). Figure 2 shows a recent study based on seven years of modelled wave data from 2015–2022, found that mean significant wave height (HS) in the centre and east of the bay ranges from 1 m in summer to more than 2 m in winter while the highest storm waves had HS of 5–6 [30]. Using a storm wave threshold HS of 3.0 m, the study also identified more than 100 separate storm waves during the 7-year period, an average of 14 storm waves per year. Both storm waves and wind storms are most frequent during the late autumn, winter and early spring seasons. Similarly to most of the Irish west coast, the tidal range is quite large with spring tides of up to 4.5 m and neap tides in the range of 1.5–2.0 m. Currents in the bay are quite weak and strongly driven by winds [30].The average current speed in the near-shore zone is between 0.05–0.15 m/s in summer and 0.1–0.25 m/s in the winter [30]. Although low in magnitude, there is a north-eastward residual current along the shore in both summer and winter.
Based on 418 sediment samples collected by Scullion et al. [31] along the full length of the beach and extending from the upper beach to the swash zone, the beach sediment in Brandon Bay is generally fine sand with D50 between 0.075 and 0.425 mm; the medium grain size of D50 = 0.25 mm means it may be classified as fine to medium sand according to the Udden-Wentworth grade scale. The sand is slightly coarser in the centre and eastern beach with D50 between 0.2 and 0.3 mm while the remaining areas of the beach predominantly have D50 between 0.1 and 0.2 mm. The D50 on the upper beachface (between mean sea level (MSL) and highest astronomical tide (HAT)) is around 0.3–0.4 mm in the east and slightly lower in the west (0.2–0.3 mm). The D50 is also slightly lower in the lower beachface (between lowest astronomical tide (LAT) and MSL) along the whole beach (0.15 to 0.25 mm). The beach is widest in the centre of the bay (around profile 4 in Figure 1) where a sizeable, submerged sand deposit exists in front of it. Non-cohesive sand dominates the sediment materials in the river estuary to the southwest, but cohesive sediment patches, comprising clay and mud, also exist in a few locations. The beach is wide and flat; its width ranges from 100–300 m along most of its length and its slope ranges from 0.02 to 0.06 [32]. These factors, combined with the highly energetic wave climate mean the beach may be classified as dissipative [33,34].

3. Methodology

Repeat surveys were performed to collect beach cross-section profiles at 7 locations in the bay (Figure 1) to measure shoreline change, and to contribute input and validation data for the models. One-dimensional XBeach was used to model shoreline change. A model was developed for each profile location using the cross-section profiles from the survey, open-source information such as satellite images for the coastline position, wave information from a wave model and predicted water levels based on tidal gauge measurement data located at the western end of the bay. The wave model used was the Simulating Wave Nearshore, or SWAN, model. Details of the model development are provided in Egon et al. [30].

3.1. Collection of Cross-Section Profile Data

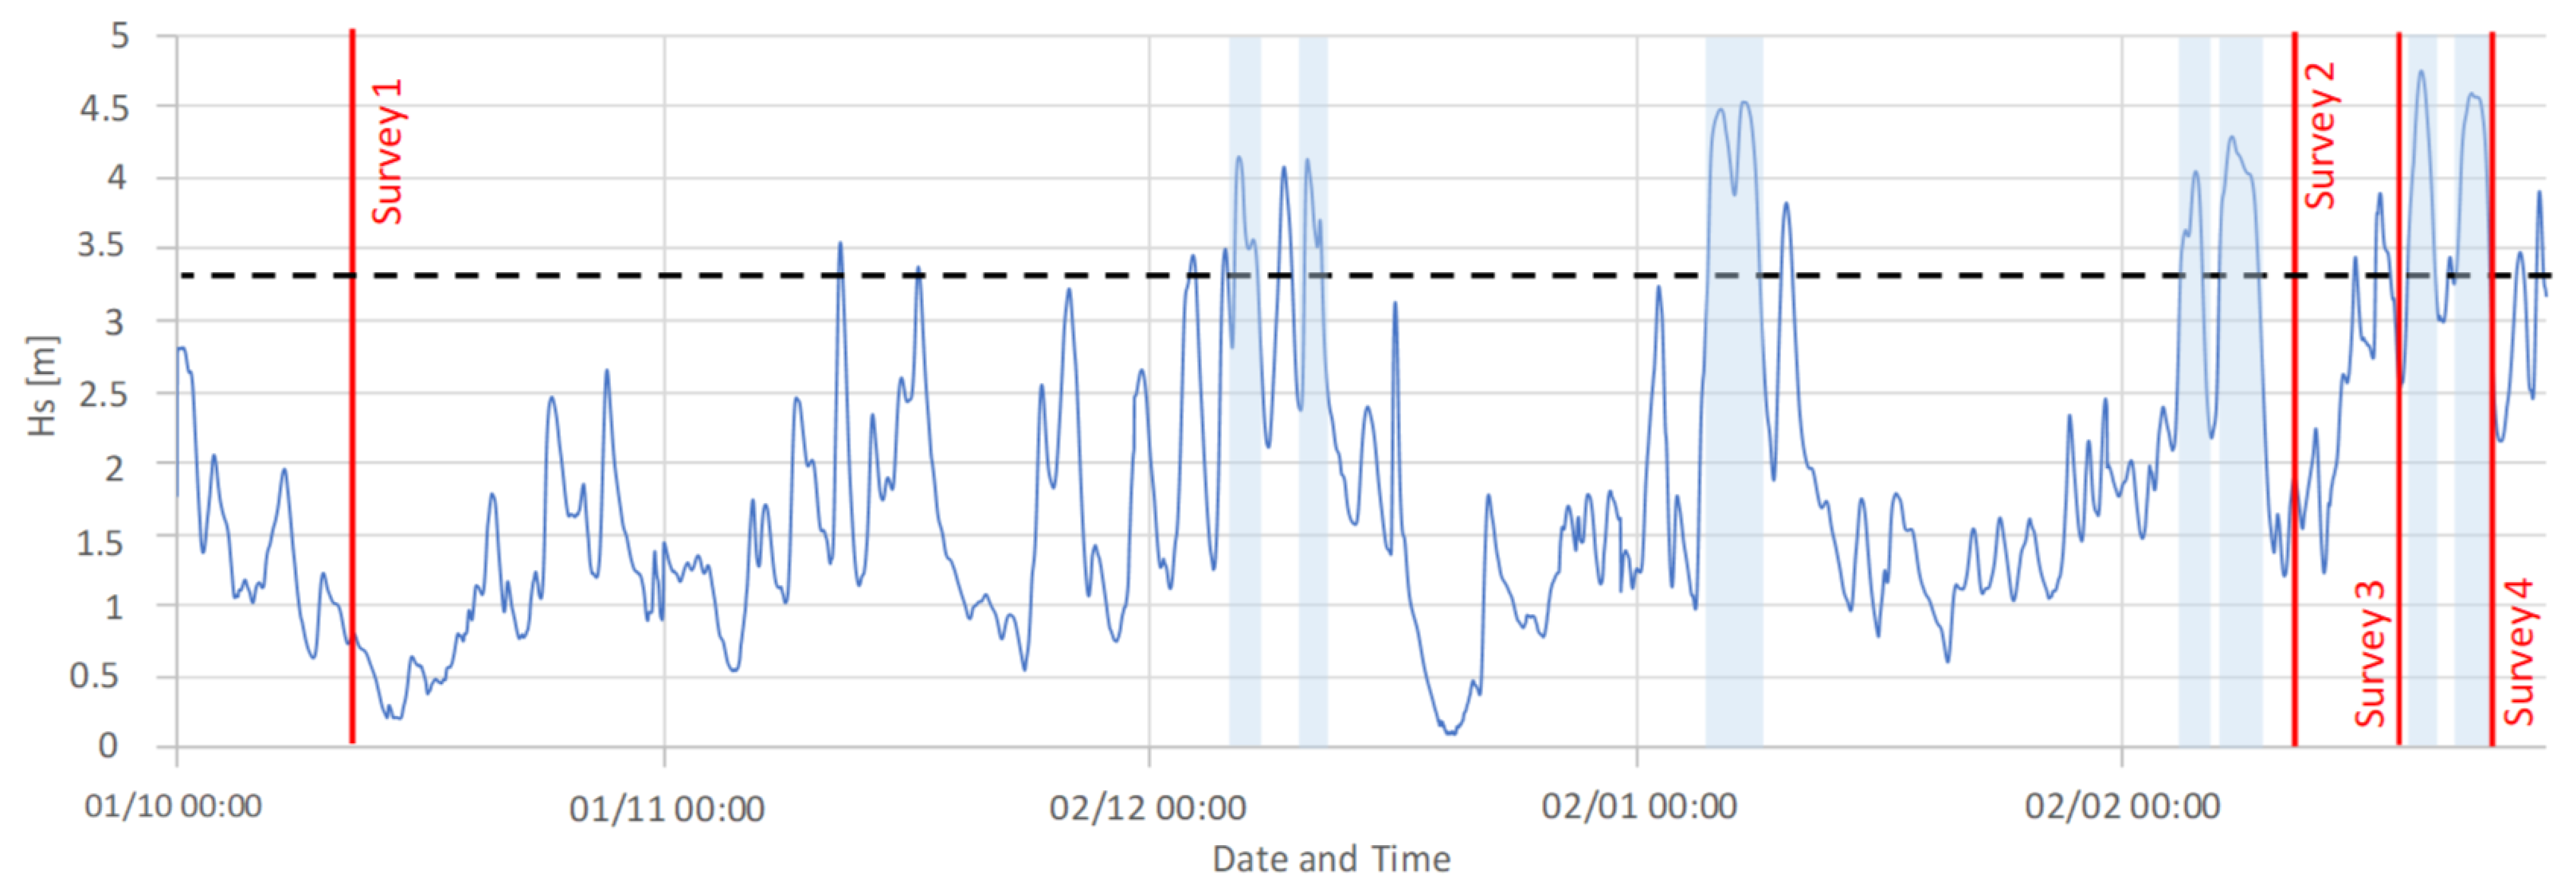
Beach topography datasets of high spatial and temporal resolution are rarely available for storm erosion studies [6]. In this research, five repeat survey campaigns were conducted during a single calendar year to collect cross-shore beach profiles extending from the low tide water line to the crests of the dunes at seven locations (Figure 1). A Trimble 10 virtual reference station (VRS) was used to determine position and elevation on the beachface. The first survey (S1) on 7–9 October 2021 captured the pre-winter profile. The second (S2), third (S3) and fourth (S4) surveys were performed on 13–14, 19, and 24–25 February 2022. These were opportunistically planned to capture data during a series of storms (Storm Dudley, Eunice and Franklin which hit Ireland on 16th, 18th and 20th February, respectively) in the hope that the impact of individual storms could be determined. The final survey (S5) on 4–5 November 2022 was timed to be approximately one full year after the first survey to determine the aggregate annual effect of coastal processes on the beach. In Figure 3, the survey dates are overlaid on a graph of modelled wave heights at the seaward extent of Profile 1. Storm waves with peaks exceeding a 5% exceedance threshold HS of 3.3 m (used for storm identification) are highlighted in blue: it can be seen that there were multiple storms around the time of the February 2022 surveys.
Shoreline cross-section survey coverage is best when taken during the peak spring low water as it reaches the lowest possible elevation. However, this is difficult due to practical limitations (e.g., personnel availability, transport and timing of storms) and the short duration of the low-water period. For personnel safety reasons, the storm surveys were collected between the storm events rather than during them [23].

3.2. Numerical Modelling

XBeach was used to simulate short-term shoreline elevation changes at 7 locations along the sandy beach of Brandon Bay for the storm period between 19 and 25 February 2022.
XBeach is a 1D/2D computational model designed to simulate shoreline changes under storm conditions, specifically addressing the impact of storm waves [10]. The model incorporates hydrodynamic processes, including short-wave and long-wave transformation, wave-induced setup, unsteady currents, overwash, and inundation. Additionally, it accounts for morphodynamic processes such as bedload and suspended sediment transport, seabed change, and dune face avalanching. XBeach has been further developed to include stationary wave mode and non-hydrostatic mode. It employs the shallow water equations to simulate low-frequency waves and mean flow, while sediment concentrations in the water column are modeled using a depth-averaged advection-diffusion scheme [10]. Bed level changes in Xbeach are driven by sediment fluxes in both cross-shore and alongshore directions.
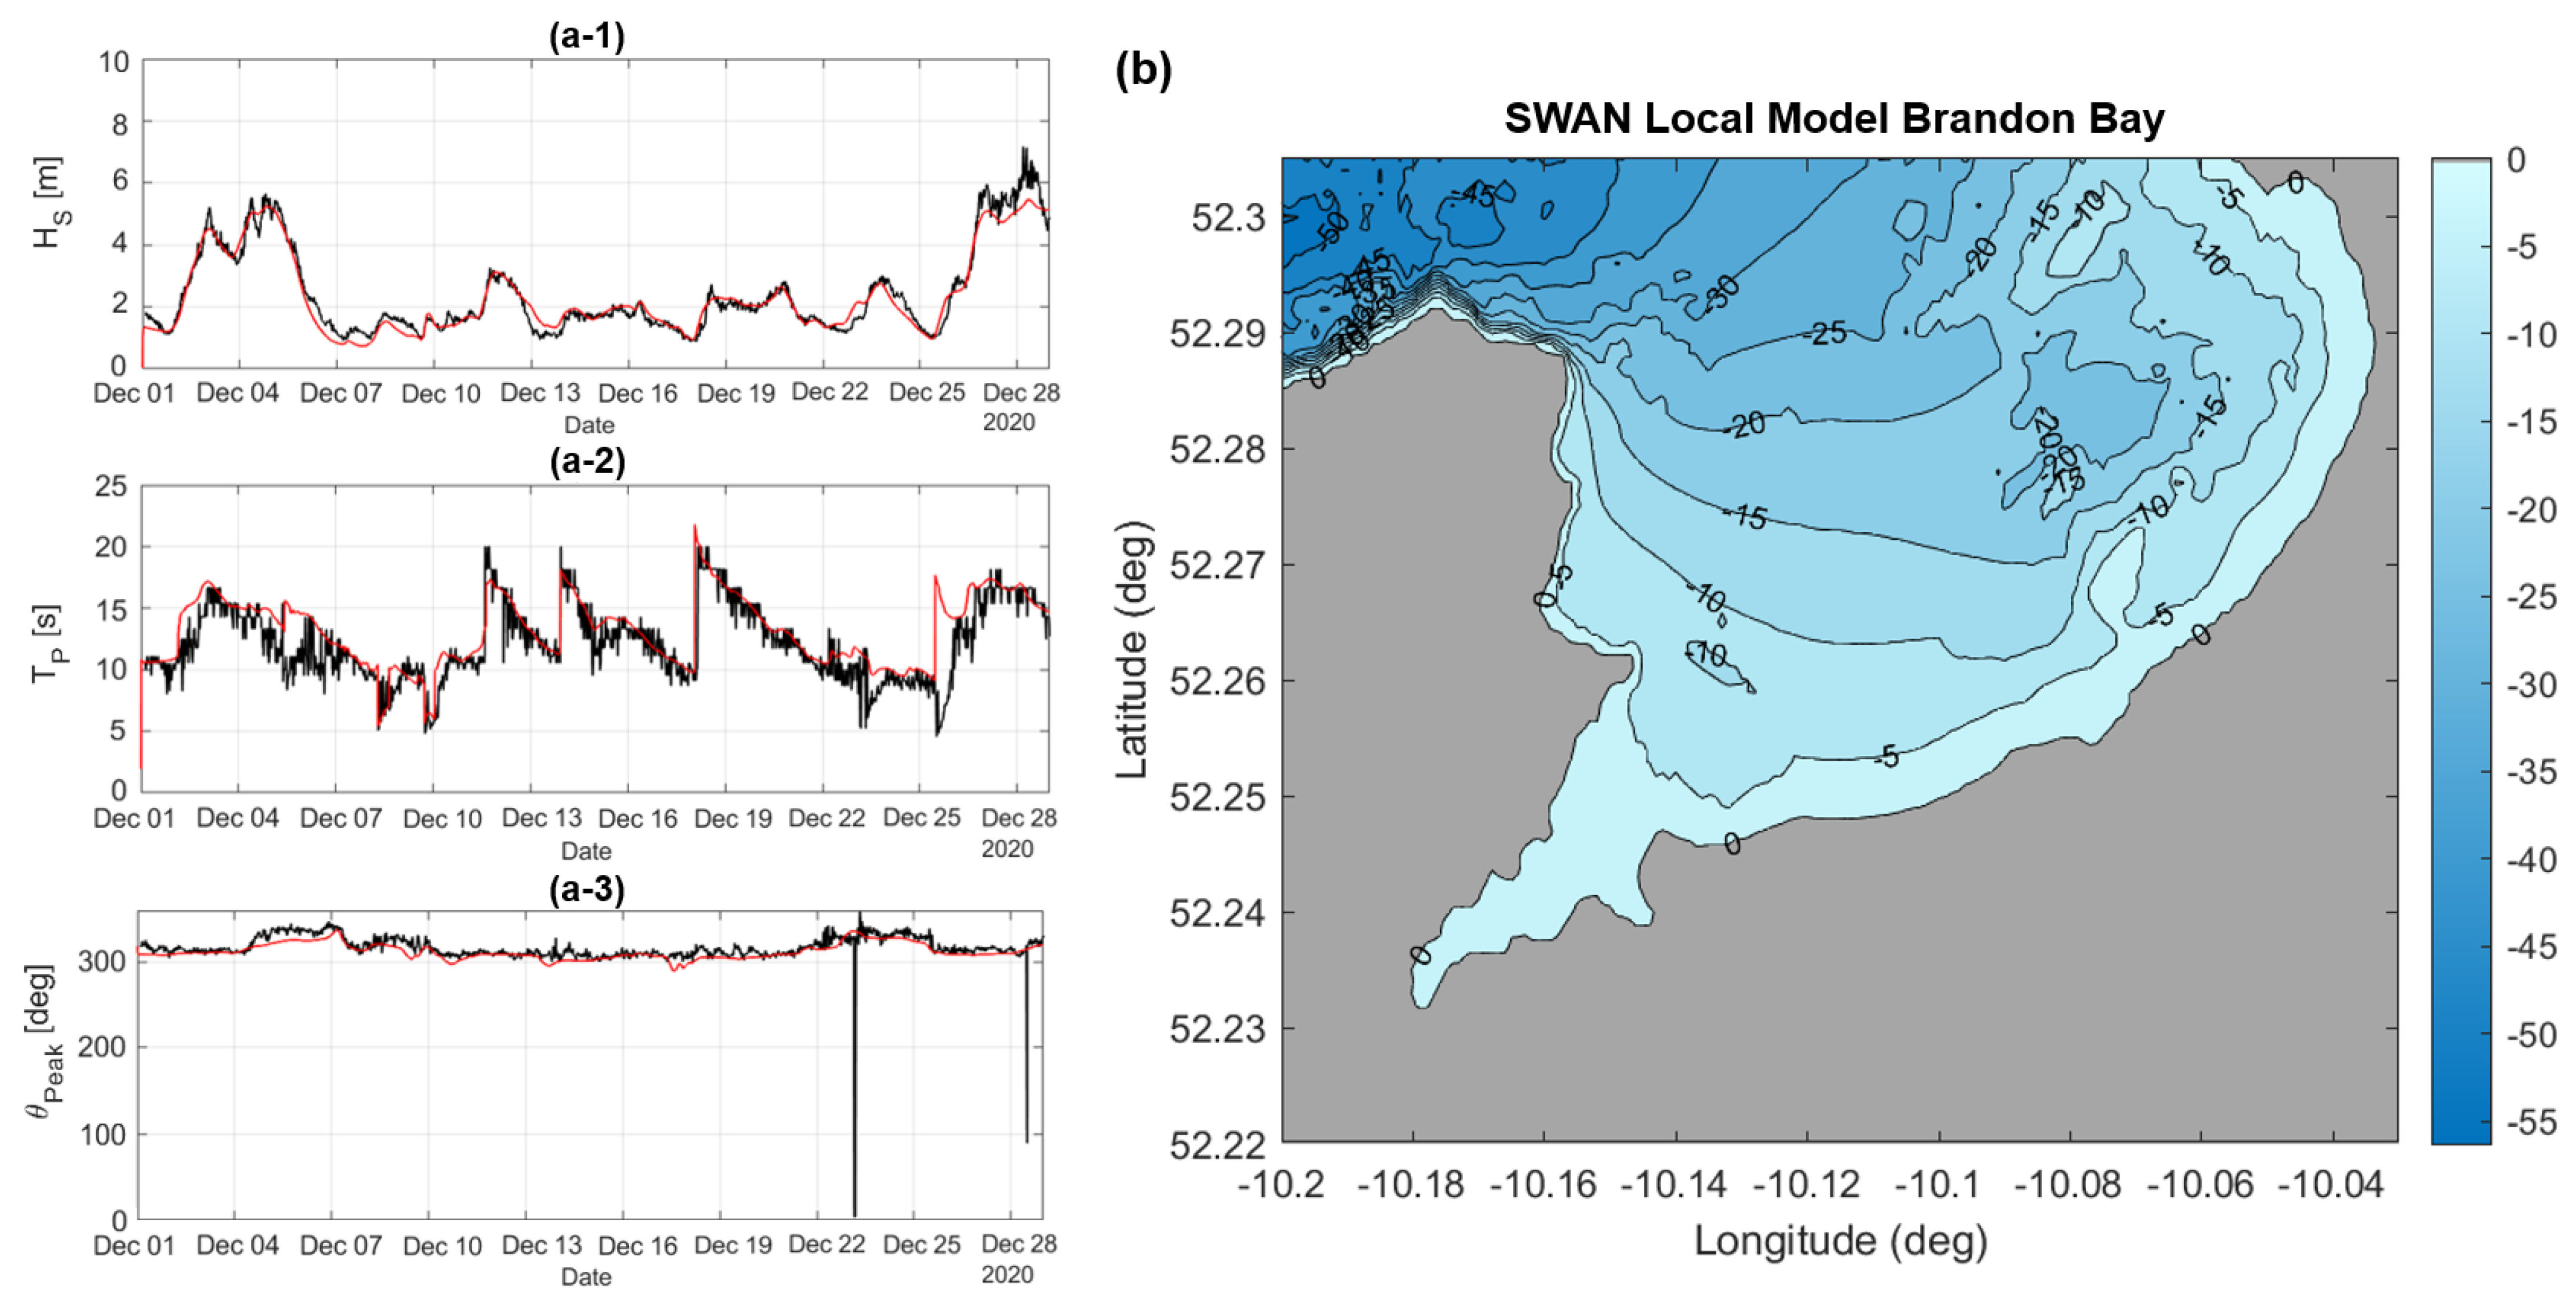
1D Xbeach was used to try to reproduce the impacts of the storm which occurred on 21st and 24th February 2022. The cross-section data for the 7 locations from the field survey (Figure 1) on 19th February were input to XBeach as the initial profiles. The cross-section profile grid resolution was 1 m, and the profiles were extrapolated to 1000 m offshore using a spline technique to generate more realistic profiles. Tidal water levels and wave parameters (significant wave height (HS), period (Tp), and direction (θ)) were specified at the models’ offshore boundaries. The wave data were obtained from a nested local scale SWAN model of the bay (Figure 4). The SWAN model uses a spatial resolution of 110 m and is nested within a regional North East Atlantic model driven by waves from a global Wave Watch III model and wind fields from the ECMWF ERA-5 dataset. The local model bathymetry was obtained from various sources. 5 m resolution lidar data from the Infomar project (Infomar, 2020) was supplemented was data from two 2 m resolution echo-sounder surveys and two GPS surveys [30]. The model has been validated against observed data, and the model performs well as indicated by normalised root mean square error (RMSE) for HS, TP and θ of 5.2%, 11.0% and 2.59%, respectively. Figure 5 shows examples of the wave height and period inputs for Profile 2 and Profile 7. The figures show that storm wave heights in the east of the bay reached in excess of 4.5 m while those in the west only reached 2.5 m. Water level input data were obtained via tidal constituent analysis of measured water level data recorded by a tide gauge in the west of the bay (Figure 1).

3.3. Model Validation

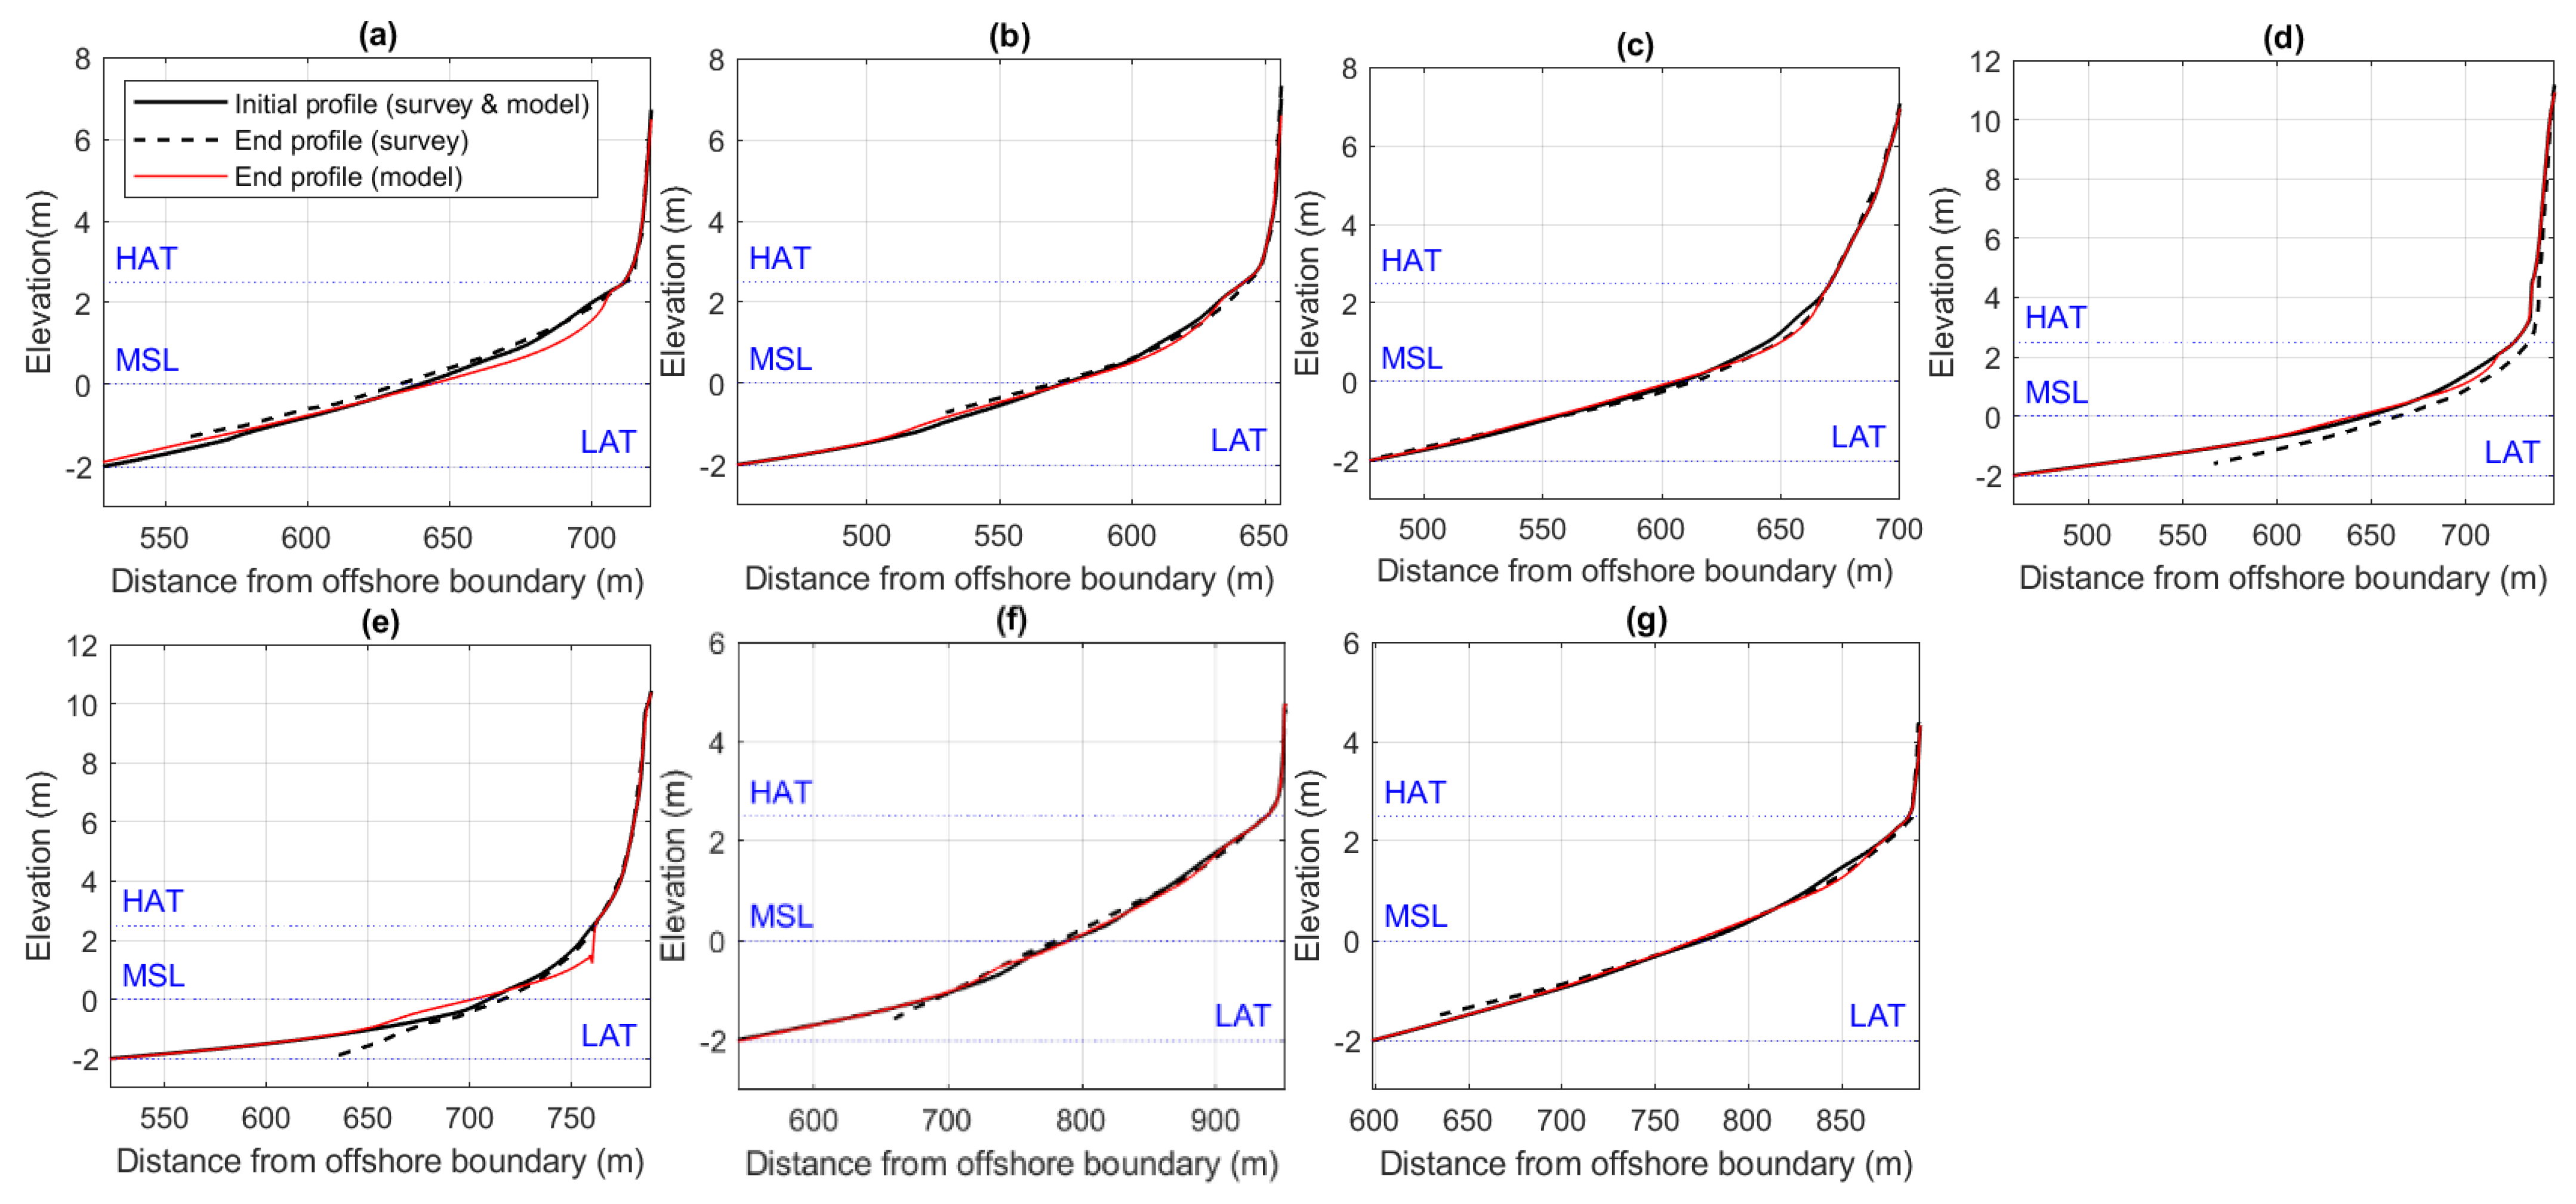
The performance of the XBeach model was assessed by simulating the change in beach profiles between survey S3 on 19 February 2022 and S4 on 25 February 2022, which captured the impacts of Storm Franklin. According to the Brandon Bay wave model, the storm resulted in waves with Hs of 4.8 m in the east of the bay (Figure 5). The beach profiles measured on 19 February were input to the model and the predicted cross-section profiles at the end of the simulation were compared with the survey data from 25 February. The model was calibrated by tuning various physical parameters in the input file as recommended in the XBeach user manual. Figure 6 shows a comparison of the end profiles from the final calibrated model with the measured end profiles. In the figures, the distance shown is distance from the offshore boundary of the model; this is the coordinate convention used by the model.
A quantitative approach to assess model performance [35] for cross-section profile simulation was carried out with the following methods:
  • Linear regression and correlation coefficient (r) between the measured shoreline elevations (xm) and the predicted elevations from the model simulation (xp);
  • The root mean square error (RMSE) between the survey data (xm) and the model predictions (xp) is calculated as:
R M S E = x p x m 2
A more sophisticated assessment method was carried out using the Briar Skill Score (BSS) [25,27,35,36,37], which is calculated as:
B S S = 1 x p x m 2 x b x m 2
where xb is the baseline (starting) beach profile, xp is the post-storm beach profile predicted by the model, and xm is the measured post-storm beach profile. A perfect agreement occurs when the BSS is 1. Negative values indicate very poor performance while values of 0–0.3, 0.3–0.6, 0.6–0.8, and >0.8 indicate poor, reasonable/fair, good and excellent agreement, respectively [38].
The model performance was quantitatively assessed by calculating the RMSE of the modelled end profile versus the measured one and using the Brier Skill Score. The correlation (r) values were very high for all profiles and all sections, indicating good agreement in the shapes of the measured and modelled profiles; however, as the changes in profile are relatively small, the r values do not provide any information on the skill of the model in predicting the profile changes. The RMSE and BSS are better metrics of model performance and are each consistent with the other, with higher model skill resulting in lower RMSE and higher BSS. Hence, only RMSE and BSS values are used to assess model performance.
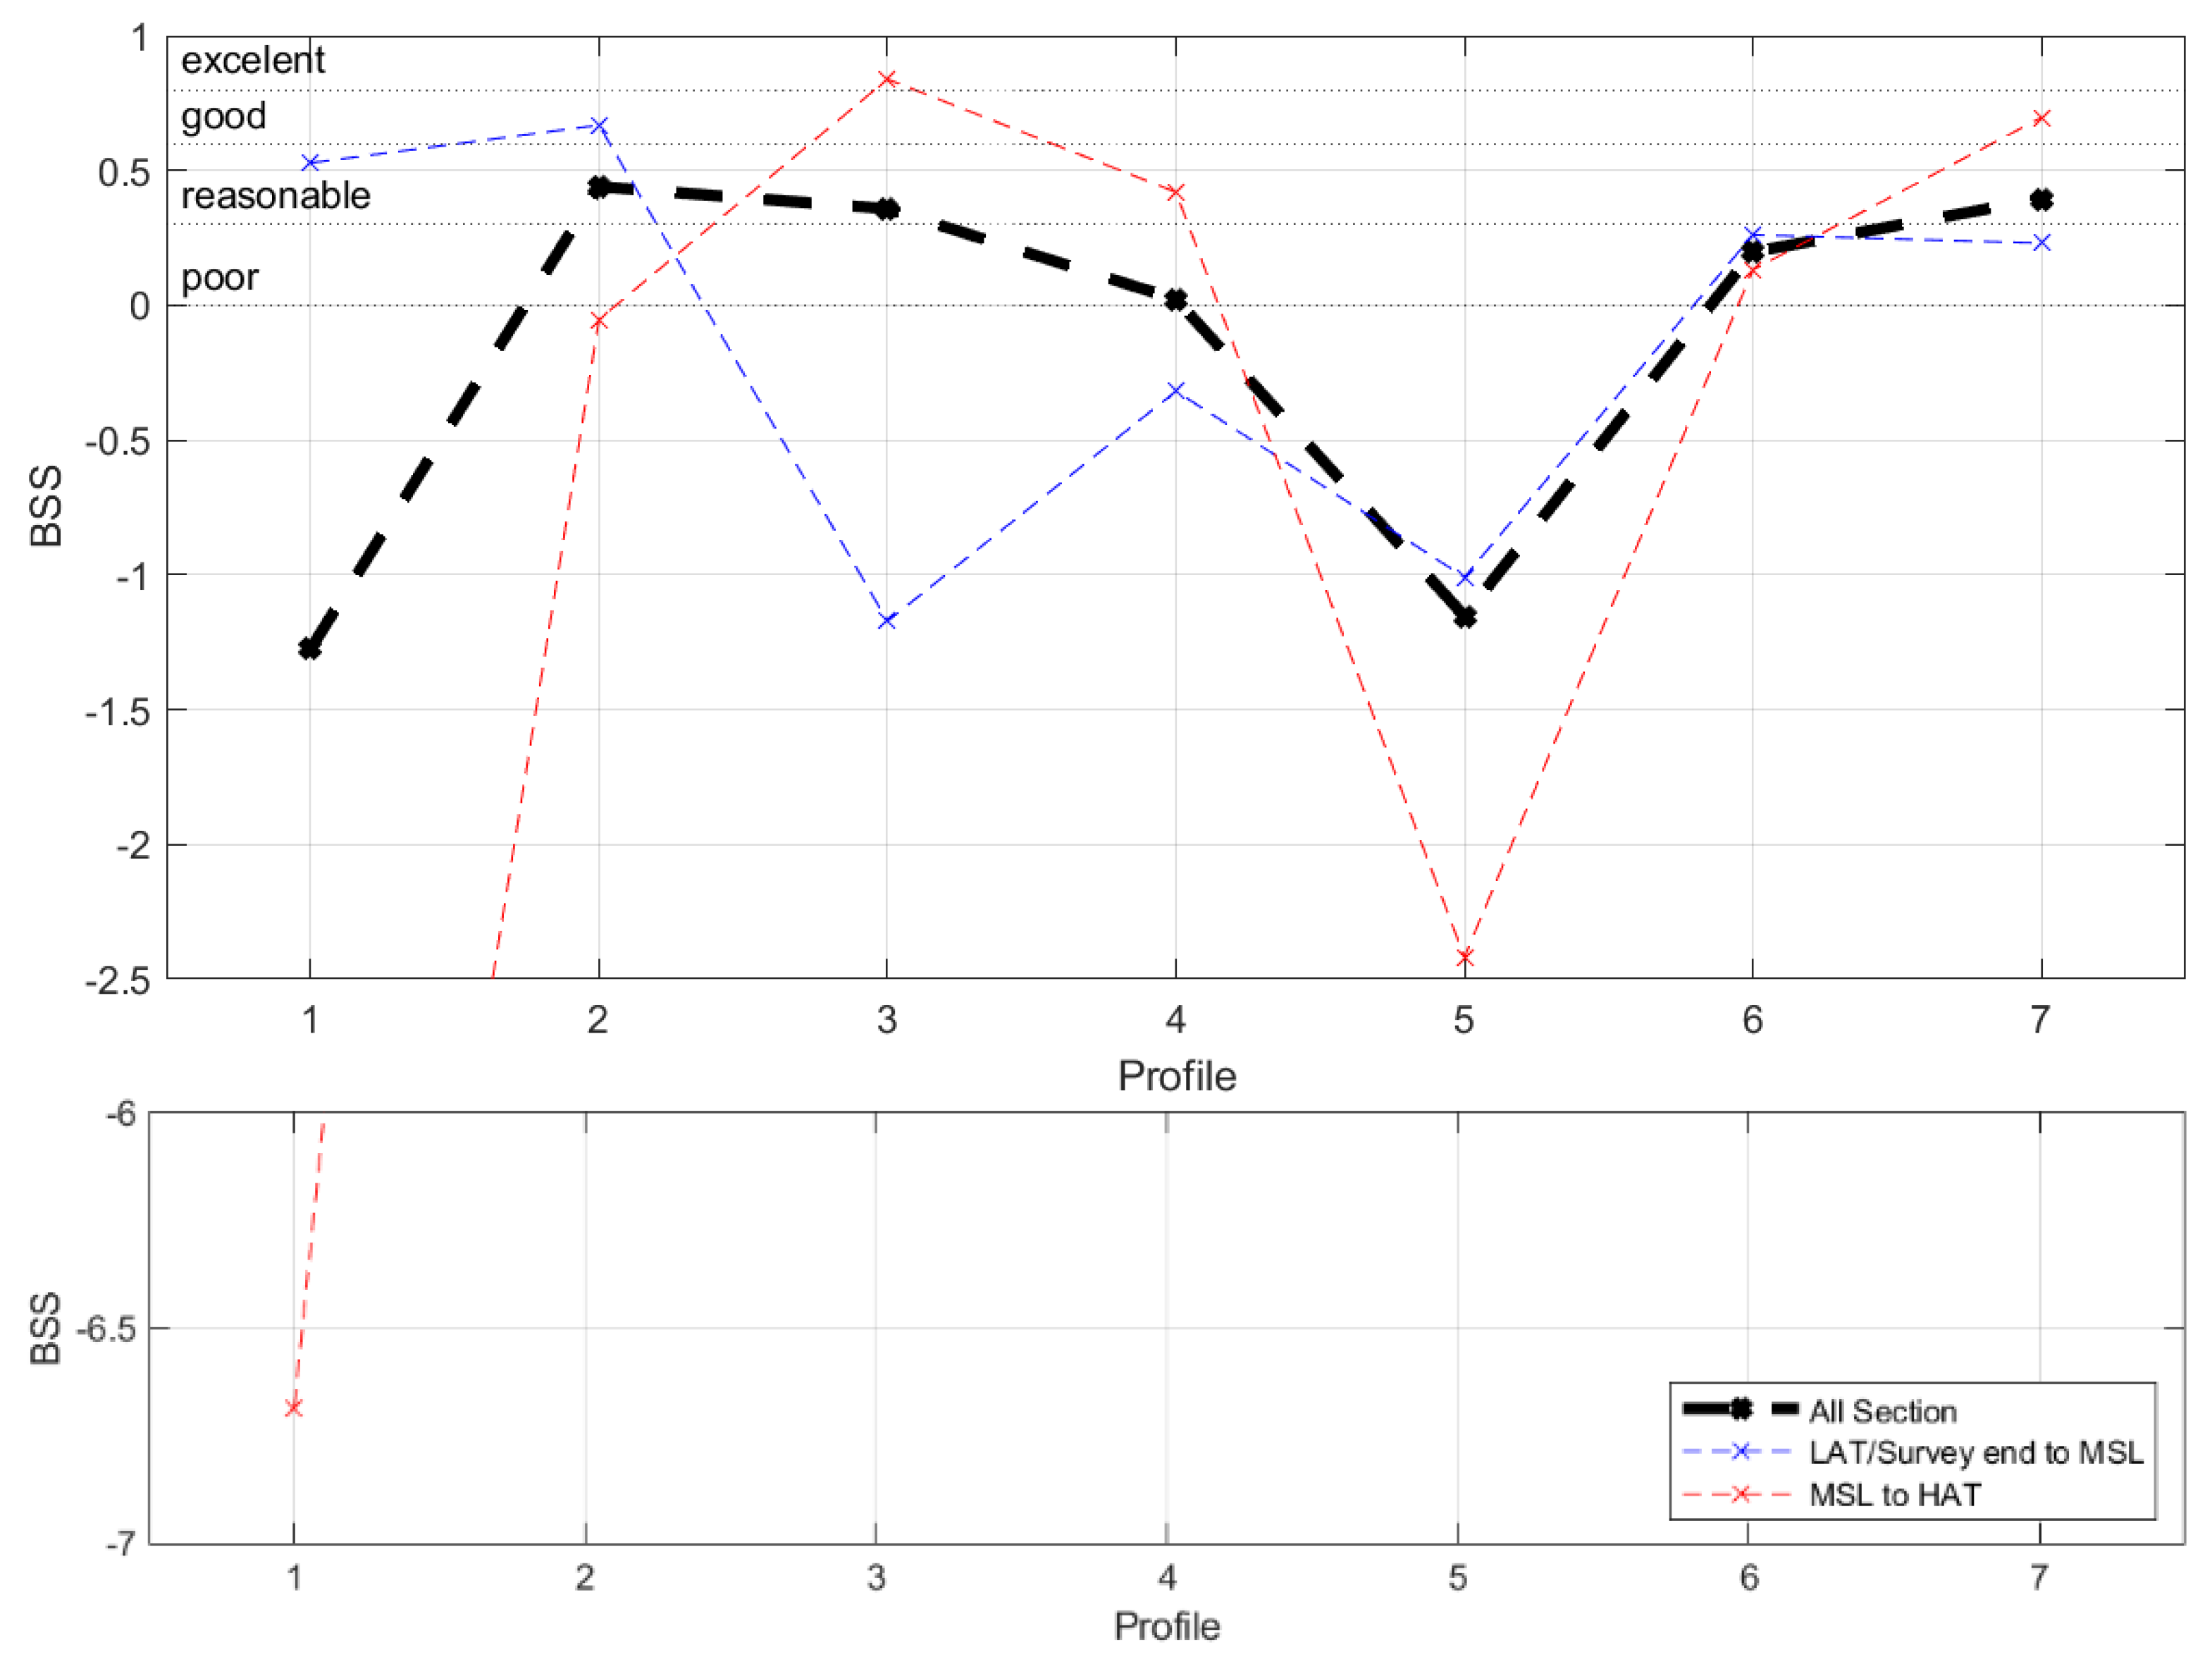
Table 1 and Figure 7 shows the BSS values for all seven profiles for (1) the full length of the profile from the dune crest to LAT or furthest seaward extent, (2) the lower beach from LAT/survey end to MSL, and (3) MSL to HAT. Despite a good agreement between the model and the survey data on the qualitative comparison, the full profile BSS shows that the model performance is reasonable for profile 2 (BSS 0.44), 3 (BSS 0.36) and 7 (BSS 0.39), poor for profile 4 (BSS 0.22) and 6 (BSS 0.20), and very poor for profile 1 (BSS = −1.27) and 5 (BSS = −1.15). Looking at the BSS values for the upper and lower beaches, it is seen that model accuracy for most of the profiles varies along the beach face. For example, for Profile 1, the model is reasonable (BSS = 0.53) for the lower beach, but it is very poor for the upper beach (BSS = −6.68), which causes the model performance to be low in general. For profile 5, the model performance is very poor in both sections, with BSS of −1.00 and −2.42 for the lower and upper sections. The best model performance is on the upper beach for profiles 3 and 7 (BSS of 0.84 and 0.7) and the lower beach for profile 2 (BSS of 0.67).

3.4. Model Simulations

3.4.1. Model Sensitivity Simulations

While model calibration focussed on the specification of parameters relating to the governing processes, model performance can also be affected by uncertainties or inaccuracies in the specification of wave forcing data and/or beach sediment characteristics. Additional model simulations were used to assess the model sensitivity to these uncertainties. Tests on wave parameter data (specifically HS and TP) was conducted to address the uncertainty in the model-predicted wave data used to force the XBeach model—while the local SWAN model showed good accuracy, it was not perfectly accurate (see Figure 3). Tests on sediment characteristics input (D50 and D90) was performed to address uncertainties in these data for the following reasons:
  • The location of the sediment grab samples used to determine sediment characteristics were obtained from a previous survey and so the locations of the sample data did not exactly match the profile location;
  • The 1D XBeach model only allows uniform D50 and D90 input across the profiles, while in reality the sediment characteristic might vary across the coastal profile.
The original D50 and D90 values specified to the models were 0.29 mm and 0.57 mm, respectively. The sensitivity analysis was performed using multiplication factors applied to the wave parameters and characteristic sediment input to the XBeach model as shown in Table 2. Seven simulations were run in total: two for wave height, two for wave period, and three for sediment characteristics.

3.4.2. Future Climate Simulations

Two aspects of future climate change were investigated with respect to their likely impacts on shoreline change: (1) sea-level rise and (2) an increase in storminess. Future climate scenario simulations were performed using the profile 2 model, as it achieved the highest BSS. This profile is also located in the eastern part of the bay, which is geographically more exposed to Atlantic Ocean storms.
Sea-level rise scenarios were based on estimations of sea-level rise by the Intergovernmental Panel on Climate Change (IPCC) [39] for a range of future emission scenarios based on representative concentration pathways, or RCPs. Six scenarios were modelled including 3 based on the results of the IPCC low emissions RCP2.6 estimations (low 0.29 m, mid 0.43 m, and high 0.58 m) and 3 based on the high emissions RCP8.5 estimates (low 0.61 m, mid 0.85 m, and high 1.10 m) [39]. In all cases, the sea-level rise was added to the mean water level in the model. The model was forced with the wave data for the period 19 to 25 February 2022.
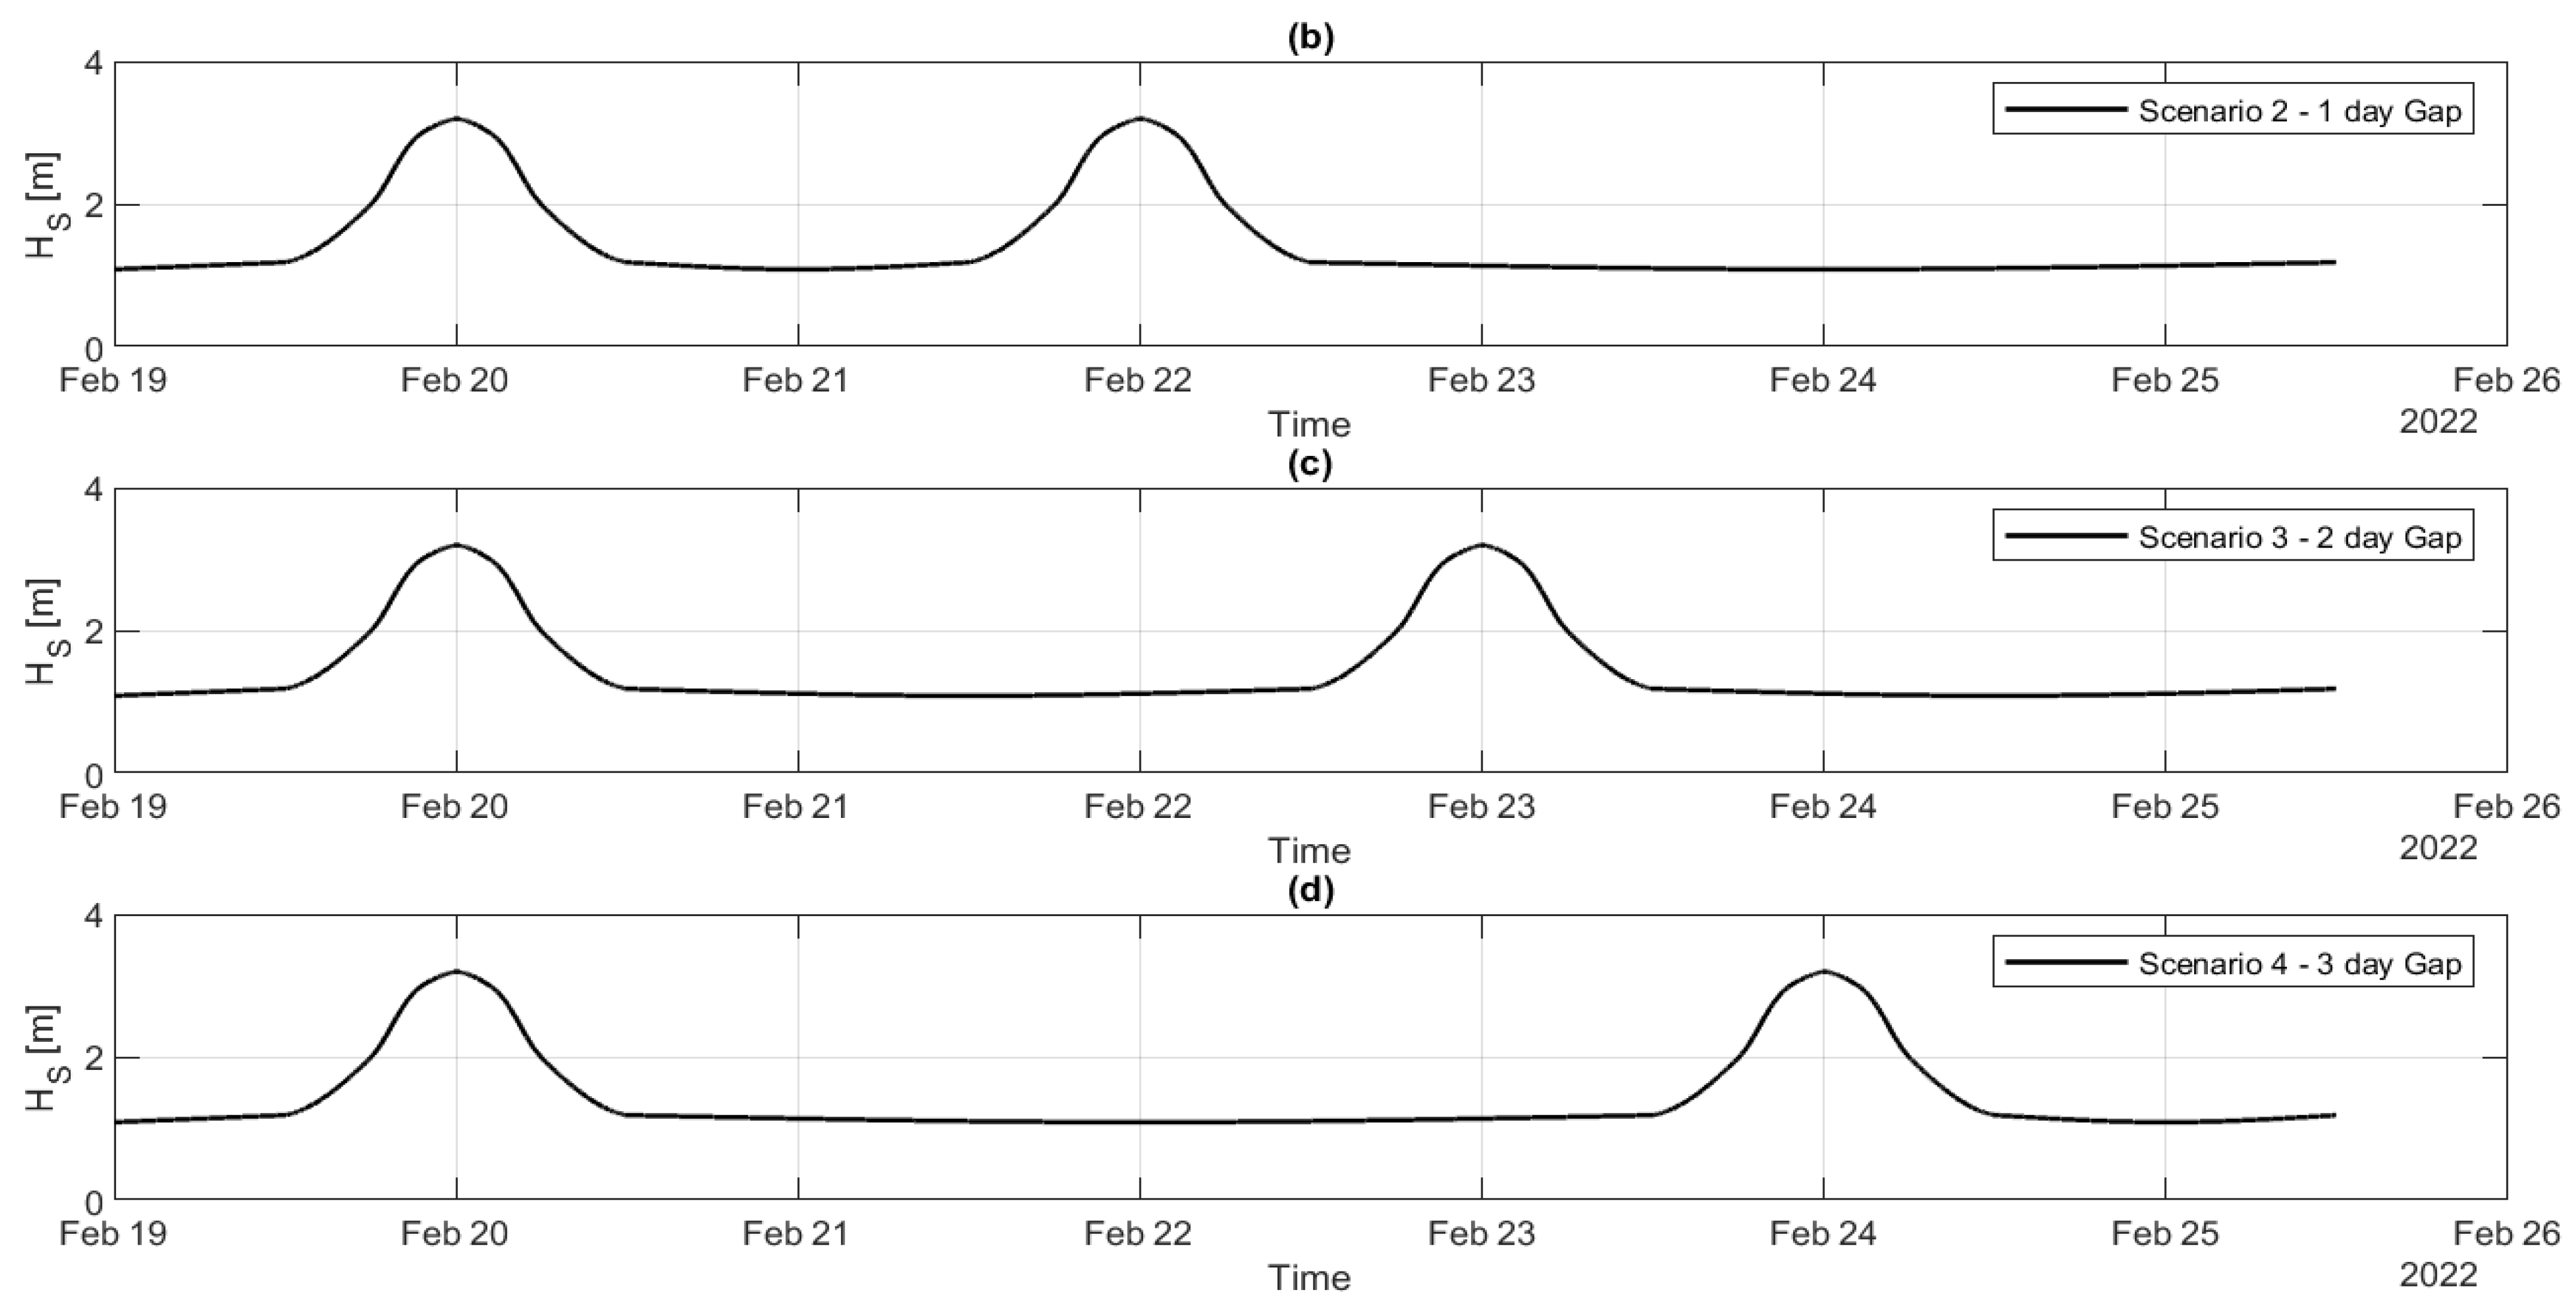
An increase in storminess is predicted to result in more frequent storms with higher extreme waves. In order to examine the impact of increases in wave height on shoreline change, multiplication factors were applied to the original wave height (HS) input data of the Profile 2 model. The multiplication factors were varied from 0.5 to 1.5, increasing by 0.1 for each case. To investigate the effects of intensified storm frequency, the model was run with the beach being subjected to two successive storms where the period between storms was varied from one to four days. The model was simulated with synthetic wind and wave input data based on the storm event that occurred on 21 February 2022 (Figure 2), with the peak of the idealised storm wave having HS = 3.2 m and TP = 18 s. Figure 8 shows the input HS for the storm frequency scenarios. The wave direction was assumed constant at 274° (east direction) to match the long-term mean wave direction in the east of the bay. For the gap between storms, a wave height of HS = 1.1 m and period TP = 11 s, which is typical of the regular winter wave height and period, was used. The tidal information was excluded from the model to look at the storm wave effects in isolation.
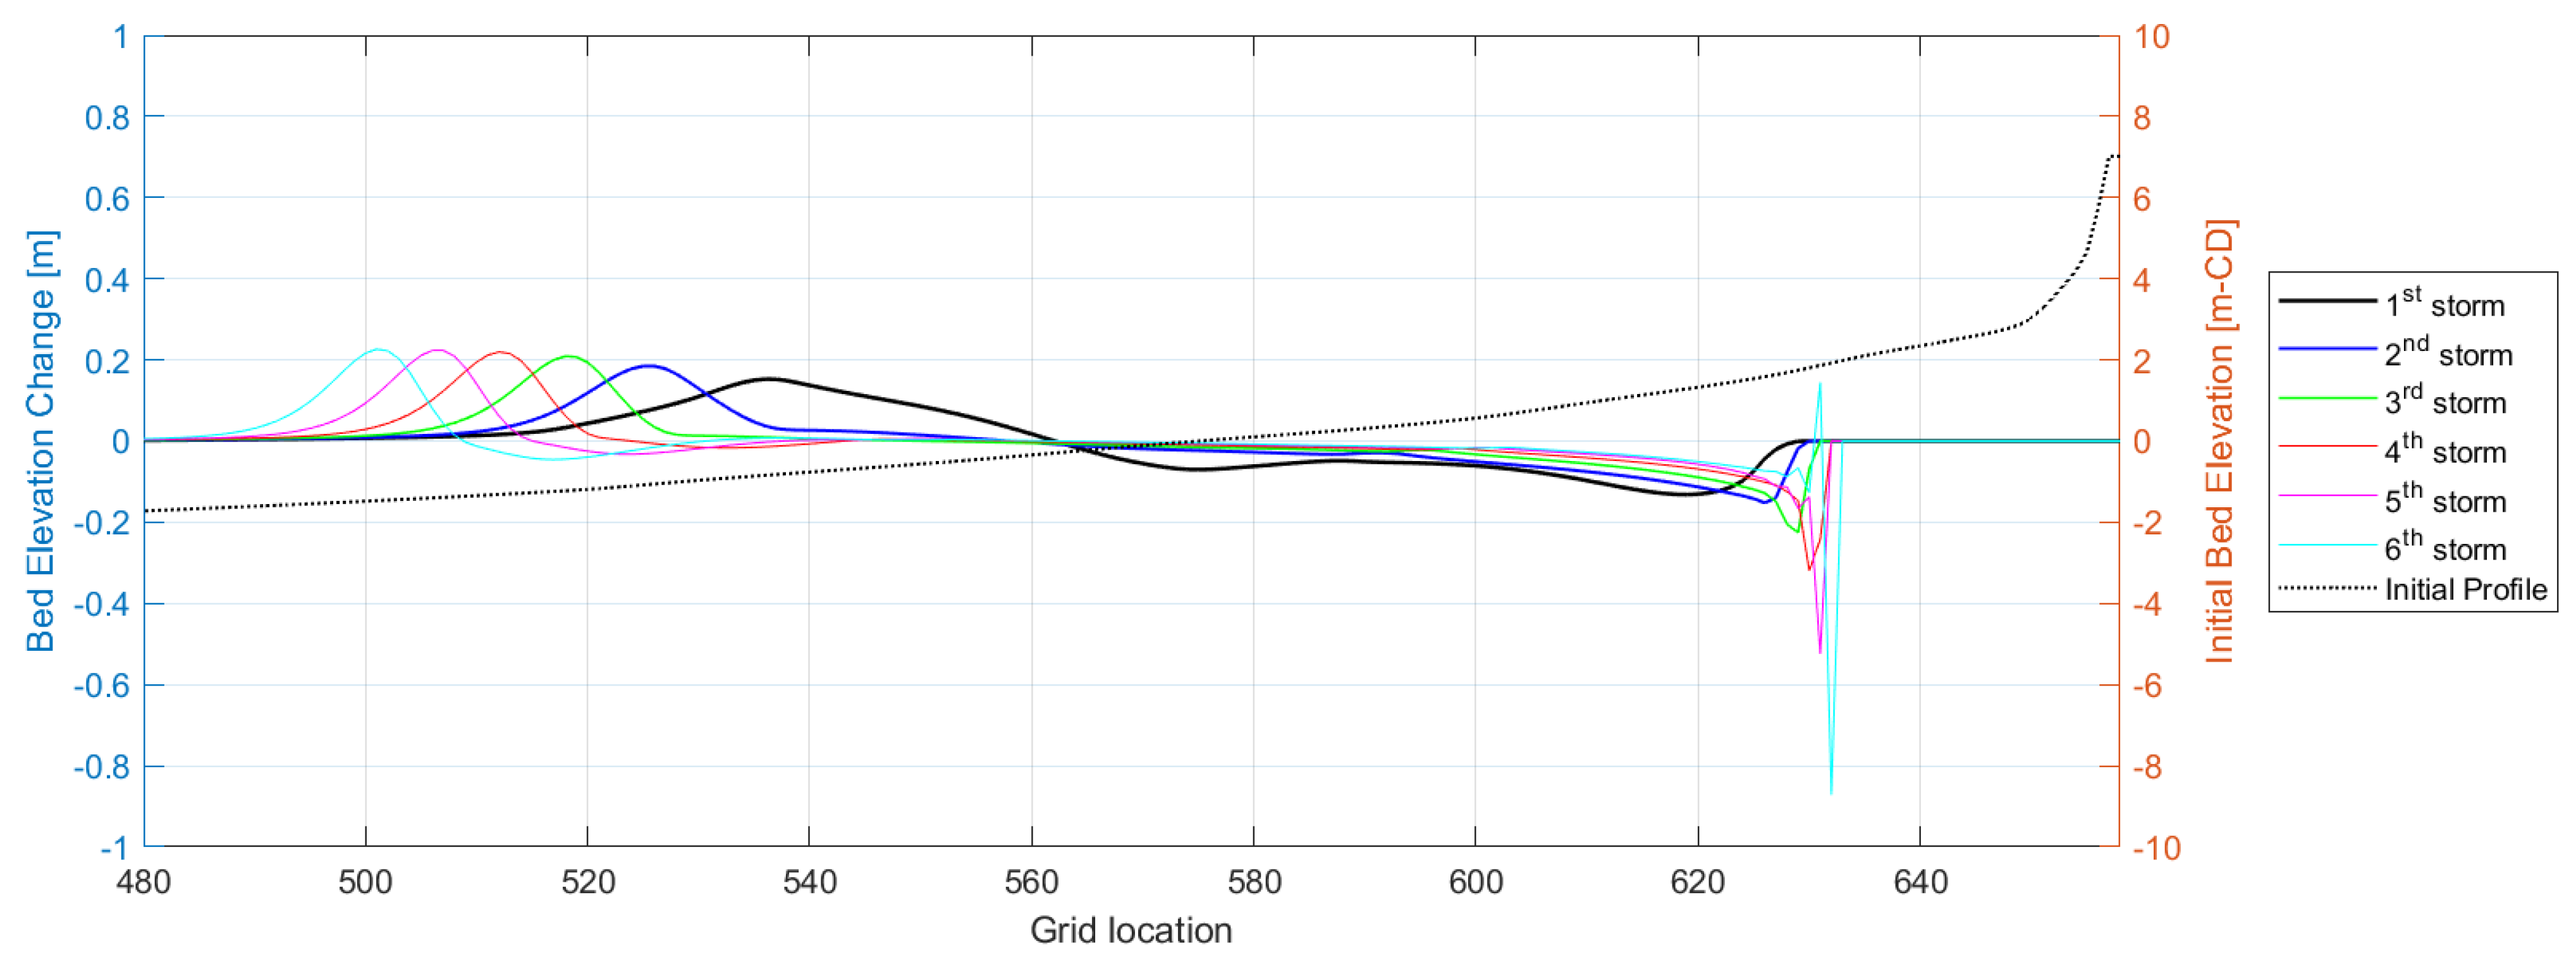
One final storm sequencing simulation was conducted with six consecutive storm events occurring during the same period as the previous sequencing scenarios (see Figure 9). The assessment was conducted to investigate whether a following storm with the same magnitude would have the same impact as the preceding one. The wave parameter input for the storm was the same as the previous assessment, with the peak of the storm having HS = 3.2 m and TP = 18 s.

4. Results and Analysis

4.1. Survey Data

As storm waves act on a beach, they may erode material, resulting in a lowering of the beach and landward movement or retreat of the shoreline. During milder conditions, the deposition of material may take place, resulting in a rise in the beach and a seaward movement of the shoreline. The measured beach profiles were analysed to see if this hypothesis held true for Brandon Bay.
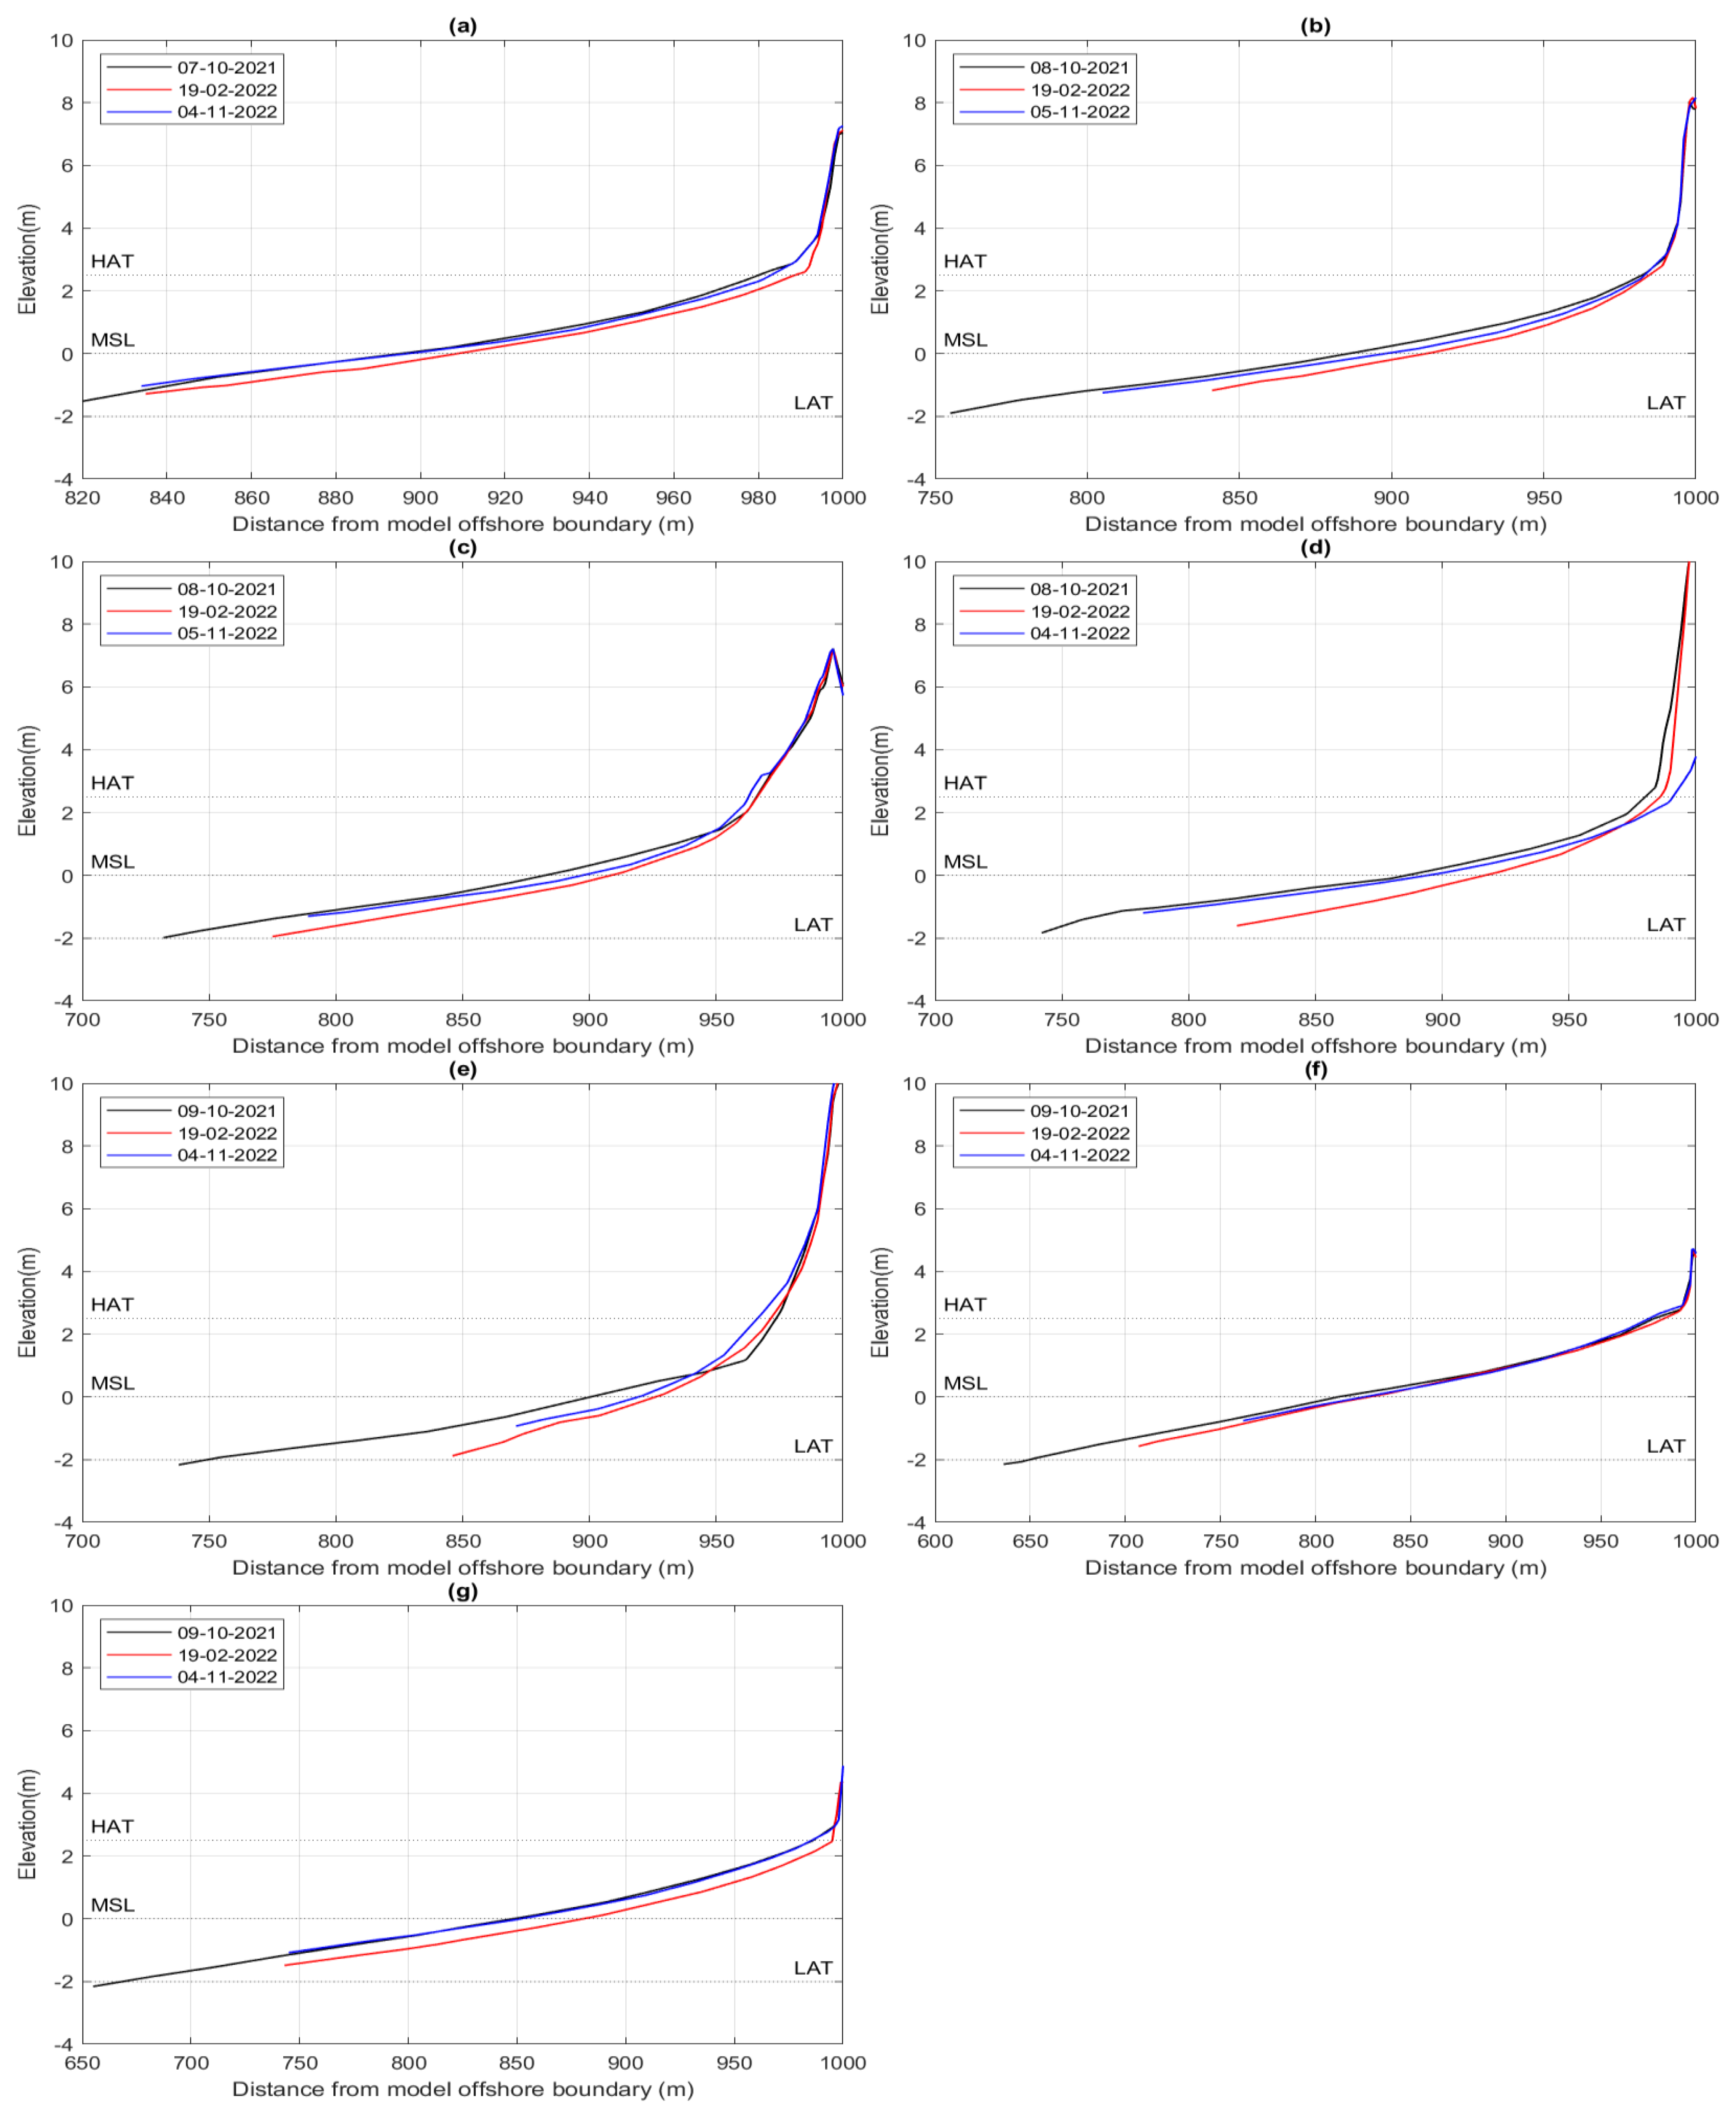
Figure 10 compares the cross-section profiles collected in October 2021, at the beginning of the winter season, with those collected 4 months later, on 19 February 2022, and a little over one year later in November 2022. Comparison of the October and February profiles clearly shows the erosive effect of winter storm waves on the beach. Across all seven locations, the February beach profiles are noticeably lower than those in October. However, by November, it is seen that the beach profiles at most locations have been restored to their previous October levels, suggesting a period of accretion and recovery of the beach occurs between February and October.
The vertical changes in the beach profiles were quantified by calculating the differences in the measured elevations along the shoreline transects between the October (S1) and February 19th (S3) surveys and between the February 19th (S3) and November (S5) surveys. Each profile was separated into three sections:
  • The lower beach—extending from LAT to MSL;
  • The middle beach—extending from MSL to HAT;
  • The upper beach—extending from HAT to the dune crest.
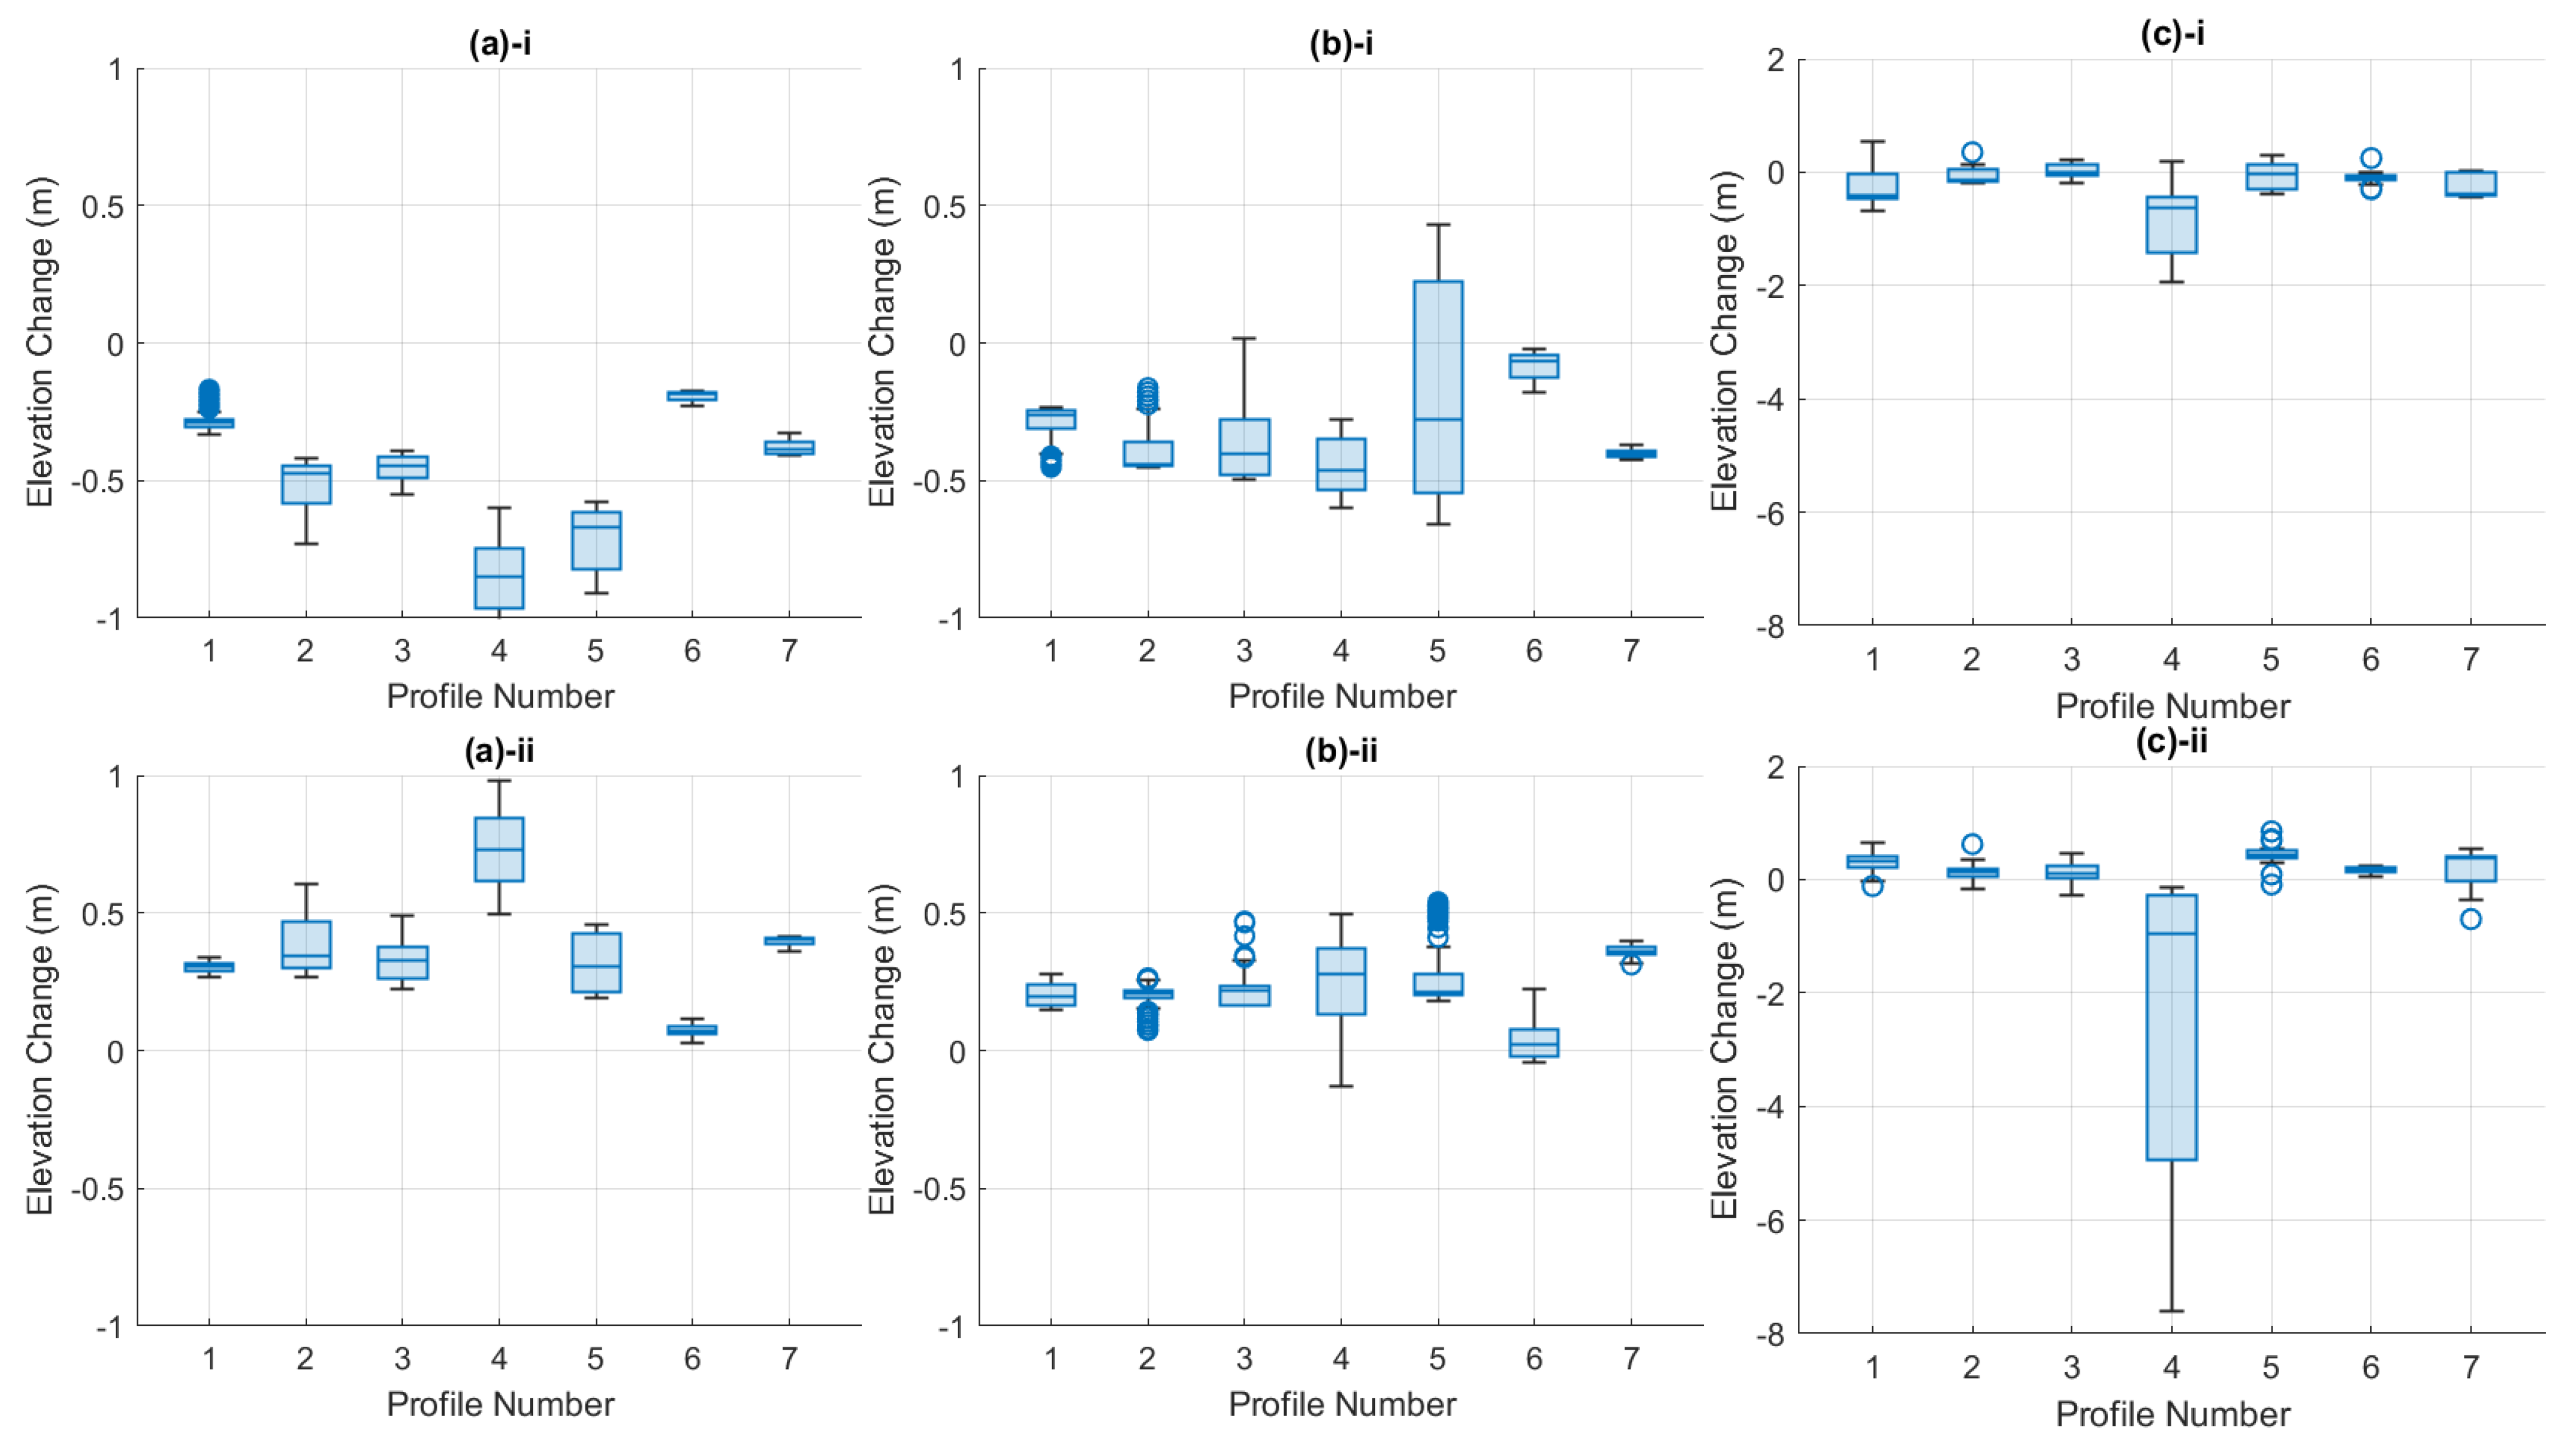
Figure 10 shows box plot analyses of the vertical elevation changes computed along the three beach sections. As would be expected, the majority of erosion/deposition occurs on the lower and middle sections of the beach where waves are most active. On the lower beach, the average lowering of beach elevation ranged from 0.2 m at Profile 6 to 0.85 m at Profile 4. Comparing Figure 11(a-i) with Figure 11(a-ii), it is seen that the levels if elevation gain that occur between February and November are very similar to the reductions that occur between October and February, suggesting that the lower beach profile is relatively stable year-to-year. The middle beach exhibits similar year-to-year stability. On the upper beach, the values vary among the profiles, suggesting that changes are highly dependent on the dune’s dynamics. For instance, significant alterations in Profile 4 are due to dune avalanching.
The changes are greatest along the middle and lower beach sections which are most exposed to wave action. Taking Profile 4 as an example, the lower and middle beach profiles were lowered by approximately 0.4 m while the elevation of the upper beach remained relatively unchanged. In contrast, Figure 11b shows a rise in the beach profile along the lower and middle beach sections between February and November when milder wave conditions prevail with very little change in the upper beach profile. In summary, the survey data shows that the beach profile is quite dynamic, with a lowering of the profile in winter due to erosion and transport of sediment offshore, and a recovery in summer during milder conditions with movement of sediment onshore. This agrees with the classical understanding of beach behaviour under cycles of stormy and milder conditions.

4.1.1. Sensitivity Analysis

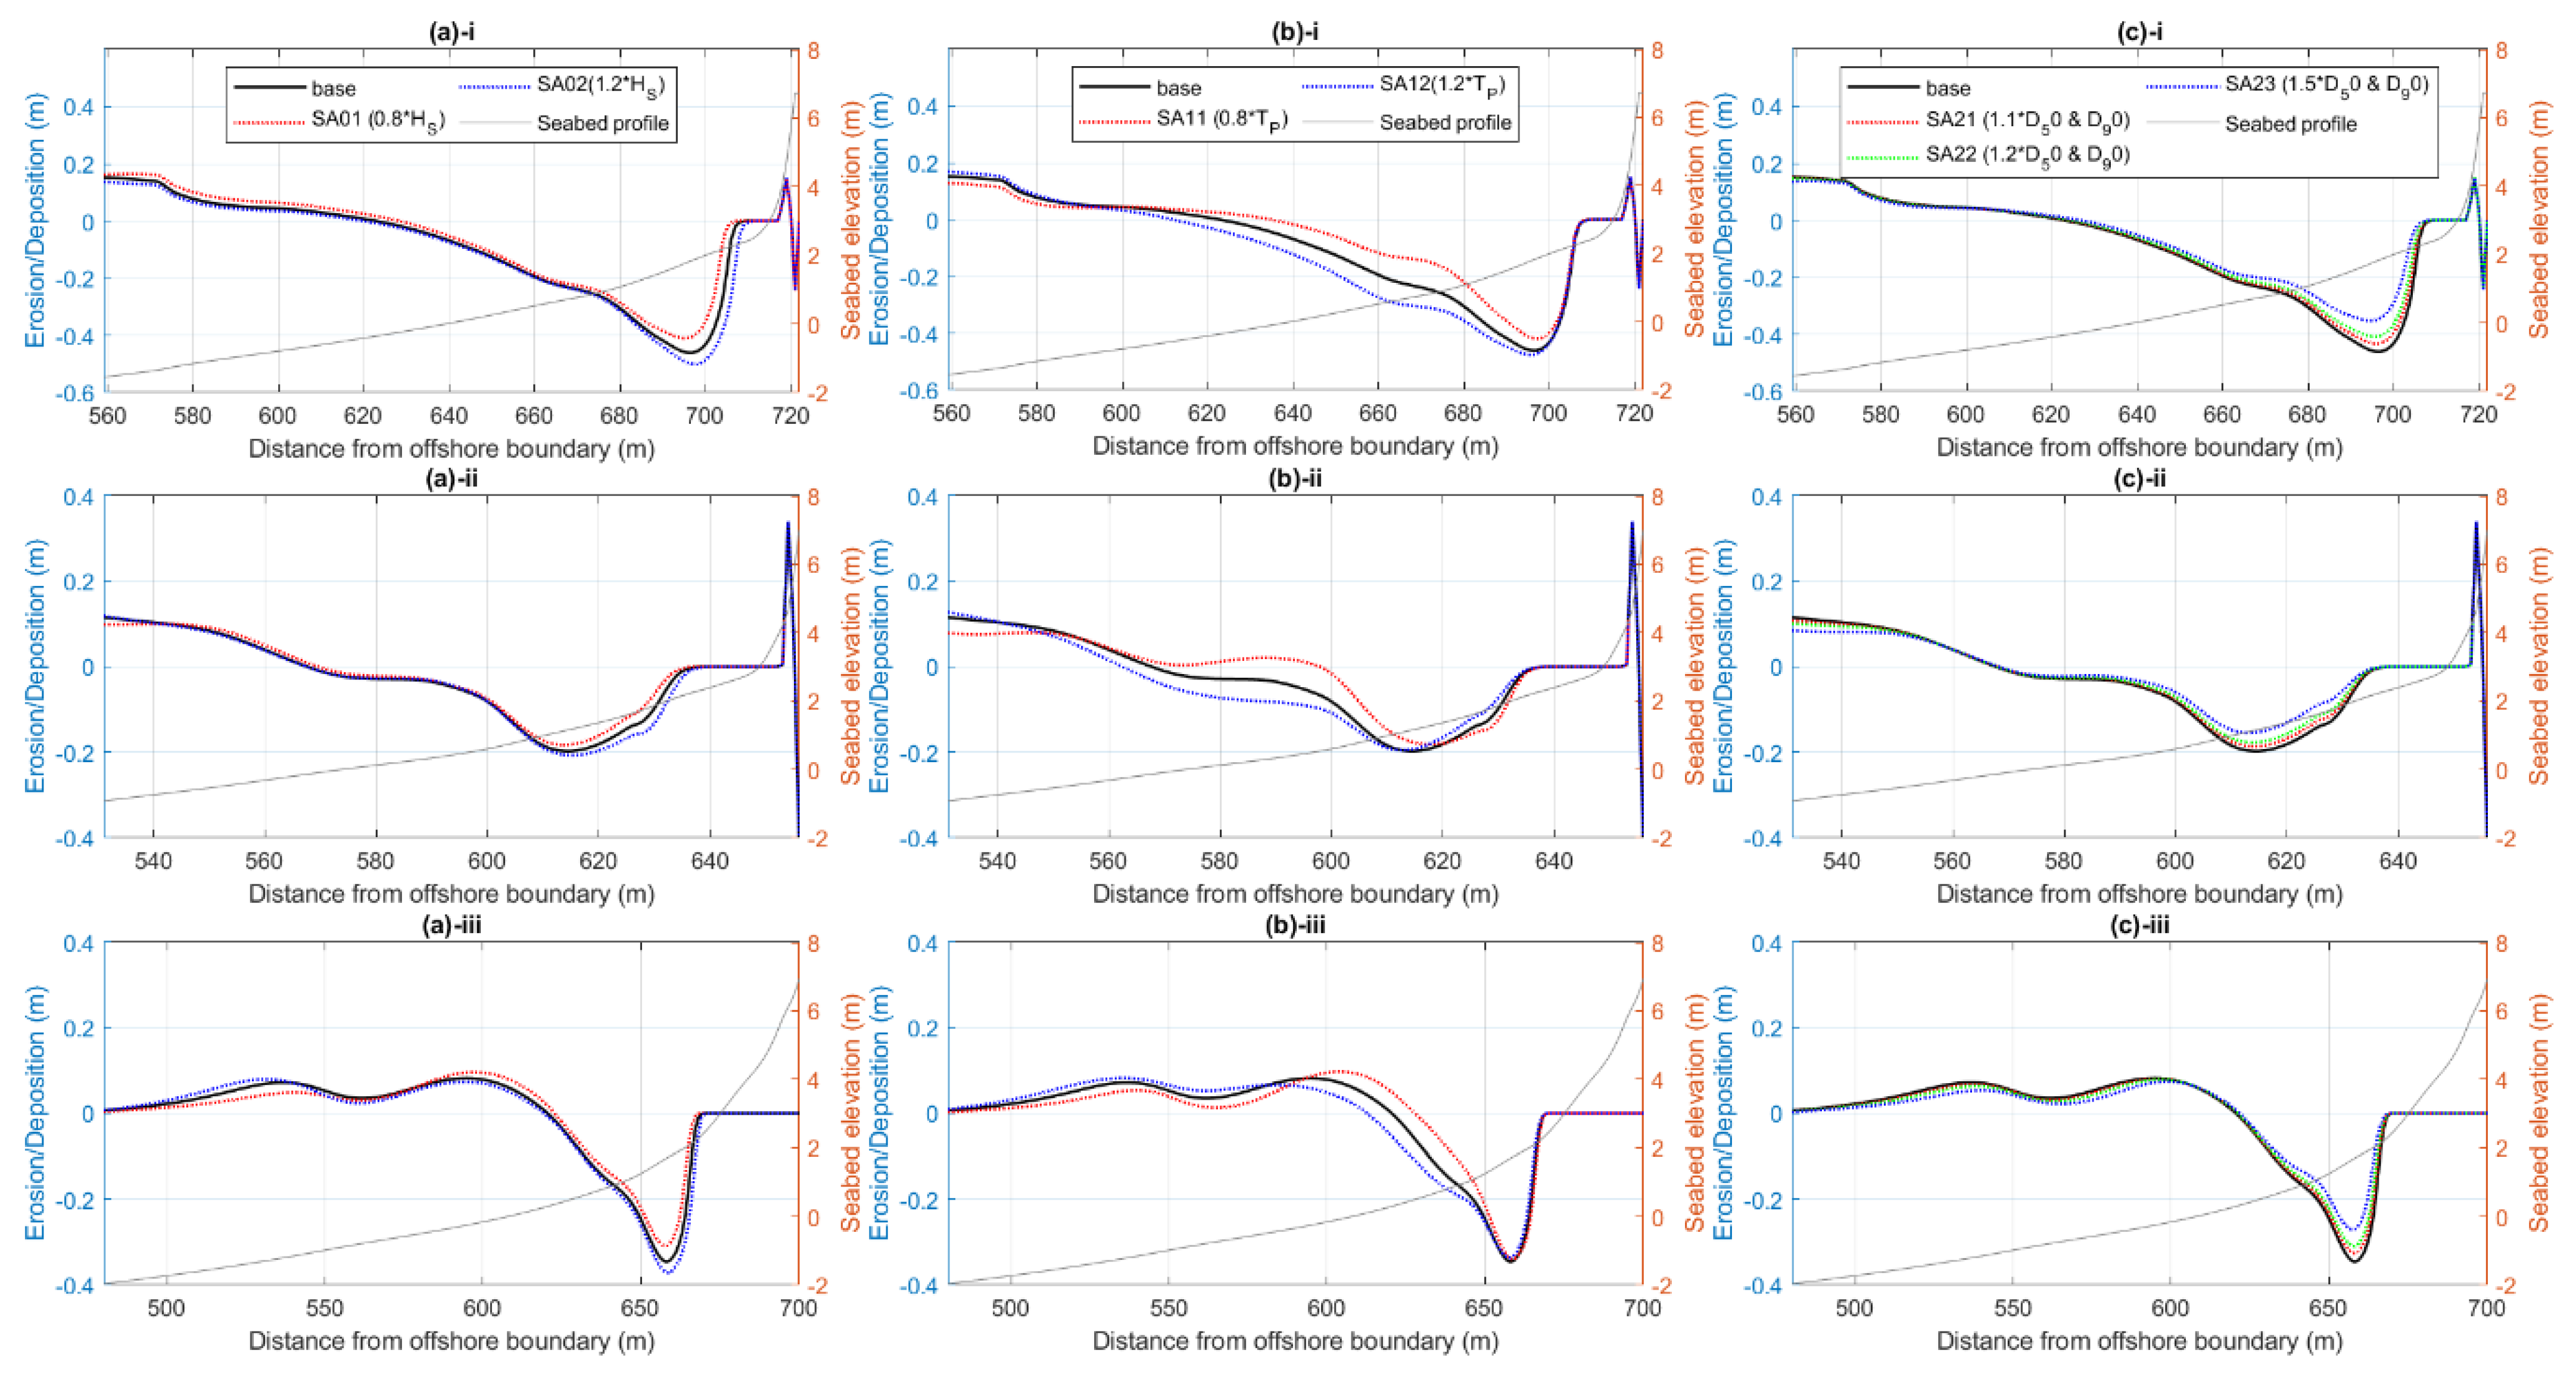
The sensitivity of the model to changes in the forcing wave data and beach sediment diameter (D50 and D90) was assessed by comparing (1) the cumulative erosion and deposition from the new simulations with those of the original ‘baseline’ simulation and (2) the BSSs. For the former, the net change in elevation at each grid point of the profiles was computed; these are presented in Figure 12a for the HS scenarios (SA01 and SA02) and TP scenarios (SA11 and SA12), and in Figure 12b for the sediment characteristics scenarios (SA21, SA22 and SA23). The wave characteristics results show that stronger waves, characterised by larger HS or TP, result in increased erosion of the upper part of the beachface between MSL and HAT and thus increased deposition on the lower part of the beachface between LAT and MSL, and vice versa for weaker waves. They also show that the model is more sensitive to inaccuracies in wave period than wave height with larger magnitudes and extents of changes in elevation when the wave period is altered. The wave characteristics scenarios (Figure 12b) show that increasing HS and TP changed the location of where the shoreline started to erode. For example, in profile 2 (Figure 12(b-ii)), the erosion point is shifted approximately 40 m seaward from 600 m to 540 m when the period is increased from SA11 (20% lower TP) to SA12 (20% higher TP). Similar sensitivity trends were observed for the other profiles and for the HS scenarios. Therefore, waves with higher heights and longer periods are more capable of affecting the deeper seabed. Regarding sediment characteristics, increasing the particle size results in heavier material, which is more difficult to move and, therefore, less erosion of the upper beachface and consequentially less deposition on the lower beachface.
Figure 13 presents the BSS from the sensitivity analyses for the seven coastal profiles. Figure 13a examines sensitivity to HS by comparing the baseline model with SA01 and SA02, revealing that profiles 2, 3, and 6 achieved good-to-excellent BSS, while profiles 1 and 5 performed poorly. However, altering the wave height by 20%, either increasing or decreasing it, only slightly affected the BSS values for Profiles 2, 3, and 6. In contrast, the BSS for profile 5 changes by up to 0.5. This shows that the Xbeach model can be sensitive to the wave height input for certain conditions for a few profiles.
Figure 13b shows the impact of Tp prescription using models SA11 and SA12, revealing behaviour somewhat similar to the sensitivity test of HS. In profiles 4, 6, and 7, the model performance remained unaffected by a 20% increase or decrease in TP. However, in eastern profiles 1, 2, and 3, the model showed greater sensitivity to TP, with BSS values fluctuating between 0.4 and 0.7. Figure 12c shows the sensitivity to sediment grain size (D50 and D90) using models SA21, SA22, and SA23, which demonstrated consistent performance with slightly less variation. Notably, in profile 1, increasing D50 and D90 by 50% could change the BSS value by up to 0.5. Overall, the sensitivity tests on HS, TP, D50, and D90 show that inaccuracies in the prescription of these data can influence model performance under certain conditions, particularly depending on the wave driving forces and shoreline orientation.

4.1.2. Future Climate Scenarios

Sea-Level Rise
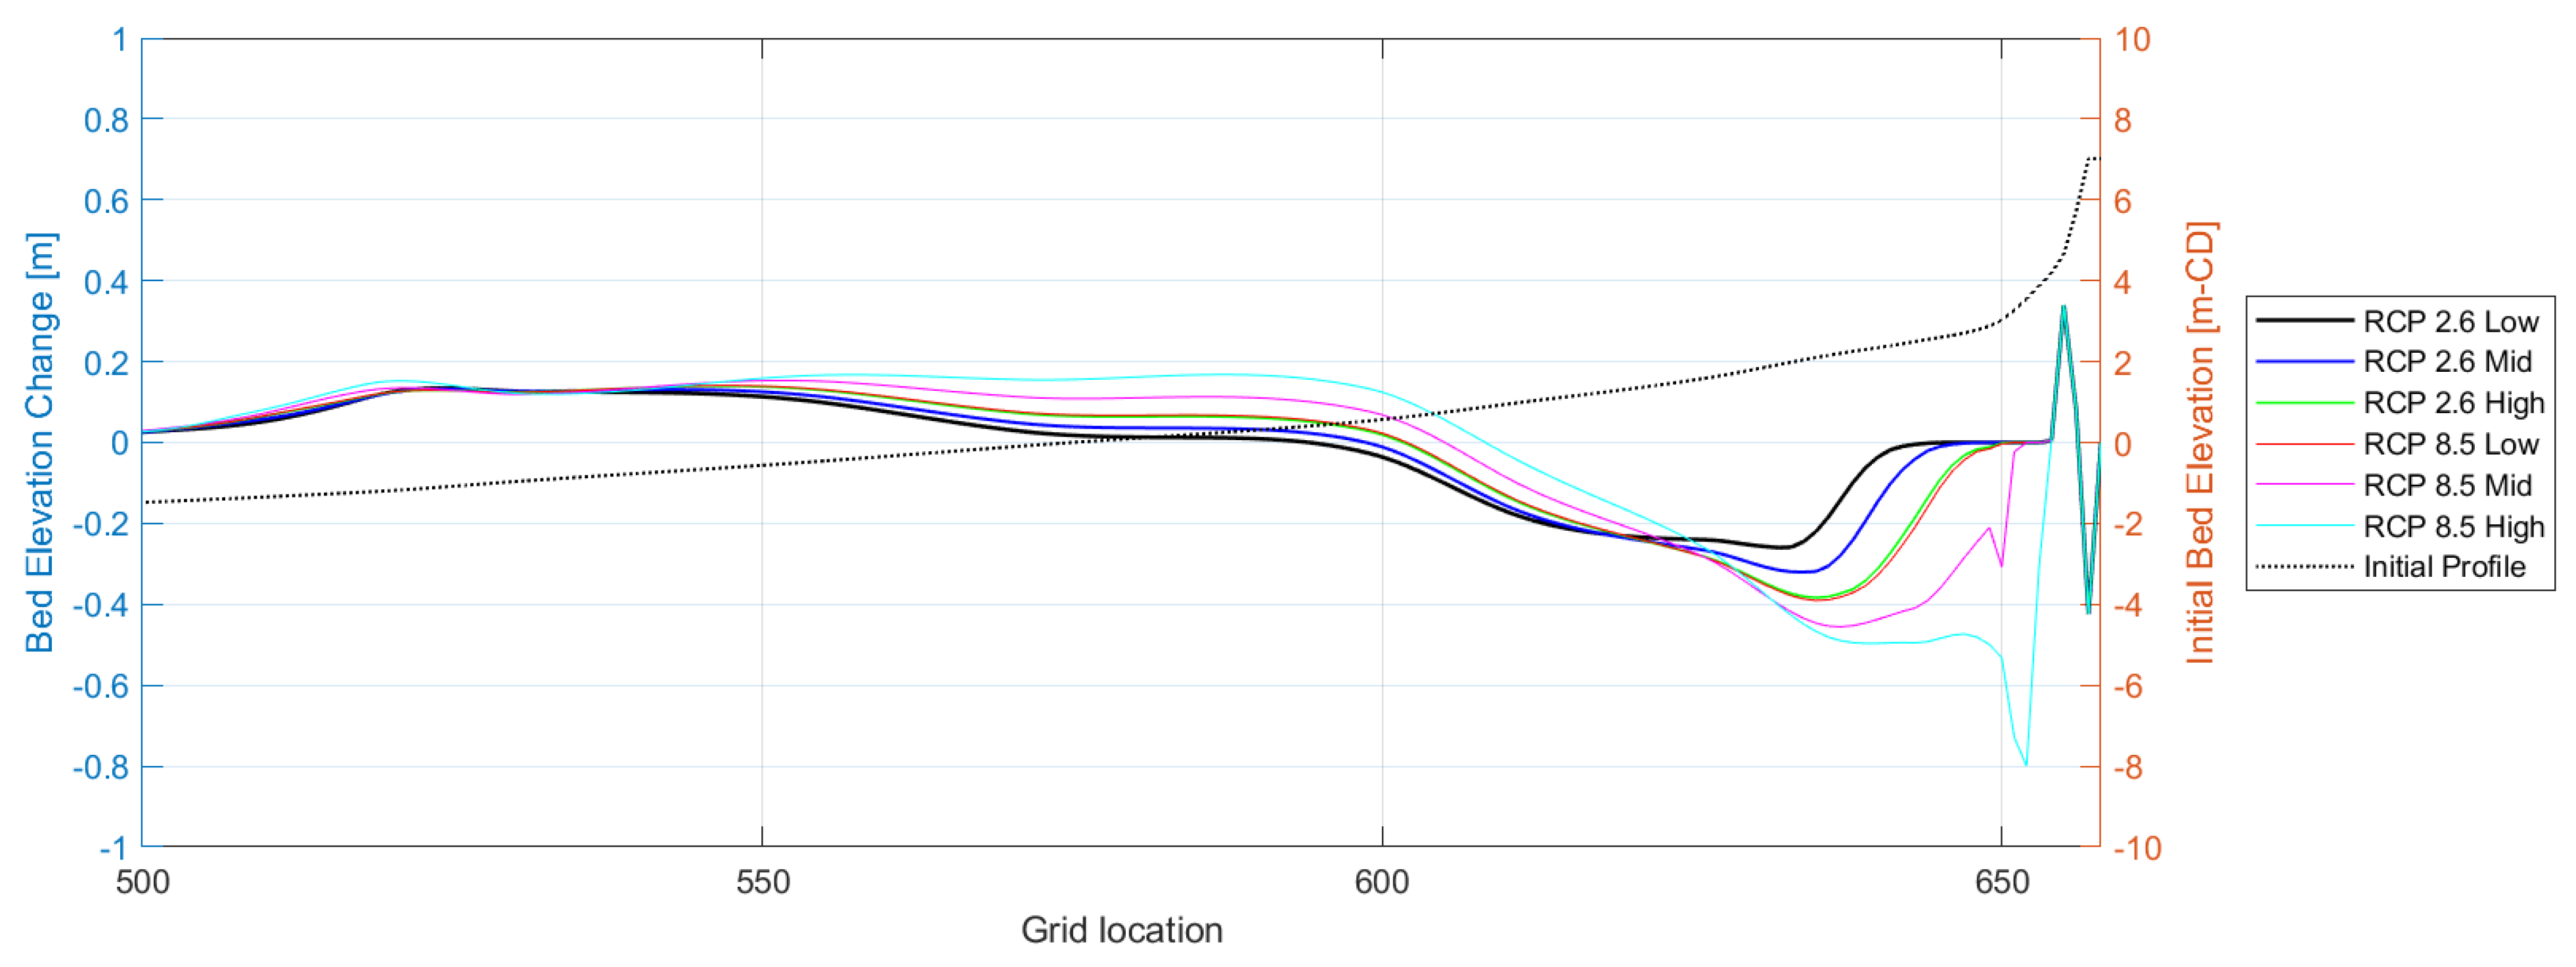
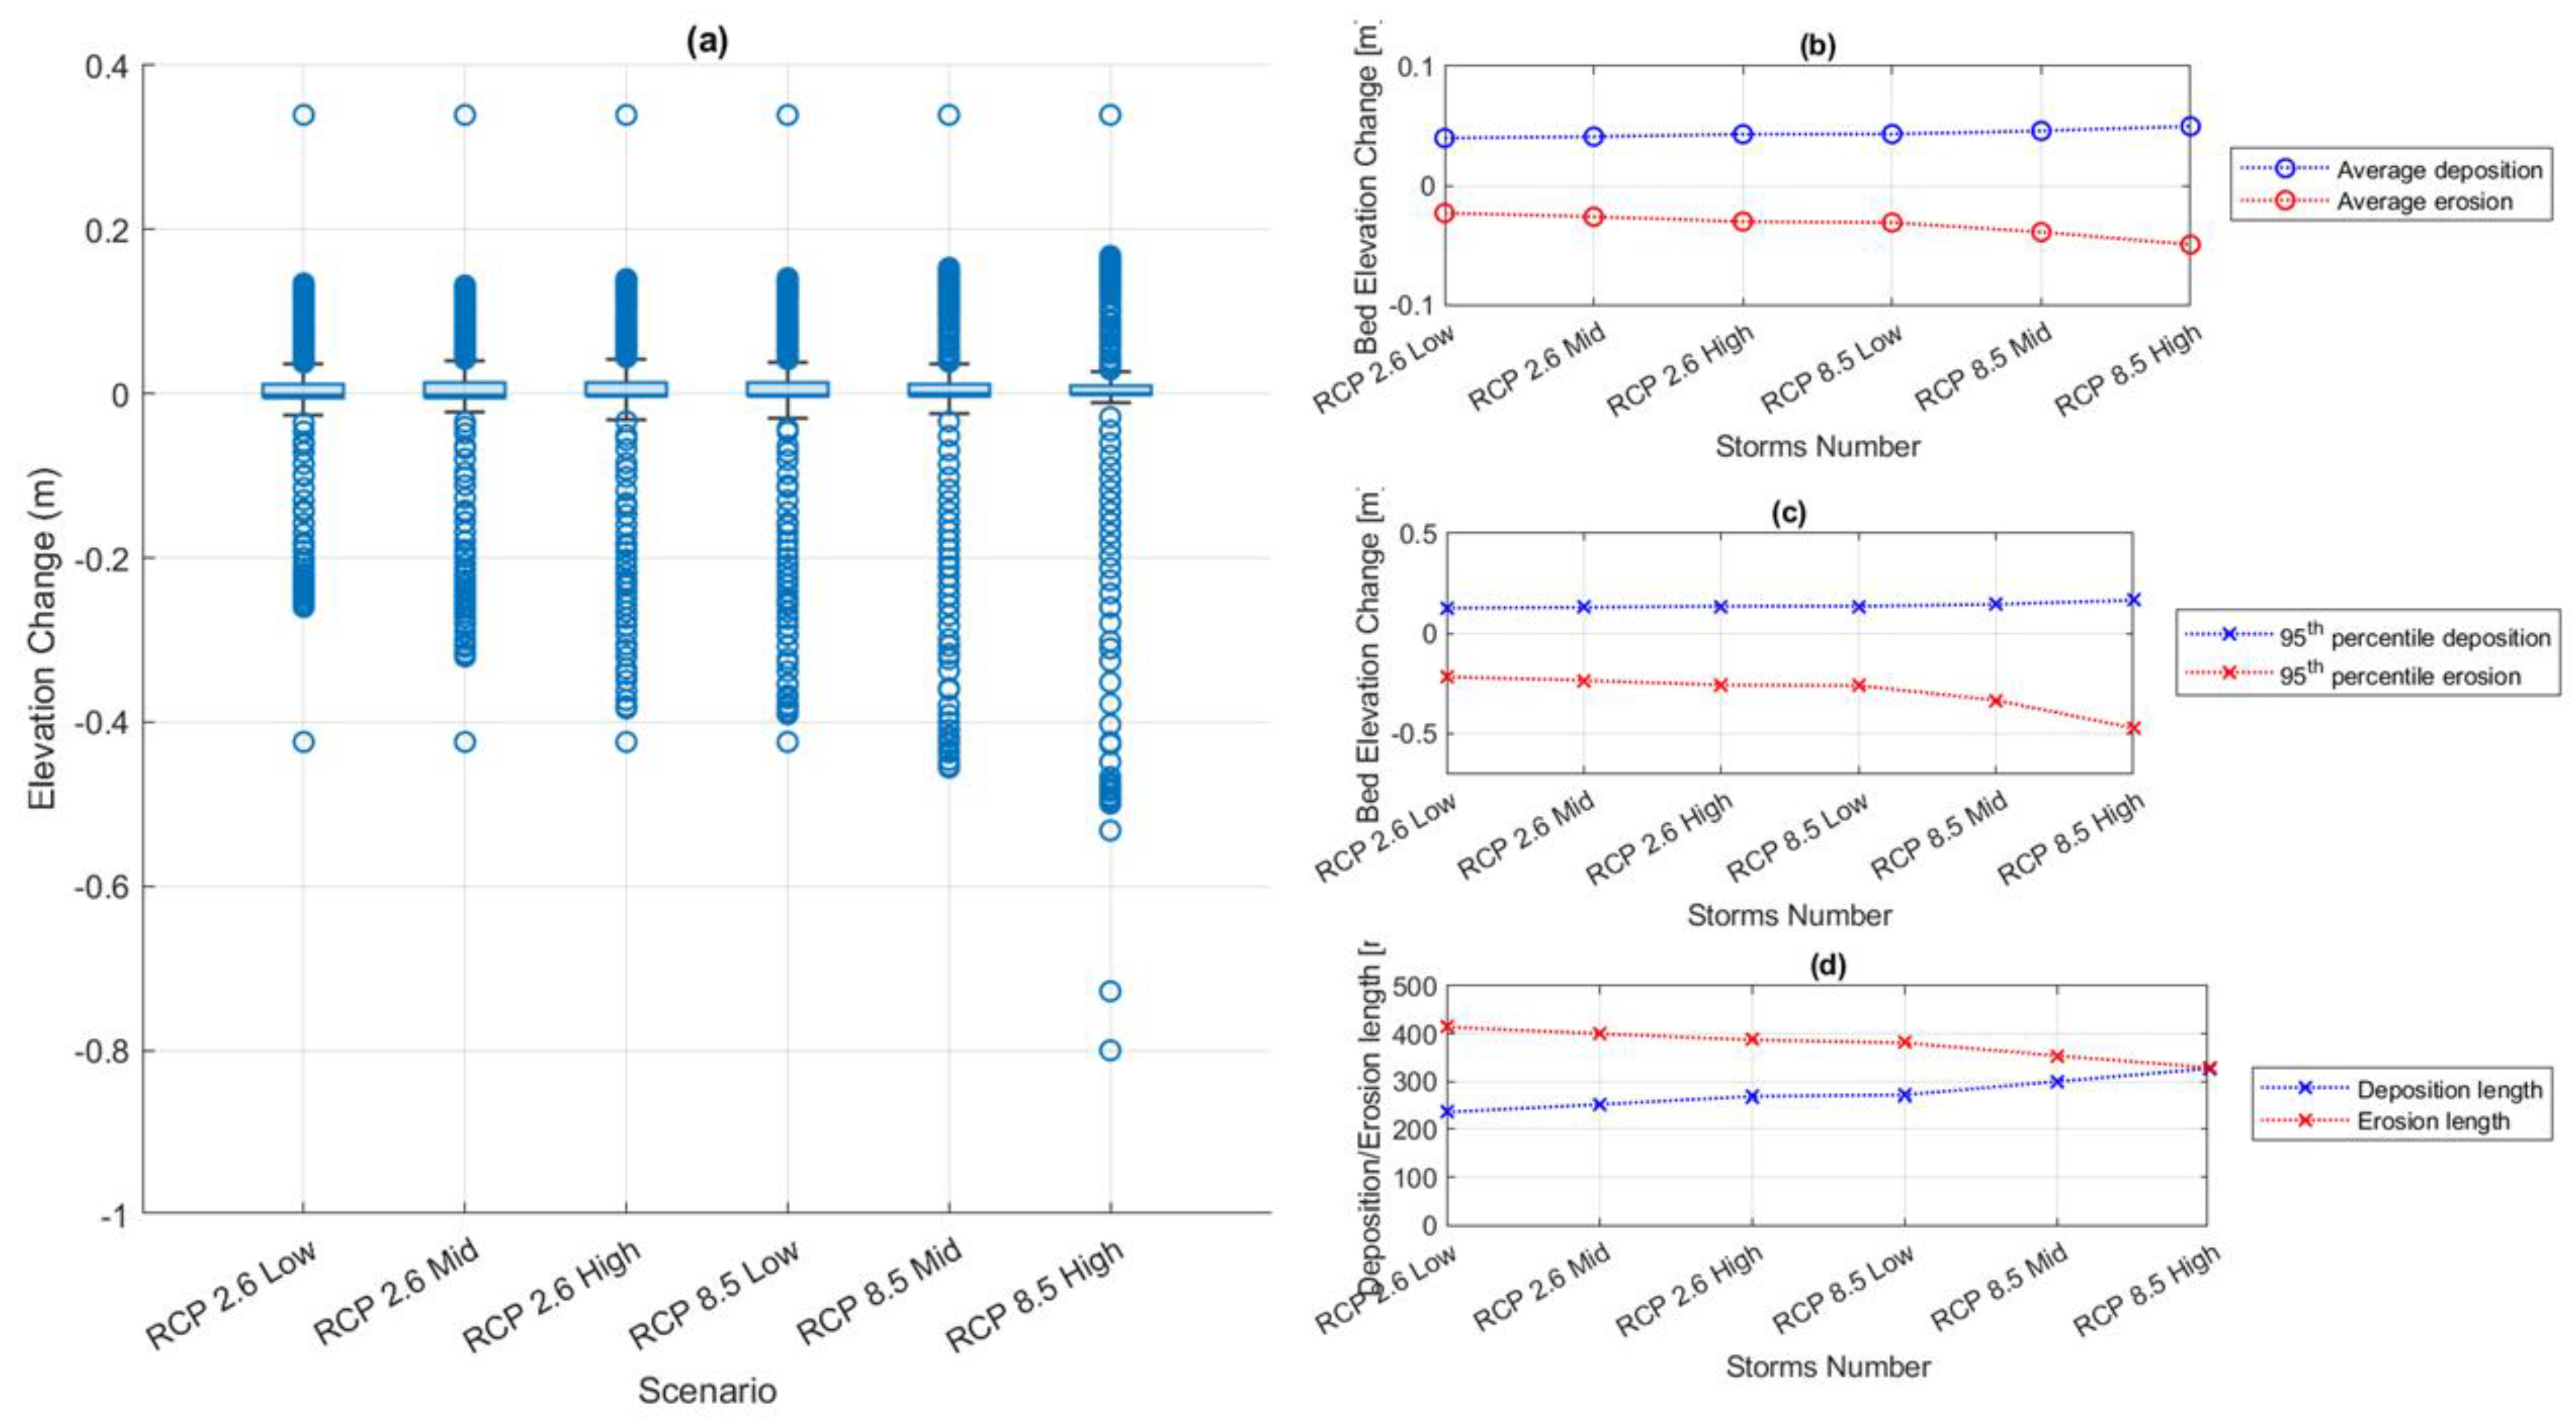
Figure 14 shows the changes in bed elevation of Profile 2 under different levels of sea-level rise (RCP2.6: low = 0.29 m, mid = 0.43 m, high = 0.58 m; RCP8.5: low = 0.61 m, mid = 0.85 m, high = 1.10 m). A statistical analysis of the changes is presented in Figure 10. The results show that sediment erosion and deposition rates will increase with a rise in sea level. However, although the statistical (average and 95th percentile) increase in erosion and deposition is linear, the values of the outliers show that erosion in a critical location in the upper beachface increases sharply with rise in sea level. For instance, the RCP 8.5 high sea level rise scenario causes erosion of 2.2 m in the upper beach compared to RCP 8.5 mid-range scenario where the erosion is only 1.0 m. The significant rise in erosion is a result of the sea level rise, which is pushing the wave runup further towards the land. This phenomenon is observed in the RCP 8.5 high scenario where the wave runup reaches the dune and triggers its avalanching. Conversely, when the sea level rise increases, the length of eroded portions of the beach reduces. This suggests that the erosion will be limited to the upper shoreline despite the overall increase in erosion as indicated by the statistical calculation presented in Figure 15.
Changing Wave Heights
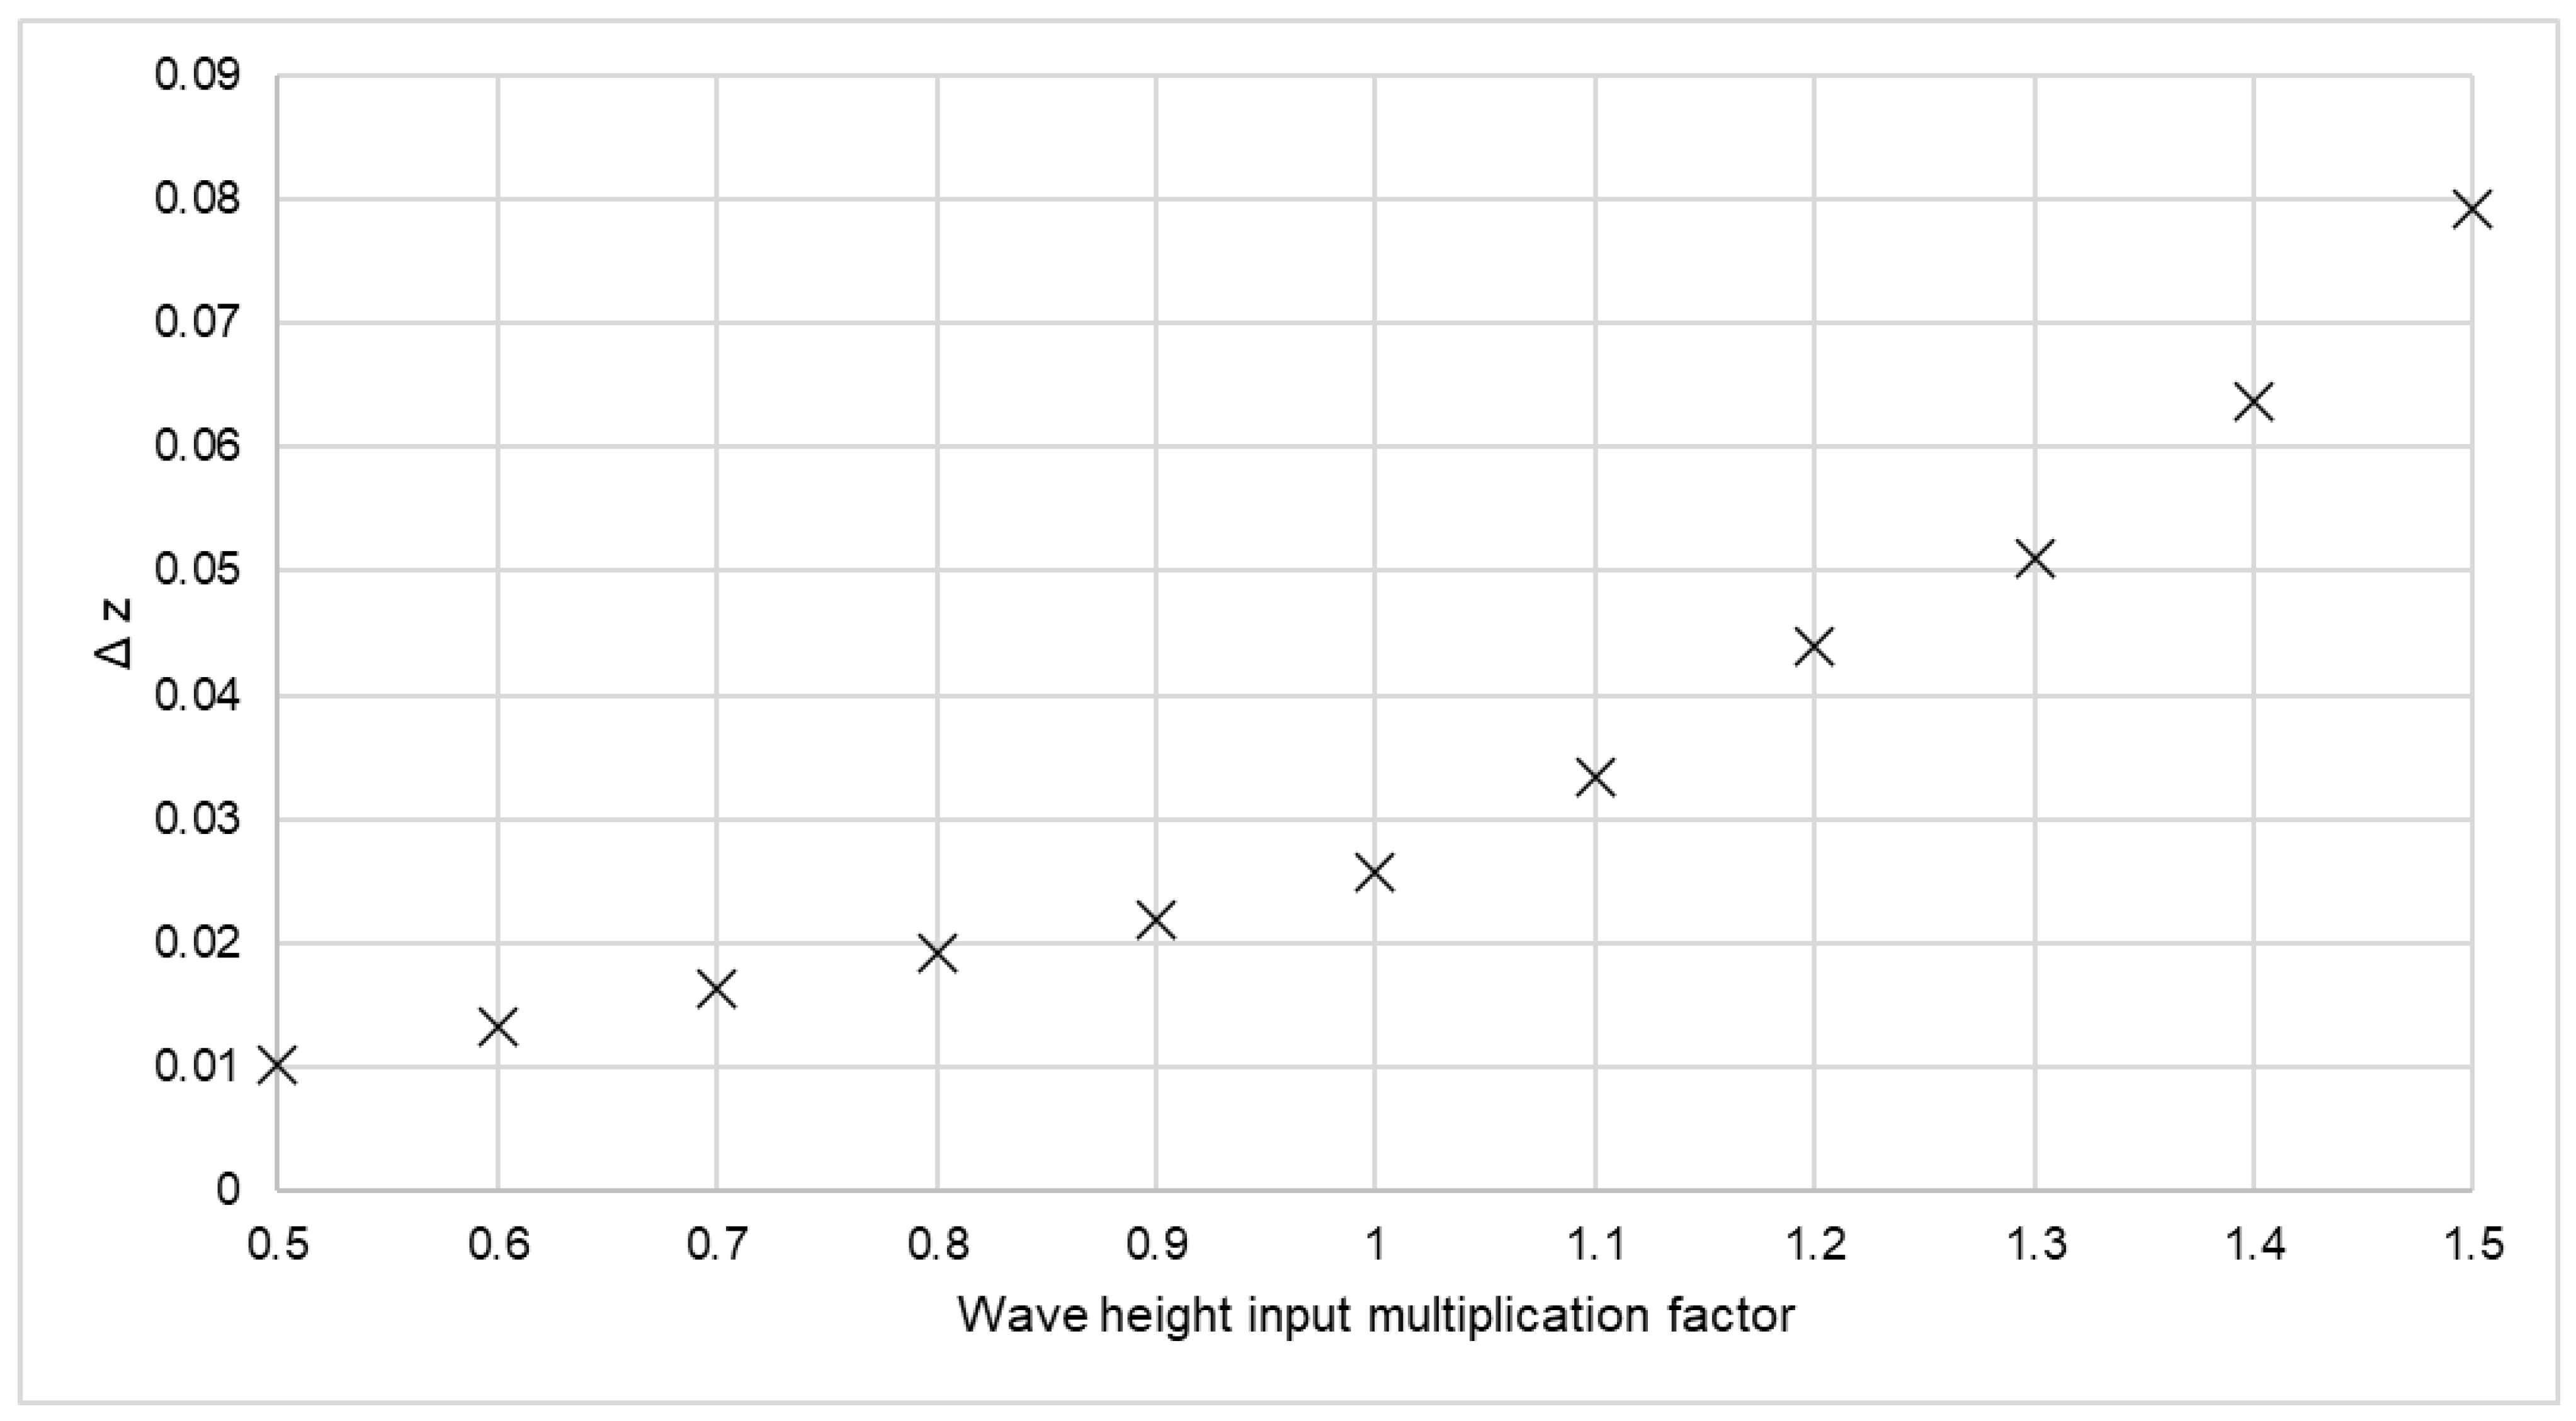
To compare the results of the model runs simulating future changes in wave heights, the mean absolute change in bed level (Δz) along the length of the beachface from LAT to HAT (which extends from −2 m to +2 m) was calculated for each model run; these are displayed in Figure 16. As might be expected, the model results indicate that the magnitudes of profile change, which include both erosion and deposition, are directly proportional to the wave height. Moreover, the change in beach elevation, represented by Δz, grows exponentially with the multiplication factor.
Greater Storm Frequency
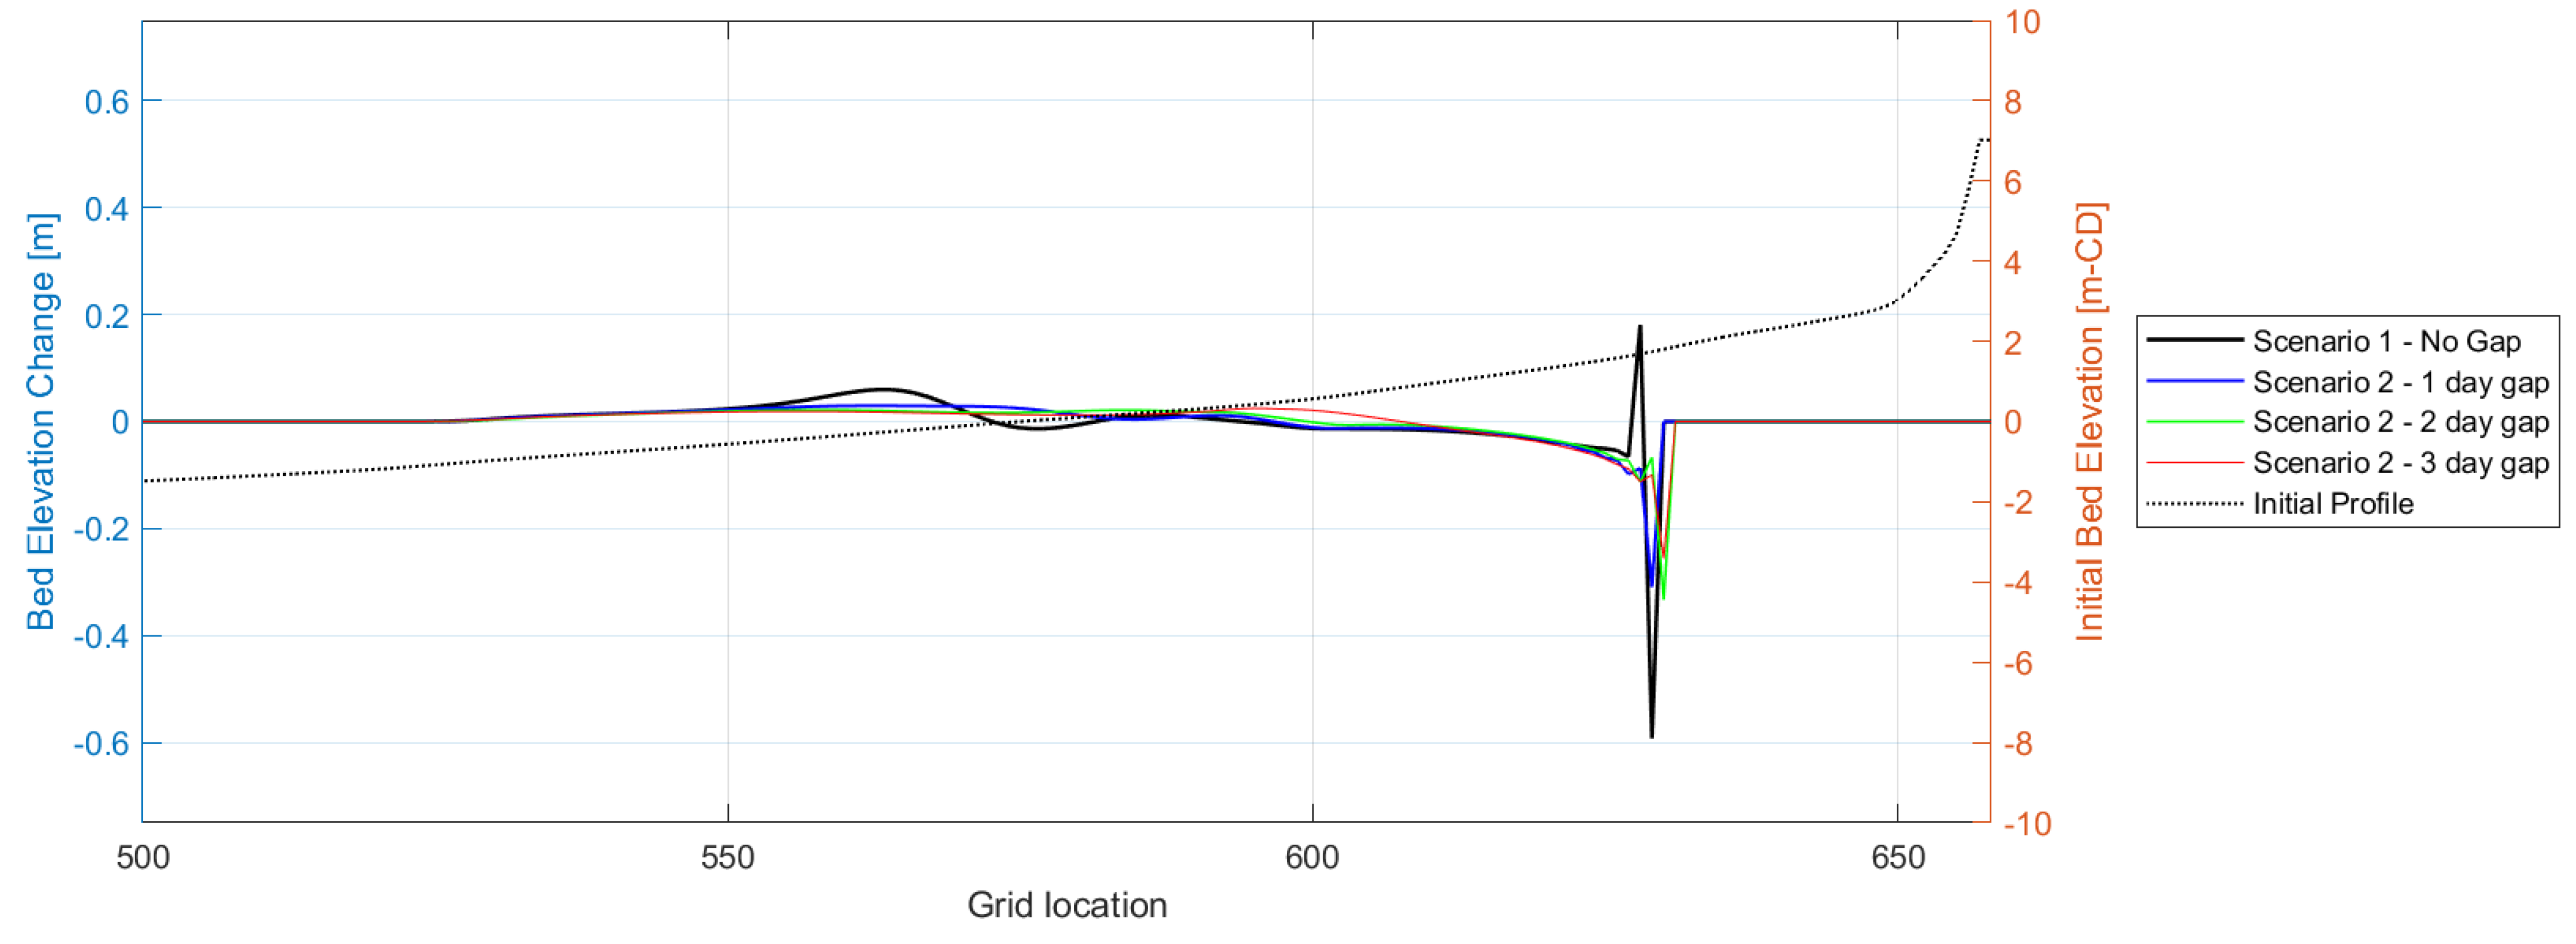
To investigate greater storm frequency, the model was run for two successive storms where the period between storms was varied from one to four days. For each simulation, the net erosion and deposition at each grid point along the profile were analysed across four different time periods: (1) during the entire simulation period, (2) during the first storm, (3) during the second storm and (4) during the calm period between storms. Figure 13 shows the changes in bed elevations resulting from the second storm for the different time intervals between storms. It reveals that a shorter duration between storms leads to more profound erosion in the upper part of the coastline, while the sandbar deposit on the lower beach shifts towards the offshore area (see Figure 17). A second area of erosion also develops on the landward side of the sandbar, and a secondary sandbar also develops immediately adjacent to that.
For the final storm sequence simulation of 6 storms occurring at a one-day frequency, Figure 18 shows the bed level changes for each storm event from the first to the sixth. The figure shows that later storms cause deeper and more localised erosion in the upper part of the beach compared to earlier ones. Simultaneously, the sand bar deposit on the lower beach migrates seawards with each successive storm. These phenomena were also evident in Figure 17, resulting from an increase in the interval between successive storms; however, the sandbar’s migration distance after six storm events (over six days) was significantly greater compared to the simulation with a similar time period, but only two storms separated by a three-day interval. For the former, the sand bar deposit is around 250 m from the dunes (grid 560–580) (Figure 19), compared to around 230 m (grid 590–610) for the latter. The box plots analysis of erosion and deposition levels at each grid point of the profile (Figure 19a) shows that the impact caused by the first storm is higher and reduces for the following storms. The mean and 95th percentile erosion are higher on the first storm and reduces for the following storms (Figure 19b). However, the mean and 95th percentile deposition reduces from the first to the second storm but then increases for each successive storm (Figure 19c). The length of the beach affected by erosion increases with successive storms while the deposition length decreases (Figure 19d).

5. Discussion

The field survey results confirm the classical erosional-depositional seasonal cycle observed on dissipative beaches: erosion and profile lowering during winter storms followed by recovery during calmer summer months [9,10]. All seven surveyed profiles showed significant beachface lowering between October 2021 and February 2022, with most sites displaying profile recovery by November 2022. These observations support prior findings that sediment transported offshore during storms may be naturally returned during fair-weather conditions, depending on local bathymetric and hydrodynamic conditions [9,12]. However, this single year of data is insufficient to confirm whether such recovery occurs consistently on an annual basis. To gain a more comprehensive understanding of the beach’s resilience and long-term trends, continued data collection over multiple years, using consistent survey locations and methodologies, is essential such as the past study carried out in Narrabeen Beach, Australia, by Turner et al. in 2016 using rich datasets available for 40 years [40].
The 1D XBeach model was employed to simulate sediment erosion under storm-driven conditions. XBeach has also been applied to locations with some similarities to Brandon Bay, namely, Liverpool Bay [2] and Dongsha Beach [41]. Both locations are bay systems that are exposed to large oceans. In those studies, the 2D XBeach model was applied to investigate storm-induced erosion in Liverpool Bay and longshore sediment transport in Dongsha Beach. However, Ref. [2] also used the 1D XBeach model during their study of 5 beach profiles and found that the model performed well in the beachface from upper to lower. A similar performance was found in the Brandon Bay study, where the XBeach results fit well with the survey data for the upper to lower beachface. In the fore-dune, the model was found to be less accurate in the Brandon Bay study, while in the Liverpool study the performance in the fore-dune is unknown because the storm wave considered was too weak (less than 1-year return period value). Past study reveals that the XBeach model was not so good in deeper water depth; this was also found in the Brandon Bay where the model tended to overestimate the deposition for areas deeper than 3.0 m below MSL [41].
The 1D XBeach model showed varying performance across the surveyed profiles, with BSS values ranging from −1.27 to 0.44. Good model performance was achieved at Profiles 2, 3 and 7, particularly in the lower and middle beach zones, where hydrodynamic forcing is more dominant and sediment transport is better understood. However, performance degraded substantially in the upper beach and dune zones, particularly at Profiles 1, 4 and 5. Using XBeach in 1D mode offers computational efficiency and allows for a clearer investigation of cross-shore processes. However, it necessarily neglects alongshore sediment transport, oblique wave effects, and three-dimensional morphodynamic feedbacks [42,43]. These simplifications can result in under- or overestimation of erosion at certain locations, especially in embayed beaches where edge effects, diffraction, and complex circulation patterns exist. Moreover, features such as rip channels, dune overwash, or inlet breaching, which have lateral components, cannot be captured in 1D. The spatial variability in model skill observed here likely reflects these limitations. In Profile 4, for example, the model underestimated upper beach and dune erosion, which may be due to lateral sediment redistribution occurring in reality but omitted in the simulation. Additionally, 1D models assume uniform sediment properties across the profile, which is inconsistent with field data from Brandon Bay showing considerable heterogeneity in sediment grain size. Such simplifications can significantly impact accuracy when calibrating erosion thresholds and sediment transport rates. Finally, XBeach only includes waves and tides as driving forces. Wind-driven sediment transport, which could influence dune evolution, is excluded.
The accuracy of input data can also affect model performance. The wave data used to force the model was obtained from a high-resolution SWAN model of the bay. Although this model was well-validated, it will not exactly match the wave conditions in the bay. Similarly, the tidal data was based on tidal constituent analysis of measured tide gauge data from the west of the bay and would not therefore exactly match the tidal conditions in the bay. The sediment data, although only five years old, may also have changed in the interim. Sensitivity analysis confirmed that small variations in wave forcing parameters—particularly wave period—can cause significant changes in predicted erosion extent and profile shape. Higher wave heights and longer wave periods result in greater erosion of the upper beach as they deliver more energy and higher runup, which allows them to reach and mobilise sediment between MSL and HAT. Sediment grain size also influenced erosion magnitudes, with finer sand producing greater landward erosion. Given the model’s sensitivity, efforts to improve site-specific input accuracy—particularly wave hindcasts and sediment sampling—are essential for credible erosion prediction.
Sea-level rise scenarios show a clear increase in erosion magnitude and frequency, particularly in the upper beachface and dune toe areas. Notably, the IPCC RCP8.5 high-end scenario (1.1 m rise) triggered significant dune erosion and collapse in the model, suggesting that Brandon Bay’s natural defences may become increasingly compromised under future climate trajectories. Although the overall length of the eroded zone decreased with sea level rise, the erosion became more concentrated and severe landward—a behaviour observed in other studies of shoreline recession under rising sea levels [15,16]. Future storm simulations further demonstrate the compounded effect of increased storminess. The results show that shorter intervals between storms reduce recovery time, leading to cumulative erosion and profile steepening. Moreover, the multiple-storm simulation showed that successive storms not only deepened erosion zones but also progressively displaced sandbars offshore. This trend aligns with findings from coastal systems exposed to storm clusters, where recovery lag exacerbates vulnerability to subsequent events [11,12]. Taken together, these simulations highlight that while Brandon Bay shows some capacity for natural recovery, the resilience of its beach-dune system is likely to decline under scenarios of accelerated sea level rise and increased storm frequency. The exposure of the eastern profiles to Atlantic storms makes this region particularly vulnerable.
Although not traditionally considered in coastal storm modelling, resonance effects may also play a role in amplifying wave energy in semi-enclosed bays like Brandon Bay. Resonance occurs when the natural period of a basin matches the period of incoming wave energy, resulting in constructive interference, increased wave amplitude, and prolonged inundation durations [44]. Under certain storm conditions—particularly long-period swell or infragravity waves—it is plausible that wave energy could resonate within the bay, enhancing wave runup and causing unexpectedly high erosion levels along specific profiles. Although resonance is well documented for tsunamis, similar mechanisms have been observed during storm events in narrow inlets and embayment [44].

6. Summary and Conclusions

Survey data and the 1D shoreline change model, XBeach, were used to study the short-term (19–25 February 2022) and long-term (October 2021 to November 2022) impact of storms on shoreline evolution in Brandon Bay. Observed cross-section profiles were input to a suite of XBeach models to simulate the effects of Storm Franklin on beach response. The wave forcings for the XBeach models were obtained from a local nested SWAN model simulation. The results provide valuable insight into how such systems respond to both individual storm events and longer-term climatic pressures, including sea level rise. The main conclusions from the study are as follows:
  • The field survey results corroborate the classical seasonal erosion-deposition cycle typical of dissipative beaches, with significant winter storm-driven erosion (up to 1 m) and subsequent summer recovery However, long-term monitoring is needed to assess interannual variability and resilience.
  • The 1D XBeach model effectively captured sediment erosion patterns on the mid and lower beachface, but showed lower accuracy on the upper beach and dune erosion. These discrepancies likely arise from the inherent simplifications of 1D modelling such as omission of alongshore processes and assumption of sediment heterogeneity. Model sensitivity to uncertainty in forcing wave data and sediment grain size highlights the importance of high-quality input data.
  • Simulations incorporating sea-level rise scenarios indicate intensified erosion and dune vulnerability, particularly under high-end projections, while an increase in the frequency of storm events exacerbates cumulative erosion and impedes recovery. These are significant finding in light of future climate change.
  • The approaches and findings from this study extend beyond Brandon Bay. The modelling framework, parameter sensitivity analysis, and discussion of equilibrium recovery trajectories are applicable to similar wave-dominated coastal embayments with dissipative beaches. The methods applied here can inform coastal risk assessments, climate adaptation planning, and management strategies in diverse geographical contexts. Furthermore, the integration of near-term storm modelling with long-term scenario-based analysis underscores the need for dynamic, process-based tools in managing increasingly vulnerable coastal environments.

Author Contributions

Conceptualization, A.E., E.F., G.I. and S.N.; methodology, A.E., G.I. and S.N.; software, A.E.; validation, A.E., G.I. and S.N.; formal analysis, A.E. and S.N.; investigation, A.E., E.F. and S.N.; resources, E.F. and S.N.; data curation, A.E. and E.F.; writing—original draft preparation, A.E.; writing—review and editing, S.N.; visualization, A.E.; supervision, S.N.; project administration, S.N.; funding acquisition, S.N. All authors have read and agreed to the published version of the manuscript.

Funding

This research was supported by funding from Research Ireland Ireland through the MaREI Research Centre for Energy, Climate and Marine (Grant no. 12/R.C./2302), Geological Survey Ireland through their Geoscience Research Programme (Grant no. 2020-SC-013) and Marine Institute under the Marine Research Programme by the Government of Ireland (Grant-Aid Agreement No. PDOC/21/02/02).

Data Availability Statement

The data presented in this study are available on request from the corresponding author.

Acknowledgments

The team would like to acknowledge research support from local landowners and voluntary coastal group (Maharees Conservation Association). The team would like to thanks Marine Institute and Infomar for access to their data, and ICHEC for running SWAN models simulation.

Conflicts of Interest

The authors declare no conflict of interest.

References

  1. Dissanayake, P.; Brown, J.; Wisse, P.; Karunarathna, H. Effects of Storm Clustering on Beach/Dune Evolution. Mar. Geol. 2015, 370, 63–75. [Google Scholar] [CrossRef]
  2. Dissanayake, P.; Brown, J.; Karunarathna, H. Modelling Storm-Induced Beach/Dune Evolution: Sefton Coast, Liverpool Bay, UK. Mar. Geol. 2014, 357, 225–242. [Google Scholar] [CrossRef]
  3. Berard, N.A.; Mulligan, R.P.; da Silva, A.M.F.; Dibajnia, M. Evaluation of XBeach Performance for the Erosion of a Laboratory Sand Dune. Coast. Eng. 2017, 125, 70–80. [Google Scholar] [CrossRef]
  4. Itzkin, M.; Moore, L.J.; Ruggiero, P.; Hacker, S.D.; Biel, R.G. The Relative Influence of Dune Aspect Ratio and Beach Width on Dune Erosion as a Function of Storm Duration and Surge Level. Earth Surf. Dyn. 2021, 9, 1223–1237. [Google Scholar] [CrossRef]
  5. Ranasinghe, R.; Callaghan, D.P.; Li, F.; Wainwright, D.J.; Duong, T.M. Assessing Coastline Recession for Adaptation Planning: Sea Level Rise versus Storm Erosion. Sci. Rep. 2023, 13, 8286. [Google Scholar] [CrossRef]
  6. Coco, G.; Senechal, N.; Rejas, A.; Bryan, K.R.; Capo, S.; Parisot, J.; Brown, J.A.; MacMahan, J.H. Beach Response to a Sequence of Extreme Storms. Geomorphology 2014, 204, 493–501. [Google Scholar] [CrossRef]
  7. Wright, L.D.; Short, A.D. Morphodynamic Variability of Surf Zones and Beaches: A Synthesis. Mar. Geol. 1984, 56, 93–118. [Google Scholar] [CrossRef]
  8. Aagaard, T.; Greenwood, B.; Hughes, M. Sediment Transport on Dissipative, Intermediate and Reflective Beaches. Earth-Sci. Rev. 2013, 124, 32–50. [Google Scholar] [CrossRef]
  9. Short, A.D.; Hesp, P.A. Wave, Beach and Dune Interactions in Southeastern Australia. Mar. Geol. 1982, 48, 259–284. [Google Scholar] [CrossRef]
  10. Roelvink, D.; Reniers, A.; Van Dongeren, A.; De Vries, J.V.T.; McCall, R.; Lescinski, J. Modelling Storm Impacts on Beaches, Dunes and Barrier Islands. Coast. Eng. 2009, 56, 1133–1152. [Google Scholar] [CrossRef]
  11. Sallenger, A.H., Jr. Storm Impact Scale for Barrier Islands. J. Coast. Res. 2000, 16, 890–895. [Google Scholar]
  12. Morton, R.A.; Paine, J.G.; Gibeaut, J. Stages and Durations of Post-Storm Beach Recovery, Southeastern Texas Coast, USA. J. Coast. Res. 1994, 10, 884–908. [Google Scholar]
  13. Leeder, M.R. Sedimentology: Process and Product; Chapman & Hall: London, UK, 1994; ISBN 13:978-0-412-53300-6. [Google Scholar]
  14. Masselink, G.; Castelle, B.; Scott, T.; Dodet, G.; Suanez, S.; Jackson, D.; Floc’h, F. Extreme Wave Activity during 2013/2014 Winter and Morphological Impacts along the Atlantic Coast of Europe. Geophys. Res. Lett. 2016, 43, 2135–2143. [Google Scholar] [CrossRef]
  15. Ranasinghe, R. Assessing Climate Change Impacts on Open Sandy Coasts: A Review. Earth-Sci. Rev. 2016, 160, 320–332. [Google Scholar] [CrossRef]
  16. Vousdoukas, M.I.; Mentaschi, L.; Voukouvalas, E.; Bianchi, A.; Dottori, F.; Feyen, L. Climatic and Socioeconomic Controls of Future Coastal Flood Risk in Europe. Nat. Clim. Change 2018, 8, 776–780. [Google Scholar] [CrossRef]
  17. Gorski, J.F.; Dietrich, J.C.; Passeri, D.L.; Mickey, R.C.; Luettich, R.A., Jr. Deterministic, Dynamic Model Forecasts of Storm-Driven Coastal Erosion. Nat. Hazards 2025, 121, 6257–6283. [Google Scholar] [CrossRef]
  18. Turner, I.L.; Leaman, C.K.; Harley, M.D.; Thran, M.C.; David, D.R.; Splinter, K.D.; Matheen, N.; Hansen, J.E.; Cuttler, M.V.W.; Greenslade, D.J.M.; et al. A Framework for National-Scale Coastal Storm Hazards Early Warning. Coast. Eng. 2024, 192, 104571. [Google Scholar] [CrossRef]
  19. O’Neill, A.C.; Nederhoff, K.; Erikson, L.H.; Thomas, J.A.; Barnard, P.L. A Dataset of Two-Dimensional XBeach Model Set-Up Files for Northern California. Data 2024, 9, 118. [Google Scholar] [CrossRef]
  20. Suzuki, T.; Cox, D.T. Evaluating XBeach Performance for Extreme Offshore-Directed Sediment Transport Events on a Dissipative Beach. Coast. Eng. J. 2021, 63, 517–531. [Google Scholar] [CrossRef]
  21. Chataigner, T.; Yates, M.L.; Le Dantec, N.; Harley, M.; Splinter, K.; Goutal, N. Sensitivity of a One-Line Longshore Shoreline Change Model to the Mean Wave Direction. Coast. Eng. 2022, 172, 104025. [Google Scholar] [CrossRef]
  22. Yu, H.; Weng, Z.; Chen, G.; Chen, X. Improved XBeach Model and Its Application in Coastal Beach Evolution under Wave Action. Coast. Eng. J. 2023, 65, 560–571. [Google Scholar] [CrossRef]
  23. Stockdon, H.F.; Thompson, D.M.; Plant, N.G.; Long, J.W. Evaluation of Wave Runup Predictions from Numerical and Parametric Models. Coast. Eng. 2014, 92, 1–11. [Google Scholar] [CrossRef]
  24. Chardón-Maldonado, P.; Pintado-Patiño, J.C.; Puleo, J.A. Advances in Swash-Zone Research: Small-Scale Hydrodynamic and Sediment Transport Processes. Coast. Eng. 2016, 115, 8–25. [Google Scholar] [CrossRef]
  25. Sutherland, J.; Peet, A.; Soulsby, R. Evaluating the Performance of Morphological Models. Coast. Eng. 2004, 51, 917–939. [Google Scholar] [CrossRef]
  26. Vousdoukas, M.I.; Almeida, L.; Ferreira, Ó. Modelling Storm-Induced Beach Morphological Change in a Meso-Tidal, Reflective Beach Using XBeach. J. Coast. Res. 2011, 64, 1916–1920. [Google Scholar]
  27. Williams, J.J.; de Alegría-Arzaburu, A.R.; McCall, R.T.; Van Dongeren, A. Modelling Gravel Barrier Profile Response to Combined Waves and Tides Using XBeach: Laboratory and Field Results. Coast. Eng. 2012, 63, 62–80. [Google Scholar] [CrossRef]
  28. RTE. How Healthy Kerry Sand Dunes Are Worth €9 Million a Year 2020. Available online: https://www.rte.ie/brainstorm/2024/0808/1124306-sand-dunes-maharees-kerry-economics-wild-atlantic-way/ (accessed on 1 September 2025).
  29. Met-Éireann Met.Ie, The Irish Meteorological Service Online, Storm Centre 2022. Available online: https://www.met.ie/climate/storm-centre (accessed on 1 September 2025).
  30. Egon, A.; Nash, S.; Farrell, E.; Fennell, S.; Iglesias, G. Development of Nested Local Scale Wave Model for Storm Study in Brandon Bay Using SWAN. In Proceedings of the 39th IAHR World Congress, Granada, Spain, 19 June 2022. [Google Scholar]
  31. Scullion, A. An Investigation of Sediment Transport Pathways and Shoreline Position Evolution in Brandon Bay, Co. Kerry. Master’s Thesis, National University of Ireland Galway, Galway, Ireland, 2017. [Google Scholar]
  32. Nuyts, S.; Farrell, E.J.; Fennell, S.; Nash, S. An Assessment of the Role of the Timex Sampling Strategy on the Precision of Shoreline Detection Analysis. Coasts 2024, 4, 347–365. [Google Scholar] [CrossRef]
  33. Komar, P.D. Beach Processes and Sedimentation; Prentice Hall: Upper Saddle River, NJ, USA, 1977. [Google Scholar]
  34. Bosboom, J.; Stive, M.J.F. Coastal Dynamics; TU Delft OPEN Publishing: Delft, The Netherlands, 2021; ISBN 978-94-6366-371-7. [Google Scholar]
  35. Davidson, M.; Lewis, R.; Turner, I. Forecasting Seasonal to Multi-Year Shoreline Change. Coast. Eng. 2010, 57, 620–629. [Google Scholar] [CrossRef]
  36. Williams, J.; Esteves, L.; Rochford, L. Modelling Storm Responses on a High-Energy Coastline with XBeach. Model. Earth Syst. Environ. 2015, 1, 3. [Google Scholar] [CrossRef]
  37. Williams, J.J.; Esteves, L.S. Guidance on Setup, Calibration, and Validation of Hydrodynamic, Wave, and Sediment Models for Shelf Seas and Estuaries. Adv. Civ. Eng. 2017, 2017, 5251902. [Google Scholar] [CrossRef]
  38. van Rijn, L.C.; Walstra, D.J.; Grasmeijer, B.; Sutherland, J.; Pan, S.; Sierra, J. The Predictability of Cross-Shore Bed Evolution of Sandy Beaches at the Time Scale of Storms and Seasons Using Process-Based Profile Models. Coast. Eng. 2003, 47, 295–327. [Google Scholar] [CrossRef]
  39. IPCC Special Report on the Ocean and Cryosphere in a Changing Climate; IPCC: Geneva, Switzerland, 2019; Available online: https://www.ipcc.ch/site/assets/uploads/sites/3/2019/12/SROCC_FullReport_FINAL.pdf (accessed on 1 September 2025).
  40. Turner, I.L.; Harley, M.D.; Short, A.D.; Simmons, J.A.; Bracs, M.A.; Phillips, M.S.; Splinter, K.D. A Multi-Decade Dataset of Monthly Beach Profile Surveys and Inshore Wave Forcing at Narrabeen, Australia. Sci. Data 2016, 3, 160024. [Google Scholar] [CrossRef]
  41. Liu, X.; Kuang, C.; Huang, S.; He, L.; Han, X. Modelling and Evaluation of Beach Morphodynamic Behavior: A Case Study of Dongsha Beach in Eastern China. Ocean Coast. Manag. 2023, 240, 106661. [Google Scholar] [CrossRef]
  42. Roelvink, D.; Reniers, A.; Van Dongeren, A.; Van Thiel de Vries, J.; Lescinski, J.; McCall, R. XBeach Model Description and Manual. Unesco-IHE Inst. Water Educ. Deltares Delft Univ. Tecnhology. Rep. 2010, 21, 2. [Google Scholar]
  43. de Vries, J.v.T.; Van Gent, M.; Walstra, D.; Reniers, A. Analysis of Dune Erosion Processes in Large-Scale Flume Experiments. Coast. Eng. 2008, 55, 1028–1040. [Google Scholar] [CrossRef]
  44. Wang, Y.; Zamora, N.; Quiroz, M.; Satake, K.; Cienfuegos, R. Tsunami Resonance Characterization in Japan Due to trans-Pacific Sources: Response on the Bay and Continental Shelf. J. Geophys. Res. Ocean. 2021, 126, e2020JC017037. [Google Scholar] [CrossRef]
Figure 1. Brandon Bay location map and the seven cross-shore profile survey locations.
Coasts 05 00032 g001
Figure 2. Two-dimensional contour maps of mean annual Hs (a) and mean direction (b) based on 7 years of modelled wave data (1 March 2015–28 February 2022) [30].
Coasts 05 00032 g002
Figure 3. Modelled Hs near Profile 1 for 1 October 2021 to 28 February 2022. The dashed black line indicates the Hs 5% exceedance threshold of 3.3 m used for storm identification.
Coasts 05 00032 g003
Figure 4. SWAN local model validation against observed data from wave-rider for parameter (a-1) HS, (a-2) Tp, (a-3) Direction for observed data (black line) and model simulation result (red line) and (b) 2D bathymetry for SWAN local model after [30].
Coasts 05 00032 g004
Figure 5. (a) Significant wave heights and (b) peak wave periods output from the nested SWAN model offshore from Profiles 2 (East) and 7 (West) for short-term storm simulation.
Coasts 05 00032 g005
Figure 6. Cross-shore profiles at the start and end of the model simulations for profiles 1 to 7 (ag). The starting profiles are those measured on 19 February. The profiles measured on 25 February are included for comparison with the final modelled profiles.
Coasts 05 00032 g006
Figure 7. BSS for XBeach model validation against the survey data.
Coasts 05 00032 g007
Figure 8. Wave parameters input for two successive storm scenarios assessment for (a) without gap; (b) a day gap; (c) 2 days gap; and (d) 3 days gap.
Coasts 05 00032 g008aCoasts 05 00032 g008b
Figure 9. Wave parameters input for six successive storm scenarios assessment.
Coasts 05 00032 g009
Figure 10. Comparison of beach profiles observed in October 2021, 19 February 2022, and November 2022 for profiles 1 to 7 (ag).
Coasts 05 00032 g010
Figure 11. Box plot analysis of vertical elevation changes for (a) the lower beach, (b) the middle beach and (c) the upper beach for the periods (i) October 2021 to 19 February 2022 and (ii) 19 February 2022 to November 2022.
Coasts 05 00032 g011
Figure 12. Cumulative erosion and deposition for (a) HS sensitivity simulation SA01 and SA02, (b) TP sensitivity simulation SA11 and SA12, and (c) D50 and D90 simulation SA21, SA22 and SA23 for profiles 1 (i) to 7 (vii). (Note: is * is multiply).
Coasts 05 00032 g012aCoasts 05 00032 g012b
Figure 13. BSS of sensitivity analysis model simulation for (a) HS sensitivity simulation SA01 and SA02, (b) TP sensitivity simulation SA11 and SA12, and (c) D50 and D90 simulation SA21, SA22 and SA23 Model. (Note: is * is multiply).
Coasts 05 00032 g013
Figure 14. Bed level changes caused by individual storm events from the sea level rise scenarios simulation.
Coasts 05 00032 g014
Figure 15. (a) Box plot showing statistical erosion and deposition (b) average erosion and deposition, (c) 95th percentile erosion and deposition and (d) length of erosion and for sea level rise scenarios.
Coasts 05 00032 g015
Figure 16. Mean absolute bed level changes summed across the beach face from LAT to HAT for different Hs multiplication factors from 0.5 to 1.5.
Coasts 05 00032 g016
Figure 17. Bed level changes due to the second storm event for different interval scenarios between the first and second storm events.
Coasts 05 00032 g017
Figure 18. Bed level changes caused by individual storm events from the fourth assessment model simulation.
Coasts 05 00032 g018
Figure 19. (a) Box plot showing statistical erosion and deposition (b) average erosion and deposition, (c) 95th percentile erosion and deposition and (d) length of erosion and for 6 successive storm scenarios.
Coasts 05 00032 g019
Table 1. XBeach model validation for period 19 to 25 February 2022.
ProfileLAT 1 to HAT 2LAT to MSL 3MSL to HAT
rRMSE (m)BSSrRMSE (m)BSSrRMSE (m)BSS
10.9990.26−1.270.9990.140.530.9960.34−6.68
20.9980.100.440.9990.100.670.9960.10−0.05
30.9970.090.360.9990.09−1.170.9970.070.84
40.9970.420.020.9990.45−0.320.9910.350.42
50.9930.45−1.150.9980.50−1.010.9990.31−2.42
60.9960.090.200.9970.090.260.9970.090.13
70.9990.070.390.9990.080.230.9970.040.70
1 Lowest Astronomical Tide; 2 Mean Sea Level; 3 Highest Astronomical Tide.
Table 2. Multiplication factors applied to model parameters for sensitivity analysis.
ScenarioWave Parameter InputSediment Characteristic Input
Wave Height HSWave Period TPD50D90
Base----
SA01×0.8---
SA02×1.2---
SA11-×0.8--
SA12-×1.2--
SA21--×1.1×1.1
SA22--×1.2×1.2
SA23--×1.5×1.5
Disclaimer/Publisher’s Note: The statements, opinions and data contained in all publications are solely those of the individual author(s) and contributor(s) and not of MDPI and/or the editor(s). MDPI and/or the editor(s) disclaim responsibility for any injury to people or property resulting from any ideas, methods, instructions or products referred to in the content.