
Geospatial Analysis of Heavy Metal Concentrations in the Coastal Marine Environment of Beihai, Guangxi During April 2021


Abstract
1. Introduction
2. Materials and Methods
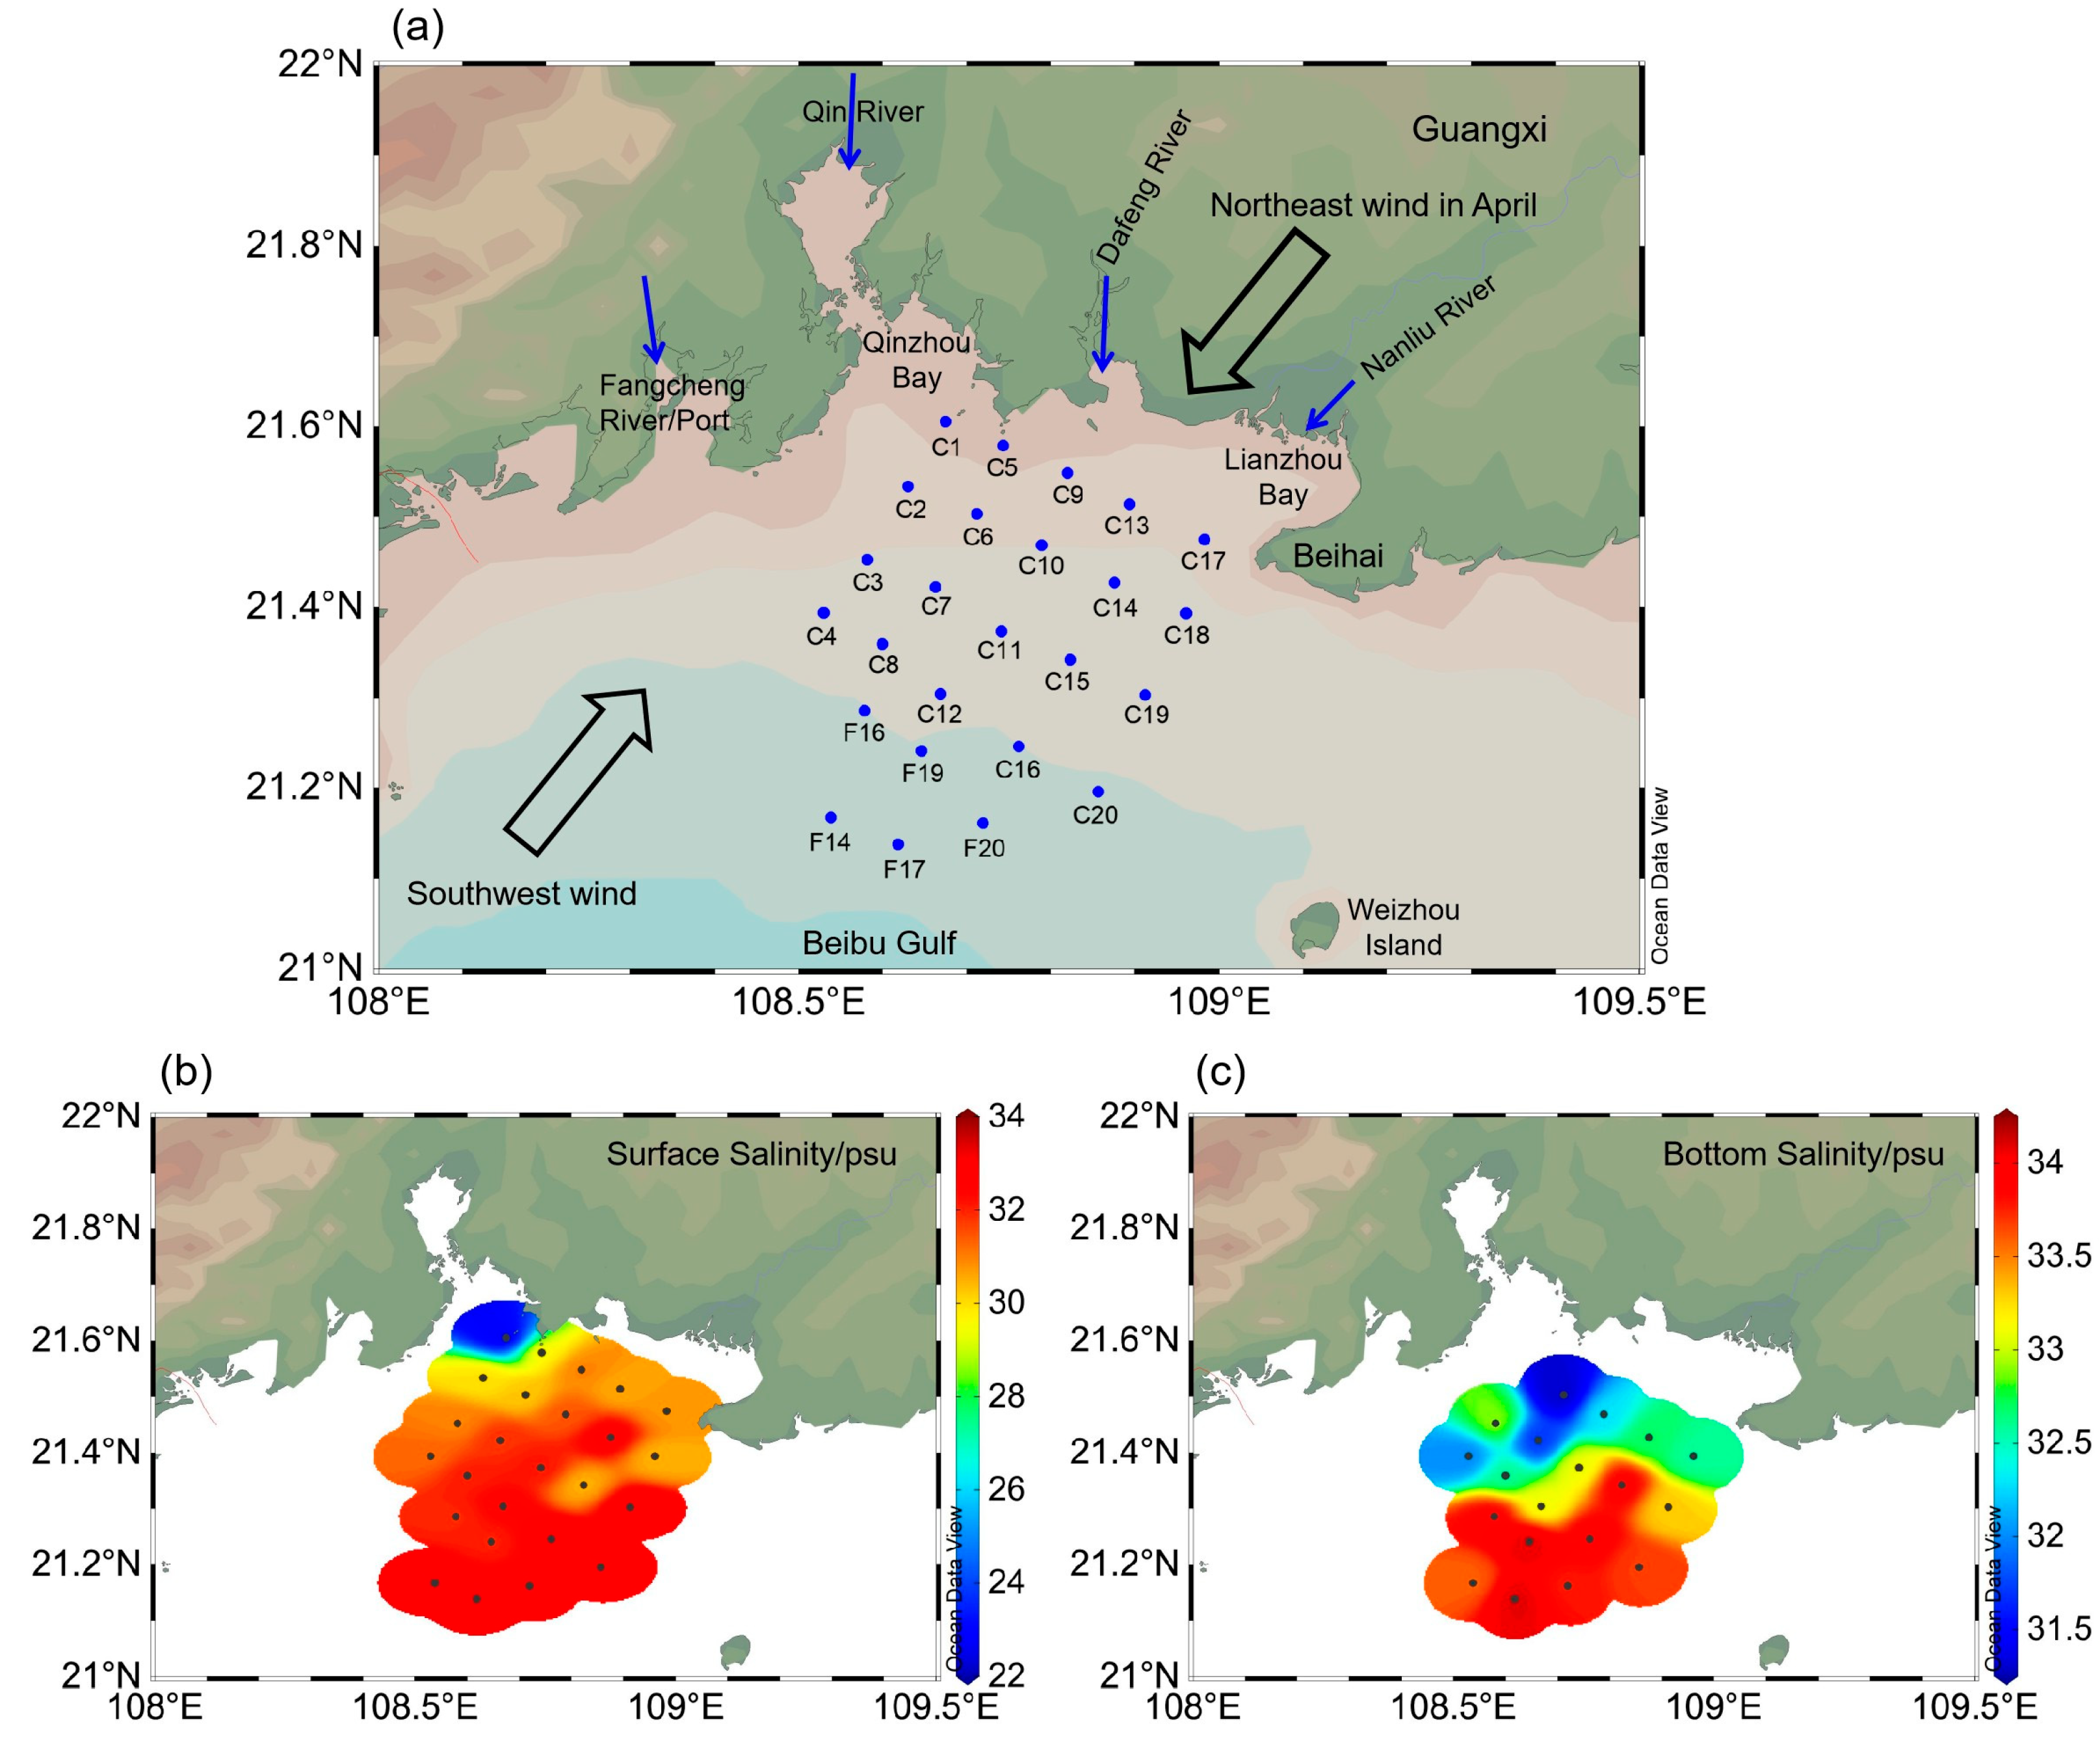
2.1. Study Region
2.2. Sample Collection and Analysis
3. Results
4. Discussion
4.1. Spatial Distribution of Heavy Metals and Nutrients (DIN, PO43−) in Surface Seawater
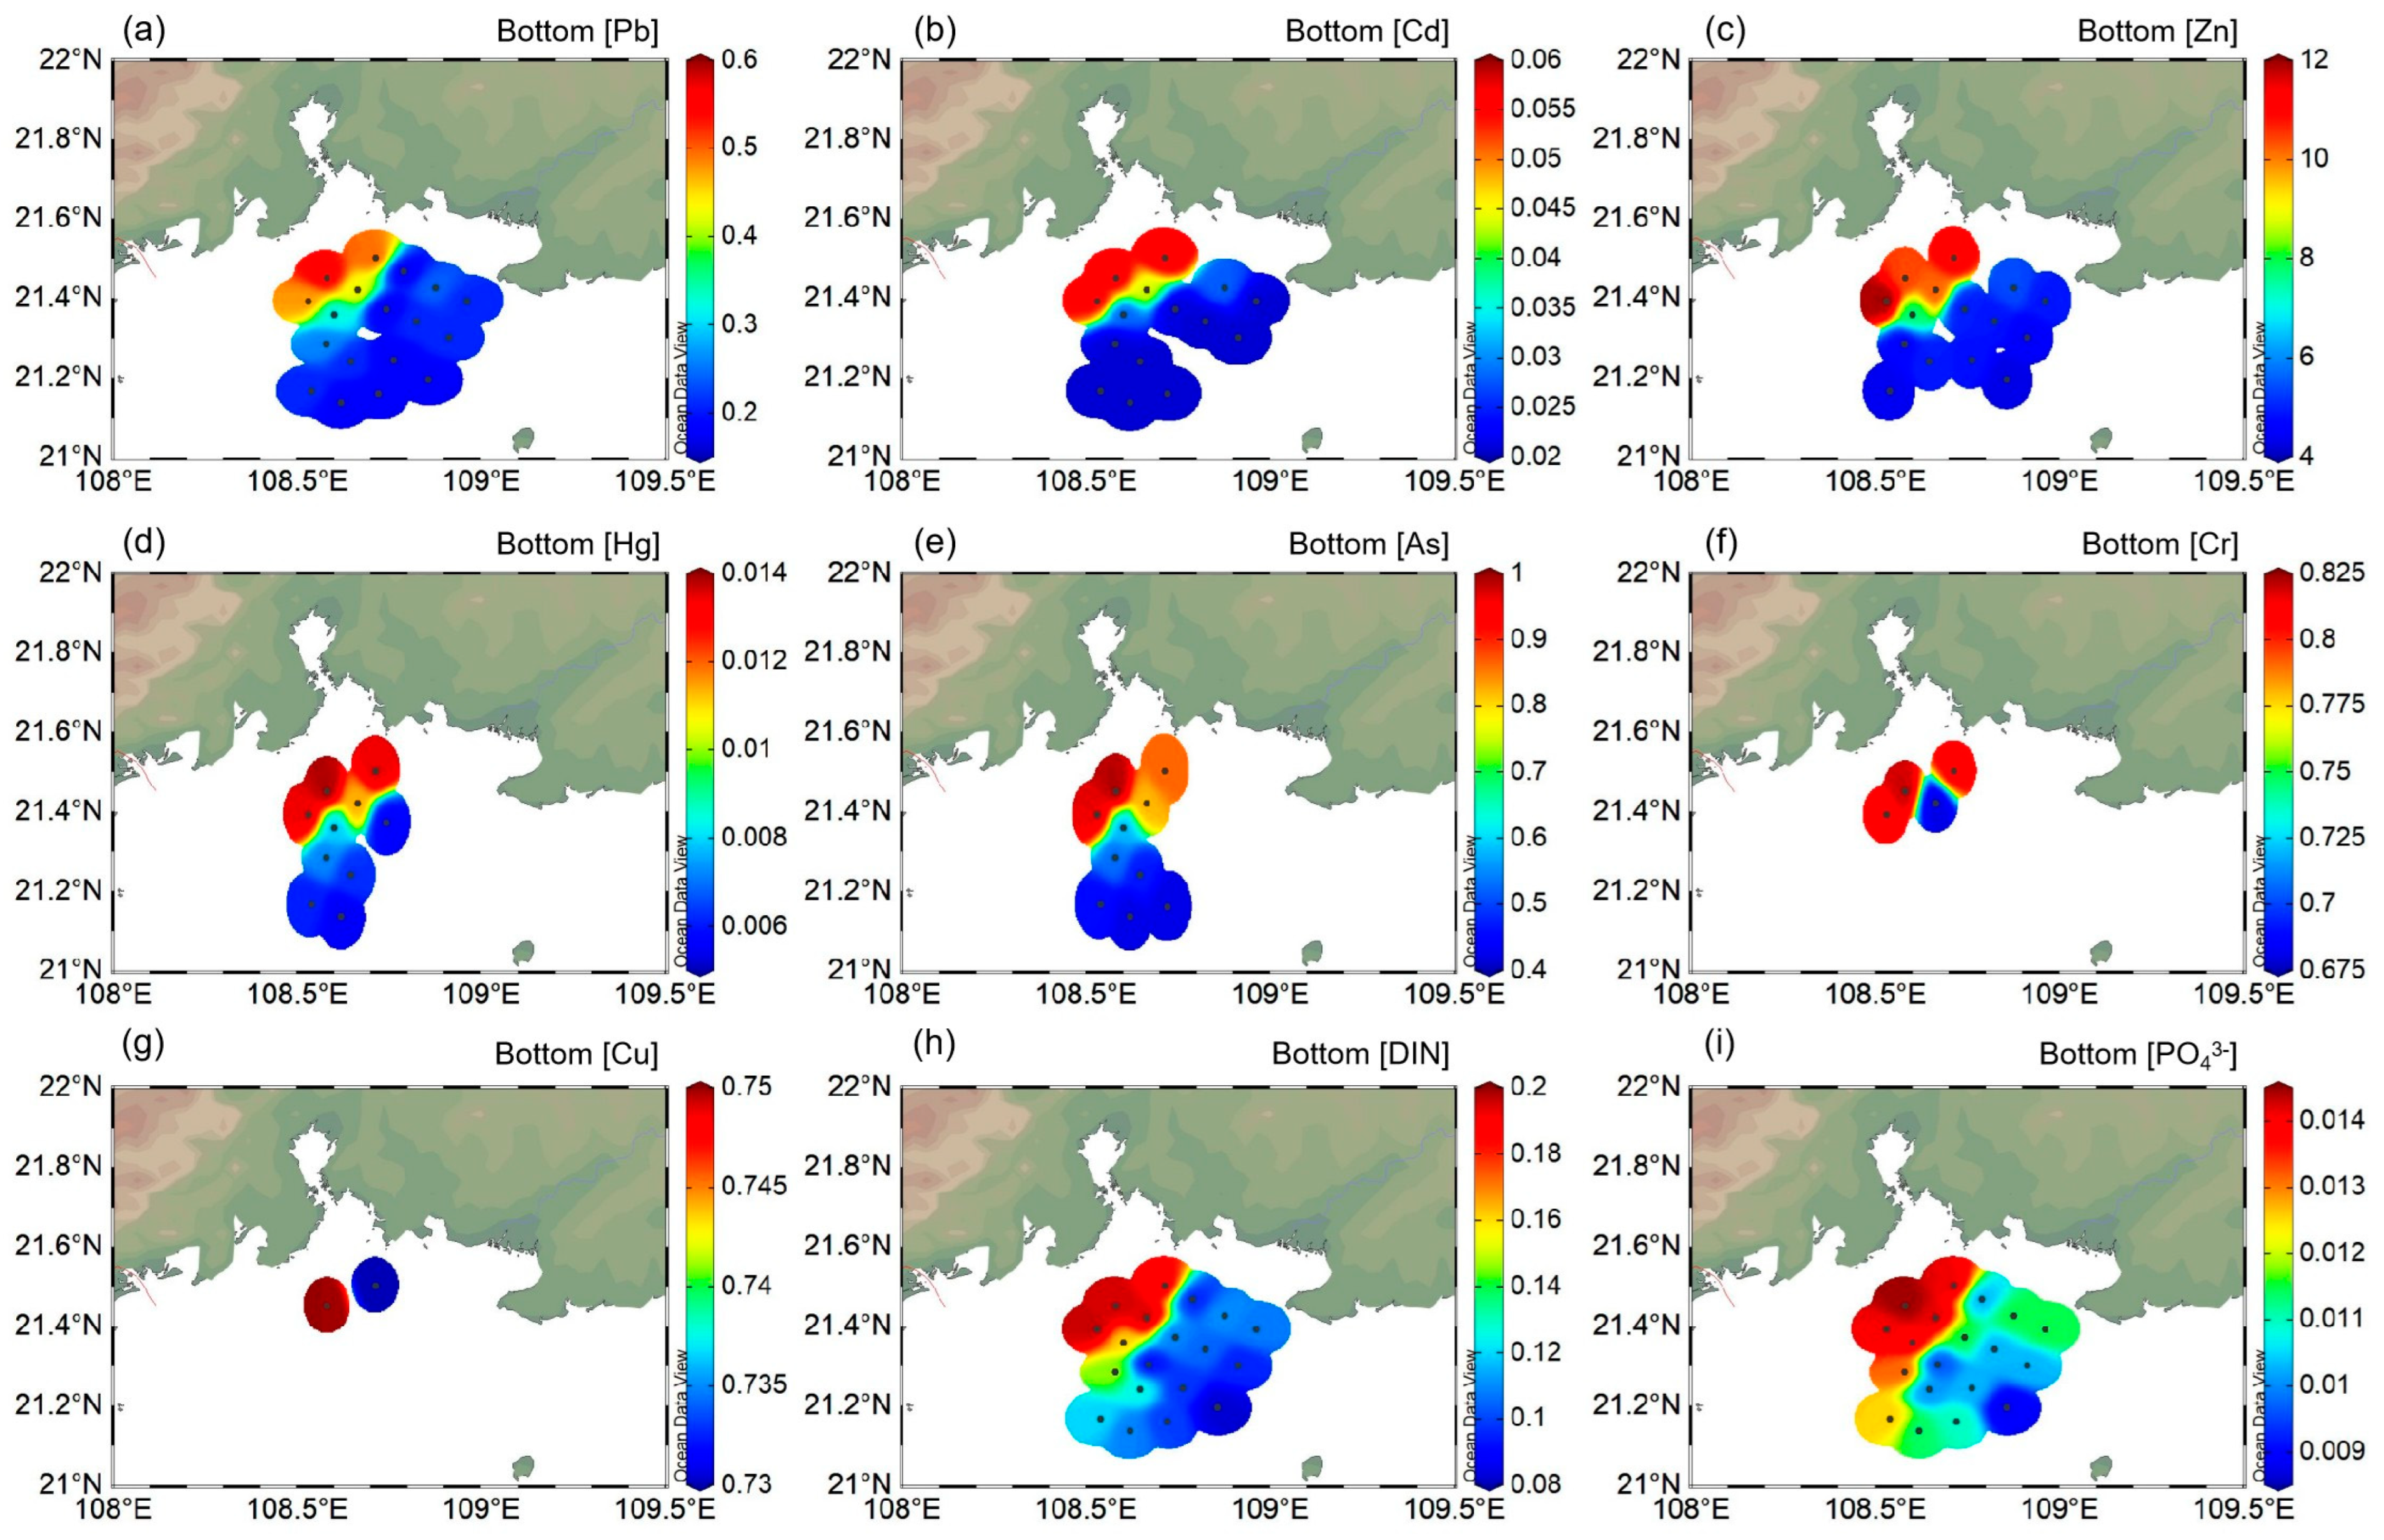
4.2. Spatial Distribution of Heavy Metals and Nutrients (DIN, PO43−) in Bottom Seawater
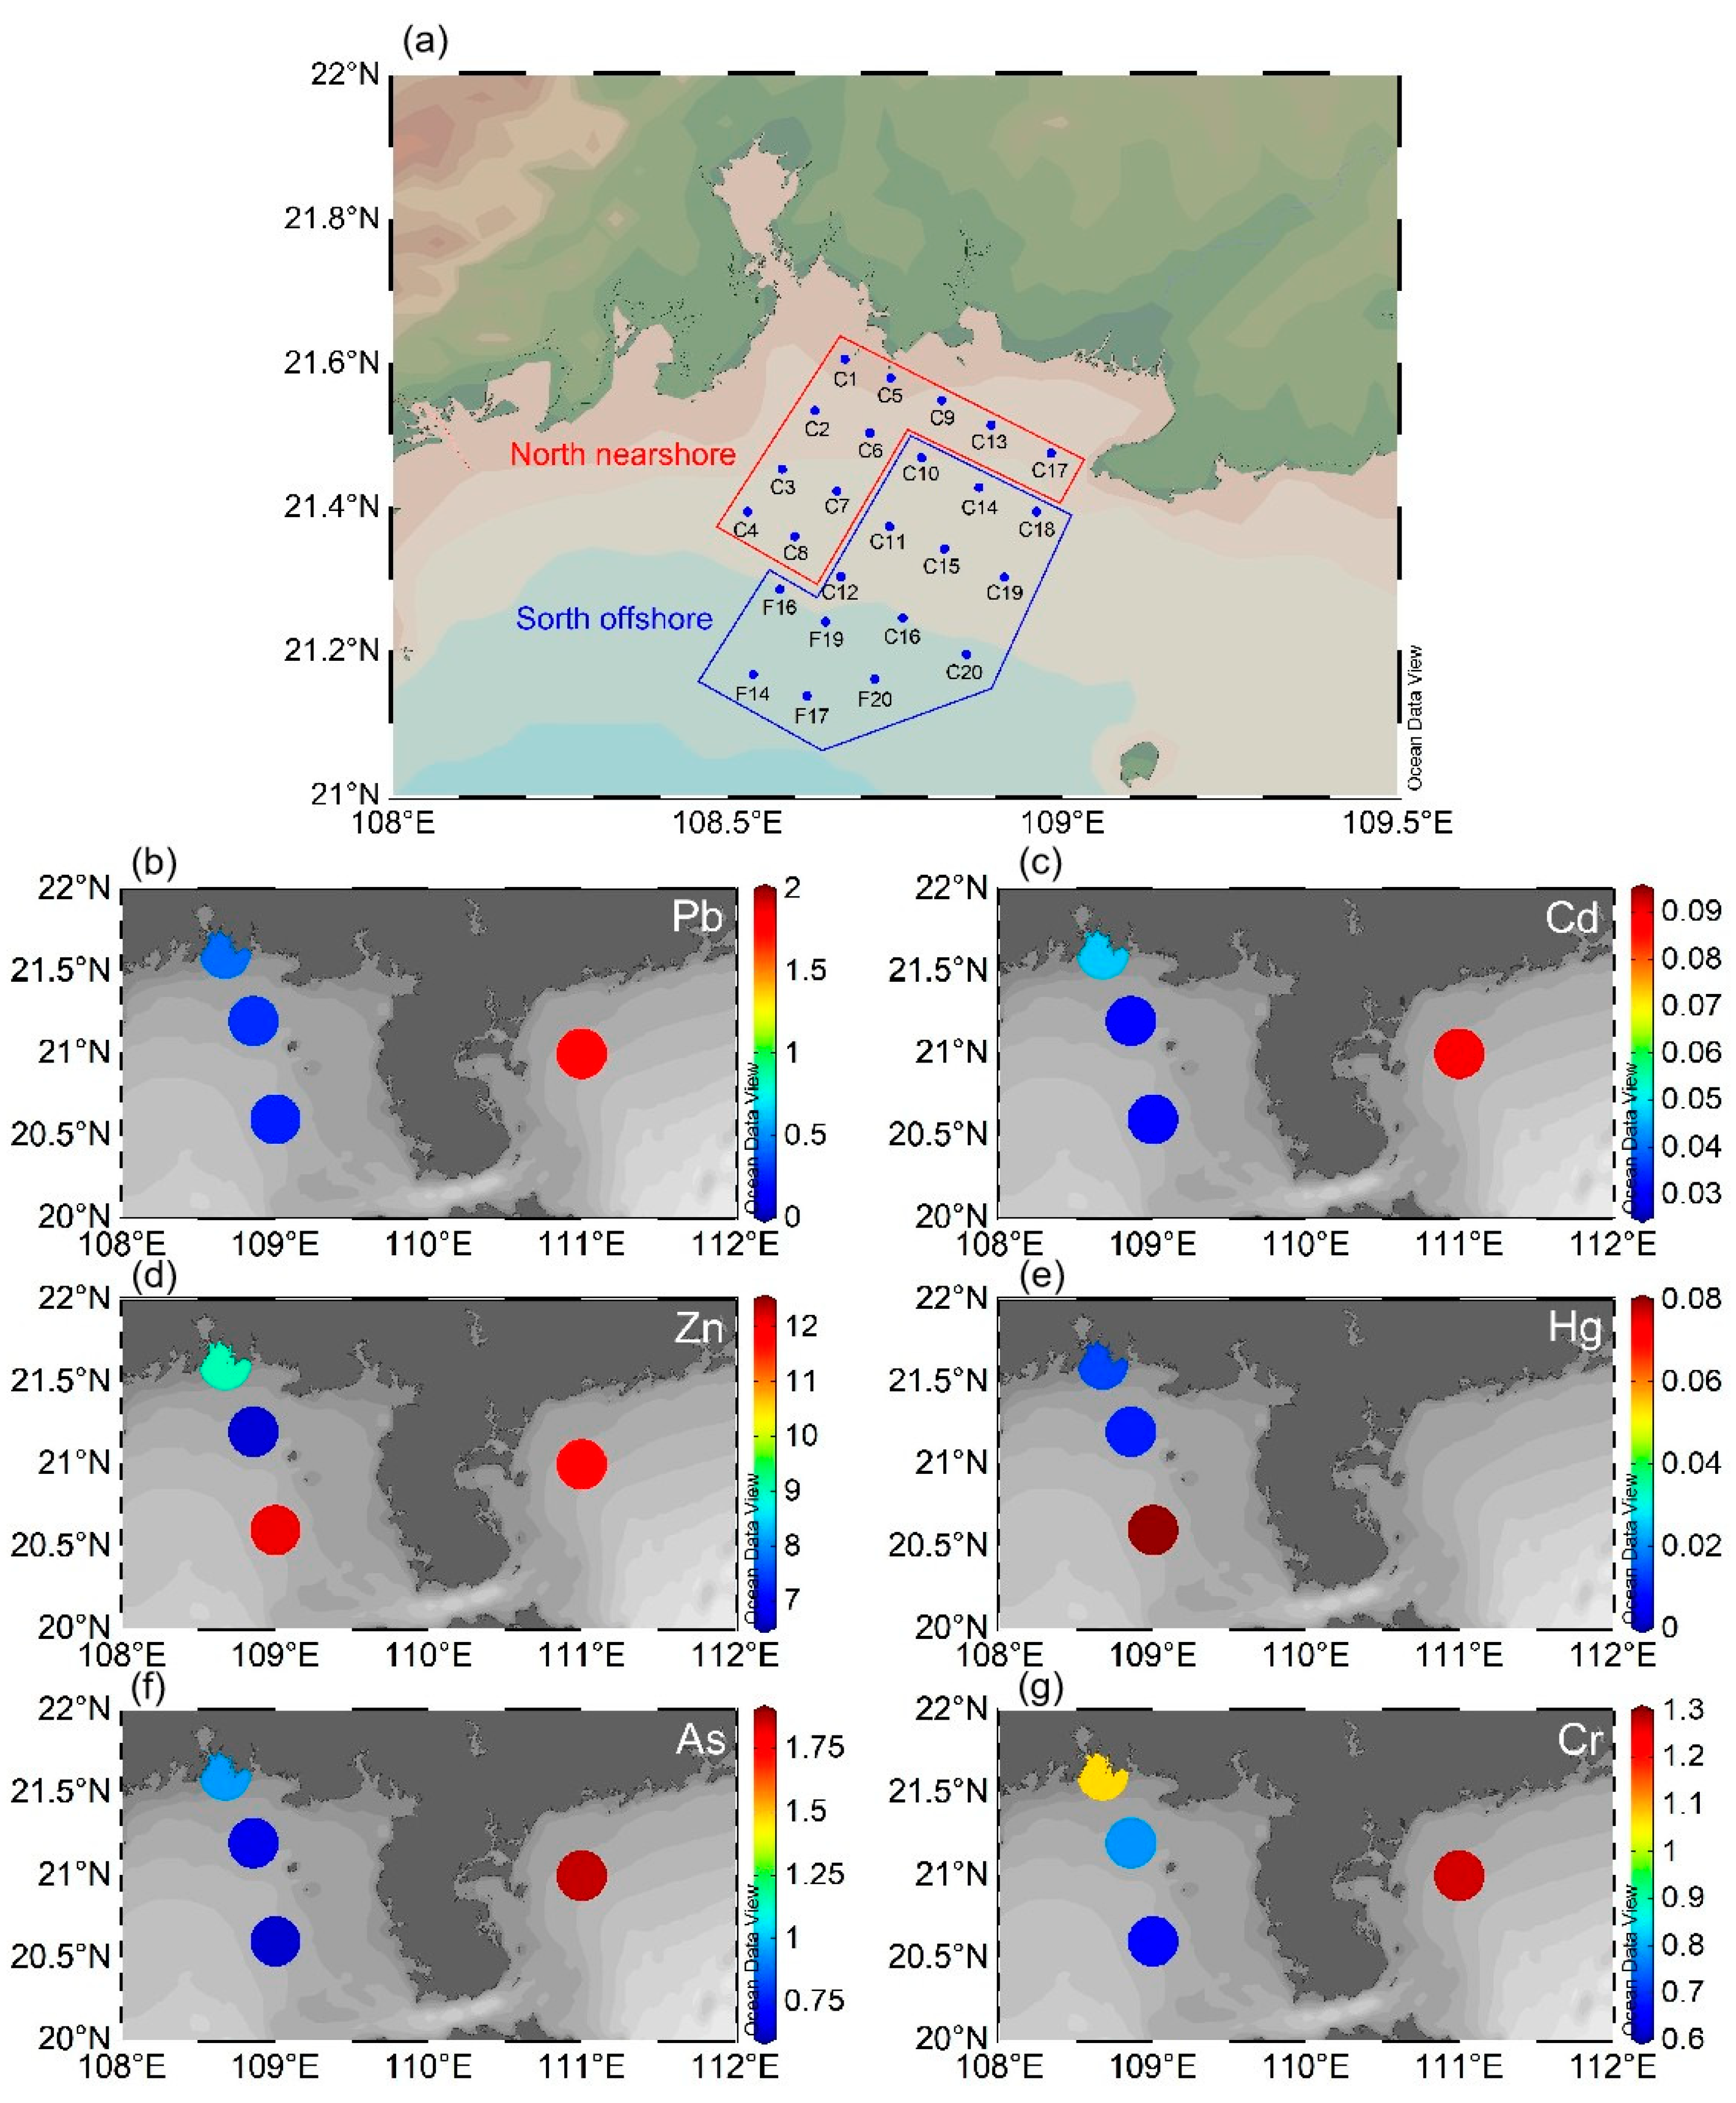
4.3. Comparison with Heavy Metals in Adjacent Coastal Regions
5. Conclusions
Author Contributions
Funding
Data Availability Statement
Acknowledgments
Conflicts of Interest
References
- Abdullah, M.I.; Royle, L.G.; Morris, A.W. Heavy Metal Concentration in Coastal Waters. Nature 1972, 235, 158–160. [Google Scholar] [CrossRef]
- Agardy, T.; Alder, J.; Dayton, P.; Curran, S.; Kitchingman, A.; Wilson, M.; Catenazzi, A.; Restrepo-Angel, J. Coastal Systems. In Ecosystems and Human Well-Being: Current State and Trends; Island Press: Washington, DC, USA, 2005; pp. 513–550. [Google Scholar]
- Kumar, S.; Prasad, S.; Yadav, K.K.; Shrivastava, M.; Gupta, N.; Nagar, S.; Bach, Q.-V.; Kamyab, H.; Khan, S.A.; Yadav, S. Hazardous heavy metals contamination of vegetables and food chain: Role of sustainable remediation approaches-A review. Environ. Res. 2019, 179, 108792. [Google Scholar] [CrossRef]
- Lotze, H.K.; Lenihan, H.S.; Bourque, B.J.; Bradbury, R.H.; Cooke, R.G.; Kay, M.C.; Kidwell, S.M.; Kirby, M.X.; Peterson, C.H.; Jackson, J.B.C. Depletion, Degradation, and Recovery Potential of Estuaries and Coastal Seas. Science 2006, 312, 1806–1809. [Google Scholar] [CrossRef]
- UNEP; UN-HABITAT. Coastal Area Pollution—The Role of Cities. 2005. Available online: https://staging.unhabitat.org/downloads/docs/2227_alt.pdf (accessed on 24 July 2025).
- Zhang, M.; Sun, X.; Xu, J. Heavy metal pollution in the East China Sea: A review. Mar. Pollut. Bull. 2020, 159, 111473. [Google Scholar] [CrossRef]
- Shah, S.B. Heavy Metals in the Marine Environment—An Overview. In Heavy Metals in Scleractinian Corals; Shah, S.B., Ed.; Springer: Cham, Switzerland, 2021; pp. 1–26. [Google Scholar] [CrossRef]
- Akoto, O.; Ephraim, J.; Darko, G. Heavy Metals Pollution in Surface Soils in the Vicinity of Abundant Railway Servicing Workshop in Kumasi, Ghana. Int. J. Environ. Res. 2008, 2, 4, ISSN 1735-6865. [Google Scholar]
- Babaahmadi, F.; Dobaradaran, S.; Pazira, A.; Eghbali, S.S.; Khorsand, M.; Keshtkar, M. Data on metal levels in the inlet and outlet wastewater treatment plant of hospitals in Bushehr province, Iran. Data Brief 2017, 10, 1–5. [Google Scholar] [CrossRef]
- Younis, A.M.; Soliman, N.F.; Elkady, F.M.; Mohamedein, L.I. Distribution and ecological risk evaluation of bioavailable phosphorus in sediments of EI Temsah Lake, Suez Canal. Oceanologia 2022, 64, 287–298. [Google Scholar] [CrossRef]
- Hong, J.; Zhang, J.; Song, Y.; Cao, X. Spatial and Temporal Distribution Characteristics of Nutrient Elements and Heavy Metals in Surface Water of Tibet, China and Their Pollution Assessment. Water 2022, 14, 3664. [Google Scholar] [CrossRef]
- Soliman, N.F.; Younis, A.M.; Elkady, E.M. An insight into fractionation, toxicity, mobility and source apportionment of metals in sediments from EI Temsah Lake, Suez Canal. Chemosphere 2019, 222, 165–174. [Google Scholar] [CrossRef]
- Soliman, N.F.; Younis, A.M.; Elkady, E. Chemical speciation and comprehensive risk assessment of metals in sediments from Nabq protectorate, the Red Sea using individual and synergistic indices. Mar. Pollut. Bull. 2024, 201, 116219. [Google Scholar] [CrossRef]
- Degger, N.; Chiu, J.M.; Po, B.H.; Tse, A.C.; Zheng, G.J.; Zhao, D.M.; Xu, D.; Cheng, Y.S.; Wang, X.H.; Liu, W.H.; et al. Heavy metal contamination along the China coastline: A comprehensive study using Artificial Mussels and native mussels. J. Environ. Manag. 2016, 180, 238–246. [Google Scholar] [CrossRef]
- Delgado, J.; Nieto, J.M.; Boski, T. Analysis of the spatial variation of heavy metals in the Guadiana Estuary sediments (SW Iberian Peninsula) based on GIS-mapping techniques. Estuar. Coast. Shelf Sci. 2010, 88, 71–83. [Google Scholar] [CrossRef]
- Ding, Z.H.; Liu, J.L.; Li, L.Q.; Lin, H.N.; Wu, H.; Hu, Z.Z. Distribution and speciation of mercury in surficial sediments from main mangrove wetlands in China. Mar. Pollut. Bull. 2009, 58, 1319–1325. [Google Scholar] [CrossRef]
- Dobaradaran, S.; Nabipour, I.; Saeedi, R.; Ostovar, A.; Khorsand, M.; Khajeahmadi, N.; Hayati, R.; Keshtkar, M. Association of metals (Cd, Fe, As, Ni, Cu, Zn and Mn) with cigarette butts in northern part of the Persian Gulf. Tob. Control 2017, 26, 461. [Google Scholar] [CrossRef]
- Halpern, B.S.; Walbridge, S.; Selkoe, K.A.; Kappel, C.V.; Micheli, F.; d’Agrosa, C.; Bruno, J.F.; Casey, K.S.; Ebert, C.; Fox, H.E.; et al. A Global Map of Human Impact on Marine Ecosystems. Science 2008, 319, 948–952. [Google Scholar] [CrossRef]
- Li, C.; Wang, H.; Liao, X.; Xiao, R.; Liu, K.; Bai, J.; Li, B.; He, Q. Heavy metal pollution in coastal wetlands: A systematic review of studies globally over the past three decades. J. Hazard. Mater. 2022, 424, 127312. [Google Scholar] [CrossRef]
- Ra, K.; Kim, J.-K.; Hong, S.H.; Yim, U.H.; Shim, W.J.; Lee, S.-Y.; Kim, Y.-O.; Lim, J.; Kim, E.-S.; Kim, K.-T. Assessment of pollution and ecological risk of heavy metals in the surface sediments of Ulsan Bay, Korea. Ocean Sci. J. 2014, 49, 279–289. [Google Scholar] [CrossRef]
- Romano, E.; Ausili, A.; Zharova, N.; Magno, M.C.; Pavoni, B.; Gabellini, M. Marine sediment contamination of an industrial site at Port of Bagnoli, Gulf of Naples, Southern Italy. Mar. Pollut. Bull. 2004, 49, 487–495. [Google Scholar] [CrossRef]
- Santos, I.R.; Silva-Filho, E.V.; Schaefer, C.E.G.R.; Albuquerque-Filho, M.R.; Campos, L.S. Heavy metal contamination in coastal sediments and soils near the Brazilian Antarctic Station, King George Island. Mar. Pollut. Bull. 2005, 50, 185–194. [Google Scholar] [CrossRef]
- Wang, X.; Fu, R.; Li, H.; Zhang, Y.; Lu, M.; Xiao, K.; Zhang, X.; Zheng, C.; Xiong, Y. Heavy metal contamination in surface sediments: A comprehensive, large-scale evaluation for the Bohai Sea, China. Environ. Pollut. 2020, 260, 113986. [Google Scholar] [CrossRef]
- Youssef, D.H.; El-Said, G.F. Assessment of some heavy metals in surface sediments of the Aqaba Gulf, Egypt. Environ. Monit. Assess. 2011, 180, 229–242. [Google Scholar] [CrossRef]
- Deng, B.; Zhang, J.; Zhang, G.; Zhou, J. Enhanced anthropogenic heavy metal dispersal from tidal disturbance in the Jiaozhou Bay, North China. Environ. Monit. Assess. 2010, 161, 349–358. [Google Scholar] [CrossRef]
- Jayalath, G.N.T.; Ratnayake, A.S. Overview of coastal and marine pollution. In Coastal and Marine Pollution; Vithanage, M., Samarasekara, S.M., James, B.D., Reddy, C.M., Eds.; Wiley Online Library: Hoboken, NJ, USA, 2025; pp. 1–25. [Google Scholar] [CrossRef]
- Hernández-Crespo, C.; Martín, M. Determination of background levels and pollution assessment for seven metals (Cd, Cu, Ni, Pb, Zn, Fe, Mn) in sediments of a Mediterranean coastal lagoon. CATENA 2015, 133, 206–214. [Google Scholar] [CrossRef]
- Li, Y.; Lin, Y.; Wang, L. Distribution of heavy metals in seafloor sediments on the East China Sea inner shelf: Seasonal variations and typhoon impact. Mar. Pollut. Bull. 2018, 129, 534–544. [Google Scholar] [CrossRef]
- Xia, P.; Meng, X.; Yin, P.; Cao, Z.; Wang, X. Eighty-year sedimentary record of heavy metal inputs in the intertidal sediments from the Nanliu River estuary, Beibu Gulf of South China Sea. Environ. Pollut. 2011, 159, 92–99. [Google Scholar] [CrossRef]
- Gan, H.; Lin, J.; Liang, K.; Xia, Z. Selected trace metals (As, Cd and Hg) distribution and contamination in the coastal wetland sediment of the northern Beibu Gulf, South China Sea. Mar. Pollut. Bull. 2013, 66, 252–258. [Google Scholar] [CrossRef]
- Lao, Q.; Cai, S.; Huang, P.; Chen, F.; Su, Q.; Lei, X.; Zhou, X.; Chen, C.; Zhu, Q.; Lu, X. Contaminant characteristics and influencing factors of heavy metals in seawater and sediments in a typical mariculture bay in south China. Front. Mar. Sci. 2022, 9, 923494. [Google Scholar] [CrossRef]
- Liu, T.; Zhang, Y.; Liu, Y.; Chen, B. Multi-indicator assessment of heavy metal pollution in Qinzhou Harbour sediments: Unraveling ecological and human health risks. Mar. Pollut. Bull. 2025, 211, 117442. [Google Scholar] [CrossRef]
- Zhang, Z.; Hu, B.; Qiu, H. Comprehensive assessment of ecological risk in southwest Guangxi-Beibu bay based on DPSIR model and OWA-GIS. Ecol. Indic. 2021, 132, 108334. [Google Scholar] [CrossRef]
- Zhu, Z.; Wei, H.; Guan, Y.; Zhang, L.; Sun, P.; Zhang, Q. Spatial and seasonal characteristics of dissolved heavy metals in the seawater of Beibu Gulf, the Northern South China Sea. Front. Mar. Sci. 2022, 9, 996202. [Google Scholar] [CrossRef]
- Fang, T.-H.; Li, J.-Y.; Feng, H.-M.; Chen, H.-Y. Distribution and contamination of trace metals in surface sediments of the East China Sea. Mar. Environ. Res. 2009, 68, 178–187. [Google Scholar] [CrossRef]
- Feng, H.; Jiang, H.; Gao, W.; Weinstein, M.P.; Zhang, Q.; Zhang, W.; Yu, L.; Yuan, D.; Tao, J. Metal contamination in sediments of the western Bohai Bay and adjacent estuaries, China. J. Environ. Manag. 2011, 92, 1185–1197. [Google Scholar] [CrossRef]
- Hu, B.; Li, J.; Zhao, J.; Yang, J.; Bai, F.; Dou, Y. Heavy metal in surface sediments of the Liaodong Bay, Bohai Sea: Distribution, contamination, and sources. Environ. Monit. Assess. 2013, 185, 5071–5083. [Google Scholar] [CrossRef] [PubMed]
- Liu, J.-J.; Ni, Z.-X.; Diao, Z.-H.; Hu, Y.-X.; Xu, X.-R. Contamination level, chemical fraction and ecological risk of heavy metals in sediments from Daya Bay, South China Sea. Mar. Pollut. Bull. 2018, 128, 132–139. [Google Scholar] [CrossRef]
- Meng, W.; Hu, B.; He, M.; Liu, B.; Mo, X.; Li, H.; Wang, Z.; Zhang, Y. Temporal-spatial variations and driving factors analysis of coastal reclamation in China. Estuar. Coast. Shelf Sci. 2017, 191, 39–49. [Google Scholar] [CrossRef]
- Morton, B.; Blackmore, G. South China Sea. Mar. Pollut. Bull. 2001, 42, 1236–1263. [Google Scholar] [CrossRef]
- Pan, K.; Wang, W.-X. Trace metal contamination in estuarine and coastal environments in China. Sci. Total Environ. 2012, 421–422, 3–16. [Google Scholar] [CrossRef]
- Wan, L.; Wang, N.; Li, Q.; Sun, B.; Zhou, Z.; Xue, K.; Ma, Z.; Tian, J.; Song, L. Distribution of dissolved metals in seawater of Jinzhou Bay, China. Environ. Toxicol. Chem. 2008, 27, 43–48. [Google Scholar] [CrossRef]
- Wang, S.-L.; Xu, X.-R.; Sun, Y.-X.; Liu, J.-L.; Li, H.-B. Heavy metal pollution in coastal areas of South China: A review. Mar. Pollut. Bull. 2013, 76, 7–15. [Google Scholar] [CrossRef]
- Xu, F.; Liu, Z.; Cao, Y.; Qiu, L.; Feng, J.; Xu, F.; Tian, X. Assessment of heavy metal contamination in urban river sediments in the Jiaozhou Bay catchment, Qingdao, China. CATENA 2017, 150, 9–16. [Google Scholar] [CrossRef]
- Liu, X.; Bao, Y. Research on Monitoring and Analytical Methods for Heavy Metals in Seawater. Environ. Sci. Manag. 2014, 39, 151–153. (In Chinese) [Google Scholar]
- 20070212-T-418; Specification for Oceanographic Survey-Part 4: Marine Water Chemical Element Survey. State Oceanic Administration of China: Beijing, China, 2007.
- Morris, A.W.; Allen, J.I.; Howland, R.J.M.; Wood, R.G. The Estuary Plume Zone: Source or Sink for Land-derived Nutrient Discharges? Estuar. Coast. Shelf Sci. 1995, 40, 387–402. [Google Scholar] [CrossRef]
- Zhang, L.; Shi, Z.; Zhang, J.; Jiang, Z.; Wang, F.; Huang, X. Spatial and seasonal characteristics of dissolved heavy metals in the east and west Guangdong coastal waters, South China. Mar. Pollut. Bull. 2015, 95, 419–426. [Google Scholar] [CrossRef]
- Gaillardet, J.; Viers, J.; Dupré, B. Trace elements in river waters. In Treatise on Geochemistry: Surface and Ground Water, Weathering, and Soils; Drever, J.I., Ed.; Elsevier: Amsterdam, The Netherlands, 2004; Volume 5, pp. 225–272. [Google Scholar]
- GB 3097-1997; Sea Water Quality Standard. Ministry of Ecology and Environment of the People’s Republic of China: Beijing, China, 1997.
- Qian, N.; Boyle, E.A.; Zhou, L.; Tanzil, J.; Chen, Q.; Zhang, S.; Chen, M. Spatial-Temporal Variability and Sources of Lead (Pb) in the Indian Ocean and Asian Marginal Seas. J. Geophys. Res. Ocean. 2023, 128, e2022JC019222. [Google Scholar] [CrossRef]
- Xing, J.; Song, J.; Yuan, H.; Wang, Q.; Li, X.; Li, N.; Duan, L.; Qu, B. Atmospheric wet deposition of dissolved trace elements to Jiaozhou Bay, North China: Fluxes, sources and potential effects on aquatic environments. Chemosphere 2017, 174, 428–436. [Google Scholar] [CrossRef] [PubMed]


| Station | Depth/m | Latitude | Longitude |
|---|---|---|---|
| C1 | 9 | 21°36.3213′ | 108°40.4959′ |
| C2 | 5.8 | 21°32.0214′ | 108°37.8169′ |
| C3 | 15.3 | 21°27.1675′ | 108°34.8850′ |
| C4 | 20.4 | 21°23.6146′ | 108°31.7859′ |
| C5 | 6.7 | 21°34.7318′ | 108°44.6104′ |
| C6 | 12.7 | 21°30.1876′ | 108°42.7251′ |
| C7 | 14.3 | 21°25.3352′ | 108°39.7912′ |
| C8 | 16.3 | 21°21.5483′ | 108°35.9986′ |
| C9 | 6.2 | 21°32.9055′ | 108°49.1849′ |
| C10 | 11 | 21°28.1258′ | 108°47.3539′ |
| C11 | 17.9 | 21°22.4029′ | 108°44.4931′ |
| C12 | 20.1 | 21°18.2397′ | 108°40.1305′ |
| C13 | 8.3 | 21°30.8257′ | 108°53.6273′ |
| C14 | 11.9 | 21°25.6488′ | 108°52.5277′ |
| C15 | 19.2 | 21°20.5087′ | 108°49.4039′ |
| C16 | 25.3 | 21°14.7417′ | 108°45.7000′ |
| C17 | 6.8 | 21°28.4784′ | 108°58.9844′ |
| C18 | 10 | 21°23.6137′ | 108°57.6413′ |
| C19 | 16.2 | 21°18.1637′ | 108°54.7561′ |
| C20 | 25.8 | 21°11.7338′ | 108°51.3855′ |
| F14 | 24.2 | 21°10.0274′ | 108°32.2898′ |
| F16 | 22.5 | 21°17.1288′ | 108°34.6947′ |
| F17 | 27.5 | 21°08.2742′ | 108°37.0892′ |
| F19 | 22.5 | 21°14.4520′ | 108°38.7602′ |
| F20 | 26 | 21°09.6830′ | 108°43.1785′ |
| Station | Layer/m | T | S | NO2− | NO3− | NH4+ | DIN | PO43− |
|---|---|---|---|---|---|---|---|---|
| C1 | Surface (0.5) | 26.8 | 22.6 | 0.0416 | 0.1382 | 0.0323 | 0.2121 | 0.0134 |
| C2 | Surface (0.5) | 26.4 | 30 | 0.0351 | 0.1297 | 0.027 | 0.1918 | 0.0145 |
| C3 | Surface (0.5) | 26.2 | 31 | 0.0192 | 0.1103 | 0.0286 | 0.1582 | 0.0137 |
| C3 | Bottom (13) | 25.5 | 32.9 | 0.0316 | 0.1443 | 0.0193 | 0.1953 | 0.0145 |
| C4 | Surface (0.5) | 26.1 | 31.3 | 0.0104 | 0.1123 | 0.0305 | 0.1532 | 0.0132 |
| C4 | Bottom (18) | 25.7 | 32 | 0.0279 | 0.1317 | 0.037 | 0.1966 | 0.0141 |
| C5 | Surface (0.5) | 25.4 | 29.8 | 0.0362 | 0.1285 | 0.0261 | 0.1908 | 0.0141 |
| C6 | Surface (0.5) | 26.8 | 30.3 | 0.0311 | 0.1073 | 0.0357 | 0.1741 | 0.0137 |
| C6 | Bottom (10) | 25.9 | 31.3 | 0.0386 | 0.1153 | 0.0364 | 0.1903 | 0.0142 |
| C7 | Surface (0.5) | 25.8 | 31.9 | 0.0183 | 0.089 | 0.0236 | 0.1309 | 0.0136 |
| C7 | Bottom (12) | 25.7 | 31.7 | 0.0386 | 0.1307 | 0.0261 | 0.1954 | 0.0142 |
| C8 | Surface (0.5) | 25.8 | 32.1 | 0.0183 | 0.0717 | 0.0207 | 0.1106 | 0.0115 |
| C8 | Bottom (14) | 25.5 | 32.6 | 0.0244 | 0.109 | 0.028 | 0.1614 | 0.014 |
| C9 | Surface (0.5) | 26.3 | 31 | 0.0252 | 0.1368 | 0.0312 | 0.1932 | 0.0138 |
| C10 | Surface (0.5) | 26.8 | 31.5 | 0.0117 | 0.056 | 0.0143 | 0.082 | 0.0089 |
| C10 | Bottom (9) | 25.6 | 32.3 | 0.0143 | 0.0643 | 0.0168 | 0.0955 | 0.0103 |
| C11 | Surface (0.5) | 26.1 | 32.2 | 0.0178 | 0.0817 | 0.0216 | 0.1211 | 0.0125 |
| C11 | Bottom (15) | 25.4 | 33.1 | 0.0146 | 0.0743 | 0.0198 | 0.1087 | 0.0115 |
| C12 | Surface (0.5) | 26 | 32.5 | 0.0152 | 0.067 | 0.0184 | 0.1006 | 0.0108 |
| C12 | Bottom (18) | 25.4 | 33.1 | 0.0135 | 0.062 | 0.0161 | 0.0916 | 0.0096 |
| C13 | Surface (0.5) | 25.6 | 30.6 | 0.0214 | 0.1321 | 0.0206 | 0.1741 | 0.0144 |
| C14 | Surface (0.5) | 26.4 | 32.7 | 0.0142 | 0.075 | 0.0198 | 0.109 | 0.0115 |
| C14 | Bottom (10) | 26.3 | 32.7 | 0.0152 | 0.0743 | 0.0209 | 0.1104 | 0.0115 |
| C15 | Surface (0.5) | 26.2 | 30.5 | 0.0133 | 0.067 | 0.0186 | 0.0989 | 0.0103 |
| C15 | Bottom (17) | 25.6 | 33.9 | 0.0138 | 0.0703 | 0.0209 | 0.105 | 0.0103 |
| C16 | Surface (0.5) | 26.3 | 33 | 0.0125 | 0.062 | 0.0186 | 0.0931 | 0.0096 |
| C16 | Middle (10) | 26 | 33.3 | 0.0109 | 0.0523 | 0.0134 | 0.0766 | 0.0082 |
| C16 | Bottom (23) | 25.6 | 33.9 | 0.0134 | 0.0673 | 0.0175 | 0.0982 | 0.0103 |
| C17 | Surface (0.5) | 25.4 | 30.8 | 0.0369 | 0.103 | 0.0301 | 0.17 | 0.0135 |
| C18 | Surface (0.5) | 26.8 | 30.5 | 0.0134 | 0.067 | 0.0175 | 0.0979 | 0.0103 |
| C18 | Bottom (8) | 25.6 | 32.6 | 0.0142 | 0.075 | 0.0186 | 0.1078 | 0.0115 |
| C19 | Surface (0.5) | 26 | 33 | 0.0125 | 0.0587 | 0.0186 | 0.0898 | 0.0096 |
| C19 | Bottom (14) | 25.8 | 33.3 | 0.0138 | 0.0607 | 0.0209 | 0.0954 | 0.0103 |
| C20 | Surface (0.5) | 25.8 | 32.9 | 0.0087 | 0.0523 | 0.0134 | 0.0744 | 0.0082 |
| C20 | Middle (10) | 25.6 | 33.3 | 0.0056 | 0.0277 | 0.007 | 0.0403 | 0.0036 |
| C20 | Bottom (23) | 25.4 | 33.7 | 0.0112 | 0.057 | 0.0148 | 0.083 | 0.0089 |
| F14 | Surface (0.5) | 26.6 | 33.1 | 0.0147 | 0.0743 | 0.0186 | 0.1077 | 0.0114 |
| F14 | Bottom (22) | 26.2 | 33.6 | 0.0161 | 0.0823 | 0.0218 | 0.1203 | 0.0126 |
| F16 | Surface (0.5) | 27.2 | 32 | 0.0214 | 0.1107 | 0.0302 | 0.1623 | 0.0145 |
| F16 | Bottom (20) | 25.6 | 33.9 | 0.0192 | 0.1003 | 0.0268 | 0.1464 | 0.0132 |
| F17 | Surface (0.5) | 26.9 | 33.1 | 0.0162 | 0.0683 | 0.0216 | 0.1061 | 0.0125 |
| F17 | Middle (10) | 26.5 | 33.8 | 0.0141 | 0.0713 | 0.0186 | 0.1041 | 0.011 |
| F17 | Bottom (25) | 26.3 | 34.1 | 0.0147 | 0.0743 | 0.0195 | 0.1086 | 0.0114 |
| F19 | Surface (0.5) | 27.2 | 32.1 | 0.0198 | 0.1037 | 0.0277 | 0.1512 | 0.0117 |
| F19 | Bottom (20) | 25.5 | 34.1 | 0.0167 | 0.0857 | 0.023 | 0.1253 | 0.0101 |
| F20 | Surface (0.5) | 26.6 | 32.9 | 0.0241 | 0.0873 | 0.0241 | 0.1355 | 0.0138 |
| F20 | Middle (10) | 25.9 | 34 | 0.0399 | 0.067 | 0.0173 | 0.1242 | 0.0103W |
| F20 | Bottom (24) | 25.9 | 33.8 | 0.0095 | 0.0713 | 0.0186 | 0.0995 | 0.011 |
| Station | Layer/m | Cu | Pb | Cd | Zn | Cr | Hg | As |
|---|---|---|---|---|---|---|---|---|
| C1 | Surface (0.5) | 1.57 | 0.95 | 0.104 | 18.64 | 1.32 | 0.0237 | 1.646 |
| C2 | Surface (0.5) | 0.96 | 0.56 | 0.063 | 10.88 | 0.88 | 0.0144 | 0.928 |
| C3 | Surface (0.5) | — | 0.32 | 0.032 | 6.83 | 0.57 | 0.0086 | 0.682 |
| C3 | Bottom (13) | 0.75 | 0.55 | 0.056 | 10.45 | 0.82 | 0.0139 | 0.993 |
| C4 | Surface (0.5) | — | 0.31 | 0.038 | 6.98 | — | 0.0086 | 0.58 |
| C4 | Bottom (18) | — | 0.48 | 0.056 | 11.97 | 0.81 | 0.0135 | 0.969 |
| C5 | Surface (0.5) | 1.52 | 0.96 | 0.104 | 17.13 | 1.38 | 0.0239 | 1.591 |
| C6 | Surface (0.5) | — | 0.53 | 0.044 | 10.04 | 0.68 | 0.0114 | 0.823 |
| C6 | Bottom (10) | 0.73 | 0.5 | 0.056 | 11.05 | 0.81 | 0.0135 | 0.868 |
| C7 | Surface (0.5) | — | 0.56 | 0.028 | 5.77 | — | — | — |
| C7 | Bottom (12) | — | 0.43 | 0.044 | 10.25 | 0.68 | 0.0114 | 0.823 |
| C8 | Surface (0.5) | — | 0.26 | 0.028 | 5.97 | — | — | — |
| C8 | Bottom (14) | — | 0.32 | 0.028 | 7.81 | — | 0.0079 | 0.58 |
| C9 | Surface (0.5) | 1.36 | 0.86 | 0.104 | 20.53 | 1.32 | 0.0234 | 1.532 |
| C10 | Surface (0.5) | — | — | — | — | — | — | — |
| C10 | Bottom (9) | — | 0.18 | — | — | — | — | — |
| C11 | Surface (0.5) | — | 0.22 | 0.028 | 5.83 | — | 0.0061 | — |
| C11 | Bottom (15) | — | 0.18 | 0.021 | 4.97 | — | 0.0057 | — |
| C12 | Surface (0.5) | — | 0.18 | 0.021 | 6.46 | — | 0.0054 | — |
| C12 | Bottom (18) | — | — | — | — | — | — | — |
| C13 | Surface (0.5) | 1.32 | 0.82 | 0.104 | 18.29 | 1.21 | 0.0224 | 1.484 |
| C14 | Surface (0.5) | — | 0.21 | 0.028 | 4.99 | — | — | — |
| C14 | Bottom (10) | — | 0.24 | 0.028 | 5.4 | — | — | — |
| C15 | Surface (0.5) | — | 0.18 | 0.021 | 4.63 | — | — | — |
| C15 | Bottom (17) | — | 0.21 | 0.021 | 4.88 | — | — | — |
| C16 | Surface (0.5) | — | 0.18 | — | 4.34 | — | — | — |
| C16 | Middle (10) | — | — | — | — | — | — | |
| C16 | Bottom (23) | — | 0.18 | — | 4.85 | — | — | — |
| C17 | Surface (0.5) | 1.44 | 0.86 | 0.088 | 18.14 | 1.18 | 0.0221 | 1.567 |
| C18 | Surface (0.5) | — | 0.18 | 0.021 | 4.75 | — | — | — |
| C18 | Bottom (8) | — | 0.21 | 0.021 | 4.93 | — | — | — |
| C19 | Surface (0.5) | — | 0.18 | 4.31 | — | — | — | |
| C19 | Bottom (14) | — | 0.21 | 0.021 | 4.52 | — | — | — |
| C20 | Surface (0.5) | — | — | — | — | — | — | — |
| C20 | Middle (10) | — | — | — | — | — | — | 0.982 |
| C20 | Bottom (23) | — | 0.18 | — | 4.31 | — | — | — |
| F14 | Surface (0.5) | — | 0.18 | 0.021 | — | — | 0.0056 | 0.422 |
| F14 | Bottom (22) | — | 0.21 | 0.021 | 4.4 | — | 0.0061 | 0.456 |
| F16 | Surface (0.5) | — | 0.32 | 0.038 | 4.95 | — | 0.0079 | 0.58 |
| F16 | Bottom (20) | — | 0.26 | 0.021 | 4.63 | — | 0.0072 | 0.53 |
| F17 | Surface (0.5) | — | 0.21 | 0.021 | — | — | 0.0062 | 0.453 |
| F17 | Middle (10) | — | 0.18 | 0.021 | — | — | — | 0.411 |
| F17 | Bottom (25) | — | 0.18 | 0.021 | — | — | 0.0055 | 0.422 |
| F19 | Surface (0.5) | — | 0.26 | 0.038 | 5.45 | — | 0.0074 | 0.544 |
| F19 | Bottom (20) | — | 0.21 | 0.021 | 4.95 | — | 0.0063 | 0.47 |
| F20 | Surface (0.5) | — | 0.21 | 0.021 | 4.8 | — | 0.0066 | 0.419 |
| F20 | Middle (10) | — | — | 0.021 | — | — | — | 0.391 |
| F20 | Bottom (24) | — | 0.18 | 0.021 | — | — | — | 0.422 |
| Ocean Region | Cu (μg/L) | Pb (μg/L) | Cd (μg/L) | Zn (μg/L) | Cr (μg/L) | Hg (μg/L) | As (μg/L) | Reference |
|---|---|---|---|---|---|---|---|---|
| Beihai coast: north surface | 1.36 ± 0.22 (n = 6) | 0.64 ± 0.27 (n = 11) | 0.07 ± 0.03 (n = 11) | 12.66 ± 5.90 (n = 11) | 1.07 ± 0.31 (n = 8) | 0.02 ± 0.007 (n = 9) | 1.20 ± 0.44 (n = 9) | this study |
| Beihai coast: south surface | * | 0.21 ± 0.04 (n = 12) | 0.03 ± 0.007 (n = 10) | 5.05 ± 0.68 (n = 10) | * | 0.006 ± 0.001 (n = 7) | 0.48 ± 0.07 (n = 5) | |
| Average surface | 1.36 ± 0.22 (n = 6) | 0.41 ± 0.28 (n = 23) | 0.047 ± 0.032 (n = 23) | 9.034 ± 5.722 (n = 21) | 1.068 ± 0.314 (n = 8) | 0.013 ± 0.008 (n = 16) | 0.947 ± 0.499 (n = 14) | |
| Beihai coast: north bottom | 0.74 (n = 2) | 0.46 ± 0.09 (n = 5) | 0.05 ± 0.01 (n = 5) | 10.31 ± 1.55 (n = 5) | 0.78 ± 0.07 (n = 4) | 0.012 ± 0.003 (n = 5) | 0.85 ± 0.17 (n = 5) | |
| Beihai coast: south bottom | * | 0.20 ± 0.03 (n = 13) | 0.022 ± 0.002 (n = 10) | 4.78 ± 0.32 (n = 10) | * | 0.006 ± 0.001 (n = 5) | 0.46 ± 0.04 (n = 5) | |
| Average bottom | 0.74 (n = 2) | 0.27 ± 0.13 (n = 18) | 0.03 ± 0.02 (n = 15) | 6.63 ± 2.83 (n = 15) | 0.78 ± 0.07 (n = 4) | 0.009 ± 0.004 (n = 10) | 0.65 ± 0.23 (n = 10) | |
| Beibu Gulf | 1.06 | 0.23 | 0.03 | 12.12 | 0.65 | 0.08 | 0.62 | [34] |
| West Guangdong coastal | 1.91 | 1.81 | 0.09 | 11.86 | 1.27 | — | 1.86 | [48] |
| Global average | 1.68 | 0.079 | 0.08 | 0.6 | — | — | 0.62 | [49] |
| Grade I | 5 | 1 | 1 | 20 | 50 | 0.05 | 20 | GB 3097- 1997 * |
| Grade II | 10 | 5 | 5 | 50 | 100 | 0.2 | 30 |
Disclaimer/Publisher’s Note: The statements, opinions and data contained in all publications are solely those of the individual author(s) and contributor(s) and not of MDPI and/or the editor(s). MDPI and/or the editor(s) disclaim responsibility for any injury to people or property resulting from any ideas, methods, instructions or products referred to in the content. |
© 2025 by the authors. Licensee MDPI, Basel, Switzerland. This article is an open access article distributed under the terms and conditions of the Creative Commons Attribution (CC BY) license (https://creativecommons.org/licenses/by/4.0/).
Share and Cite
Chaolu; Miao, B.; Qian, N. Geospatial Analysis of Heavy Metal Concentrations in the Coastal Marine Environment of Beihai, Guangxi During April 2021. Coasts 2025, 5, 27. https://doi.org/10.3390/coasts5030027
Chaolu, Miao B, Qian N. Geospatial Analysis of Heavy Metal Concentrations in the Coastal Marine Environment of Beihai, Guangxi During April 2021. Coasts. 2025; 5(3):27. https://doi.org/10.3390/coasts5030027
Chicago/Turabian StyleChaolu, Bo Miao, and Na Qian. 2025. "Geospatial Analysis of Heavy Metal Concentrations in the Coastal Marine Environment of Beihai, Guangxi During April 2021" Coasts 5, no. 3: 27. https://doi.org/10.3390/coasts5030027
APA StyleChaolu, Miao, B., & Qian, N. (2025). Geospatial Analysis of Heavy Metal Concentrations in the Coastal Marine Environment of Beihai, Guangxi During April 2021. Coasts, 5(3), 27. https://doi.org/10.3390/coasts5030027