Abstract
Recreational diving depends on healthy marine ecosystems, yet it can harm biodiversity through species displacement and habitat damage. Bombinhas, a biodiverse diving hotspot in southern Brazil, faces growing threats from human activity and climate change. This study assessed the ecological structure of Sepultura Beach (2018) for potential diving trails, comparing it with historical data from Porto Belo Island. Using visual censuses, transects, and photo-quadrats across six sampling campaigns, researchers documented 2419 organisms from five zoological groups, identifying 14 dominant species, including Haemulon aurolineatum and Diplodus argenteus. Cluster analysis revealed three ecological zones, with higher biodiversity at the site’s edges (Groups 1 and 3), but these areas also hosted endangered species like Epinephelus marginatus, complicating trail planning. A major concern was the widespread bleaching of the zoanthid Palythoa caribaeorum, a key ecosystem engineer, likely due to rising sea temperatures (+1.68 °C from 1961–2018) and declining chlorophyll-a levels post-2015. Comparisons with past data showed a 0.33 °C increase in species’ thermal preferences over 17 years, alongside lower trophic levels and greater ecological vulnerability, indicating tropicalization from the expanding Brazil Current. While Sepultura Beach’s biodiversity supports diving tourism, conservation efforts must address coral bleaching and endangered species protection. Long-term monitoring is crucial to track warming impacts, and adaptive management is needed for sustainable trail development. The study highlights the urgent need to balance ecotourism with climate resilience in subtropical marine ecosystems.
1. Introduction
The natural potential of the environment largely supports recreational diving, but it also depends directly on its intrinsic beauty and the status of conservation, which are key factors in attracting underwater tourism [1,2,3]. Merino et al. [4] stress that diving can alter species distribution, change community structure, and cause physical harm to resident organisms. In this context, minimizing the interference of diving activity in the marine environment and preserving the integrity of the visited ecosystem are essential for the prosperity and continuity of the activity and the sustainability of the environment [5,6,7]. Thus, it is important to identify the most sensitive areas and spatial patterns of diversity in this region.
The city of Bombinhas is located on the Porto Belo peninsula in South Brazil, comprising 39 beaches and two islands in a restricted area of 35,913 km, where it is still possible to find virtually untouched environments [8,9,10]. The landscapes and diversity of marine life have created great potential for marine tourism, with one of the most desired diving sites in the region. Recreational diving in coastal areas and islands currently brings, besides economic benefits to the region, a great concern due to the environmental degradation caused by this activity [6,7,11]. As a result, several studies have been conducted on this subject, in which the main concern is maintaining the integrity of the rocky shores [12,13,14]. In this context, the adequacy of diving activity in natural marine areas like Bombinhas is of the utmost importance. The implementation of underwater trails in places where diving activity is developed aims at the conservation of the marine environment and the safety of the user [8]. Underwater trails have been implemented on the Brazilian coast, as is the case in studies developed in the State of Santa Catarina in João da Cunha Island in Porto Belo (27.141° S, 48.543° W [15]), in Campeche Island (−27.695° S, 48.466° W [16]), and in another two in the State of São Paulo, Brazil, located on Anchieta Island (23.550° S, 45066° W [7]) and Picinguaba (−23.377° S, 44.837° W [17]).
A common element in each of these places is the presence of the White encrusting zoanthid Palythoa cariberum Duchassaing & Michelotti, 1860. This species is an important structurer of the benthic community [18,19,20] and is widely distributed in the rocky reefs in the Western Atlantic Ocean. The species is distributed in tropical and subtropical areas from the state of Florida (USA) to the state of Santa Catarina (Arvoredo Island, South Brazil, 27° S), representing the global southern limit of the species’ distribution [21,22,23]. The broad geographic distribution of P. caribaeorum is possible due to its great tolerance to a wide range of environmental conditions [24]. However, these organisms have shown signs of bleaching in several places throughout their distribution [22,25,26]. A probable combination of anthropogenic effects with the accumulation of thermal anomalies is the cause of bleaching [27,28,29]. During the increasingly frequent periods of high seawater temperatures, bleaching is caused to the loss of the zooxanthellae (symbiotic dinoflagellates) that provide the zoanthids with nutrition through translocation of photosynthetic products [30,31,32]. During bleaching, endosymbiotic dinoflagellate algae (Symbiodinium spp.) are either lost from the animal tissue or lose their photosynthetic pigments, resulting in host mortality if the Symbiodinium populations fail to recover [25,26,33].
In southern Brazil, the seawater temperature has increased above the global average from 2012 onwards between Cabo Frio (Brazil, 22° S) and Tierra del Fuego (Argentina, 55° S) [34,35,36]. Such a trend has created one of the world’s largest marine warming hotspots, induced by the poleward displacement of the wind patterns over the South Atlantic, which led to a southward expansion of the warm waters of the Brazil Current over the past decades, and subsequent warming along its path [37,38,39]. This study aimed to evaluate (a) the abundance and diversity of Sepultura Beach, providing subsidies for the implementation of underwater trails enabling harmonious experiences for recreational divers, the conservation of the environment in which they will be inserted, and reductions in the impact caused by activity in this environment; (b) the importance of the White encrusting zoanthid as a faunal aggregator. In this case, the results found were compared with a nearby area (Porto Belo Island) following a similar methodology carried out 17 years ago, under the hypothesis that the increasing temperatures may have modified the community structure at Sepultura Beach, based on the analysis of the biological attributes of the species present.
2. Materials and Methods
2.1. Origin of Samples
The characterization of the marine fauna of Sepultura Beach (Figure 1) was performed through 6 campaigns (2–3 February, 9 March, 13 April, 15 August, and 26 September of 2018). Marine species were quantified by sight with Self-Contained Underwater Breathing Apparatus (S.C.U.B.A.) at 11 sampling points using three methodologies [8,40,41].
Visual census and transects: This method is used for the delimitation and identification or sampling of a representative part for a given area. The transect consists of drawing, with the aid of a tape measure, a straight line of an appropriate size for the environment to obtain a representative sample. Subsequently, an extension of 200 m to be sampled is delimited for each side of the transect, thus generating a well-known sampling area. Visual censuses were used to count and identify all organisms in the sampling area.
Punctual transect and photo-quadrat: This method consists of drawing, with the help of a tape measure, a straight line of an appropriate size for the environment to obtain a representative sample. Subsequently, a point distance is defined for sampling (i.e., every 5 m), thus generating equidistant samplings at points along the transect where photographic recording is performed with the aid of a quadrat with a known area.
Active search and photographic record: Organisms and environmental structures were observed through a random search performed for 25 min in a previously determined sampling area, taking photographic records of the individuals found.
All methods took an average of 25 min and were always performed in pairs, using a signaling buoy and reel, as well as a compass to mark the course of the transect and the dive computer to mark the profile. Depth, temperature, and background time were also recorded. These methods were adapted from a study conducted in Porto Belo Island [8,15] in the same study area. In the latter, however, quantification was not carried out, allowing only a qualitative comparison.
All organisms observed were subsequently identified at the lowest taxonomic level possible using specialized identification guides [42,43,44,45,46,47,48,49,50,51,52] and organized in spreadsheets containing their respective orders, families, and the number of specimens observed at each sampling point in 1 of the 6 campaigns. An inventory was created for all species.
The species present were classified according to their risk of extinction, according to Ordinance N°445 [53], which establishes the following categories: (1) under risk of extinction—species with high risk of disappearance in nature shortly—(2) over-exploited—species whose catch conditions for one or all age classes in a population are so high that they reduce biomass and spawning potential, and future catching will push them below safety levels and/or threaten them with over-exploitation; species whose level of exploitation is close to that of over-exploitation.

Figure 1.
(A). A geographical representation of the distribution of the White encrusting zoanthid Palythoa caribaeorum in the Atlantic Ocean. The black dots represent sites of occurrence of the zoanthid, and the colored bands delimit the regions in the Atlantic Ocean according to Spalding et al. [54]. (B). The location of the study areas in South Brazil: Sepultura Beach (Study Area A); Porto Belo Island (Study Area B).
2.2. Spatial Patterns in Species Composition and Diversity
The identified species were ordered according to their numerical abundance to visualize the main species occurring in the study area. After that, species present were structured in data matrices for further quantitative analysis of diversity and the reconstruction of ecological descriptors. Ecological descriptors were used to evaluate spatial patterns in diversity in order to find the best place to implement an underwater diving trail. All the species found in a nearby area in Porto Belo Island [15] (Figure 1) were listed for posterior analysis of temporal patterns in species composition.
The ecological indices of species richness (S), total number of individuals (N), Margalef richness (R), and Pielou equitability (J′) were calculated. R is calculated by:
where S is the species richness and N is the total number of individuals. J′ is described by:
where pi is the proportion of the ith species at the sampling station [55].
(S − 1)/log(N)
Species occurrences per sampling station in each campaign were used to reconstruct a species accumulation curve. The function applied finds the expected average number of species per sampling site. Sites were added in random order using 1000 permutations, and the standard deviation of this mean was calculated. Box charts were also added, allowing the observation of the first and third quartiles and the maximum and minimum values of the total number of individuals delimited by the bars [56].
A data matrix containing all the species sampled in each sampling site per campaign was used to evaluate spatial and temporal variability at Sepultura Beach. Species that accumulated 90% numerical abundance were selected, and a new matrix was generated dividing each sum by the total number of organisms. With this new standardized matrix, a Bray–Curtis dissimilarity matrix was calculated and used to identify spatiotemporal patterns in the occurrence of organisms through a cluster analysis using the Ward Method. This method is based on the fit of linear least squares models, allowing the identification of similar groups by minimizing the sum of squared residuals in each group [57].
The groups identified in the cluster analysis were compared by three different methods: (a) a similarity analysis (ANOSIM); (b) a multiple replication permutation procedure (MRPP); (c) a permutational analysis of variance (PERMANOVA) based on the dissimilarity matrix using 1000 permutations. If the two analyzed groups were different in terms of species composition, the dissimilarities between two or more groups should be greater than within these groups, where significant dissimilarities would be indicated by p values less than 0.05. After that, pairwise comparisons were performed by a PAIRWISE.PERMANOVA test [58,59,60], and the ecological descriptors calculated were compared between groups using a Kruskal–Wallis test [56].
Because the ecological descriptors used (i.e., species number, diversity, and evenness) are influenced by the sample size, a beta diversity index was calculated to eliminate this effect. The species present in each group identified in cluster analysis were attributed to a species matrix. Beta diversity values were calculated using the sim method (βsim = minimum percentage (b, c)/(minimum percentage (b, c) + a), as recommended in these cases [61].
These calculated values were represented by ternary diagrams based on the spatial distribution of the species in order to allow comparisons between sampling sites: (a’) indicates species shared between two sampling sites, (b’) indicates species present in the first sampling site, but not occurring in the second site, and (c’) indicates species present in the second site, but absent in the first. The obtained values were applied to a procedure for determining the distance between the sampling sites and the centroid of the groups identified in the cluster analysis, reducing the original distance to the main coordinates and generating estimates of beta diversity [56]. The significance of this clustering was evaluated by a multivariate permutation test for correspondence analysis for dispersion homogeneity, which compares model residuals, generating a permuted distribution of F values over the null hypothesis that there is no difference in dispersion between the groups. A paired comparison test was also applied [56].
The influence of the environmental variables upon the structure of the community in the study area was first analyzed in generalized additive models for location, scale, and shape (GAMLSS) [62,63,64]. Underwater records obtained from scientific divers (counts) were compared to all variables measured during the dives: season, bottom type (rock or sand), bottom cover [algae (Padina or Sargassum) or Palythoa caribaeorum], hour of the day, in situ temperature, and depth. After that, the community was evaluated by incorporating spatial processes in a distance-based redundancy analysis (dbRDA) [56,65,66]. The dbRDA was applied to determine how environmental variables could explain the variation in the species composition in Sepultura Beach. The significance tests for explanatory variables were calculated into Principal Coordinates Analysis (PCoA). Species composition was first Hellinger-transformed, converted into a dissimilarity matrix using altGower distance, and then converted back to a rectangular table containing rows of objects by columns of PCoA coordinates. The matrix of the PCoA comprises the eigenvectors scaled to a length that is equal to the square root of their eigenvalues [67]. This new matrix containing uncorrelated coordinates represents the species variables that were then related to fishing data using classical RDA [56].
The patterns linked to these variables can represent processes associated with unmeasured biological and environmental variation among each of the locations [56]. Explanatory variables were subjected to a forward selection to determine those that were relevant for size composition [57]. The significance tests for explanatory variables were calculated using a pseudo-F-statistic from a permutation test (PERMUTEST). Results of the dbRDA were visualized for the length structure scores, significant variables, and site scores, the latter depicted by linear combinations of constraining variables [56,65,66].
The accuracy of fish re-classification to their original locations was assessed with flexible discriminant analysis (FDA) [59,60]. FDA uses nonlinear combinations of predictors, such as splines, which are useful for modeling multivariate non-normality or nonlinear relationships between variables within each group. The correct re-classification percentage of the discriminant functions was calculated using a jack-knifed matrix for the transformed training and test sets [68].
2.3. Temporal Patterns in Species Composition
The structure of the community was compared on a temporal scale using underwater qualitative records of species observed in Porto Belo Island in the early 2000s with those observed in Sepultura Bay (see Wegner [15] for details). These records were compared using GAMLSS, assuming a Box–Cox transformed probability distribution [62,63,64,69]. Because P. caribaeorum had not shown any signs of bleaching during the early 2000s, the intrinsic characteristics of the species observed in each area were obtained in the FishBase Dataset [70]. This standardization allowed us to evaluate the temporal variability of the preferred temperature between areas (Porto Belo Island and Sepultura Beach), and the influence of trophic level, vulnerability, and resilience.
2.4. Environment Variability
Environmental temperature was obtained from three different sources: 1. Meteorological stations between 1961 and 2019; 2. Satellite images (SIs) (1993–2019); 3. Water temperature (WT) obtained in situ with dive computers between February and September 2018.
Temperature records from meteorological stations were obtained for instantaneous, minimum, and maximum values from the station of Porto Belo within the vicinity of the study area between 1961 and 2019 [71]. The study used sea surface temperature and chlorophyll data from satellite images obtained from the GLORYS12V1 product, a high-resolution global ocean model assimilating satellite altimetry (TOPEX POSEIDON, ERS-1) and observational data. The dataset covers 27 years (1993–2020) with a spatial resolution of 0.083° × 0.083°, 50 depth levels, and WGS 84 coordinates. The study area was divided into nine quadrants within the bounds −27.04° N to −27.28° S and −48.62° W to −48.37° E. The data, stored in NetCDF format, contained 3D variables (temperature, salinity, currents, etc.) but required processing due to computational constraints. The data were extracted, separating dimensional variables (latitude, longitude, time, depth) and potential seawater temperature and chlorophyll, then restructured into a matrix format for analysis.
A Pearson correlation coefficient was calculated for temperature values obtained from the MS and SIs (between 1993 and 2018) and between temperature and chlorophyll values obtained by SIs and by dive computers (February to September 2018—WT). Subsequently, the temperatures obtained from the MS and SIs were standardized in GAMLSS. These models aimed to verify a significant change throughout time. All analyses were performed in R [72].
3. Results
3.1. General Species Composition
In total, in the six campaigns, 2419 organisms were distributed across nine zoological groups: bony fish (32), crustaceans (7), echinoderms (8), mollusks (4), and cnidaria (3). The quantification of the total species found at each sampling point in the six campaigns is listed in Table S1, as well as species listed in Ordinance N°445 [53]. These species were the eight-armed star Coscinasterias tenuispina (Lamarck, 1816); the green sea urchin Lytechinus variegatus (Lamarck, 1816); the seahorse Hippocampus reidi Ginsburg, 1933; the black grouper Epinephelus marginatus (Lowe, 1834); the royal cherub Hyporthodus niveatus (Valenciennes, 1828), the black grouper Epinephelus morio (Valenciennes, 1828), and the gray parrotfish Sparisoma axillare (Steindachner, 1878). All these organisms were observed in Porto Belo, and only the green urchin, the black grouper, and the gray parrotfish were observed at Sepultura Beach.
Among the species observed at Sepultura Beach, 14 taxa presented numerical abundance greater than 1%, these being Haemulon aurolineatum Cuvier, 1830; Diplodus argenteus (Valenciennes, 1830); Arbacia lixula (Linnaeus, 1758); Stegastes fuscus (Cuvier, 1830); Abudefduf saxatilis (Linnaeus, 1758); Diplectrum formosum (Linnaeus, 1766); Orthopristis ruber (Cuvier, 1830); Holothuria grisea Selenka, 1867; Coryphopterus glaucofraenum Gill, 1863; several gobies* Lytechinus variegatus Lamarck, 1816; Actinostella flosculifera (Le Sueur, 1817); Stenorhynchus seticornis (Herbst, 1788); and Astralium latispina (Philippi, 1844) (Figure 2).
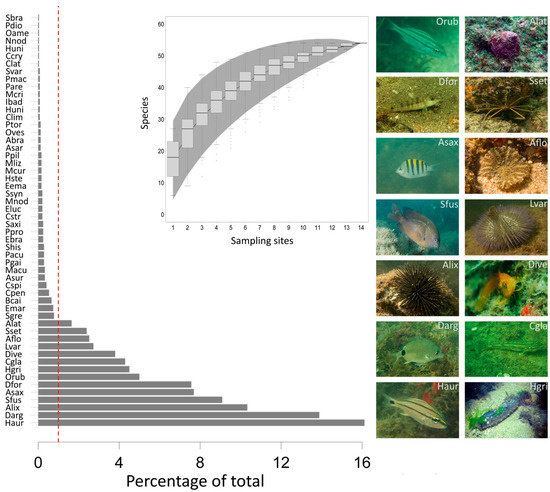
Figure 2.
Species represented as percentages of the total organisms observed at Sepultura Beach between February and September 2018. The dotted line separates species with more than a 1% share of the numerical abundance of organisms. The species accumulation curve was reconstructed from species accumulated at all sampling points during the 6 campaigns at Sepultura Beach between February and September 2018. The boxes represent the median variation in species richness as points were added, and the hatch area represents the standard deviation.
In each campaign, new species progressively contributed to numerical abundance, increasing diversity in the study area. The total number of species in the study area showed a stabilization pattern over the upper interval from the insertion of thirteen sampling points (Figure 3).
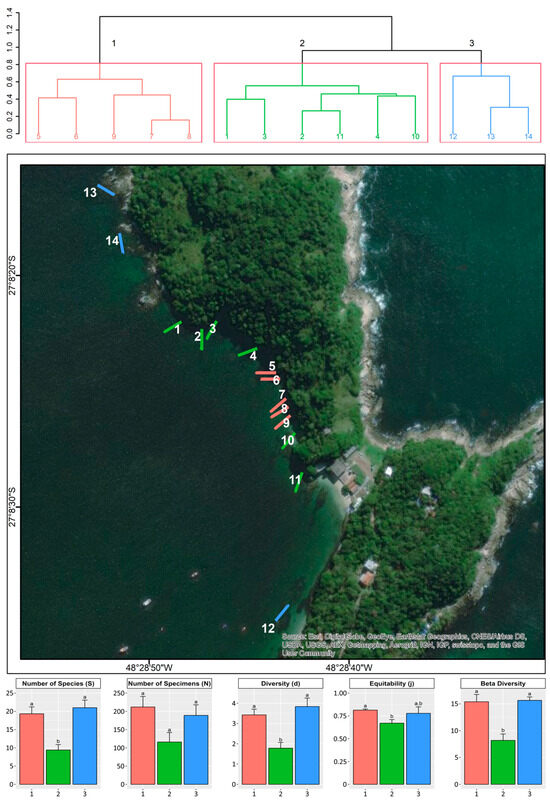
Figure 3.
Hierarchical cluster analysis was constructed from ichthyofauna components and other zoological groups, and the spatial distribution of these groups in Sepultura Beach between February and September 2018 is shown. Groups identified were represented by numbers 1 to 3. Ecological descriptors were reconstructed between groups for the number of species (S); number of specimens (N); diversity (d); equitability (j), and beta diversity. Different letters above the boxes indicate significant differences (pseudo-t-test, p < 0.05) observed by permutational univariate pair-wise analysis among regions. Data is presented as mean values ± standard errors.
3.2. Spatial Patterns in Species Composition of Sepultura Beach
The hierarchical cluster analysis identified three distinct groups in the study area in relation to the numerical abundance of the main species (Figure 4). This separation implies a group present in the associated coastal region in the most protected innermost part of the study area (Group I), another group located at the ends of Group I (Group II), and another group distributed at the extremes of the study area (Group III). Significant differences were observed between these groups based on three separate analyses (ANOSIN, R = 0.8322, p = 0.0009; MRPP, A = 0.2618, p = 0.0009; PERMANOVA, pseudo-F = 3.8128, p = 0.0009).
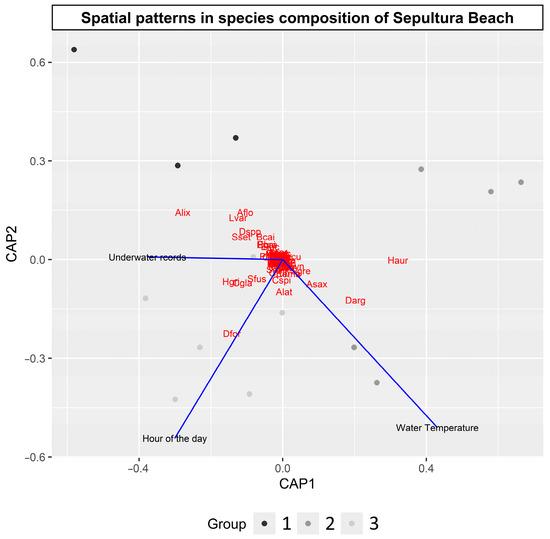
Figure 4.
Distance-based redundancy analysis (DB_RDA) based on distance matrices created from Hellinger transformations, with axes designed to minimize discrimination between groups identified in cluster analysis. Red dots represent code of species listed in Table S1. Colored dots represent groups identified in cluster analysis, and vectors show significant variables.
Pairwise comparisons between the groups identified in the Sepultura Beach cluster analysis showed that Group 1 and Group 3 were similar (PAIRWISE.PERMANOVA, pseudo-F = 1.274, p = 0.293), while significant differences were found between Group 1 and Group 2 (PAIRWISE.PERMANOVA, pseudo-F = 6.554, p = 0.005) and between Group 2 and Group 3 (PAIRWISE.PERMANOVA, pseudo-F = 4.647, p = 0.047). The FDA confirmed this tendency, showing that most of the variability was explained by species richness and diversity (Figure 5).
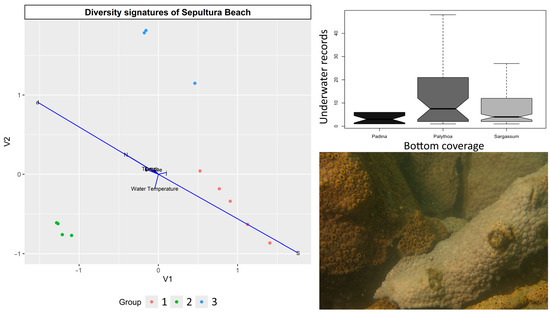
Figure 5.
Diversity signatures observed from scores of flexible discriminant analysis (FDA) at Sepultura Beach between February and September 2018. Colored dots represent groups identified through cluster analysis, and vectors show significant variables. Boxplots represent significant differences in underwater records among different predominant types of seabed coverage, and picture shows large-scale bleaching of Palythoa caribaeorum.
Analysis of the ecological descriptors revealed that the number of species, diversity, and equitability were higher in Group 1 and Group 3 (Figure 3). Notably, the multivariate permutation test for conditioned correspondence analysis (F = 15.570, p = 0.002) found a significant difference between the identified groups regarding beta diversity. Pairwise comparison demonstrates that beta diversity (distance of the centroid) was similar in Group 1 and Group 3, which were significantly different from Group 2 (Figure 3).
In the DB-RDA, three variables showed significant differences: underwater records, hour of observation, and temperature. Groups were removed from the DB-RDA due to collinearity. However, the displacement of sampling stations’ scores reinforced the existence of the groups identified in the cluster analysis (Figure 4).
3.3. Temporal Patterns in Species Composition
Results from GAMLSS for the preferred temperature show significant variation between areas (GAMLSS, t value = 3.297, p = 0.00176). Significant differences were also observed for minimum preferred temperatures (GAMLSS, t value = 3.297, p = 0.00176), maximum preferred temperatures (GAMLSS, t value = 3.297, p = 0.00176), trophic level (GAMLSS, t value = 3.297, p = 0.00176), and resilience (GAMLSS, t value = 3.297, p = 0.00176). The average preferred temperature increased by 0.33 °C, while differences in minimum and maximum preferred temperatures accounted for an increase of 0.14 °C in 17 years. The trophic level has decreased from 3.47 to 3.36.
3.4. Environment Variability
The temperature values obtained from weather stations and satellite images showed a perfect correlation (R = 1). In the comparison between the temperature values obtained from satellite images and the water, the correlation coefficient was 0.92, indicating the same increasing trend. The fitted temperature values for the weather stations showed an average increase of 1.68 °C between 1961 and 2018, and an increase of 0.64 °C was determined between 1993 and 2018 in the values adjusted from satellite images. The chlorophyll profiles showed a downward trend from 2015 onwards (Figure 6).
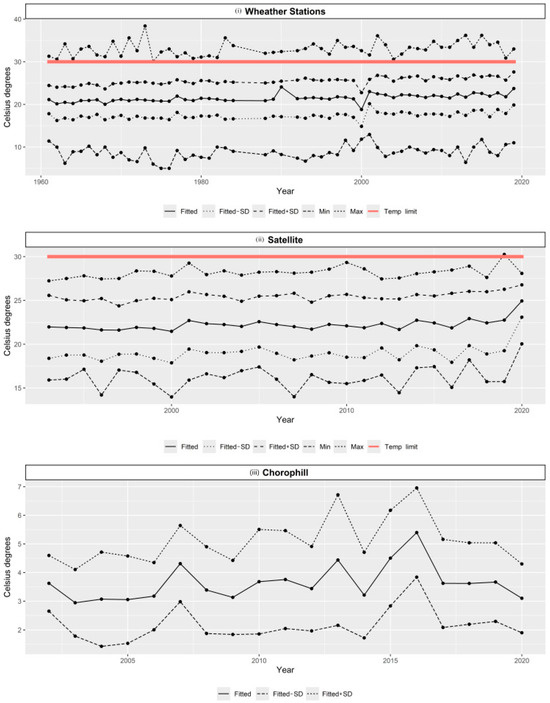
Figure 6.
Historical records of environmental variables obtained for study area: (i) Temperature from weather stations (1961–2019); (ii) temperature from satellite images (1993–2020); (iii) chlorophyll profiles (2002–2020). Lines represent fitted values, standard deviation, and minimum and maximum values. Red line represents temperature limit that allows P. caribaeorum to recover from bleaching events.
4. Discussion
The implementation of underwater diving trails primarily depends on the knowledge of a region’s abundance and diversity, as well as the environmental factors that govern them, in order to select the best faunal trajectory that attracts the interest of the diving public [15,16,17]. In this study, although the points were not sampled concurrently at Sepultura Beach, the study area showed clear spatial heterogeneity, with the formation of three groupings of sampling sites. The structuring of the community in the study area was also influenced by the number of underwater records, the time of observation, and the temperature; these factors need to be considered when implementing dive trails.
The number of species and the indices of diversity within Group 1 and Group 3 achieved two times those values observed in Group 2. Values of equitability followed the same tendency. The spatial arrangement of these values shows that the diversity increases from the central area to the extremes of the study area at Sepultura Beach, configuring itself as a positive factor in their favor regarding the choice of place to create underwater trails [15,16,17]. The analysis of partitioned diversity (beta diversity) allowed a better understanding of the variation in community structure in the study area. Considering that the centroid distance is a measure of beta diversity [61], the paired comparisons showed that the sampling sites of Groups 1 and Group 3 were areas with greater diversity, reinforcing the results obtained with the conventional ecological descriptors, such as the number of species, diversity, and equitability. In part, these indices could be explained by the presence of Palythoa caribaerum bottoms in the sampling sites of Group 1, which serve as aggregators of fauna, as observed in other studies on rocky beaches along the Brazilian coast [18,19,20].
The significant differences observed in the numerical abundances and temperature in the structure of the community could be associated with the thermal preference of the individuals and the spatial structure of the study area, especially for Group 2. The movement of fish communities to seek optimal habitats is poorly studied, and it may be limited due to high levels of site fidelity and strong microhabitat associations [73]. On the other hand, some studies have demonstrated that fish associated with coral reef structures move to cooler, deeper waters during periods of elevated temperatures, seeking shelter during times of day when solar irradiance is strongest [26,74,75]. Moreover, regarding the species listed in Ordinance N°445 [53], the places with the highest number of visual records of these species were the points of Groups 3, 2, and 1, in that order. The presence of endangered species counteracts the other criteria raised for choosing an area to create an underwater diving trail [7,16,17]. While it is necessary to have sufficient attractiveness to arouse the curiosity of the target audience, which is basically related to high diversity and the regularity of the presence of these organisms in the region in question, the areas that met these requirements were also the areas with more endangered species. The creation of an underwater trail, in this case, as well as the monitoring of the diving activity, should consider specific measures so as not to harm these species [5,6,8].
Nonetheless, the main subject of the current study was to highlight the P. caribaeorum coverage bleaching at Sepultura Beach. The same was not observed at Sepultura Beach in 2013 [76] or on Porto Belo Island between 2000 and 2001 [15]. Palythoa caribaeorum bleaching has been observed in several locations at different times. The first documented cases of bleaching for this species were reported in the northeastern region of Brazil in 1997 [77]. Since then, several records have been documented [25,27,28]. Increasing temperatures caused by global warming have been pointed out as the main cause of bleaching [22]. Despite the species’ high resilience, laboratory studies have shown that when exposed to temperatures ranging from 24 °C to 30 °C, zoanthids have a good chance of recovering [26]. A study using species distribution models and projections of the distribution area showed that significant variables associated with this distribution were highly important, such as the salinity, concentration of calcite, maximum concentration of chlorophyll-a, pH, and temperature range [27].
These variables appear to have a greater impact as a result of the temperature increase. Variation in salinity can alter the zonation of zoanthids, including P. caribaeorum, by inducing osmotic stress [24]. Changes in chlorophyll-a concentrations can also play a role in the distribution of P. caribaeorum due to its dependence on heterotrophic nutrition and water column productivity. In this species, such effects work differently from most coral reef species, which depend solely on autotrophy and, therefore, clear oligotrophic waters. Some authors report that the determination of chlorophyll-a using satellite images is biased because it is not possible to differentiate it from dissolved organic matter without an algorithm specific to each region [78,79,80]. However, the study area would not suffer from river discharge due to the lack of an important river nearby. Moreover, the area is known for its good conditions for diving and maritime tourism but holds lots of fishing and tourism vessels. The oil spilled from their engines could also affect P. caribaeorum [81]. Another question that has been recently raised is the influence of sunblock oils.
The historical patterns in chlorophyll distribution may be linked to the poleward spread of the Brazil Current, which has become more intense since 2012, spreading more oligotrophic water to southern Brazil [34,35,36]. A similar response was observed in the increase in water temperature and the species with thermal affinities for warmer waters [36]. The significant changes in species vulnerability and trophic levels may indicate that the ecosystem structure has also changed, as was recently observed in the same study area during a similar time frame [82]. A similar pattern in reducing primary production has been reported [81] for southern Brazil as a possible result of the tropicalization of the Southwest Atlantic Ocean [34,35,36,37,38,39]. The significant increase in species with a thermal preference for warmer waters, increased vulnerability, and a drop in trophic level may reflect this, as has been observed in the demersal fishery of southern Brazil in the last two decades [36]. In addition, the projection scenarios point to a reduction in the species’ distribution area at its latitudinal extremes, with complete disappearance by the year 2100 predicted in these locations [27]. The results observed in this study may indicate the beginning of this process of loss in the distribution area.
5. Conclusions
The delimitation of scuba diving trails showed a strong spatial relationship with the presence of Palythoa carybaeorum. In this case, not only commercial activity, but also the physical integrity of the environment, depends on the health of this zoanthid. This study only provided a snapshot of the bleaching observed in the study area in 2018. As the temperature values have shown an upward trend in the years since, it is essential to establish a monitoring plan to monitor th e evolution of this scenario and verify whether the 2018 bleaching was a one-off event or whether the projected trends of a reduction in the species’ area of occurrence are evolving towards a reduction in its global southern limit of distribution in the South Atlantic.
Supplementary Materials
The following supporting information can be downloaded at: https://www.mdpi.com/article/10.3390/coasts5030026/s1.
Author Contributions
Conceptualization, R.S. and E.W.; methodology, R.S.; formal analysis, R.S.; investigation, R.S., L.G., C.E.N.d.O., P.H.M.L.M. and E.W.; writing—original draft preparation, R.S.; writing—review and editing, R.S., L.G., C.E.N.d.O., P.H.M.L.M. and E.W.; project administration, R.S. and E.W. All authors have read and agreed to the published version of the manuscript.
Funding
This research received no external funding.
Institutional Review Board Statement
Not applicable.
Data Availability Statement
Data are present in the text.
Acknowledgments
Credit to Antonio Carlos Lopes, Cocoa, for making this partnership between Univali and Casa do Turista possible. Their entrepreneurship and concern for the environment have shown the importance of this research, which we believe to be useful, not only for Casa do Turista, but also for the other dive operators in the region, and especially the managers of this important area of the Santa Catarina coast.
Conflicts of Interest
The authors declare no conflicts of interest.
References
- Abidin, S.Z.Z.; Mohamed, B. A Review of SCUBA Diving Impacts and Implication for Coral Reefs Conservation and Tourism Management. In SHS Web of Conferences, Proceedings of the 4th International Conference on Tourism Research, Kola Kinabalu, Malaysia, 9–11 December 2014; Mydin, M.A.O., Marzuki, A., Eds.; EDP Sciences: Les Ulis, France, 2014. [Google Scholar] [CrossRef]
- Giglio, V.J.; Luiz, O.J.; Schiavetti, A. Marine life preferences and perceptions among recreational divers in Brazilian coral reefs December 2015. Tour. Manag. 2015, 52, 49–57. [Google Scholar] [CrossRef]
- Leite, T.S.; Pinheiro, I.E.; Berchez, F.; Bertoncini, Á.A.; Del Cima, O.M.; Demetrescu, I.E.; Francini-Filho, R.B.; Kikuchi, R.K.P.; Machado, A.A.; Maia-Nogueira, R.; et al. Scientific diving in Brazil: History, present and perspectives. Ocean Coast. Res. 2023, 71, e23045. [Google Scholar] [CrossRef]
- Merino, N.B.; Bravo-Olivas, M.L.; Chávez-Dagostino, R.M.; Medina-Rosas, P. Impacts of Recreational SCUBA Diving on a Natural Area in Puerto Vallarta, Mexico. Sustainability 2021, 13, 6249. [Google Scholar] [CrossRef]
- de Groot, J.; Bush, S.R. The potential for dive tourism led entrepreneurial marine protected areas in Curacao. Mar. Policy 2010, 34, 1051–1059. [Google Scholar] [CrossRef]
- Wongthong, P.; Harvey, N. Integrated coastal management and sustainable tourism: A case study of the reef-based SCUBA dive industry from Thailand. Ocean Coast. Manag. 2014, 95, 138–146. [Google Scholar] [CrossRef]
- Hipólito, C.; Lopes, F.; Goncalves, J.; Calado, H. A Critical Approach to Existing Management Perspectives in Scuba Diving: A Step in Defining Ecological Carrying Capacity. Sustainability 2024, 16, 1762. [Google Scholar] [CrossRef]
- Wegner, E.; Tonioli, F.C.; Cabral, D.Q. Underwater Trails: A New Possibility of Marine Tourism. J. Coast. Res. 2006, 39, 990–993. Available online: http://www.jstor.org/stable/25741727 (accessed on 1 April 2020).
- Menezes, J.T.; Albernaz, M.B. Projeto de Identificação e Mapeamento das Praias do Município de Bombinhas—SC; Universidade do Vale do Itajaí: Itajaí, Brazil, 2009. Available online: https://bombinhas.sc.gov.br/uploads/sites/369/2021/12/1500255_volume_5_uso_publico_PNM_Costeira_Zimbros.pdf (accessed on 17 July 2025).
- Prefeitura Municipal de Bombinhas. Diagnóstico Faunístico. Plano de Manejo da Área de Relevante Interesse Ecológico Costeira de Zimbros; Prefeitura Municipal de Bombinhas: Bombinhas, Brazil, 2011. Available online: https://bombinhas.sc.gov.br/uploads/sites/369/2021/12/964338_1_Diagnostico_Faunistico.pdf (accessed on 17 July 2025).
- Pedrini, A.G.; Messas, T.P.; Pereira, E.S.; Ghilardi-Lopes, N.P.; Berchez, F.A. Educação Ambiental pelo Ecoturismo numa trilha marinha no Parque Estadual da Ilha Anchieta, Ubatuba (SP). Rev. Bras. Ecoturismo 2010, 3, 428–459. [Google Scholar] [CrossRef]
- Pedrini, A.G. Trilhas Marinhas no Brasil; uma Síntese para a Educação Ambiental. In Proceedings of the II Congresso Nacional de Planejamento e Manejo de Trilhas, Rio de Janeiro, Brasil, 16–18 October 2013; Universidade do Estado do Rio de Janeiro: Rio de Janeiro, Brazil, 2013. [Google Scholar]
- Doiron, S.; Weissenberger, S. Sustainable dive tourism: Social and environmental impacts—The case of Roatan, Honduras. Tour. Manag. Perspect. 2014, 10, 19–26. [Google Scholar] [CrossRef]
- Dimmock, K.; Musa, G. Scuba diving tourism system: A framework for collaborative management and sustainability. Mar. Policy 2015, 54, 52–58. [Google Scholar] [CrossRef]
- Wegner, E. Proposta metodológica para implantação de trilhas subaquáticas na ilha João da Cunha, Porto Belo—SC. In Mestrado em Turismo, Centro de Educação Superior Balneário Camboriú; Universidade do Vale do Itajaí: Itajaí, Brazil, 2002; Available online: https://biblioteca.univali.br/acervo/138518/exemplares (accessed on 17 July 2025).
- Lima, M.L.P.; Schmidt, A.D.; Chamas, C.C.; Wegner, E. Implantação de trilhas subaquáticas guiadas na Ilha do Campeche, Florianópolis—SC. In Proceedings of the XV Encontros Nacionais de Gerenciamento Costeiro, Florianópolis, Brazil, 30 September—2 October 2006; Agência Brasileira de Gerenciamento Costeiro: São Paulo, Brazil, 2006. [Google Scholar]
- Lima, M.L.P.; Schmidt, A.D.; Didomenico, M. Implantação de Trilhas Subáquaticas Guiadas em Picinguaba, Ubatuba, SP. In Proceedings of the IV Congresso Brasileiro de Oceanografia, Rio Grande, Brazil, 17–21 May 2010; Fundação de Amparo à Pesquisa do Estado de São Paulo: São Paulo, Brazil; FURG: Rio Grande, Brazil, 2010. [Google Scholar]
- Ferreira, C.E.L.; Gonçalves, J.E.A.; Coutinho, R. Community structure of fishes and habitat complexity on a tropical rocky shore. Environ. Biol. Fishes 2001, 61, 353–369. [Google Scholar] [CrossRef]
- OigmaN-Pszczol, S.; Figueiredo, M.A.O.; Creed, J.C. Distribution of Benthic communities on the tropical rocky subtidal of Armação dos Búzios, Southeastern Brazil. Mar. Ecol. 2004, 25, 173–190. [Google Scholar] [CrossRef]
- Mendonça-Neto, J.P.; Ferreira, C.E.L.; Chaves, L.C.T.; Pereira, R.P. Influence of Palythoa caribaeorum (Anthozoa, Cnidaria) zonation on site-attached reef fishes. An. Acad. Bras. Cienc. 2008, 80, 495–513. [Google Scholar] [CrossRef] [PubMed]
- Lesser, M.P.; Stochaj, W.R.; Tapley, D.W.; Shick, J.M. Bleaching in coral reef anthozoans: Effects of irradiance, ultraviolet radiation, and temperature on the activities of protective enzymes against active oxygen. Coral Reefs 1990, 8, 225–232. [Google Scholar] [CrossRef]
- Kemp, D.W.; Cook, C.B.; LaJeunesse, T.C.; Brooks, W.R. A comparison of the thermal bleaching responses of the zoanthid Palythoa caribaeorum from three geographically different regions in south Florida. J. Exp. Mar. Biol. Ecol. 2006, 335, 266–276. [Google Scholar] [CrossRef]
- Bouzon, J.L.; Brandini, F.P.; Rocha, R.M. Biodiversity of Sessile Fauna on rocky shores of coastal islands in Santa Catarina, Southern Brazil. Mar. Sci. 2012, 2, 39–47. [Google Scholar] [CrossRef]
- Sebens, K.P. Intertidal distribution of Zoanthids on the Caribbean Coast of Panamá: Effects of predation and desiccation. Bull. Mar. Sci. 1982, 32, 316–335. [Google Scholar]
- Costa-Sassi, C.F.; Sassi, R.; Farias, G.M. A widespread necrotizing disease affecting Palythoa caribaeorum (Duchassaing and Michelotti, 1860) on coastal reefs in northeastern Brazil. Ocean Coast. Res. 2020, 68, e20318. [Google Scholar] [CrossRef]
- Zamora-Jordán, N.; Martínez, P.M.; Hernández, M.; López, C. Responses of Palythoa caribaeorum and its associated endosymbionts to thermal stress. Coral Reefs 2024, 43, 1443–1454. [Google Scholar] [CrossRef]
- Durante, L.M.; Cruz, I.C.S.; Lotufo, T.M.C. The effect of climate change on the distribution of a tropical zoanthid (Palythoa caribaeorum) and its ecological implications. PeerJ 2018, 6, e4777. [Google Scholar] [CrossRef]
- Mariano, A.E.B. Branqueamento de Palythoa caribaeorum (Cnidaria, Anthozoa) em Locais Com Diferentes Impactos Antrópicos na APAMLN e na ESEC Tupinambás (Ubatuba—SP, Brasil); Trabalho de Conclusão de Curso em Ciências Biológicas; Instituto de Biociências, Universidade Estadual Paulista: São Vicente, Brazil, 2022. [Google Scholar]
- Sully, S.; Burkepile, D.E.; Donovan, M.K.; Hodgson, G.; van Woesik, R. A global analysis of coral bleaching over the past two decades. Nat. Commun. 2019, 10, 1264. [Google Scholar] [CrossRef] [PubMed]
- Lough, J.M.; van Oppen, M.J.H. Introduction: Coral bleaching: Patterns, processes, causes and consequences. In Coral Bleaching: Patterns, Processes, Causes and Consequences; van Oppen, M.J.H., Lough, J.M., Eds.; Springer: Berlin, Germany, 2009. [Google Scholar]
- Costa, C.F.; Sassi, R.; Gorlach-Lira, K.; Lajeunesse, T.C.; Fitt, W.K. Seasonal changes in zooxanthellae harbored by zoanthids (Cnidaria, Zoanthidea) from coastal reefs in northeastern Brazil. Pan-Am. J. Aquat. Sci. 2013, 8, 253–264. [Google Scholar]
- Tolleter, D.; Seneca, F.O.; DeNofrio, J.C.; Krediet, C.J.; Palumbi, S.R.; Pringle, J.R.; Grossman, A.R. Coral Bleaching Independent of Photosynthetic Activity. Curr. Biol. 2013, 23, 1782–1786. [Google Scholar] [CrossRef]
- Fujimura, A.G.; Riegl, B.M. Effects of water flow on intra- and intercolonial variability in bleaching of the zoanthid, Palythoa caribaeorum. J. Exp. Mar. Biol. Ecol. 2017, 490, 29–33. [Google Scholar] [CrossRef]
- Hobday, A.J.; Pecl, G.T. Identification of global marine hotspots: Sentinels for change and vanguards for adaptation action. Rev. Fish Biol. Fish. 2014, 24, 415–425. [Google Scholar] [CrossRef]
- Popova, E.; Yool, A.; Byfield, V.; Cochrane, K.; Coward, A.C.; Salim, S.S.; Gasalla, M.A.; Henson, S.A.; Hobday, A.J.; Pecl, G.T.; et al. From global to regional and back again: Common climate stressors of marine ecosystems relevant for adaptation across five ocean warming hotspots. Glob. Change Biol. 2016, 22, 2038–2053. [Google Scholar] [CrossRef] [PubMed]
- Perez, J.A.A.; Sant’Ana, R. Tropicalization of demersal megafauna in the western South Atlantic since 2013. Commun. Earth Environ. 2022, 3, 227. [Google Scholar] [CrossRef]
- Lumpkin, R.; Garzoli, S. Interannual to decadal changes in the western South Atlantic’s surface circulation. J. Geophys. Res. Ocean. 2011, 16, C01014. [Google Scholar] [CrossRef]
- Artana, C.; Provost, C.; Lellouche, J.-M.; Rio, M.-H.; Ferrai, R.; Sennéchael, N. The Malvinas Current at the Confluence with the Brazil Current: Inferences from 25 Years of Mercator Ocean Reanalysis. J. Geophys. Res. Ocean. 2019, 124, 7178–7200. [Google Scholar] [CrossRef]
- Franco, B.C.; Defeo, O.; Piola, A.R.; Barreiro, M.; Yang, H.; Ortega, L.; Gianelli, I.; Castello, J.P.; Vera, C.; Buratti, C.; et al. Climate change impacts on the atmospheric circulation, ocean and fisheries in the southwest South Atlantic Ocean: A review. Clim. Change 2020, 162, 2359–2377. [Google Scholar] [CrossRef]
- Baude, J.L.; Blouet, S.; Dupuy de la Grandrive, R.; Jourdan, E.; Piante, C. Underwater Trails Handbook. MedPAN North Project; WWF-France: Paris, France, 2012. [Google Scholar]
- Bravo, G.; Livore, J.P.; Bigatti, G. Monitoring rocky reef biodiversity by underwater geo-referenced photo-quadrats. Underw. Technol. 2021, 38, 17–24. [Google Scholar] [CrossRef]
- Barletta, M.; Corrêa, M.F.M. Guia Para Identificação de Peixes da Costa do Brasil; UFPR: Curitiba, Brazil, 1992. [Google Scholar]
- Carpenter, K.E. The living marine resources of the Western Central Atlantic. In FAO Species Catalogue for Fisheries Purposes and American Society of Ichthyologists and Herpetologists Special Publication 5; FAO: Rome, Italy, 2002. [Google Scholar]
- Figueiredo, J.L.; Menezes, N.A. Manual de Peixes Marinhos do Sudeste do Brasil. II. Teleostei (1); Mus. Zool. Univ. SP: São Paulo, Brazil, 1978. [Google Scholar]
- Figueiredo, J.L.; Menezes, N.A. Manual de Peixes Marinhos do Sudeste do Brasil. III. Teleostei (2); Mus. Zool. Univ. SP: São Paulo, Brazil, 1980. [Google Scholar]
- Figueiredo, J.L.; Menezes, N.A. Manual de Peixes Marinhos do Sudeste do Brasil. II. Teleostei (5); Mus. Zool. Univ. SP: São Paulo, Brazil, 2000. [Google Scholar]
- Jereb, P.; Roper, C.F.E. Cephalopods of the world. An annotated and illustrated catalogue of cephalopod species known to date. Myopsid and Oegopsid Squids. In FAO Species Catalogue for Fishery Purposes 4; FAO: Rome, Italy, 2010; Volume 2. [Google Scholar]
- Menezes, N.A.; Figueiredo, J.L. Manual de Peixes Marinhos do Sudeste do Brasil. IV. Teleostei (3); Mus. Zool. Univ. SP: São Paulo, Brazil, 1980. [Google Scholar]
- Menezes, N.A.; Figueiredo, J.L. Manual de Peixes Marinhos do Sudeste do Brasil. V. Teleostei (4); Mus. Zool. Univ. SP: São Paulo, Brazil, 1985. [Google Scholar]
- Lindner, A. Vida Marinha de Santa Catarina; Editora da UFSC: Florianópolis, Brazil, 2014. [Google Scholar]
- Melo, G.A.S. Manual de Identificação dos Brachyura (Caranguejos e Siris) do Litoral Brasileiro; Plêiade/FAPESP: São Paulo, Brazil, 1996. [Google Scholar]
- Pomory, C.M. A Guide to the Shallow-Water Echinodermata of the Texas Coast; Marine Science Institute: Port Aransas, TX, USA, 2004. [Google Scholar]
- Federal Government. Portaria MMA N° 445, de 17 de Dezembro de 2014. MMA. Diário Oficial da União; Federal Government: Brasília, Brazil, 2015; Volume 1, pp. 1–11. [Google Scholar]
- Spalding, M.D.; Fox, H.E.; Allen, G.R.; Davidson, N.; Ferdaña, Z.A.; Finlayson, M.; Halpern, B.S.; Jorge, M.A.; Lombana, A.; Lourie, S.A.; et al. Marine Ecoregions of the World: A Bioregionalization of Coastal and Shelf Areas. Bioscience 2007, 57, 573–583. [Google Scholar] [CrossRef]
- Pielou, E.C. The Measurement of Diversity in Different Types of Biological Colledions. J. Theor. Biol. 1966, 13, 131–144. [Google Scholar] [CrossRef]
- Oksanen, J.; Kindt, R.; Legendre, P.; O’Hara, B.; Simpson, G.L.; Solymos, P.; Henry, M.; Stevens, H.; Wagner, H. Community Ecology Package. 2025. Available online: http://cran.r-project.org/ (accessed on 23 July 2025).
- Borcard, D.; Gillet, F.; Legendre, P. Numerical Ecology with R. Use R! Springer: New York, NY, USA, 2011. [Google Scholar]
- Schroeder, R.; Avigliano, E.; Volpedo, A.V.; Callicó Fortunato, R.; Barrulas, P.; Daros, F.A.; Schwingel, P.R.; Dias, M.C.; Correia, A.T. Lebranche mullet Mugil liza population structure and connectivity patterns in the southwest Altantic ocean using a multidisciplinary approach Estuar. Coast. Shelf Sci. 2023, 288, 108368. [Google Scholar] [CrossRef]
- Schroeder, R.; Schwingel, P.R.; Schwarz, R.; Daros, F.A.; Franco, T.P.; Hoff, N.T.; Méndez Vicente, A.; Castro, J.P.; Vaz-dos-Santos, A.M.; Correia, A.T. Contribution of the nursery areas to the major fishing grounds of the Brazilian sardine (Sardinella brasiliensis) in Southeast and Southern Brazilian Bight inferred from otolith fingerprints. Fish. Res. 2023, 267, 106825. [Google Scholar] [CrossRef]
- Fischer, L.G.; Mourato, B.L.; Monteiro, D.S.; Sant’Ana, R. Opening Pandora’s Box: Reconstruction of Catches in Southeast-South Brazil Revealed Several Threatened Elasmobranch Species under One Umbrella Name. Coasts 2024, 4, 552–567. [Google Scholar] [CrossRef]
- Koleff, P.; Gaston, K.J.; Lennon, J.J. Measuring beta diversity for presence–absence data. J. Anim. Ecol. 2003, 72, 367–382. [Google Scholar] [CrossRef]
- Rigby, R.A.; Stasinopoulos, D.M. Using the Box-Cox t distribution in GAMLSS to model skewness and kurtosis. Stat. Model. 2006, 6, 209–229. [Google Scholar] [CrossRef]
- Stantipoulos, M.D.; Rigby, R.A.; Heller, G.Z.; Voudouris, V.; De Bastiani, F. Flexible Regression and Smoothing: Using GAMLSS in R; Chapman and Hall/CRC: London, UK, 2017. [Google Scholar]
- Neelon, B.; O’Malley, A.J. Two-Part Models for Zero-Modified Count and Semi-continuous Data. In Health Services Evaluation; Levy, A., Goring, S., Gatsonis, C., Sobolev, B., van Ginneken, E., Busse, R., Eds.; Springer: New York, NY, USA, 2019. [Google Scholar] [CrossRef]
- Schroeder, R.; Correia, A.T.; Medeiros, S.D.; Pessatti, M.L.; Schwingel, P.R. Spatiotemporal variability of the catch composition and discards estimates of the different methods of onboard preservation for the Brazilian sardine fishery in the southwest Atlantic Ocean. Thalass. Int. J. Mar. Sci. 2022, 38, 573–597. [Google Scholar] [CrossRef]
- Schroeder, R.; Santos, R.C.; Dias, M.C. Size structure of the Lebranche mullet (Mugil liza) captured by the ringed gillnet fleet off south Brazil. Reg. Stud. Mar. Sci. 2025, 86, 104232. [Google Scholar] [CrossRef]
- Gower, J. Some distance properties of latent root and vector methods used in multivariate analysis. Biometrika 1966, 53, 325–338. [Google Scholar] [CrossRef]
- Kassambara, A. Practical Guide to Cluster Analysis in R: Unsupervised Machine Learning, 1st ed.; STHDA. 2017. Available online: https://xsliulab.github.io/Workshop/2021/week10/r-cluster-book.pdf (accessed on 23 July 2025).
- Schroeder, R.; Schwingel, P.R.; Pinto, E.; Almeida, A.; Correia, A.T. Stock structure of the Brazilian sardine Sardinella brasiliensis from Southwest Atlantic Ocean inferred from otolith elemental signatures. Fish. Res. 2022, 248, 106192. [Google Scholar] [CrossRef]
- Froese, R.; Pauly, D. Fish Base. World Wide Web Electronic Publication. 2024. Available online: www.fishbase.org (accessed on 1 April 2022).
- INMET. National Institute of Meteorology. Data from the Automatic Station of Itapoá. 2020. Available online: https://tempo.inmet.gov.br/TabelaEstacoes/A001 (accessed on 13 March 2021).
- R Development Core Team. R. A Language and Environment for Statistical Computing; R Foundation for Statistical Computing: Viena, Austria, 2025; Available online: http://www.R-project.org (accessed on 17 July 2025).
- Lindberg, W.J.; Frazer, T.K.; Portier, K.M.; Vose, F.; Loftin, J.; Murie, D.J.; Mason, D.M.; Nagy, B.; Hart, M.K. Density-dependent habitat selection and performance by a large mobile reef fish. Ecol. Appl. 2006, 16, 731–746. [Google Scholar] [CrossRef] [PubMed]
- Richards, B.L.; Williams, I.D.; Vetter, O.J.; Williams, G.J. Environmental factors affecting large-bodied coral reef fish assemblages in the Mariana Archipelago. PLoS ONE 2012, 7, e31374. [Google Scholar] [CrossRef] [PubMed]
- Currey, L.; Heupel, M.; Simpfendorfer, C.; Williams, A. Assessing environmental correlates of fish movement on a coral reef. Coral Reefs 2015, 34, 1267–1277. [Google Scholar] [CrossRef]
- Riffel, R.F. Palythoa caribaeorum e Bunodosoma caissarum (Cnidaria: Anthozoa): Um caso de competição por substrato em costões rochosos no Atlântico Sul. In Trabalho de Conclusão de Curso de Ciências Biológicas; Universidade Federal de Santa Catarina: Florianópolis, Brazil, 2013. [Google Scholar]
- Migotto, A.E. Anthozoan bleaching on the southeastern coast of Brazil in the summer of 1994. In Proceedings of the 6th International Conference on Coelenterate Biology, Leeuwenhorst, Noordwijkerhout, The Netherlands, 16–21 July 1995; Volume 1, pp. 329–335. [Google Scholar]
- Ali, K.A.; Ortiz, J.; Bonini, N.; Shuman, M.; Sydow, C. Application of Aqua MODIS sensor data for estimating chlorophyll a in the turbid Case 2 waters of Lake Erie using bio-optical models. GIScience Remote Sens. 2016, 53, 483–505. [Google Scholar] [CrossRef]
- Liew, S.C.; Chia, A.S.; Kwoh, L.K. Evaluating the validity of SeaWiFS chlorophyll algorithm for coastal waters. In Proceedings of the 22nd Asian Conferencia on Remote Sensing, Singapore, 5–9 November 2001; pp. 1–5. [Google Scholar]
- Vazyulya, S.; Khrapko, A.; Kopelevich, O.; Burenkov, V.; Eremina, T.; Isaev, A. Regional algorithms forthe estimation of chlorophyll and suspended matter concentration in the Gulf of Finland from MODIS-Aqua satellite data. Oceanologia 2014, 56, 737–756. [Google Scholar] [CrossRef]
- Soares, M.S.; Bejarano, S.; Kitahara, M.V.; Rabelo, E.F.; Santos, M.E.A.; Cruz, I.C.S. The flourishing and vulnerabilities of zoantharians on Southwestern Atlantic reefs. Mar. Environ. Res. 2022, 173, 105535. [Google Scholar] [CrossRef]
- Schroeder, R.; Petermann, A.; Correia, A.T. The History of the Brazilian Sardine (Sardinella brasiliensis) Between Two Fishery Collapses: An Ecosystem Modeling Approach to Study Its Life Cycle. Biology 2025, 14, 13. [Google Scholar] [CrossRef]
Disclaimer/Publisher’s Note: The statements, opinions and data contained in all publications are solely those of the individual author(s) and contributor(s) and not of MDPI and/or the editor(s). MDPI and/or the editor(s) disclaim responsibility for any injury to people or property resulting from any ideas, methods, instructions or products referred to in the content. |
© 2025 by the authors. Licensee MDPI, Basel, Switzerland. This article is an open access article distributed under the terms and conditions of the Creative Commons Attribution (CC BY) license (https://creativecommons.org/licenses/by/4.0/).