Article

Acute Impacts of Hurricane Ian on Benthic Habitats, Water Quality, and Microbial Community Composition on the Southwest Florida Shelf

The Water School, Florida Gulf Coast University, 10501 FGCU Blvd. N, Fort Myers, FL 33965, USA
*
Author to whom correspondence should be addressed.
Coasts 2025, 5(2), 16; https://doi.org/10.3390/coasts5020016
Submission received: 21 February 2025 / Revised: 16 April 2025 / Accepted: 17 April 2025 / Published: 22 May 2025

Abstract

:
Tropical cyclones can severely disturb shallow, continental shelf ecosystems, affecting habitat structure, diversity, and ecosystem services. This study examines the impacts of Hurricane Ian on the Southwest Florida Shelf by assessing water quality, substrate type, and epibenthic and microbial community characteristics at eight sites (3 to 20 m in depth) before and after Ian’s passage in 2022. Hurricane Ian drastically changed substrate type and biotic cover, scouring away epibenthos and/or burying hard substrates in mud and sand, especially at mid depth (10 m) sites (92–98% loss). Following Hurricane Ian, the greatest losses were observed in fleshy macroalgae (58%), calcareous green algae (100%), seagrass (100%), sessile invertebrates (77%), and stony coral communities (71%), while soft coral (17%) and sponge communities (45%) were more resistant. After Ian, turbidity, chromophoric dissolved organic matter, and dissolved inorganic nitrogen and phosphorus increased at most sites, while total nitrogen, total phosphorus, and silica decreased. Microbial communities changed significantly post Ian, with estuary-associated taxa expanding further offshore. The results show that the shelf ecosystem is highly susceptible to disturbances from waves, deposition and erosion, and water quality changes caused by mixing and coastal discharge. More routine monitoring of this environment is necessary to understand the long-term patterns of these disturbances, their interactions, and how they influence the resilience and recovery processes of shelf ecosystems.

1. Introduction

Continental shelves are among the most biologically productive, diverse, and economically important ecosystems in the world, supporting most of the world’s marine biodiversity and fisheries harvests despite comprising less than 10% of total ocean area [1]. Because of their shallow nature and proximity to populated coastlines, these ecosystems are subject to an array of natural and anthropogenic disturbances. Among the most influential natural disturbances to continental shelves are major tropical cyclones, which alter the shelf communities via scouring, sediment transport, and changes in water quality [2,3,4,5]. Sediment movement during major cyclones can reveal new areas of hard bottom for benthic organisms to settle and can simultaneously bury other habitats with up to 1 m of unconsolidated sediments [6,7,8]. Physical (e.g., mixing, cooling), chemical (e.g., nutrient and organic carbon addition, dissolved organic matter remineralization), and biological (e.g., increased primary production) effects of tropical cyclones on shallow continental shelves can alter both the water column and benthic community composition [9,10,11,12,13]. However, the severity of these effects depends on several factors such as the cyclone’s intensity, trajectory and location, composition of the impacted marine community, types and amounts of allochthonous materials added, and resilience and response of the affected marine communities [14,15,16,17].
The pre- and post-typhoon impacts of Typhoon Maria on the pelagic ecosystem in the southern East China Sea were investigated and it was reported that the storm-induced physical disturbances, such as water column mixing, enhanced nutrient availability, which in turn led to higher primary production and increased chlorophyll-a concentrations in the shallow water column [13]. That study also reported that increased community respiration following the storm contributed to elevated pCO2, highlighting the complex interactions between tropical cyclones and marine ecosystems and emphasizing the need for further research to fully understand the ecological consequences of such disturbances [13]. Similarly, Hurricane Harvey in the Gulf of Mexico altered phytoplankton productivity, thereby affecting the entire marine ecosystem [9]. While the effects of tropical cyclones on the water column can last for months [9,18], the physical damage to benthic habitats can have long-lasting impacts.
It has been reported that the ecological succession within the shelf environments disturbed by tropical cyclones can take up to 10 years to return communities to their pre-disturbance states [8]. Spatially heterogeneous and intermediate-intensity disturbances can prevent competitive exclusion and support biodiversity [19,20,21,22], whereas severe, large-scale disturbances may lead to long-term loss of habitat, biodiversity, and ecosystem functioning, especially in areas impacted by multiple anthropogenic stressors [23]. In shelf communities, where resilience has been compromised by anthropogenic stresses, storm-disturbed benthic habitats may never recover, and instead shift to alternate states [24]. Furthermore, anthropogenic climate change is predicted to increase the intensity of tropical cyclones in many regions of the world [25,26], which is likely to lead to harsher disturbances to vulnerable environments such as the Southwest Florida Shelf (SWFS).
Cyclone-induced benthic damage can alter marine community structure, productivity, and diversity, leading to cascading effects on water column communities and higher trophic levels [27]. While recent studies have highlighted the effects of tropical cyclones on surface and upper water column communities [11,12,13], the effects of cyclones on benthic habitats can be more severe and are less understood. Therefore, it is vital to explore how major cyclones affect benthic habitats in shallow continental margins like the SWFS. This study addresses a key gap in understanding how tropical cyclones influence benthic habitats and community structure, ultimately affecting food web interactions and fisheries production in continental shelves.
The SWFS encompasses a vast expanse of the Gulf of Mexico (GOM), yet it has only recently begun to be mapped and studied [28,29]. The synergy of freshwater discharge (e.g., Caloosahatchee River, the western Everglades, and submarine springs), shallow depths, and long residence times make the SWFS particularly susceptible to the “estuarization of the shelf” [30], i.e., decreased salinity and optical water quality, increased turbidity and sediment deposition, harmful algal blooms (HABs), hypoxia, and anoxia [31,32,33]. Tropical cyclone disturbances can contribute to HABs by introducing massive nutrient pulses to the shelf, both through coastal discharges and through deep water mixing and upwelling [34,35,36]. The SWFS has unique surface currents and a resilient Cross-Shelf Transport Barrier (CSTB) that create a triangular “forbidden zone” isolating the shelf from the GOM loop current [37,38]. This causes suspended sediments, nutrients, dissolved organic matter (DOM) and other contaminants to linger and then accumulate near the coastline rather than being swept away, and may make it especially vulnerable to tropical cyclone disturbances. Despite the well-documented effects of chronic eutrophication and storm pulse events on water quality and HABs in Florida [31,34,35,36,39,40], there has been relatively little investigation into their effects on the benthic communities of the SWFS.
On 28 September 2022, Category 5 Hurricane Ian made landfall along the Southwest Florida coast, near Cayo Costa (26.6190° N, 82.2257° W), with peak winds of 259 km/h and peak storm surge of 4.5 m above ground level [41]. Hurricane Ian was among the most devastating storms in U.S. history, killing over 150 people and causing over $112 billion in damage [41]. Hurricane Ian struck during a survey of water quality and benthic communities of the SWFS (this study, funded by US EPA), providing unique insight into how hurricanes can alter this shelf environment. This is the first study of its kind for the region and one of the first pre-post analyses of tropical cyclone disturbances on benthic communities in shallow continental shelf environments other than coral reefs or estuaries [42,43]. Our objectives for this analysis were to determine the Hurricane Ian’s acute impacts on: (1) substrate characteristics, (2) epibenthic communities, (3) microbial communities, and (4) water quality.

2. Materials and Methods

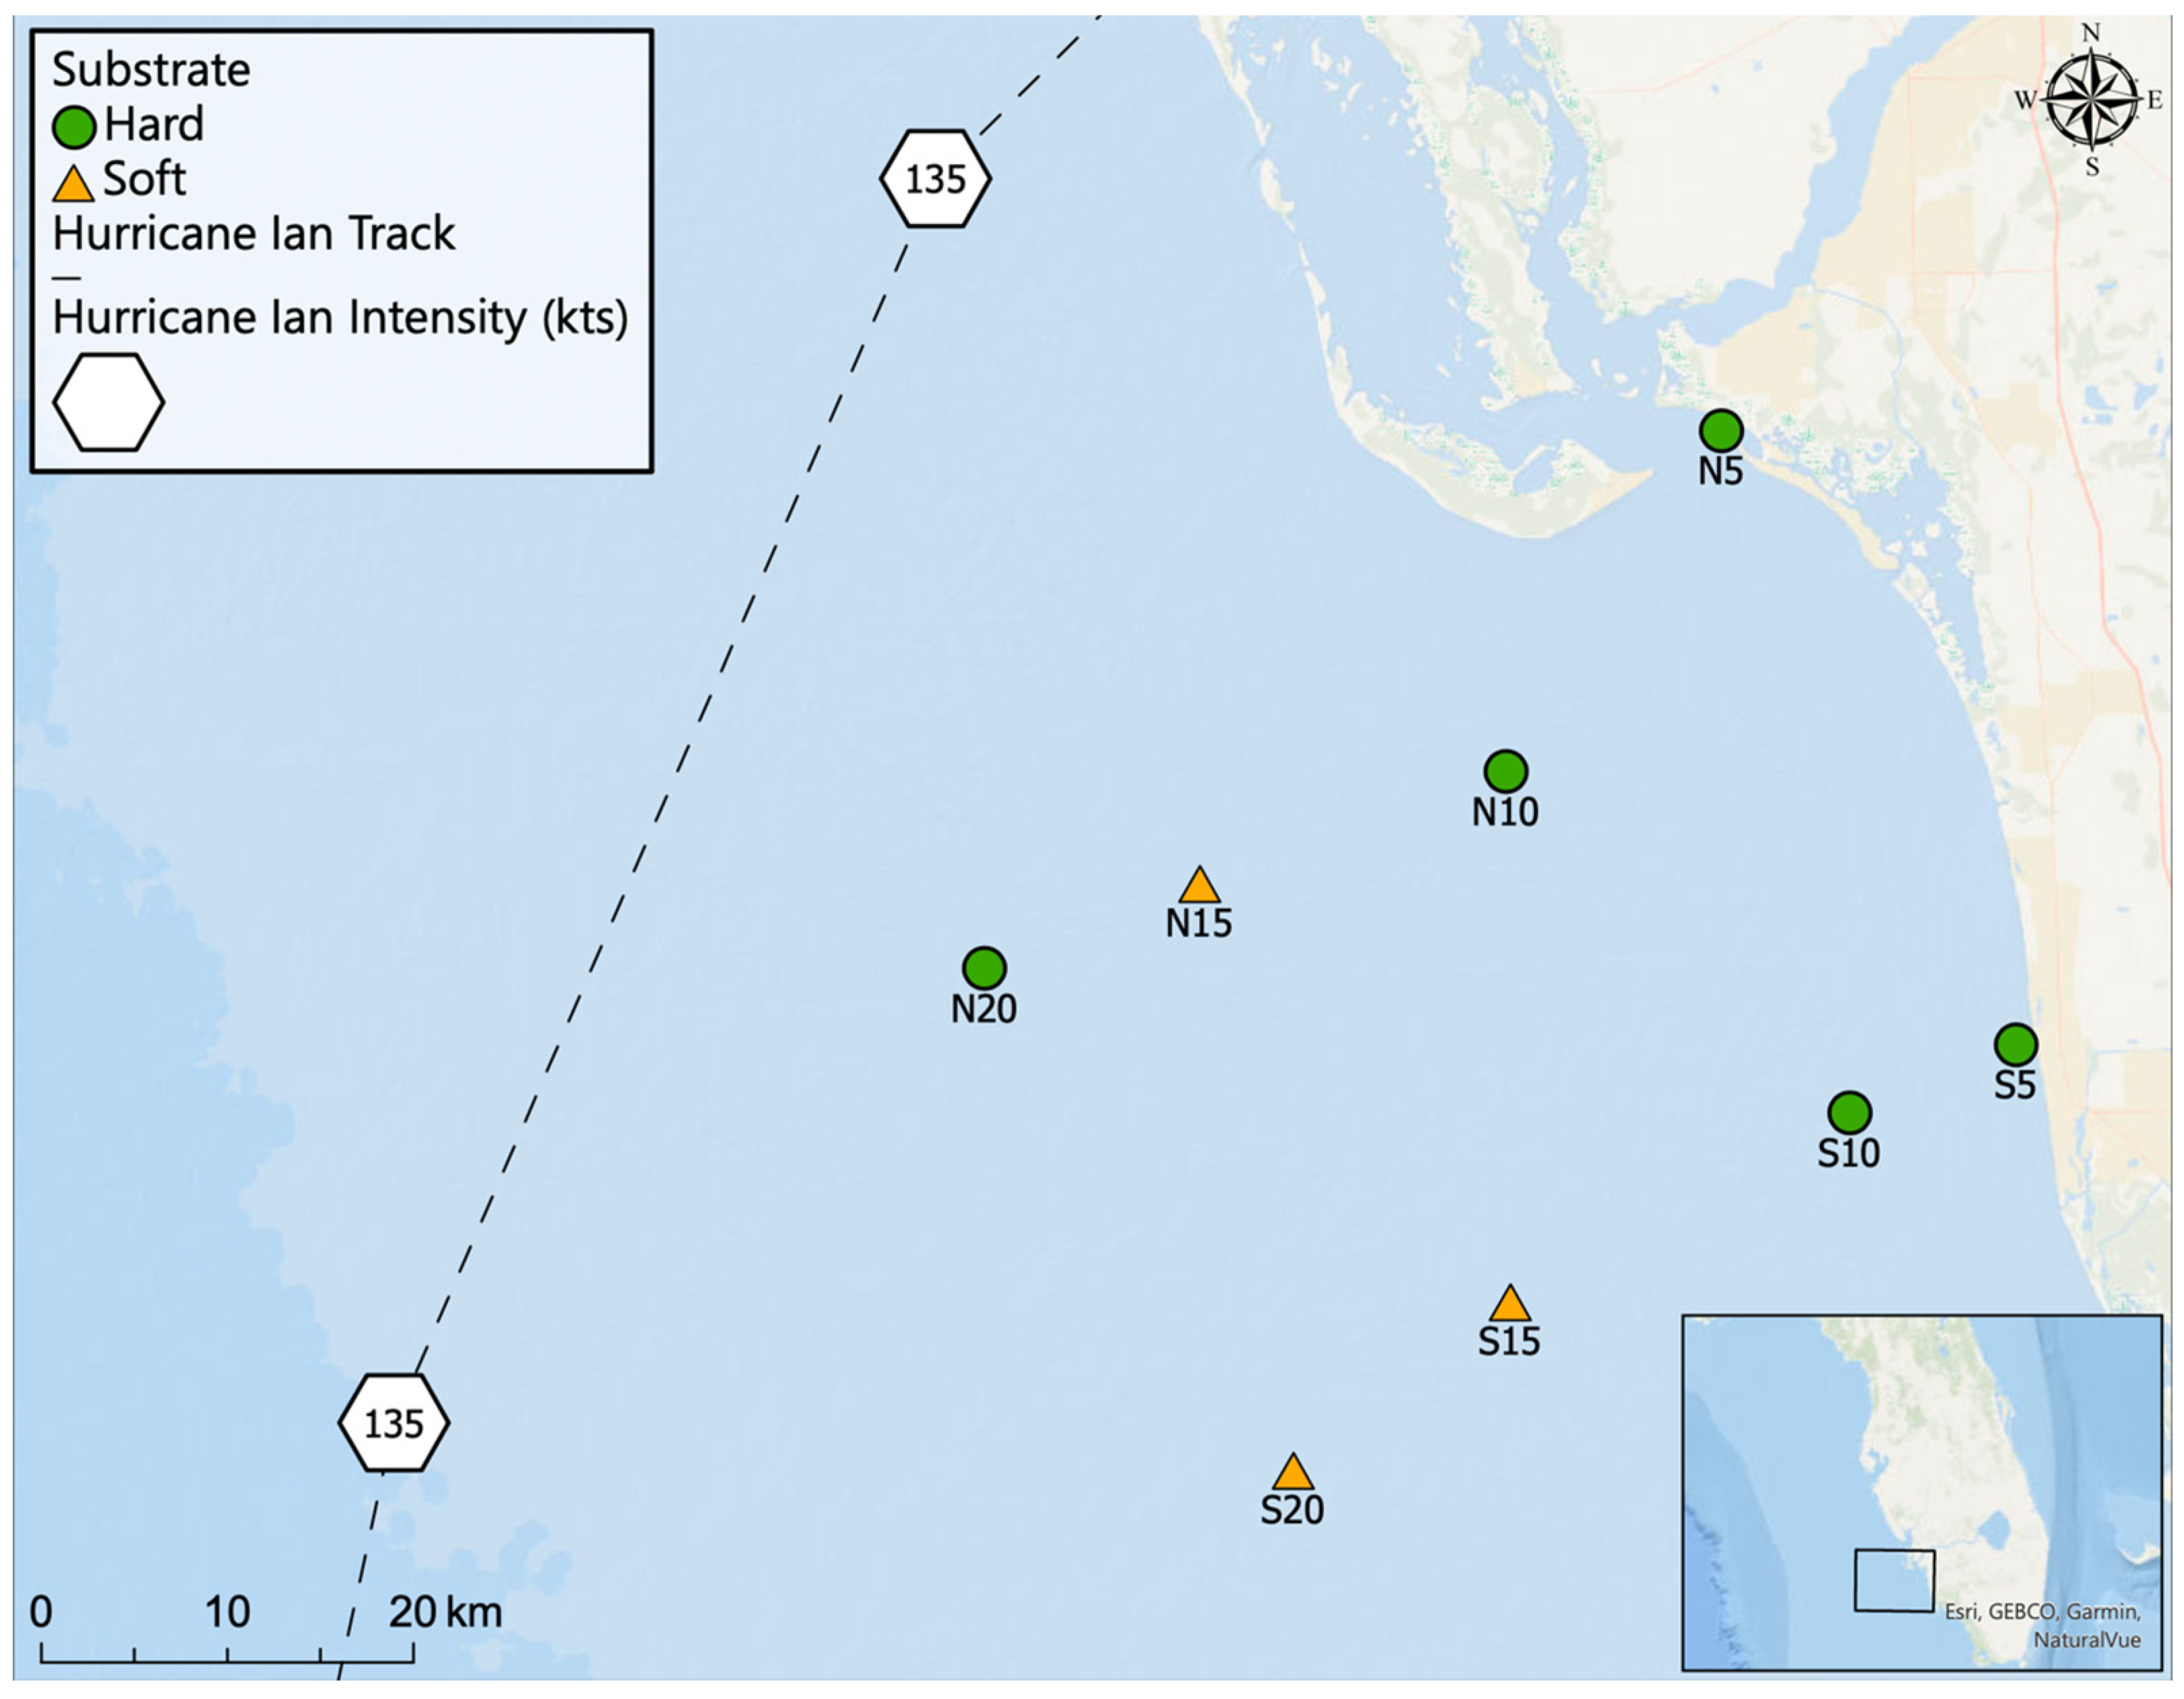
2.1. Sampling Locations

Eight sites were selected off the coast of Lee and Collier Counties, Florida, USA for assessing the effects of depth and distance from the Caloosahatchee River Estuary (CRE) on water quality, microbial community composition, and benthic habitat characteristics (Figure 1). The sites were arranged along two inshore-offshore transects, running approximately parallel to each other in a west-southwest direction. The northern transect originated near the mouth of the CRE while the south transect originated near Doctors Pass, ~30 km south of the CRE (Figure 1). Transects included sites at the 5, 10, 15, and 20 m depth contours, thus sites were coded by transect identity (N, S) and depth (Table A1, Figure 1). Where possible, hard substrate sites were selected at each depth, however, both 15 m sites and the southern 20 m site were soft substrate. The N5 site was located at 3 m depth due to there being no suitable hard bottom sites at 5 m depth near the CRE mouth. This analysis focuses on the acute effects of Hurricane Ian and is therefore restricted to the sampling events immediately pre- and post-hurricane; August 2022 and October 2022 (Table A1). The pre-hurricane surveys were conducted with small boats operated by Florida Gulf Coast University (FGCU) and the post-hurricane sampling was conducted onboard the R/V Hogarth operated by the Florida Institute of Oceanography (FIO).

2.2. Water Quality Parameters

At each site visit, vertical water column profiles for salinity (PSU), temperature (°C), dissolved oxygen (DO)(mg/L) and turbidity (NTU) were measured using an EXO II multiparameter water quality sonde (SKU #:599502-00, YSI, Yellow Springs, OH, USA). Discrete grab samples of water were collected from the surface (~0.5 m deep), middle depth (half of the total depth at the site), and near bottom, using a Van Dorn water sampler (item #:78902, Forestry Suppliers, Jackson, MS, USA), or with Niskin bottles, and stored following US Environmental Protection Agency (EPA) protocols until lab analyses for chlorophyll a, chromophoric dissolved organic matter (CDOM), silica (SiO2), nitrate (NO3), nitrite (NO2), ammonia (NH3), orthophosphate (PO43−), total nitrogen (TN), and total phosphorus (TP). The water samples for chlorophyll a were extracted using EPA method 445.0, and analyzed using a Trilogy fluorometer (model #7200-002, Turner Designs, San Jose, CA, USA) with a chlorophyll acid module (Turner Designs, model #7200-040). CDOM was measured with a Trilogy fluorometer (Turner Designs, model #7200-002) using seawater that was filtered using a 0.45 µm nylon syringe filter and measured with a CDOM module (Turner Designs, model #7200-069-W). Water samples for dissolved nutrients (SiO2, NO3, NO2, NH3, PO43−) were filtered using a 0.45 µm nylon syringe filter, put on ice, and frozen until analyzed using a SEAL AA500 continuous flow autoanalyzer (SEAL Analytical Inc., Mequon, WI, USA) following the manufacturer’s methods and calibrations (A-006-19, A-044-19, A-043-19, and A-005-19, respectively). Unfiltered water samples were collected and stored frozen for the analysis of TN and TP, respectively using a Shimadzu TOC with TNM-L accessory (Shimadzu Scientific Instruments, Inc., Columbia, MD, USA) and a SEAL AA500 continuous flow autoanalyzer (A-005-19). In addition to sonde casts and water sampling at each site, lux (lumens/m2), and current velocity were logged continuously throughout the study period at one site (N20, Figure 1). Light data were recorded with an Onset© HOBO UA-002-64 Pendant (HOBO Data Loggers, Bourne, MA, USA), and current data were recorded with a Lowell Instruments TCM-1 tilt current meter (Lowell Instruments LLC, East Falmouth, MA, USA). Total cell counts (TCC) were measured using a BD Accuri C6 flow cytometer (BD Biosciences, Franklin Lakes, NJ, USA). Bacteria TCC was measured by staining with SYBR green, and picocyanobacteria counts were measured through autofluorescence using cell size constraints to target prokaryotes.

2.3. Benthic Video Surveys

Benthic surveying was performed by divers with an Olympus® TG-6 underwater camera with PT-059 housing (Olympus Corporation of the Americas, Breinigsville, PA, USA) and two Backscatter® 1000 lumen mounted lights (Backscatter Underwater Video & Photo, Monterrey, CA, USA). Divers took video surveys along two 50-m transects; one at a compass heading of 0° from a cinderblock marking the center of the site, and the other at 270° degrees from the block. Video data were downloaded and analyzed in the laboratory to estimate percent cover by substrate type (hard bottom, shell/hash, and sand/mud) and by seven biotic cover categories (stony coral, soft coral, sponge, sessile invertebrates, seagrass, calcareous green algae [CGA], and fleshy macroalgae). These estimates were made for each 5 m segment along each of the two 50 m transects. Segments were treated as independent statistical replicates (n = 20 per site per survey).

2.4. Sediment Characteristics

Surface sediments were collected in 50 mL vials, either directly by divers or by sub-sampling from a 860-A10 Shipek® grab sampler (WildCo®, Yulee, FL, USA), onboard R/V Hogarth, and frozen until further analysis. Due to logistical challenges, post-hurricane sediment samples were not obtained from site N5. Sediments were analyzed for moisture content, bulk dry density, bulk organic matter content via loss of ignition (LOI) and grain size following previously described methods [45,46,47]. For organic matter characterization, at least two grams of dried sediments were combusted at 360 °C for three hours. This lower temperature was employed to minimize the contribution of carbonate loss to the organic matter calculation [47]. All moisture content and bulk organic matter analyses were performed in triplicate. To determine grain size distribution at each site, approximately 10 g of sediment dried at 105 °C was sieved into the following fractions; shell (>4 mm), fine shell (4–2 mm), coarse sand (2–0.25 mm), fine sand (250–63 µm), and silt/clay (<63 µm). Each size fraction was weighed and divided by the total sample weight to get its percent contribution to the sample.

2.5. Microbial Community Analysis

Sediment microbial community analyses were performed with sub-samples of the surface sediments collected, which were frozen at −20 °C. No sediment microbial data were obtained from south transect sites pre-hurricane (August 2022) because those samples dried out in storage prior to analysis, and no sediment microbial data were obtained from site N5 post-hurricane (October 2022) because no sediment sample was taken at that site (Table A1). Water column microbial community data was obtained from all sites. Surface water (200 mL) was filtered through cellulose nitrate filters (0.22 µm, 47 mm diameter, Thermo Scientific™ Nalgene™ analytical test filter funnels) (Thermo Fisher Scientific, Waltham, MA, USA) to collect microbial cells, and filters were frozen at −20 °C. For both sediment and water column microbial samples, amplification of the V4–V5 region of the 16S rRNA gene was conducted using the primer pair 515yF and 926pfR [48]. High-throughput DNA sequences were determined using Illumina MiSeq (2 × 300 bp) (MR DNA, Shallowater, TX, USA). A 30-cycle PCR (HotStarTaq Plus Master Mix Kit, Qiagen, MD, USA) was performed under the following conditions: 95 °C for 5 min, followed by 30 cycles of 95 °C for 30 s, 53 °C for 40 s, and 72 °C for 1 min, after which a final elongation step at 72 °C for 10 min was performed. After amplification, PCR products were checked in 2% agarose gel. Samples were multiplexed using unique dual indices and pooled together in equal proportions based on their molecular weight and concentrations of DNA. Pooled samples were purified using calibrated AMPure XP beads (Beckman Coulter Life Sciences, Brea, CA, USA). Then the pooled and purified PCR product was used to prepare an Illumina DNA library. Demultiplexed FASTQ files were imported to Qiime2 v2023.05 [49] and primer sequences were removed with q2-cutadapt. Quality control and denoising was done with Dada2 [50] to generate amplicon sequencing variants (ASV). Naïve Bayes classification was performed with the q2-feature-classifier plugin using the Silva database (v138.1) for reference [51]. Reference Sequence Annotation and Curation Pipeline (RESCRIPt) [52] was used to optimize classification to the 515f/926r primer set. ASV tables and taxonomy tables were exported and later used for statistical analysis in R and R studio (version 4.2.2). The amplicon sequence datasets were deposited in GenBank under BioProject number PRJNA1043673.

2.6. Statistical Analysis

All statistical analysis was conducted in R (version 4.2.2) [53]. Univariate techniques were used for response variables from water quality, sediment, and benthic video analyses, while multivariate techniques were used for microbial community analyses. The effect of date (pre- vs. post-hurricane), transect (N vs. S), and their interaction was examined for all response variables, except for microbial alpha diversity, for which only date was considered (Table A3). For water quality parameters collected at surface, middle, and bottom depths, the mean of all depths per site, per date was used as the response value. When the data did not meet assumptions of parametric statistics (i.e., normality and homogeneity of variance), non-parametric, permutational alternatives were used. For two-way ANOVA, the R package LmPerm [54] was utilized (Table A3). To allow even comparisons of sediment characteristics and sediment alpha diversity between pre- and post-hurricane conditions, statistical analysis was conducted only on sites with both pre- and post-hurricane data. A paired t-test was performed on alpha diversities to compare pre- and post-hurricane microbial communities, and if assumptions were not met the permutational alternative was used from the R package coin [55].
Microbial multivariate statistics were performed on the ASV level. Data manipulation and management were done using the phyloseq package [56]. Hill alpha diversities were computed with the HillR package [57] with samples rarefied to the lowest sequencing depth for equal coverage, statistical analyses were conducted only on sites with samples for both pre- and post-hurricane data (Table A4 and Table A5). The vegan package was used to calculate Bray-Curtis dissimilarity from relative abundances, which was the beta diversity metric utilized in non-metric multidimensional scaling (NMDS) [58]. Within vegan, the function adonis2 was used for permutational multivariate analysis of variance (PERMANOVA), to test if centroids of tested groups are statistically different from each other. If the samples did not display equal dispersion (assessed with betadisper) between groups PERMANOVA was not conducted. All graphics were made with ggplot2 [59].

3. Results

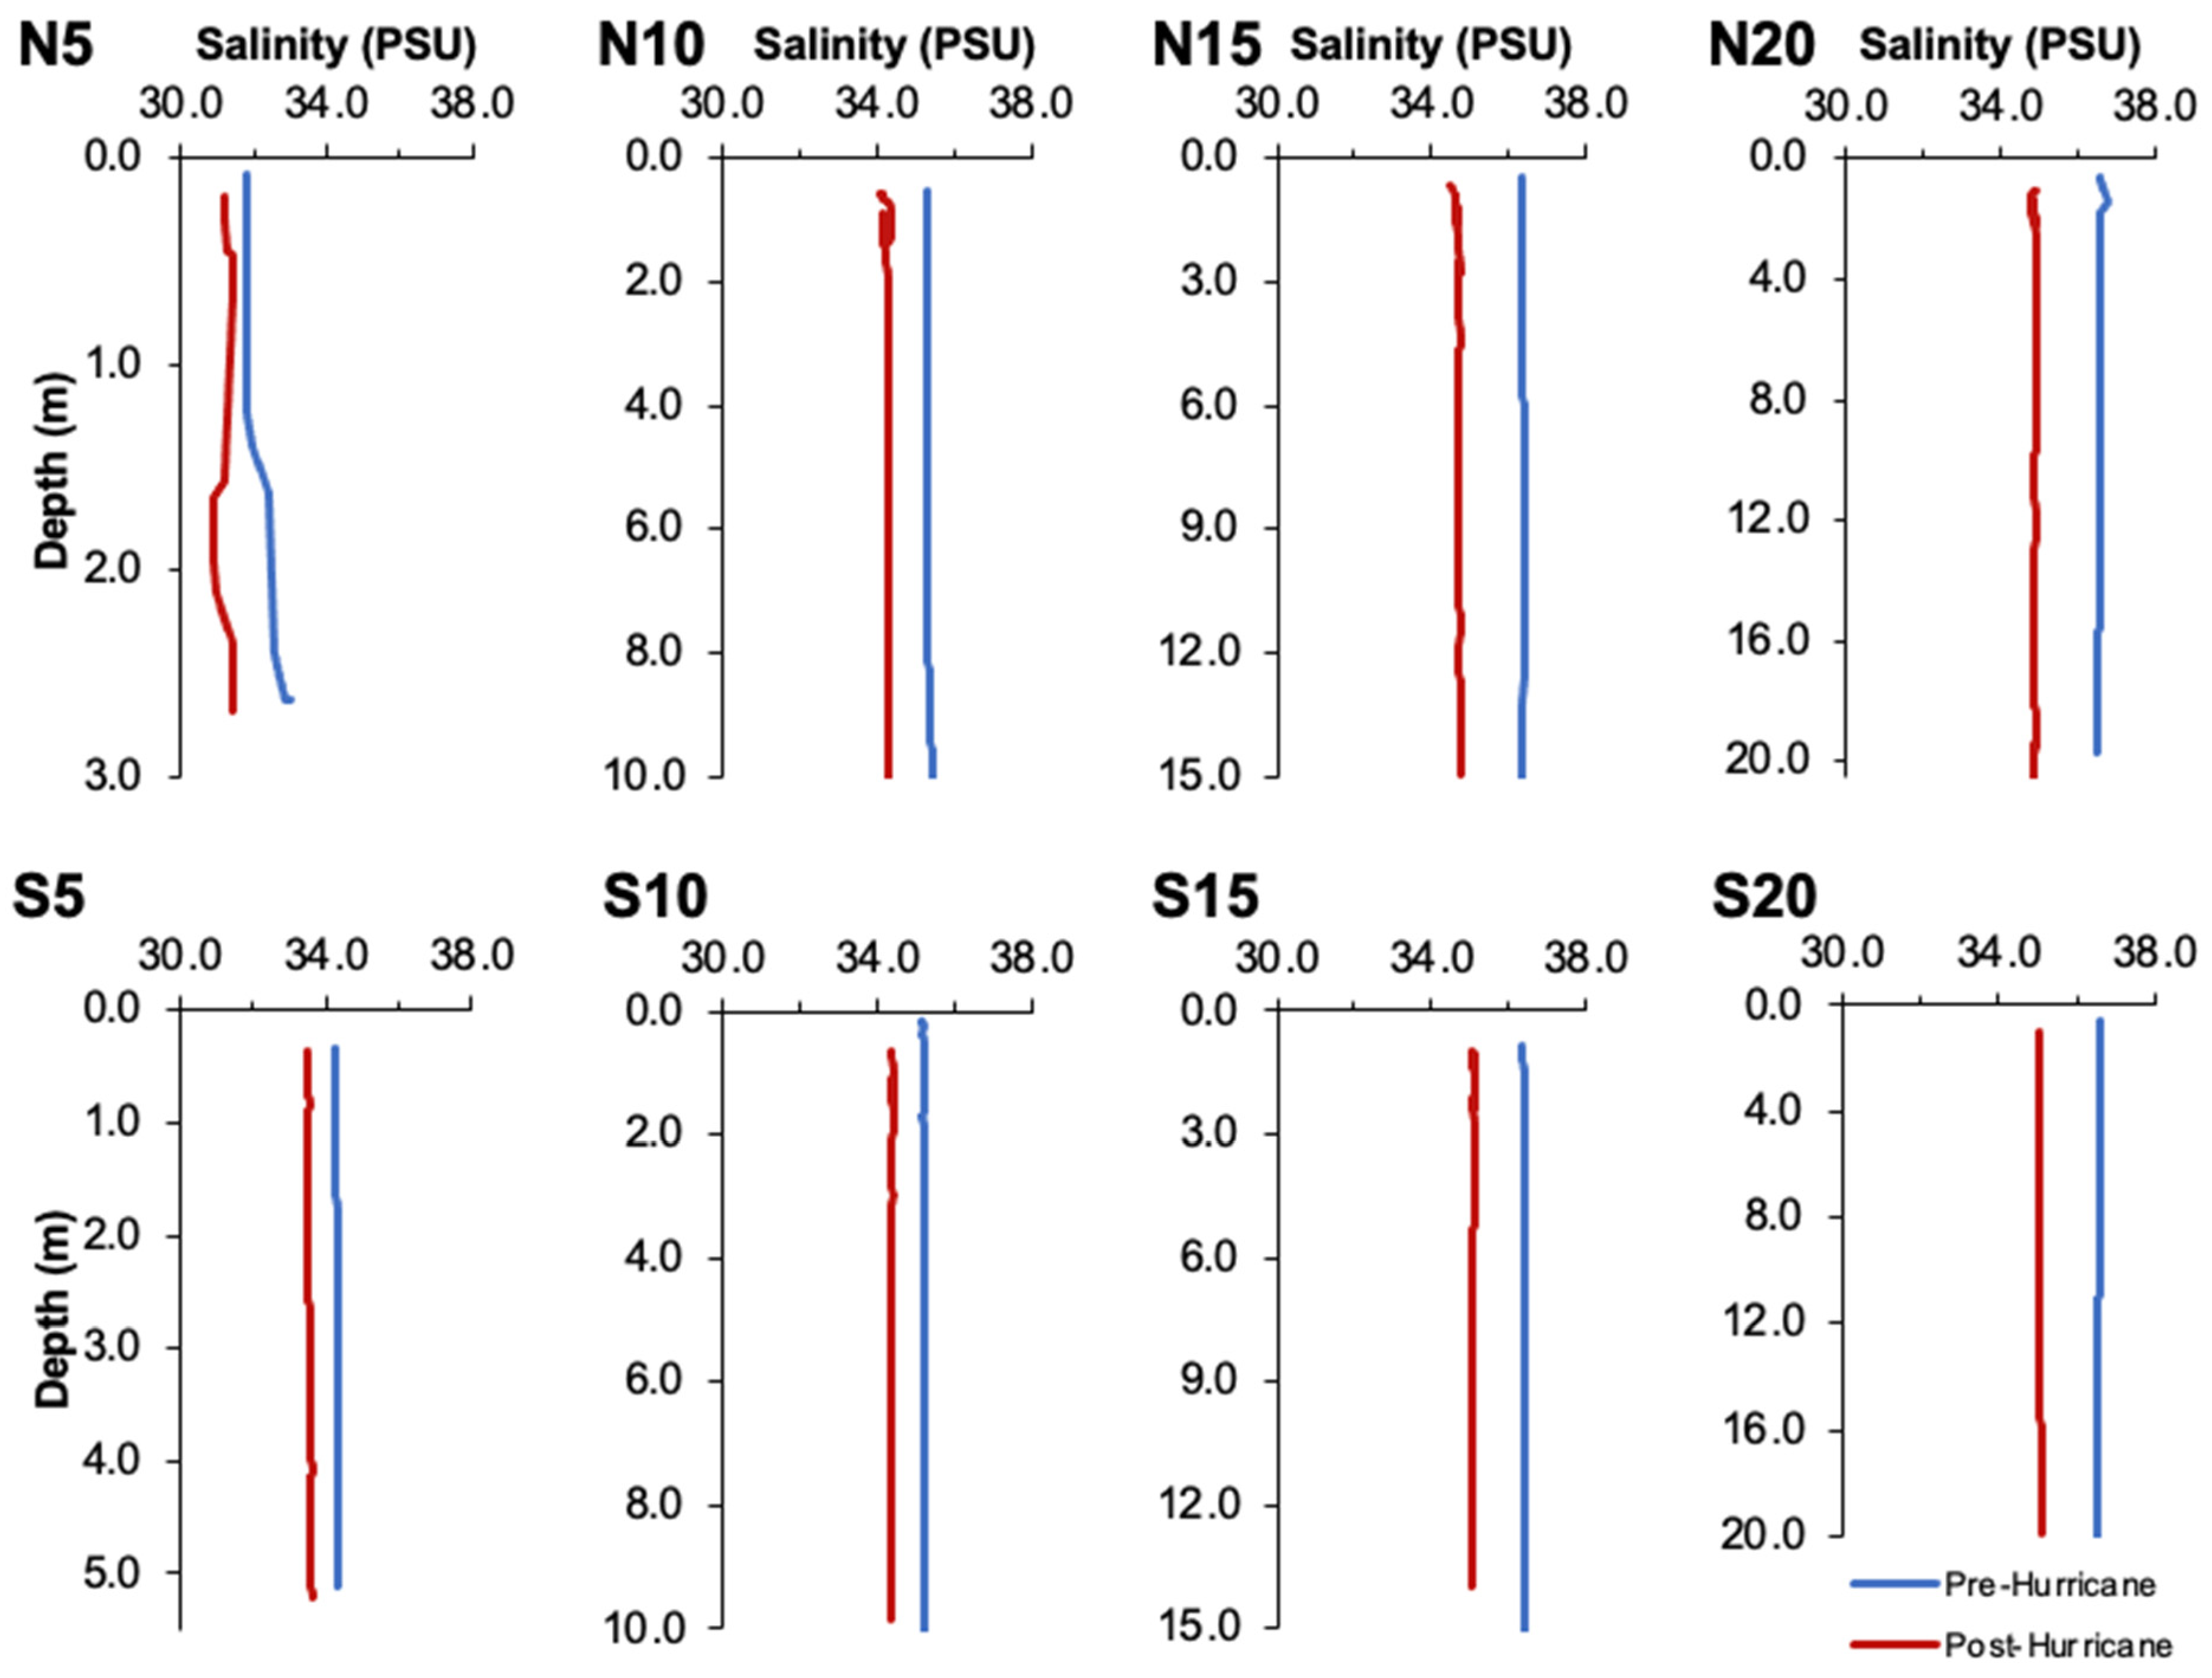
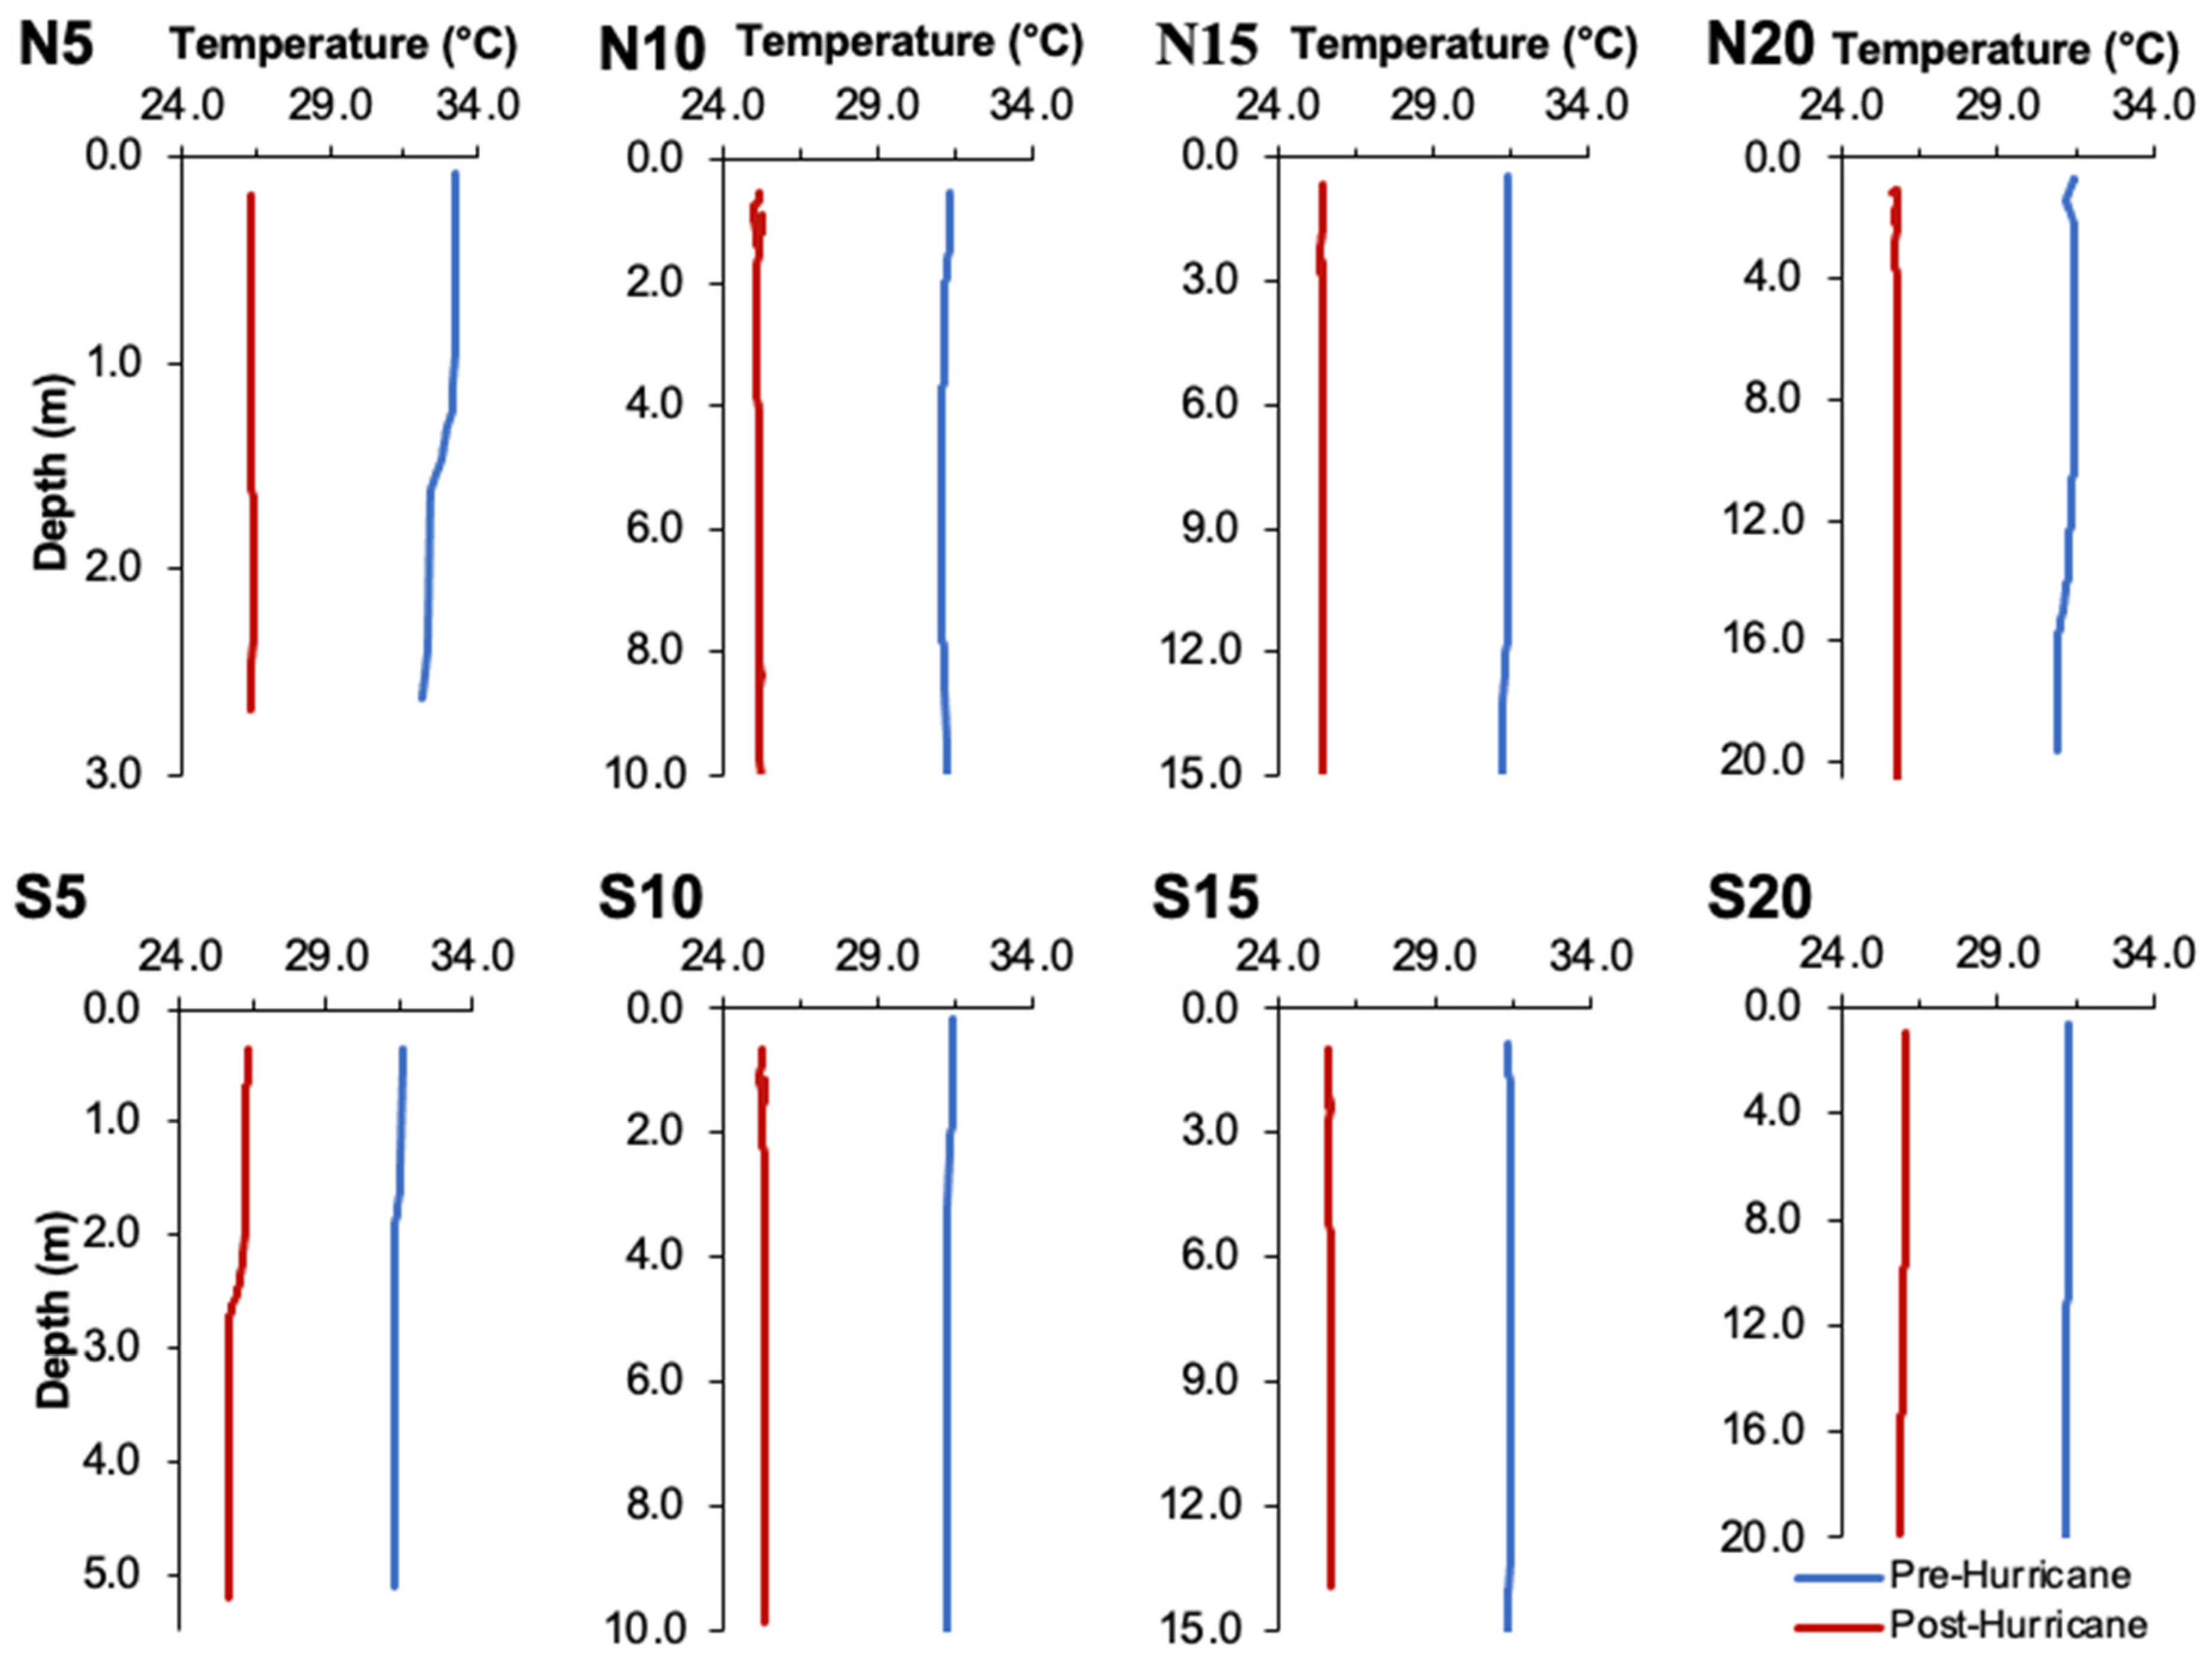
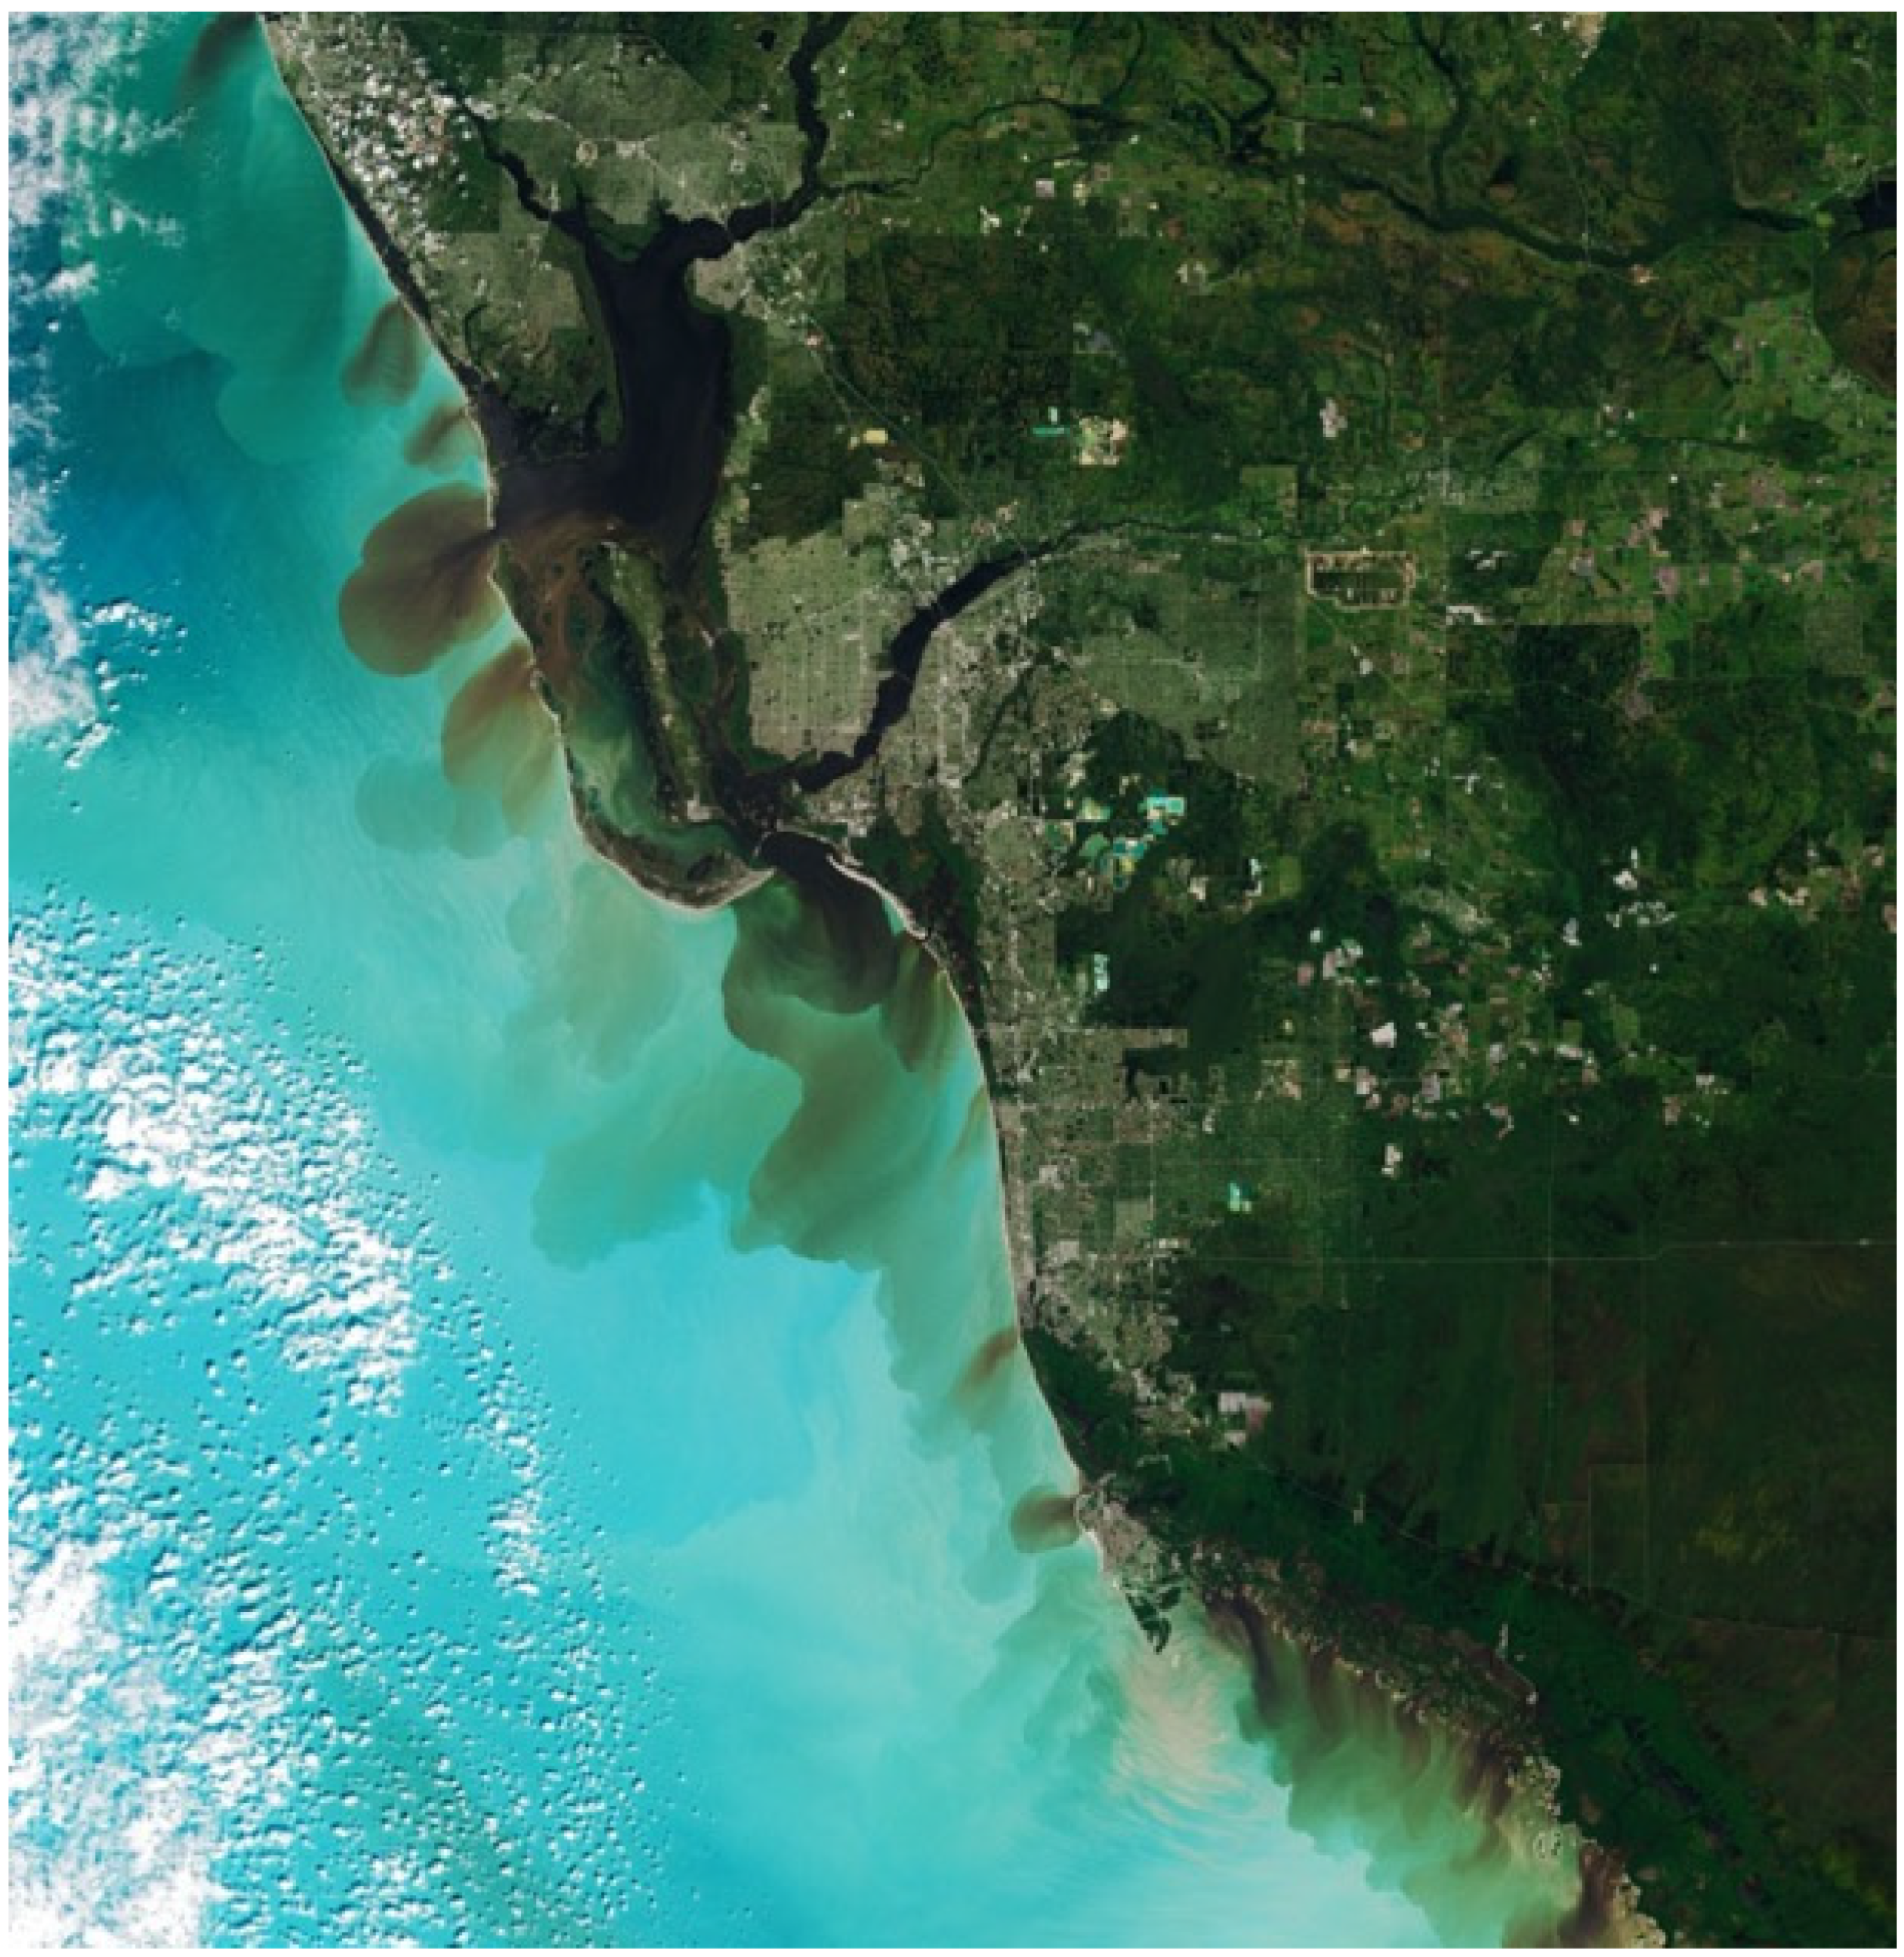
3.1. Physical Effects of Hurricane Ian

On 28 September 2022, the eyewall of Hurricane Ian came within 12 km of the N20 site (Figure 1). The tilt current meter deployed at the site measured a peak value of benthic current velocity of 0.69 m/s, far exceeding the previous 10-day mean of 0.037 m/s. Furthermore, the Sanibel Captiva Conservation Foundation (SCCF)’s TRIAXYS© wave buoy, located 31 km NE from N20, recorded 7.2 m wave heights and surface current velocity of 2.4 m/s (the highest ever recorded by a TRIAXYS© wave buoy) during the hurricane before breaking loose. The average benthic light value at N20 on the day prior to the hurricane (27 September 2022) was 40.2 lumens/m2 compared with an average of 0 lumens/m2 on the day of and 9 days following the hurricane. Divers reported near-darkness at depth even at the 10 m sites three weeks after the storm. Other indicators of the severity of the physical disturbance to the benthic environment by Hurricane Ian’s waves include the toppling and >100 m movement of segments of the “Arc Tower” artificial reef; a heavily weighted steel and concrete structure 21 km N from N20 in 18 m of water, which had been in place since 1994.

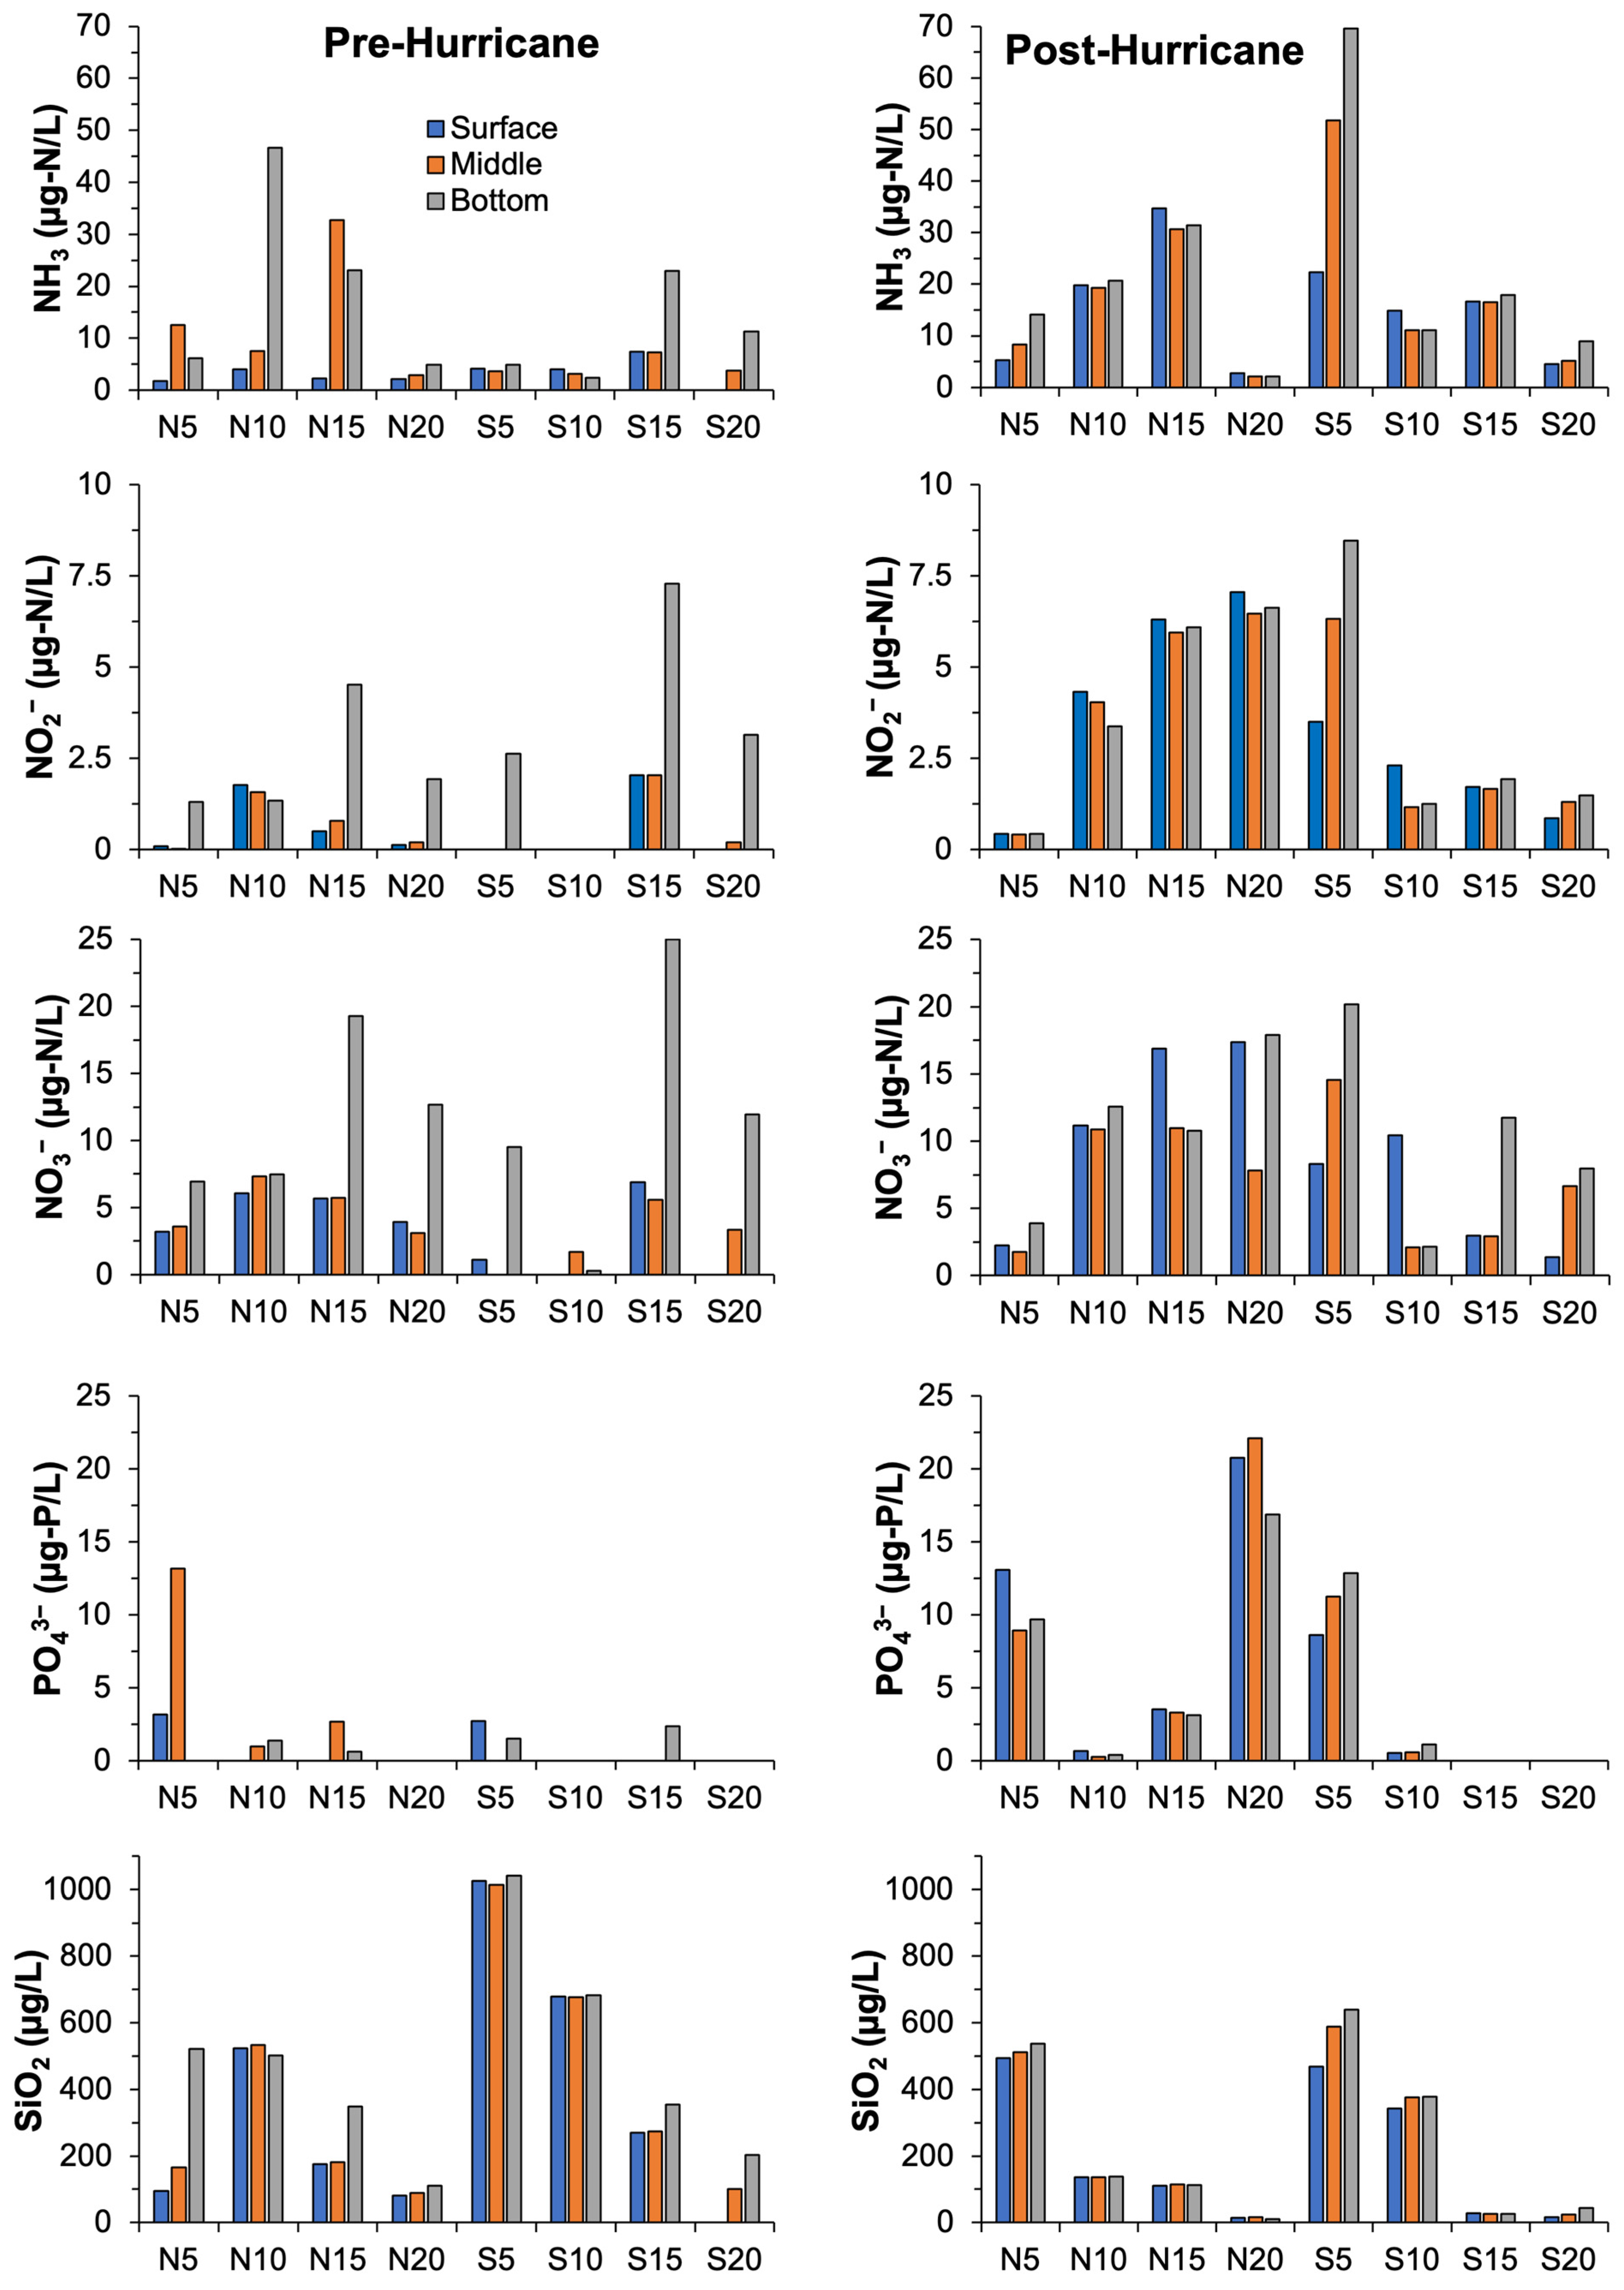
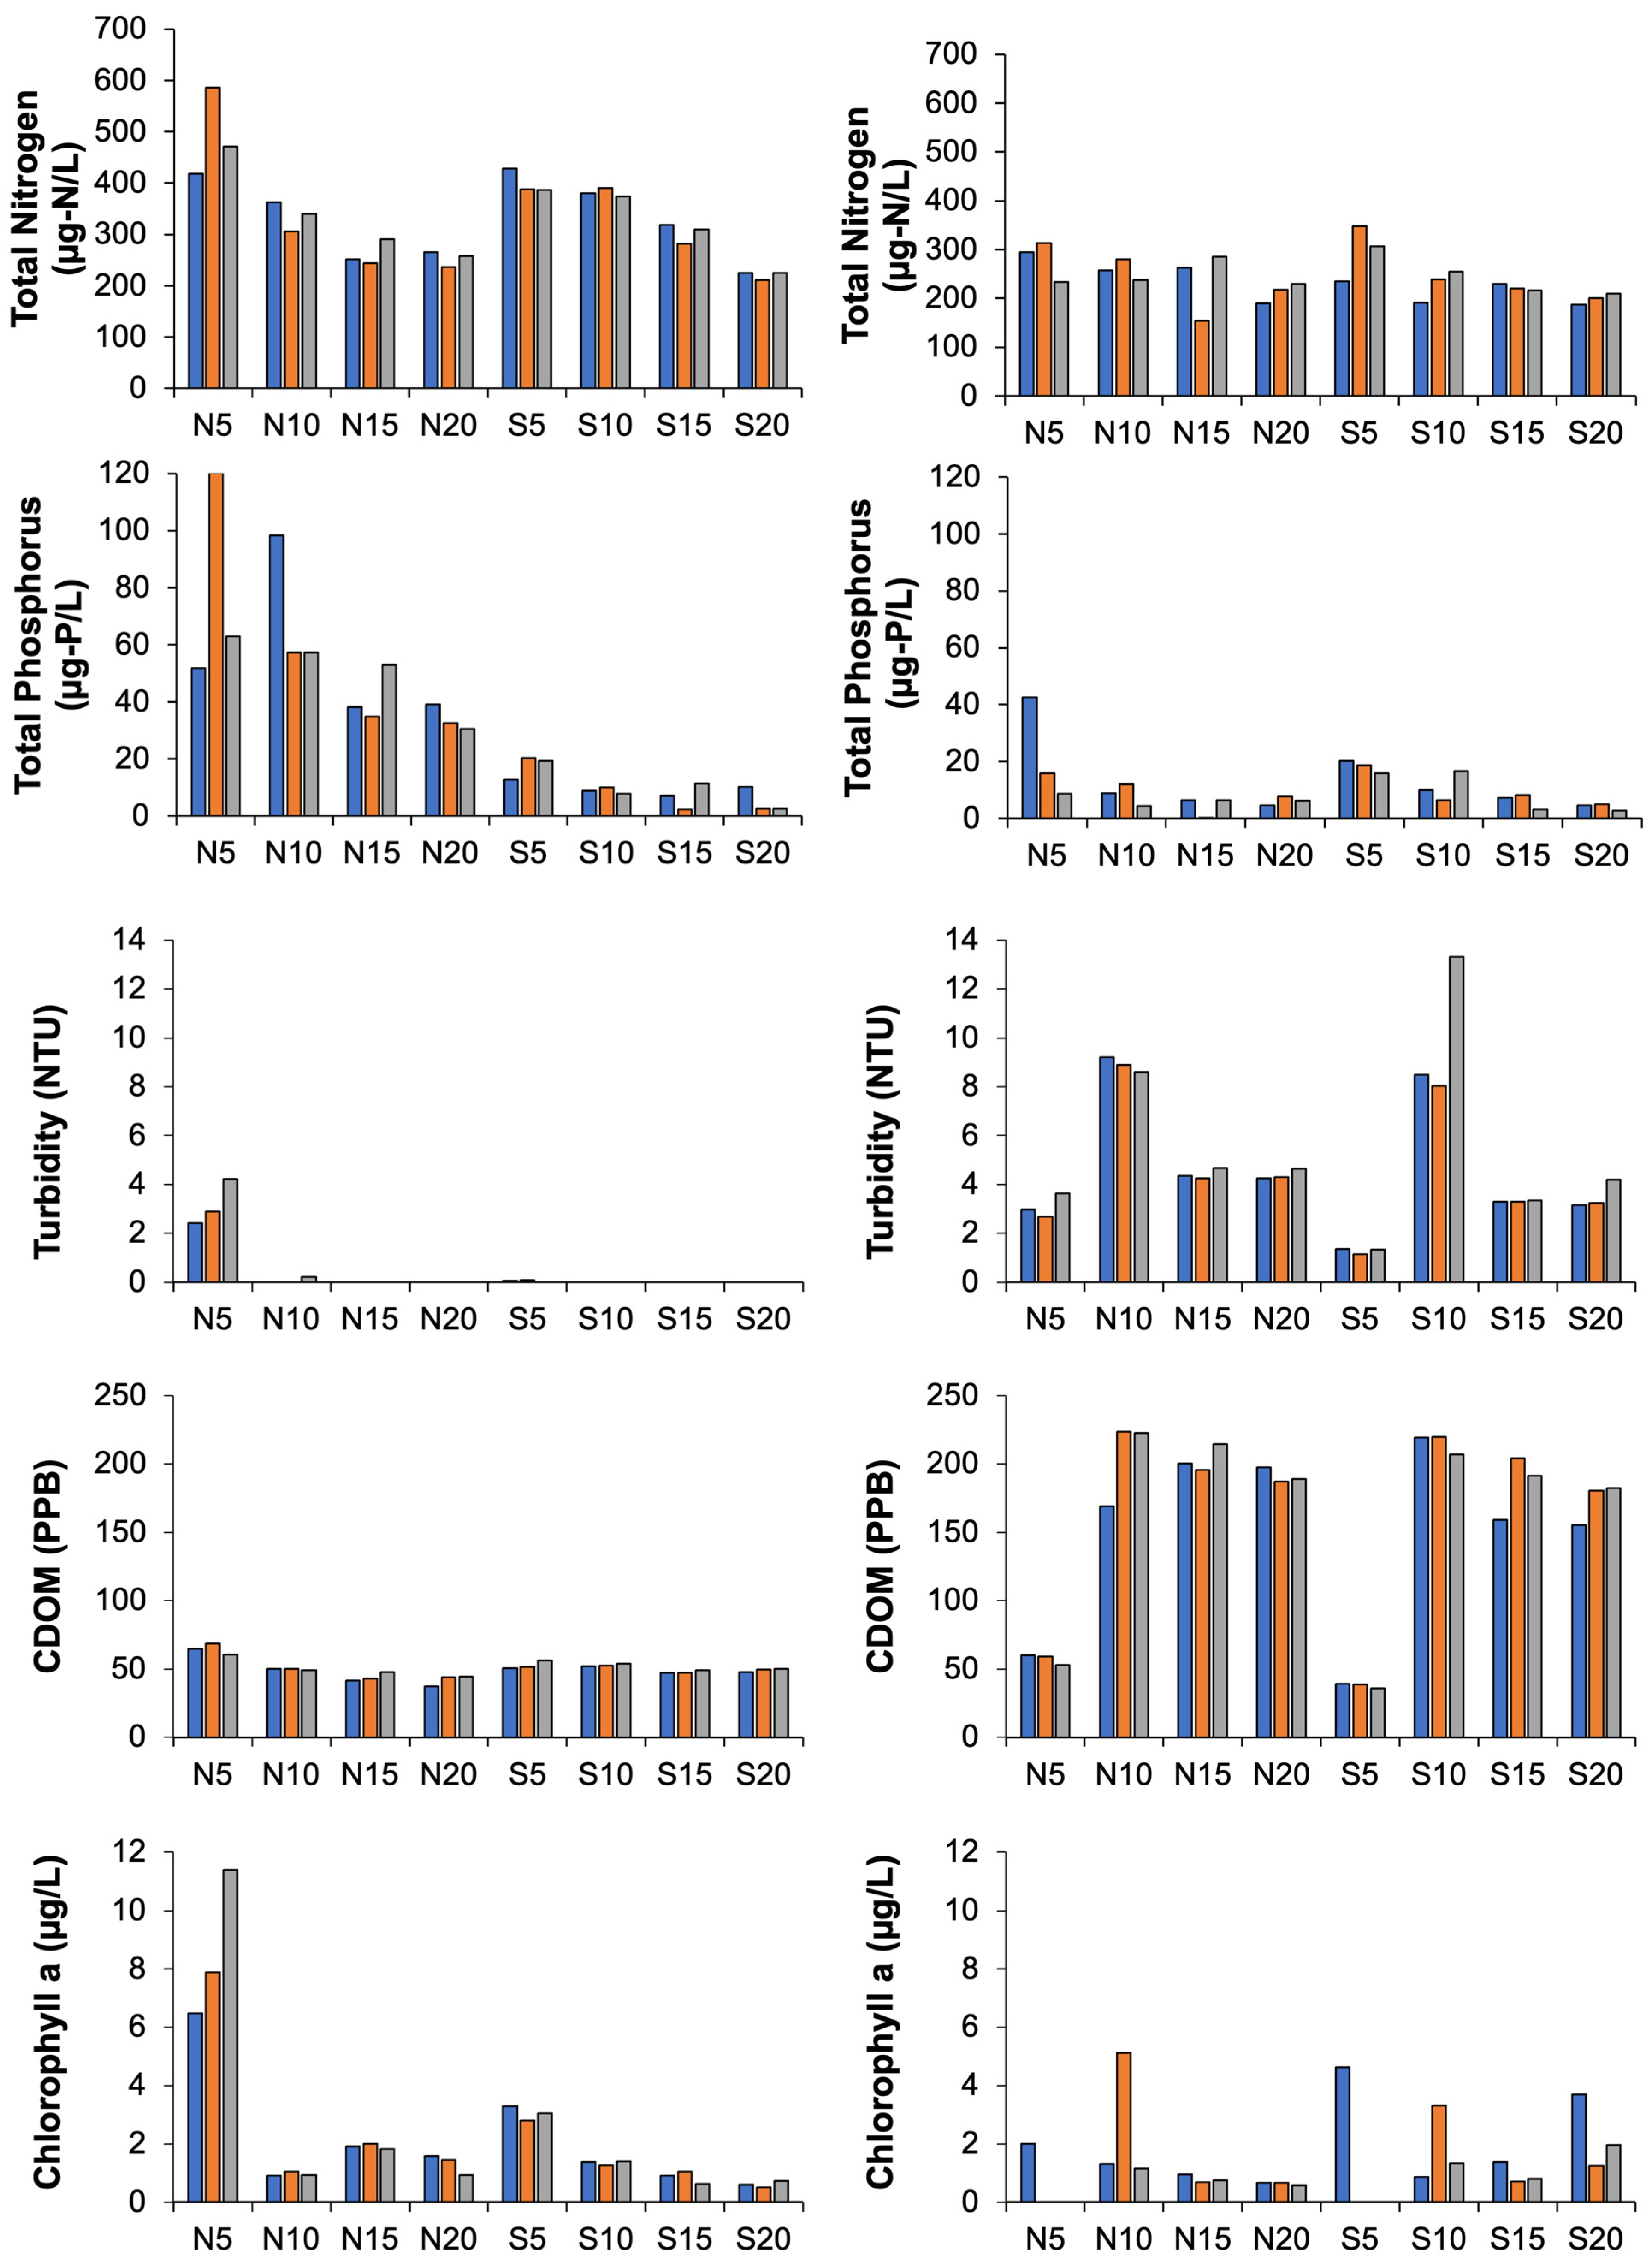
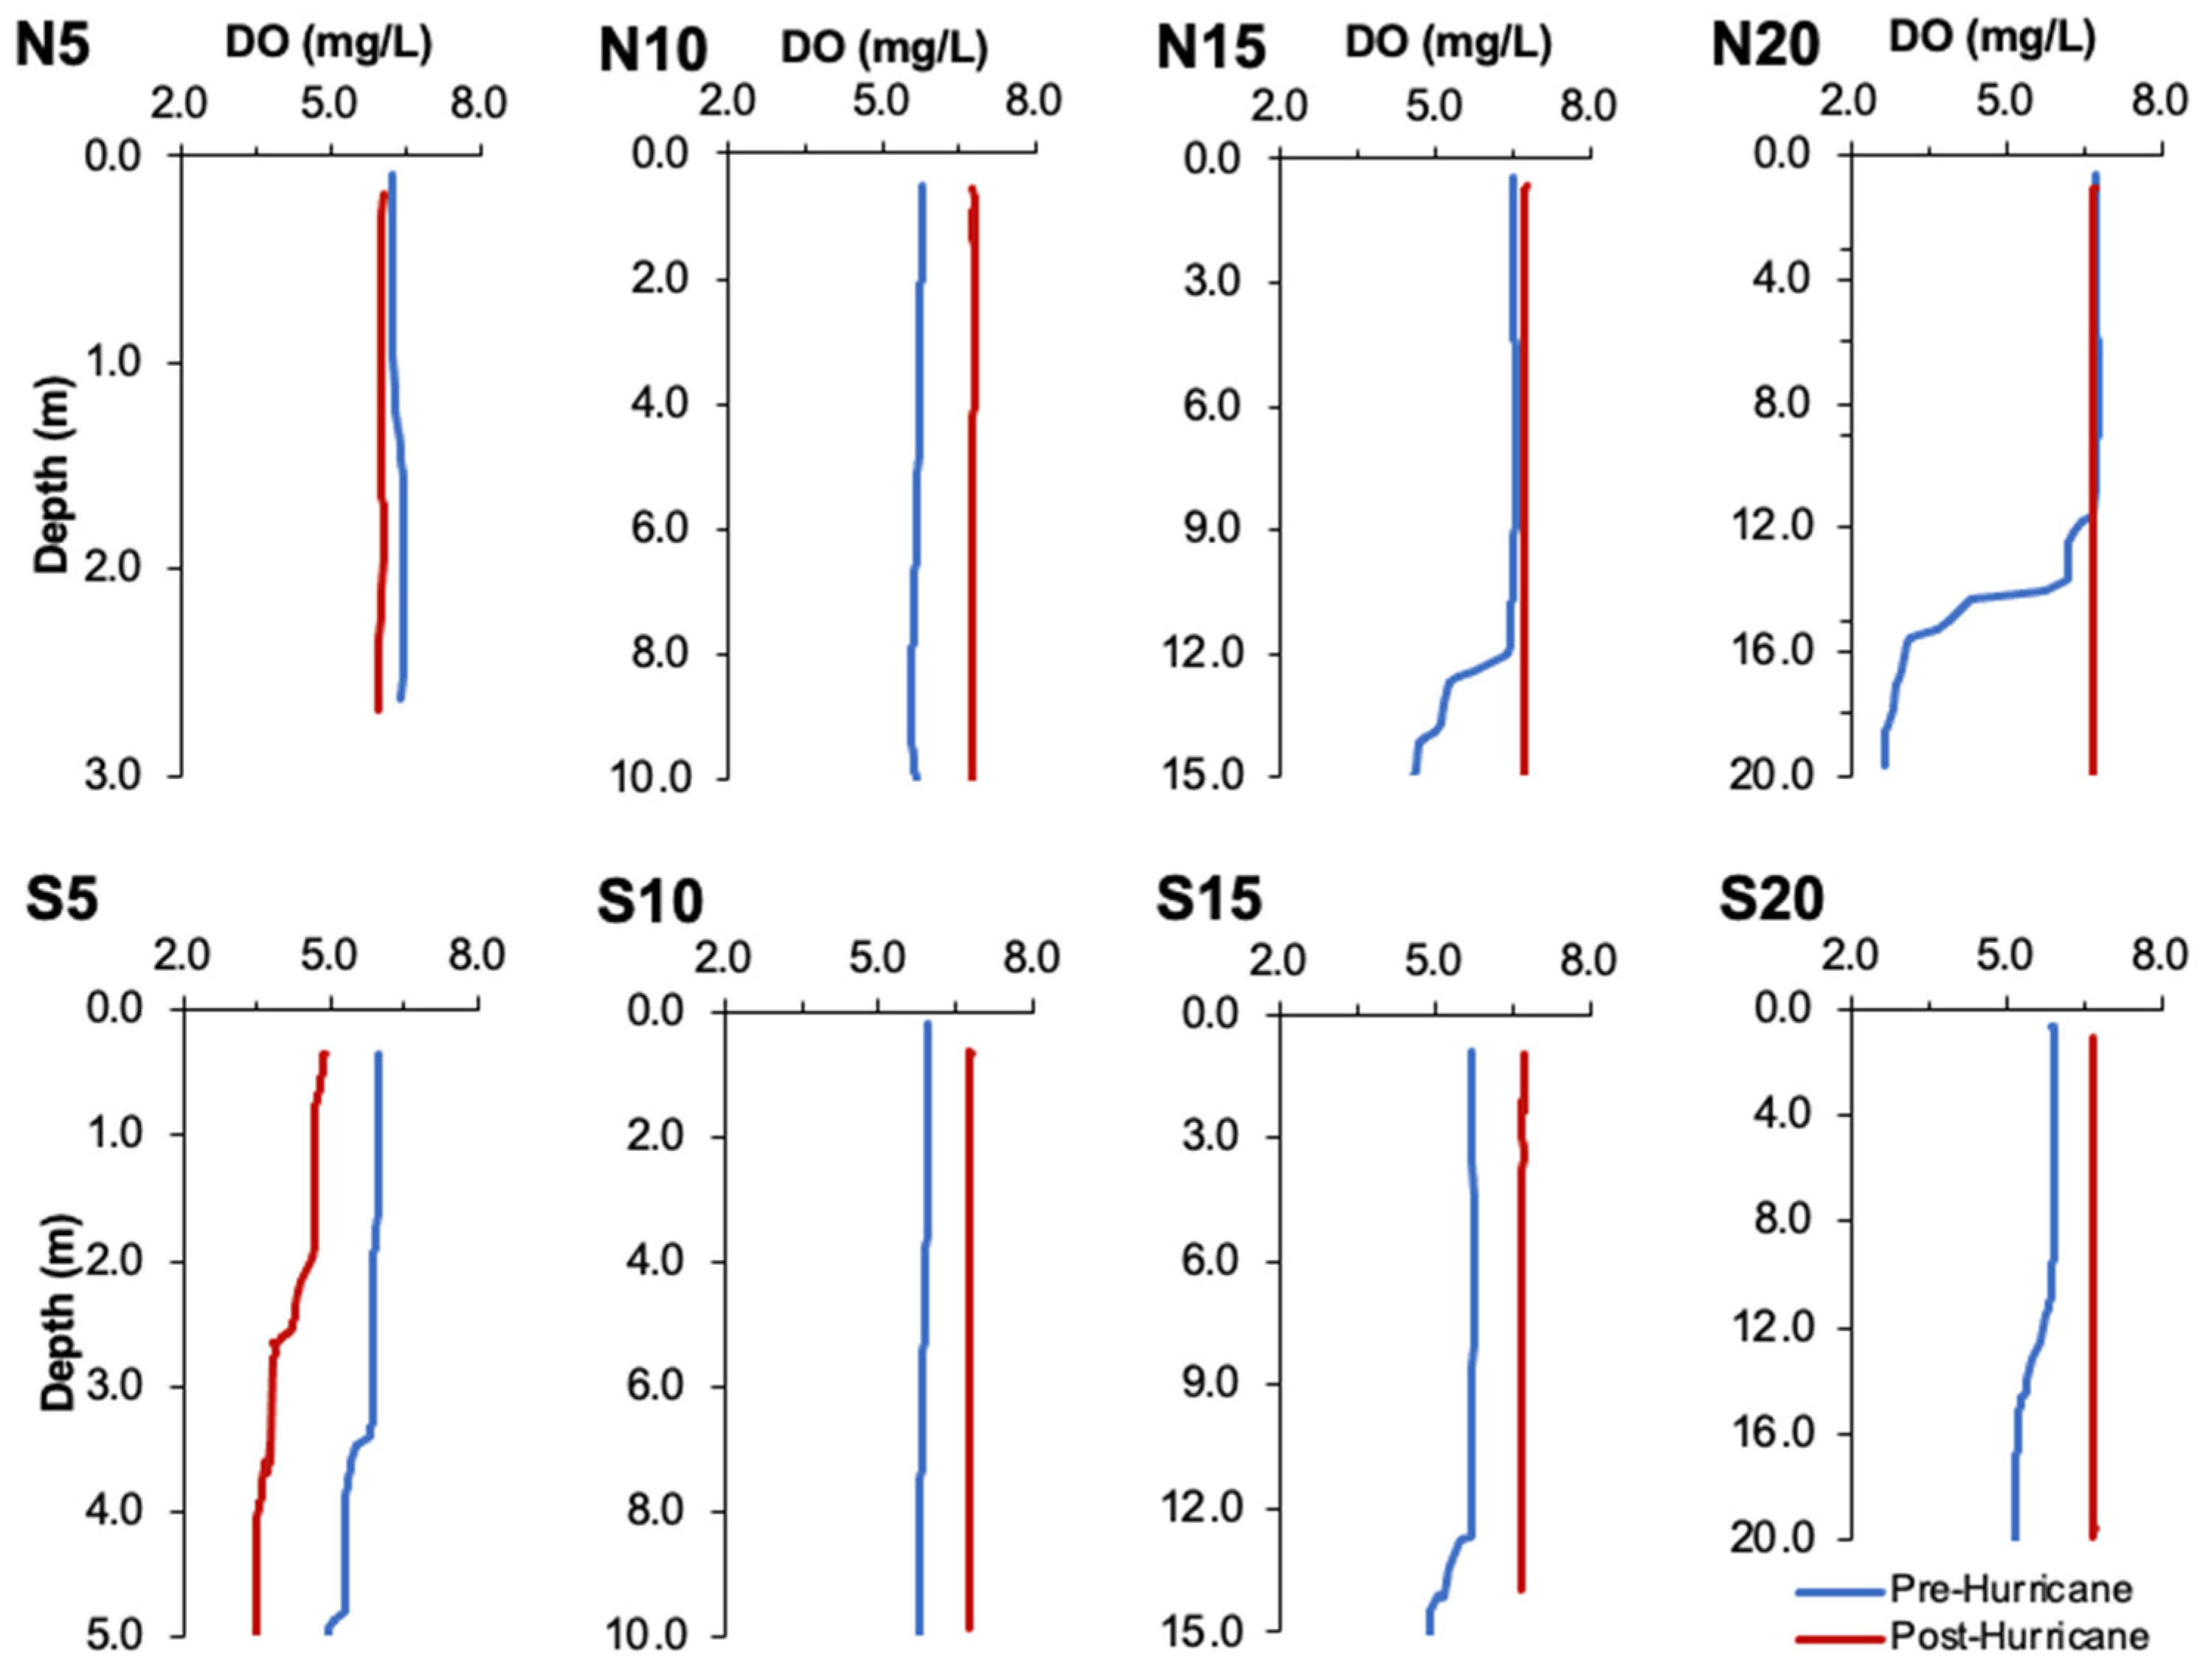
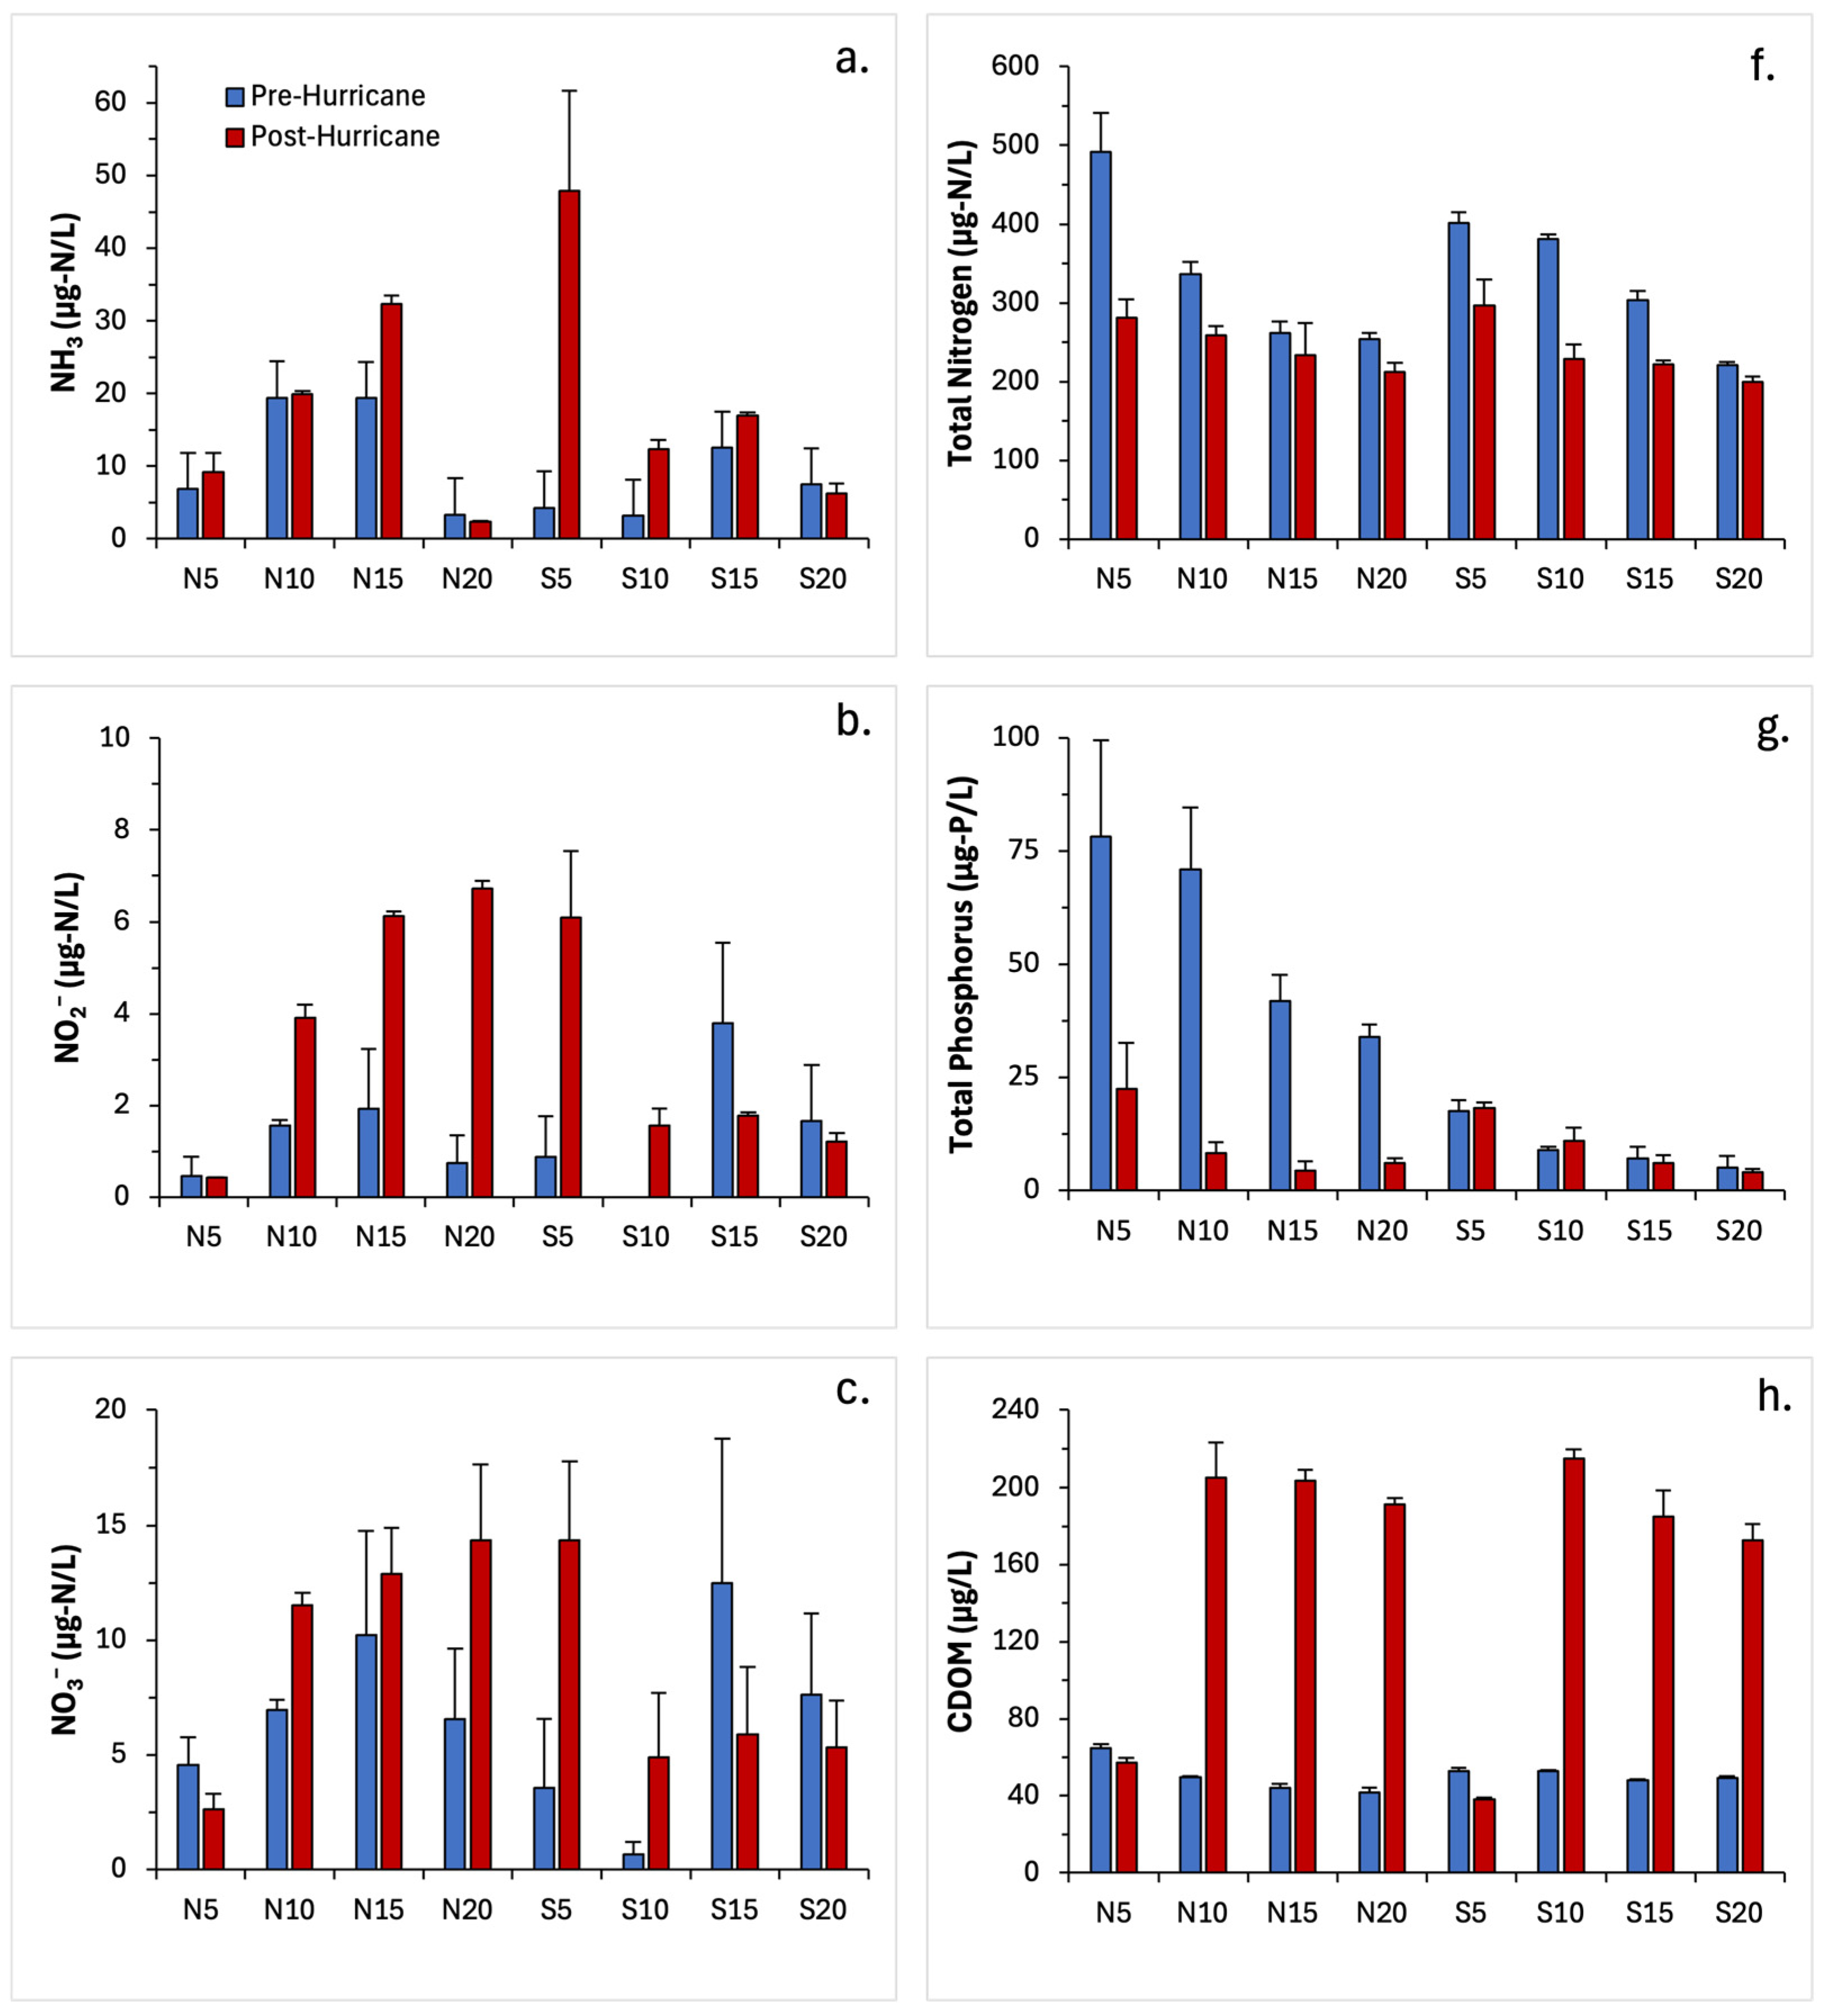
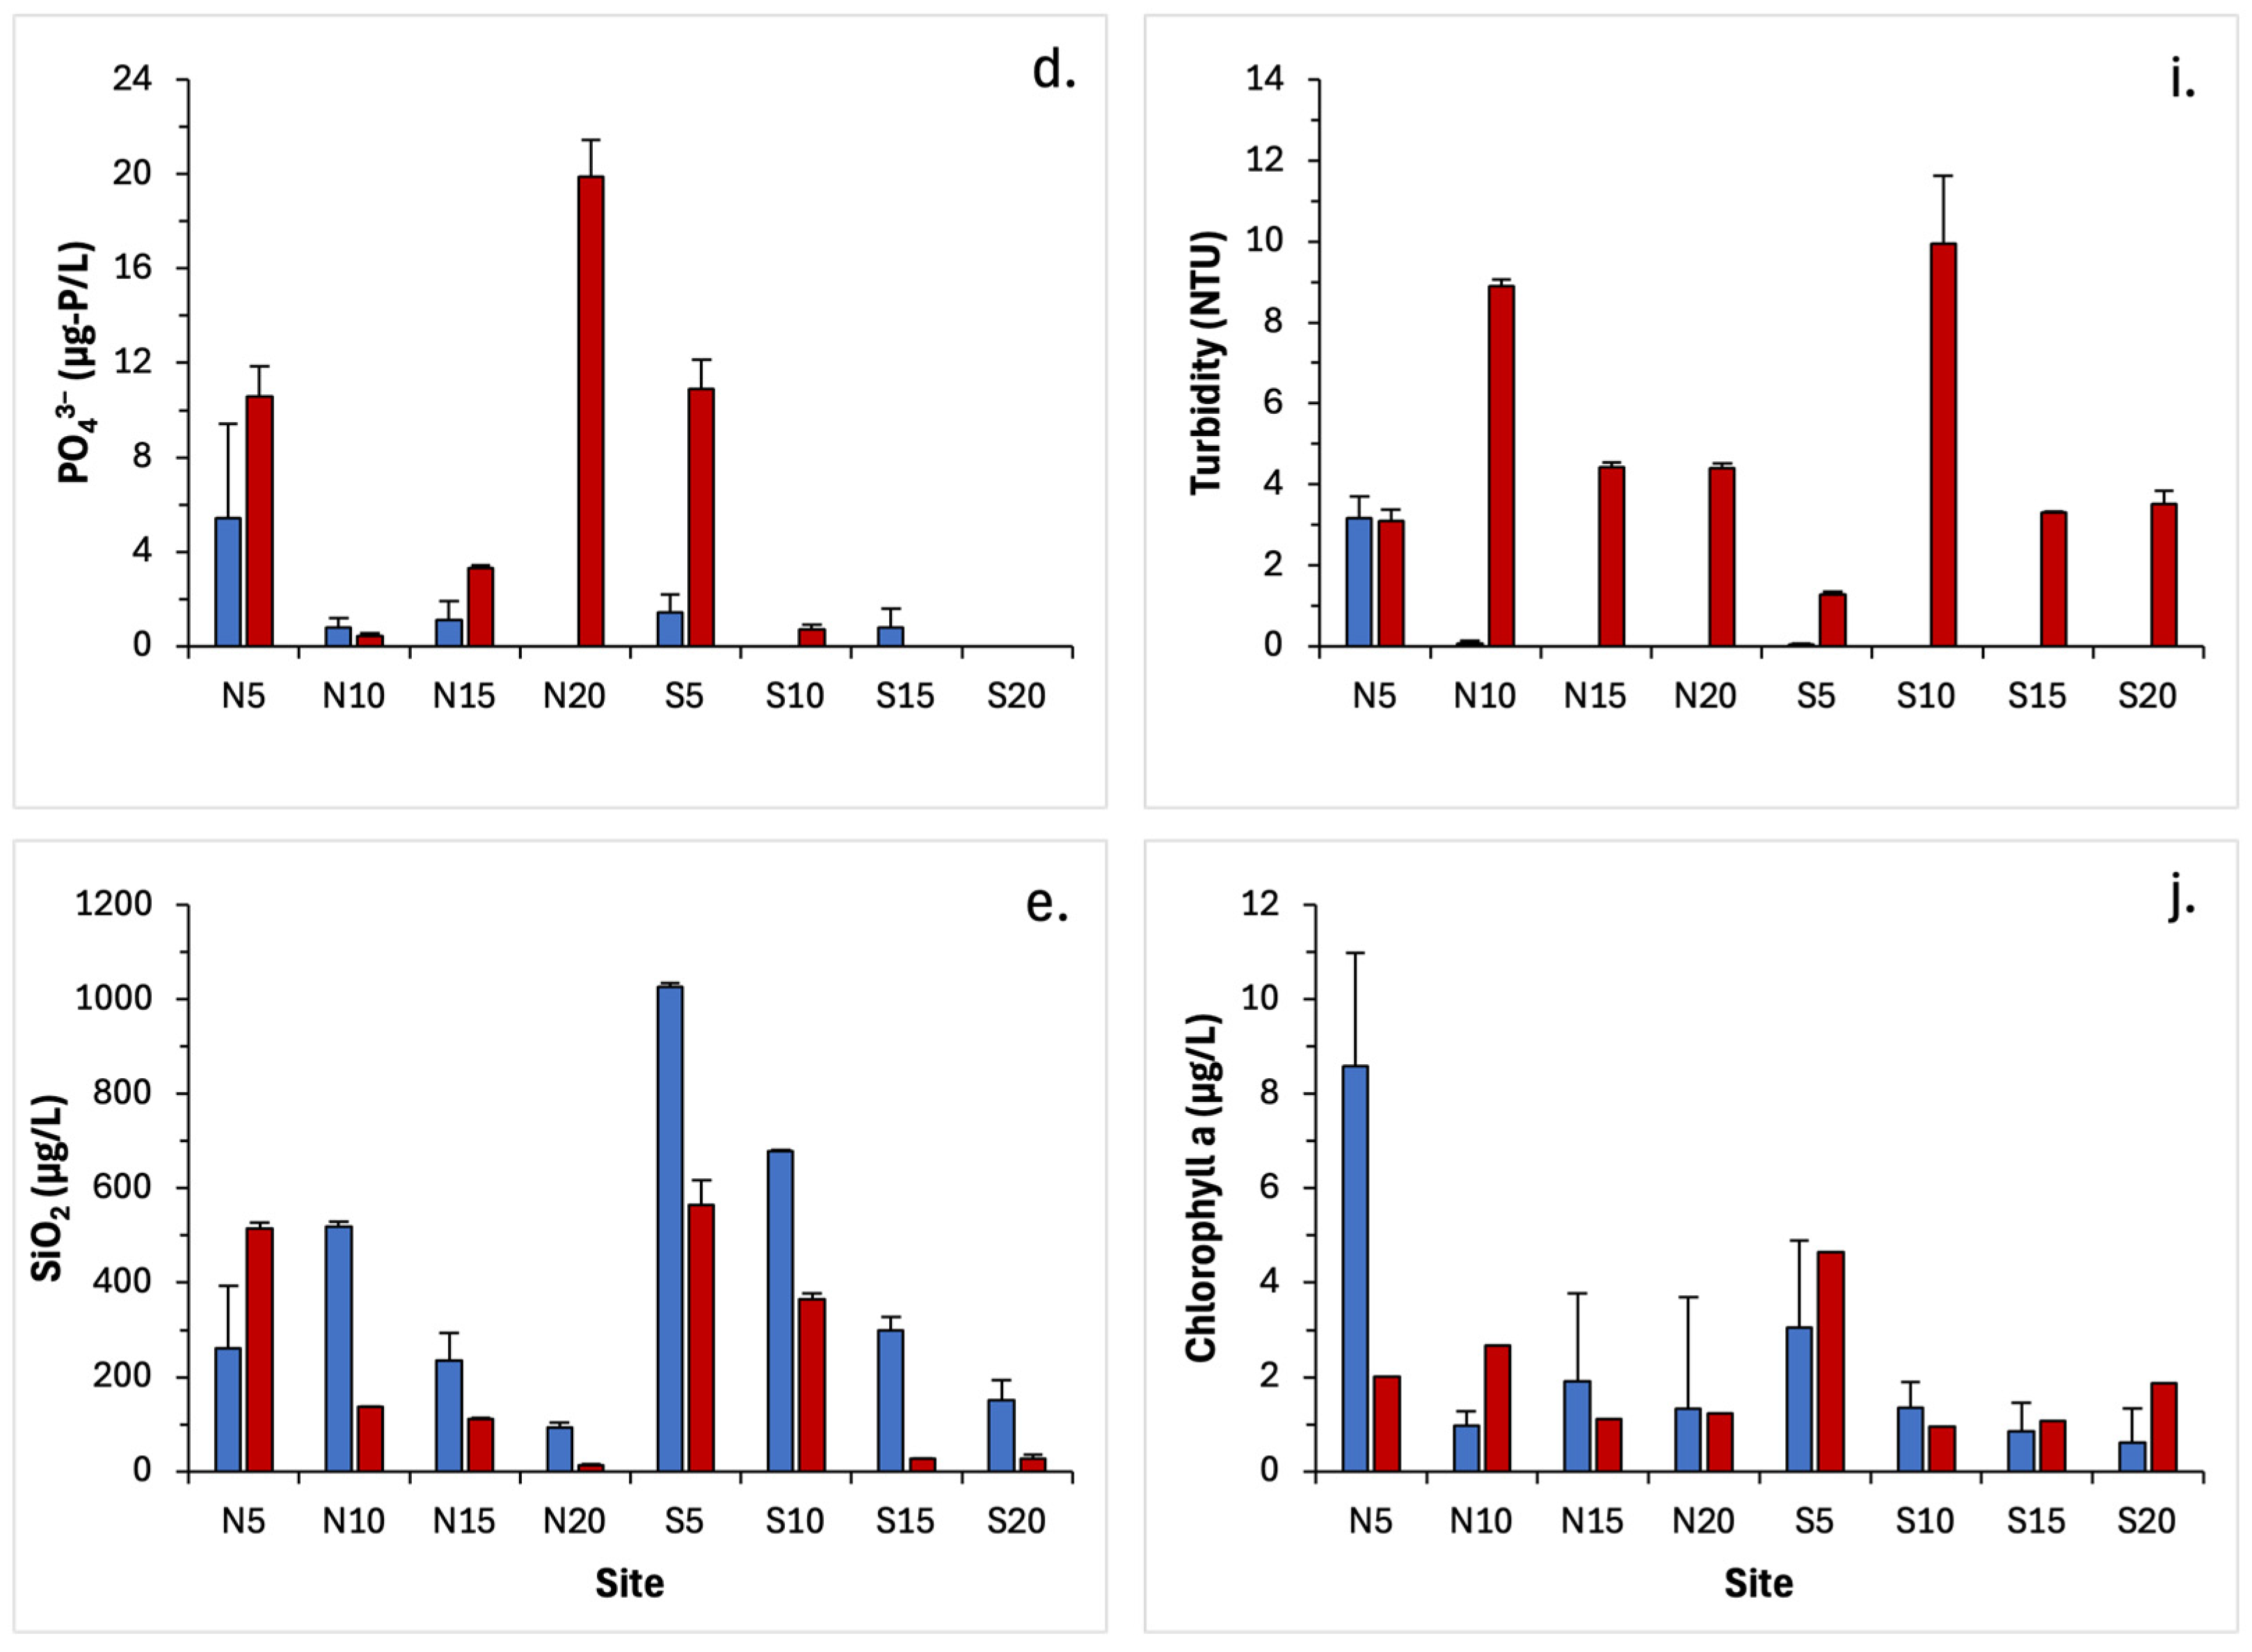
3.2. Water Quality Parameters

The majority of the water quality parameters measured (salinity, DO, temperature, turbidity, chlorophyll a, CDOM, silica, nitrate, nitrite, ammonia, total nitrogen, total phosphorus, and orthophosphate) changed significantly after Hurricane Ian (Figure 2, Figure 3, Figure A1, Figure A2 and Figure A3). Salinity dropped by 1–2 PSU, and temperature dropped by ~5 °C at all sampling sites (Figure A1 and Figure A2). There was an increase in DO at 10–20 m depths following the hurricane, but a decrease in DO at 5 m depths near shore (Figure 2). Prior to the hurricane there was strong stratification at sites N20 and N15 with near hypoxic conditions (<3 mg/L O2) at site N20. This stratification and bottom hypoxia was not observed following the hurricane except at S5 (Figure 2).
Post-hurricane turbidity was higher than pre-hurricane values for all sampling sites, with the exception of N5, where turbidity was elevated both pre- and post-hurricane (Figure 3). The overall increase in turbidity was significant (df = 1, 44, Iter = 5000; p < 0.001). Chlorophyll a was higher closer to shore both pre- and post-hurricane (Figure 3 and Figure A3). There was a decrease in chlorophyll a along the north transect after the hurricane, and an increase across the south transect, but the difference was not statistically significant (Table A3). Prior to the hurricane CDOM was slightly elevated at nearshore sites. After the hurricane CDOM increased significantly (df = 1, 44, Iter = 5000; p < 0.001), although the increase was not observed at sites N5 and S5. Post-hurricane sampling at N5 and S5 was performed two weeks after sampling other sites because they were too shallow to safely sample from the R/V Hogarth. Thus, the lower CDOM values for these inshore sites could be attributed to the difference in sampling period allowing extended dilution, photochemical degradation, and/or salting out of the CDOM over those two weeks (Figure 3 and Figure A3).
Silica concentrations significantly decreased across all sites post-hurricane, except for the nearshore site N5 where concentrations increased across all depths (df = 1, 44; Iter = 5000; p = 0.0158). Overall, nitrate concentrations increased across most sites post-hurricane, but these changes were not significant (Figure 3 and Figure A3, Table A3). Similarly, nitrite concentrations increased across all stations post-hurricane with the highest increases at the offshore (10–20 m) north transect sites, and the nearshore south transect site (S5). These nitrite changes were significant (df = 1, 44; Iter = 5000; p < 0.001). Ammonia concentrations increased across most sites except for site N20 and S20 where there were no major changes in concentrations observed. Overall, ammonia concentrations across all sites were significantly higher post- hurricane (df = 1, 44; Iter = 5000; p = 0.0044). Orthophosphate concentrations increased at sites N5, N15, N20, and S5 and the pre- and post-hurricane change was significant (df = 1, 44; Iter = 5000; p = 0.0146). Total nitrogen concentrations decreased across all sites post-hurricane (df = 1, 44; Iter = 5000; p < 0.001). Total phosphorus concentrations also decreased across all sites post-hurricane, with a greater drop in TP along the north transect than the south transect. The differences in TP concentrations between transect and date were significant and there was a significant transect x date interaction (df = 1, 44; Iter = 5000; p < 0.001) (Figure 3, Table A3).

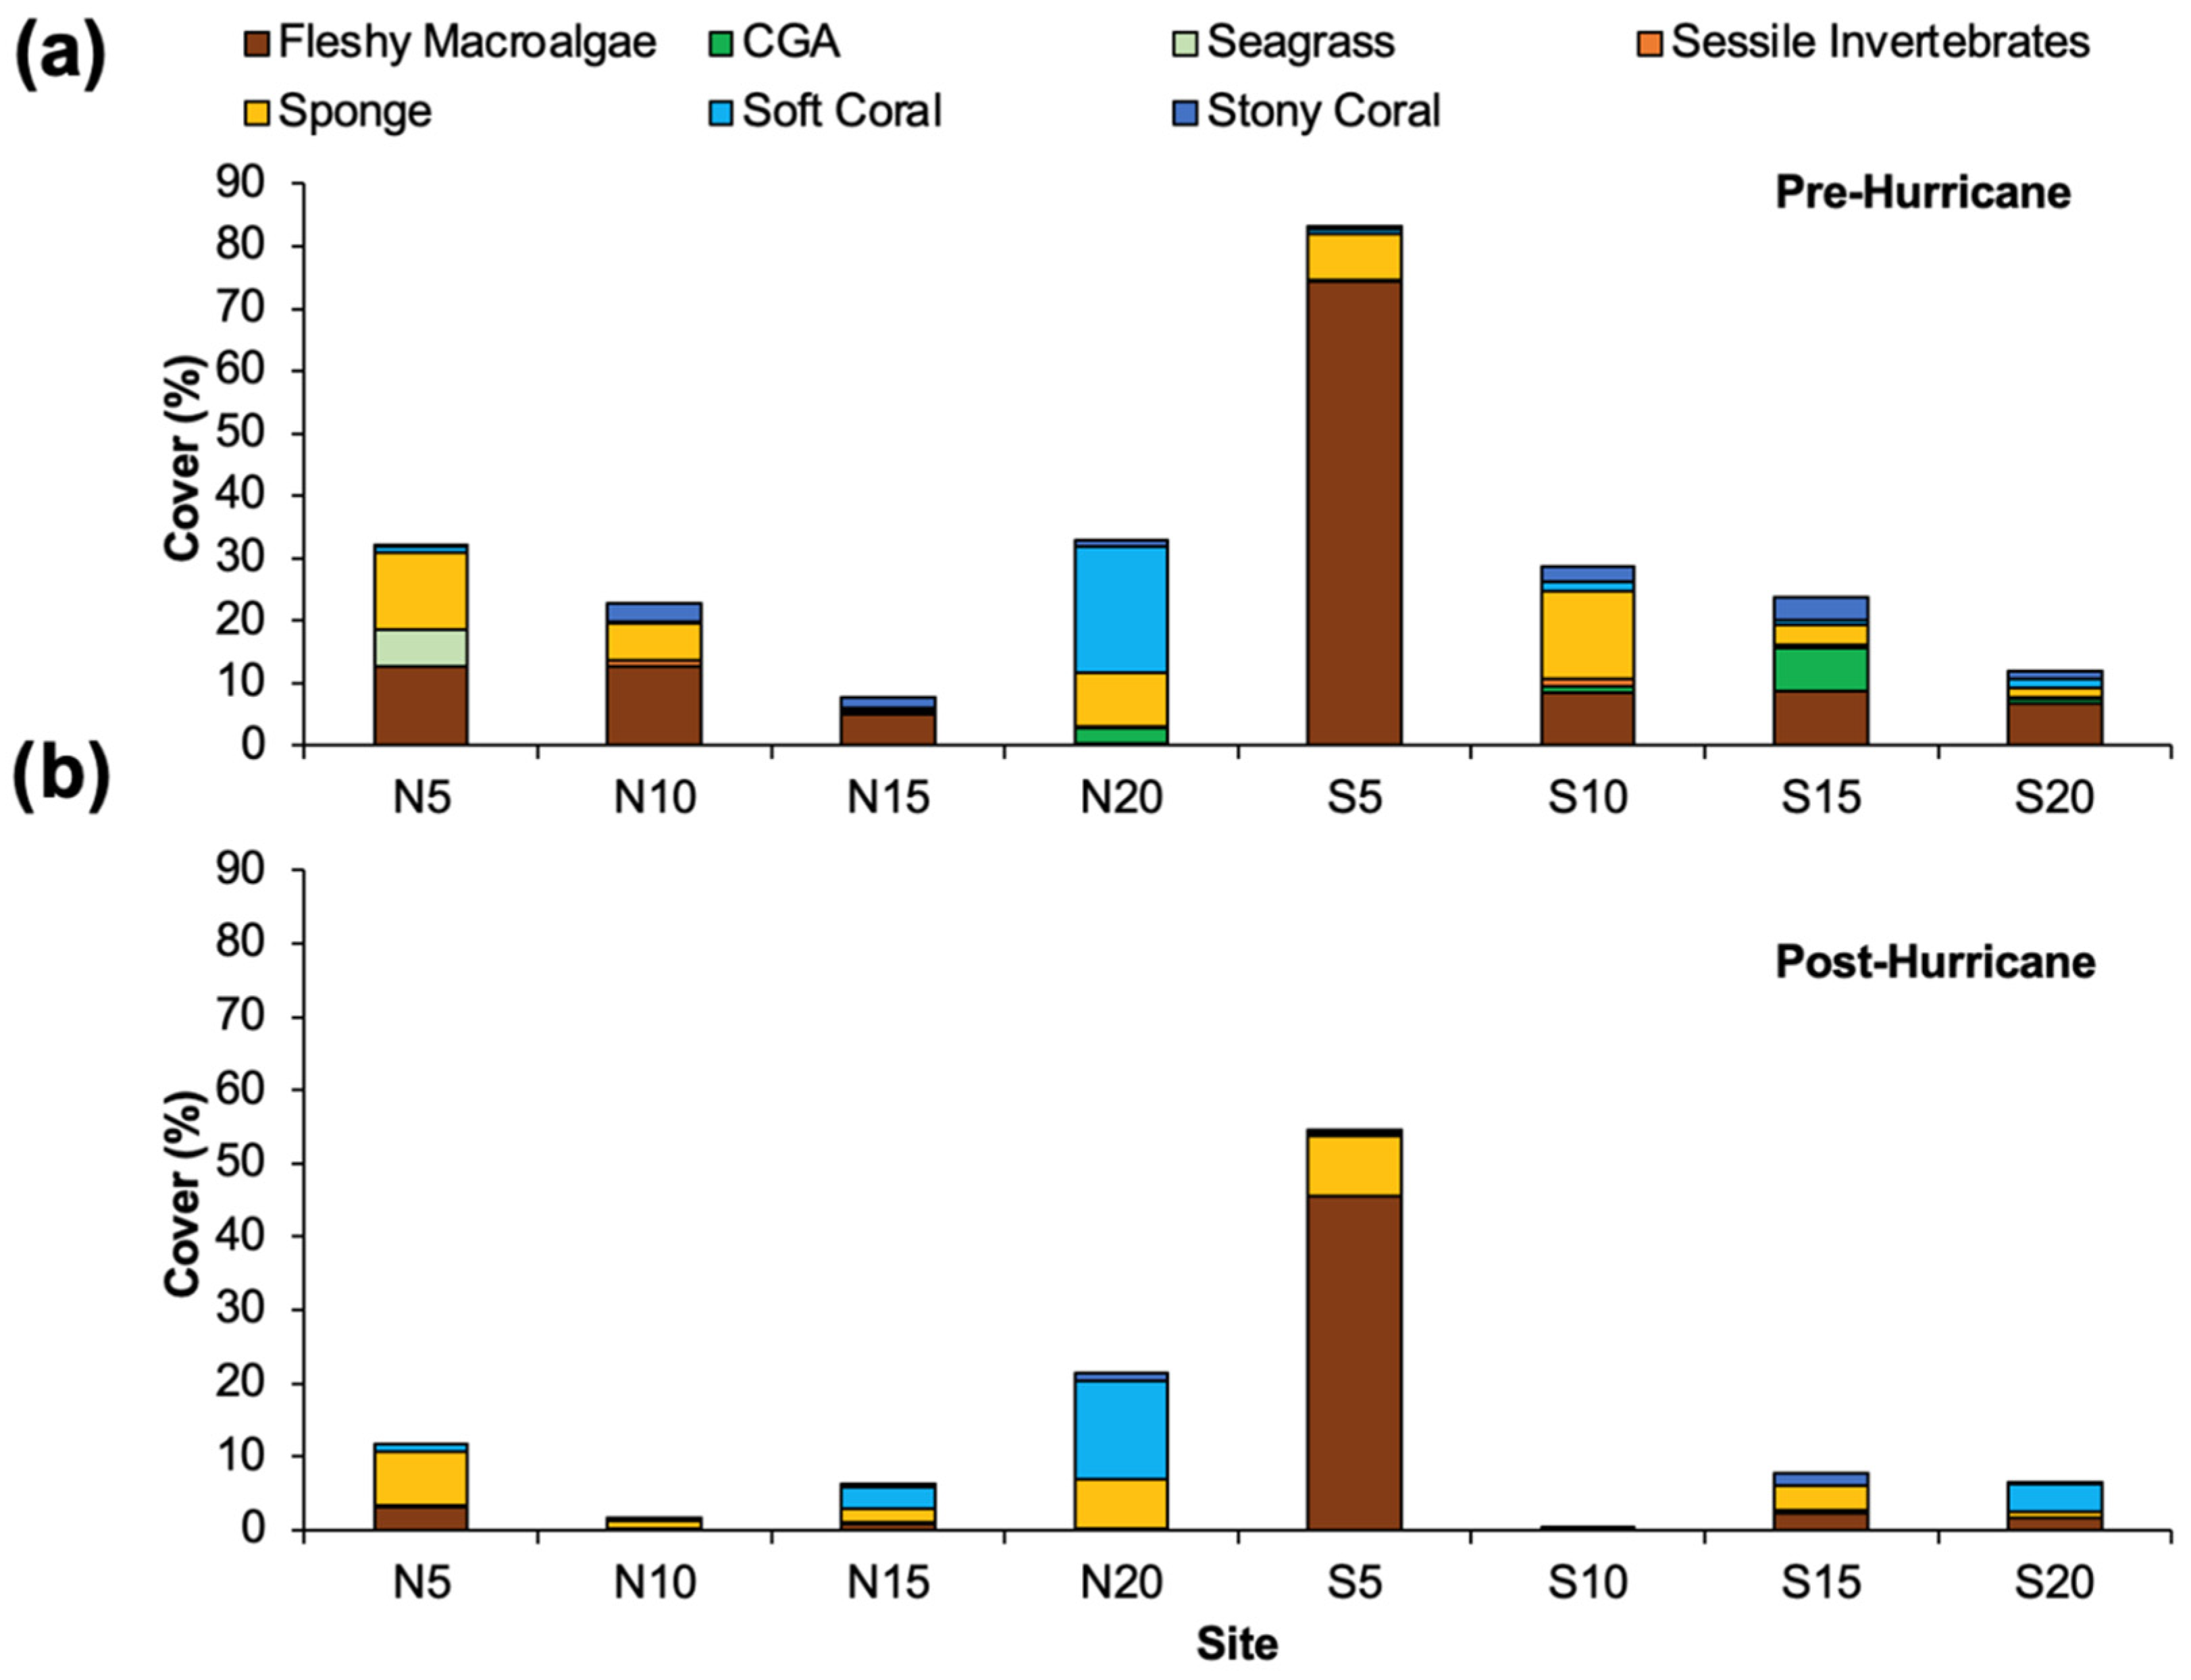
3.3. Epibenthos and Substrate

There was a significant decrease in hard bottom cover after the passage of Hurricane Ian (df = 1, 296; Iter = 5000; p < 0.001), and there was visual evidence of burial and scour (Figure 4a, Table A3). Site N20 lost the most hard bottom habitat post-hurricane while N5 gained the most (Figure 4a). Total biotic cover declined significantly after the hurricane (df = 1, 296; Iter = 5000; p < 0.001) (Figure 4b, Table A3). The highest biotic cover both pre- and post-hurricane was at N20 and S5 (21.5% and 54.5%, respectively, post-hurricane) (Figure 4b). The greatest relative decrease in biotic cover was at S10 and N10 (98.3% and 92.6% decrease, respectively) such that remaining biotic cover was near zero at these sites, 0.5% and 1.7%, respectively (Figure 4b).
Sponge, stony coral, sessile invertebrates, seagrass, CGA, and fleshy macroalgae significantly decreased after the hurricane (45%, 71%, 77%, 100%, 100%, and 58% loss, respectively) while changes in soft coral were not significant by date (17%) (Figure 5a,b, Table A3). Seagrass (Halophila decipiens) was observed at N5 pre-hurricane, but was absent from all sites post-hurricane (Figure 5a,b). Fleshy macroalgae, the dominant biotic cover category at many sites pre- and post-hurricane, was reduced at all sites post-hurricane (df = 1, 296; Iter = 5000; p < 0.001) (Table A3).

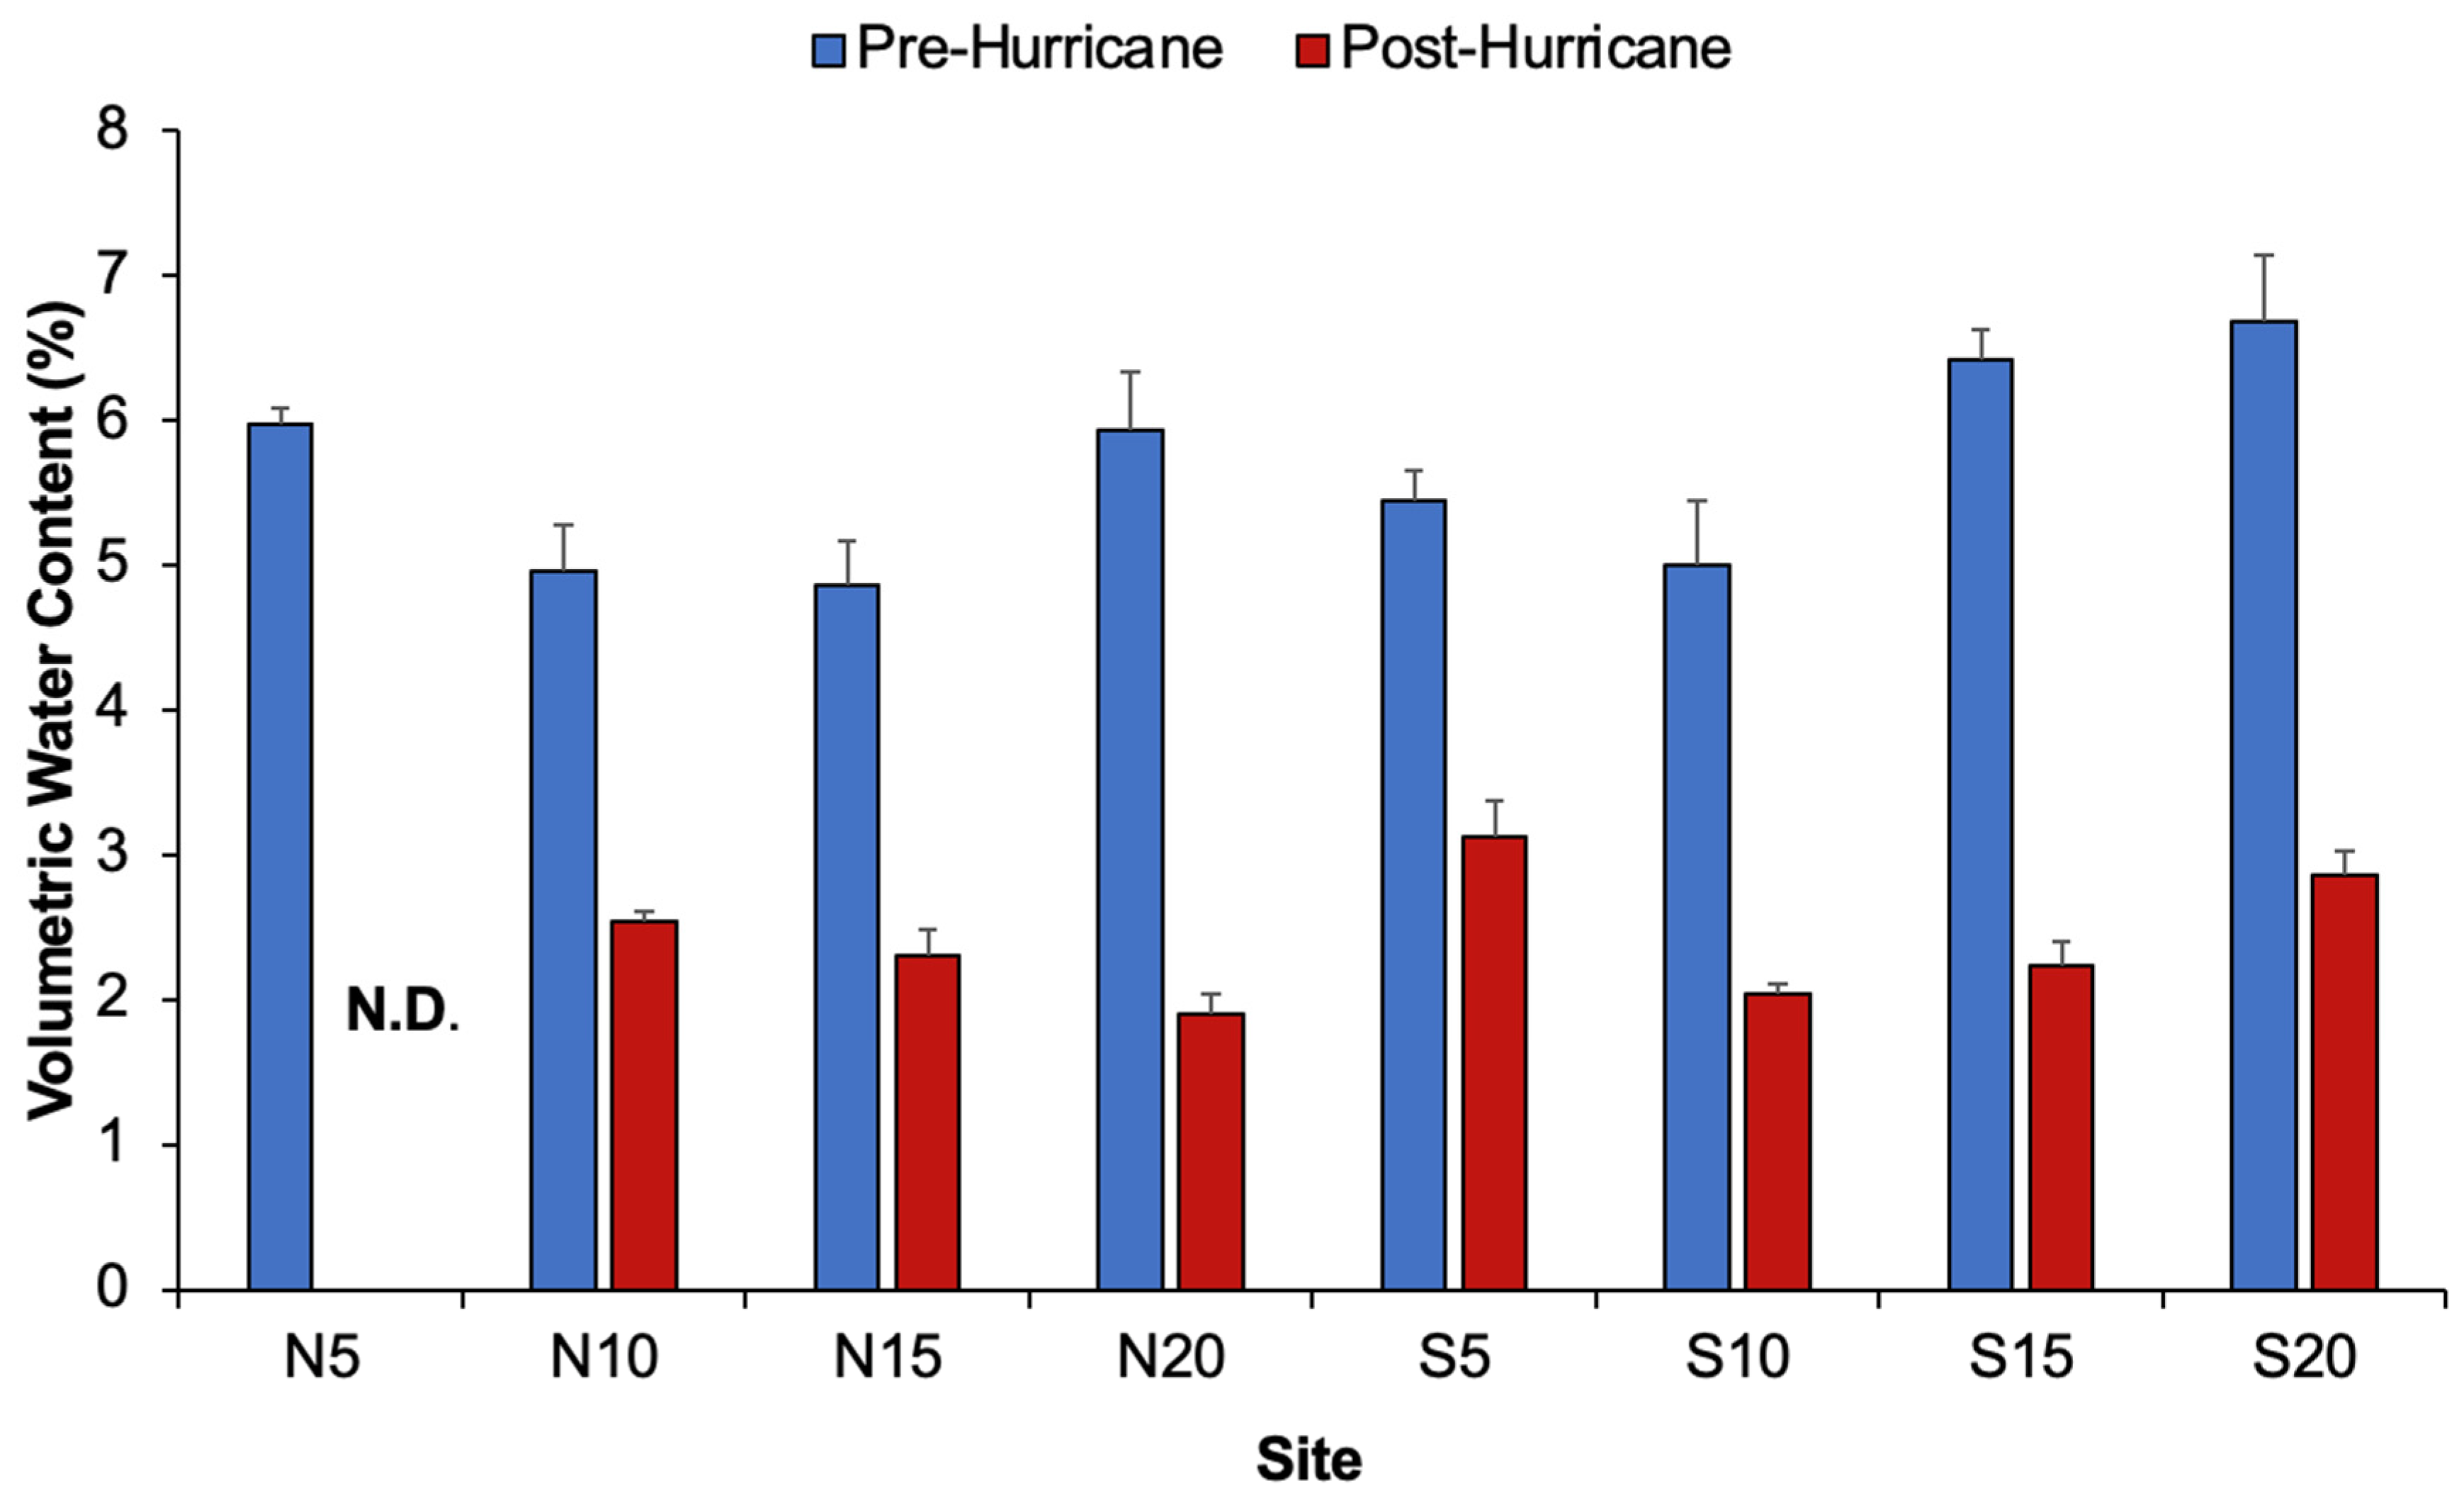
3.4. Sediment Characteristics

The median silt fraction was 2.64% (IQR = 3.1) before the hurricane and 5.79% after (20.2), but this overall date effect was marginally non-significant (df = 1,10; Iter = 1658; p = 0.057) (Table A3, Figure A5). The north transect had higher silt content (median (IQR) = 10.33% (31.1)) than the south transect (2.64% (4.58) (df = 1,10; Iter = 5000; p = 0.014)). There was no significant interaction of date and transect on silt fraction (df = 1,10; Iter = 715; p = 0.123). There was no region-wide impact of the hurricane on the other sediment size fractions (Table A3), although compositional changes did occur at the scale of individual sites (Figure A4a,b). Pre-hurricane, sediment organic matter content (mean ± SD = 1.78 ± 0.57%) was higher than post-hurricane (0.99 ± 0.40%) (df = 1,10; F = 9.259; p = 0.012). The north and south transects had similar organic matter (df = 1,10; F = 2.41; p = 0.151) and there was no differential impact of the hurricane on organic matter between the two transects (df = 1,10; F = 0.002; p = 0.96) (Figure A5). Post-hurricane, sediment moisture decreased (df = 1,10; Iter = 5000; p < 0.001). There was no difference in sediment moisture between the north and south transects (df = 1,10; Iter = 183; p = 0.355), and there was no differential impact within the transects due to the hurricane (df = 1,10; Iter = 51; p = 0.961) (Figure A6).

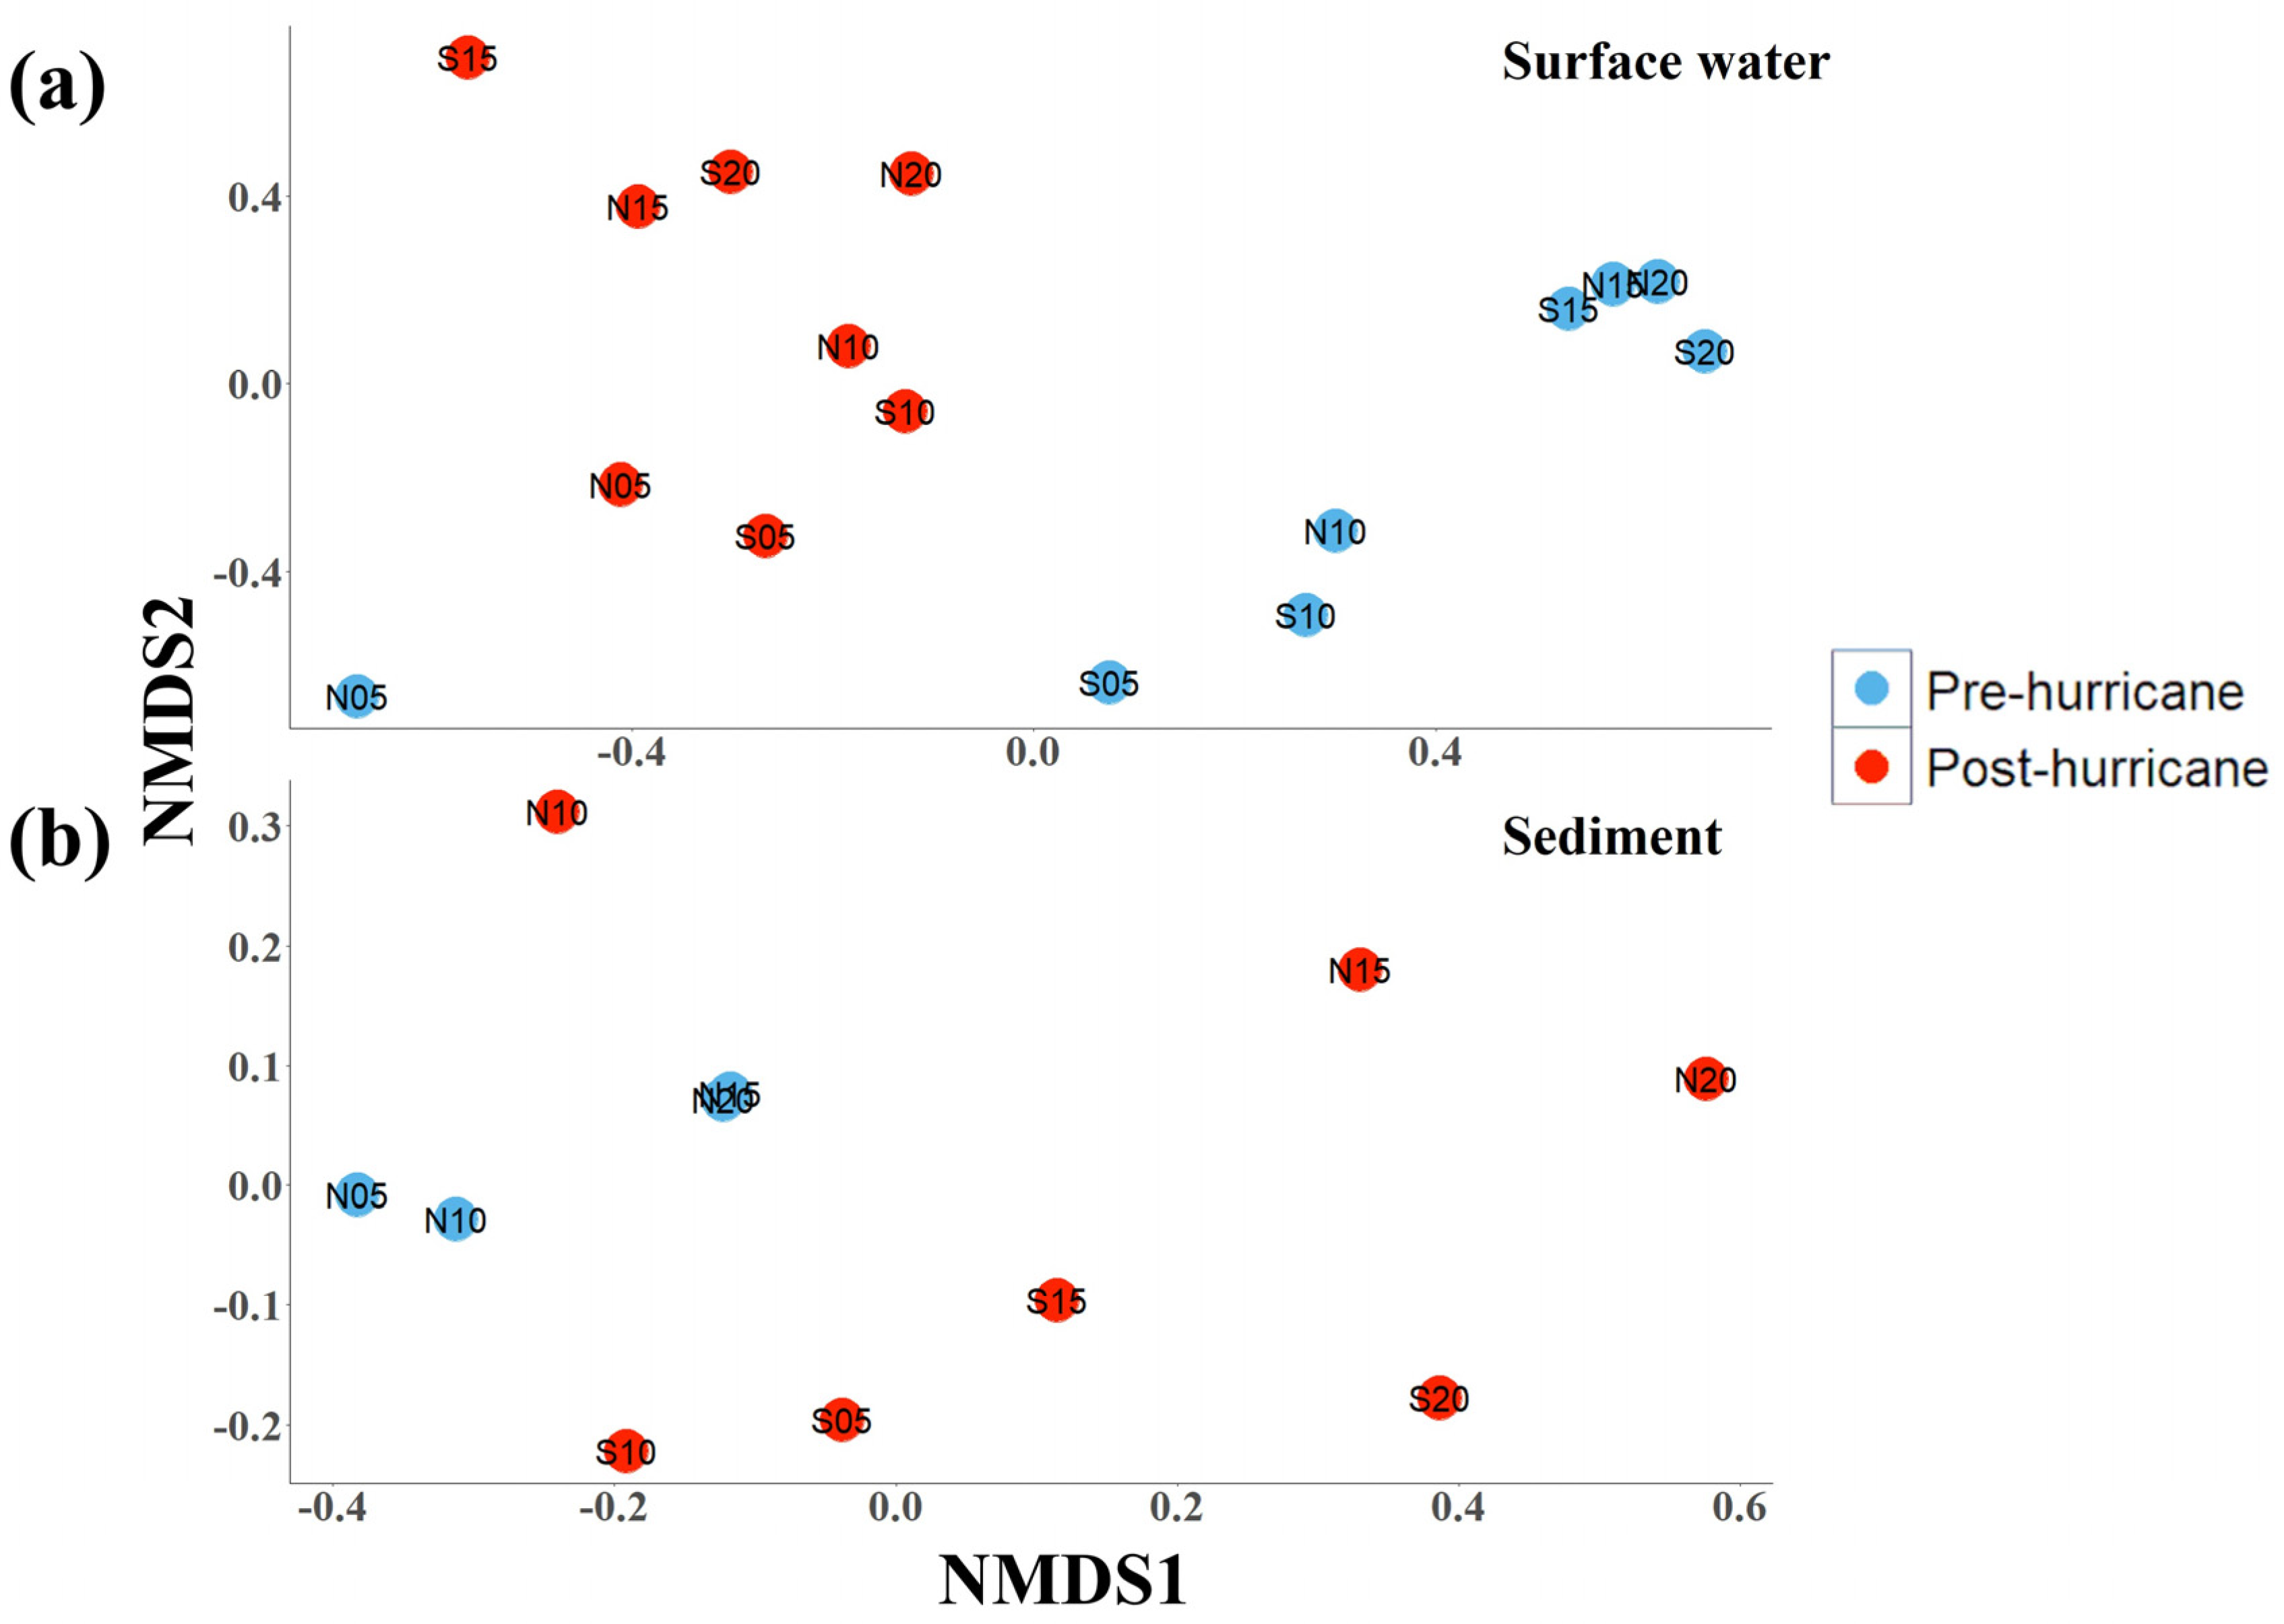
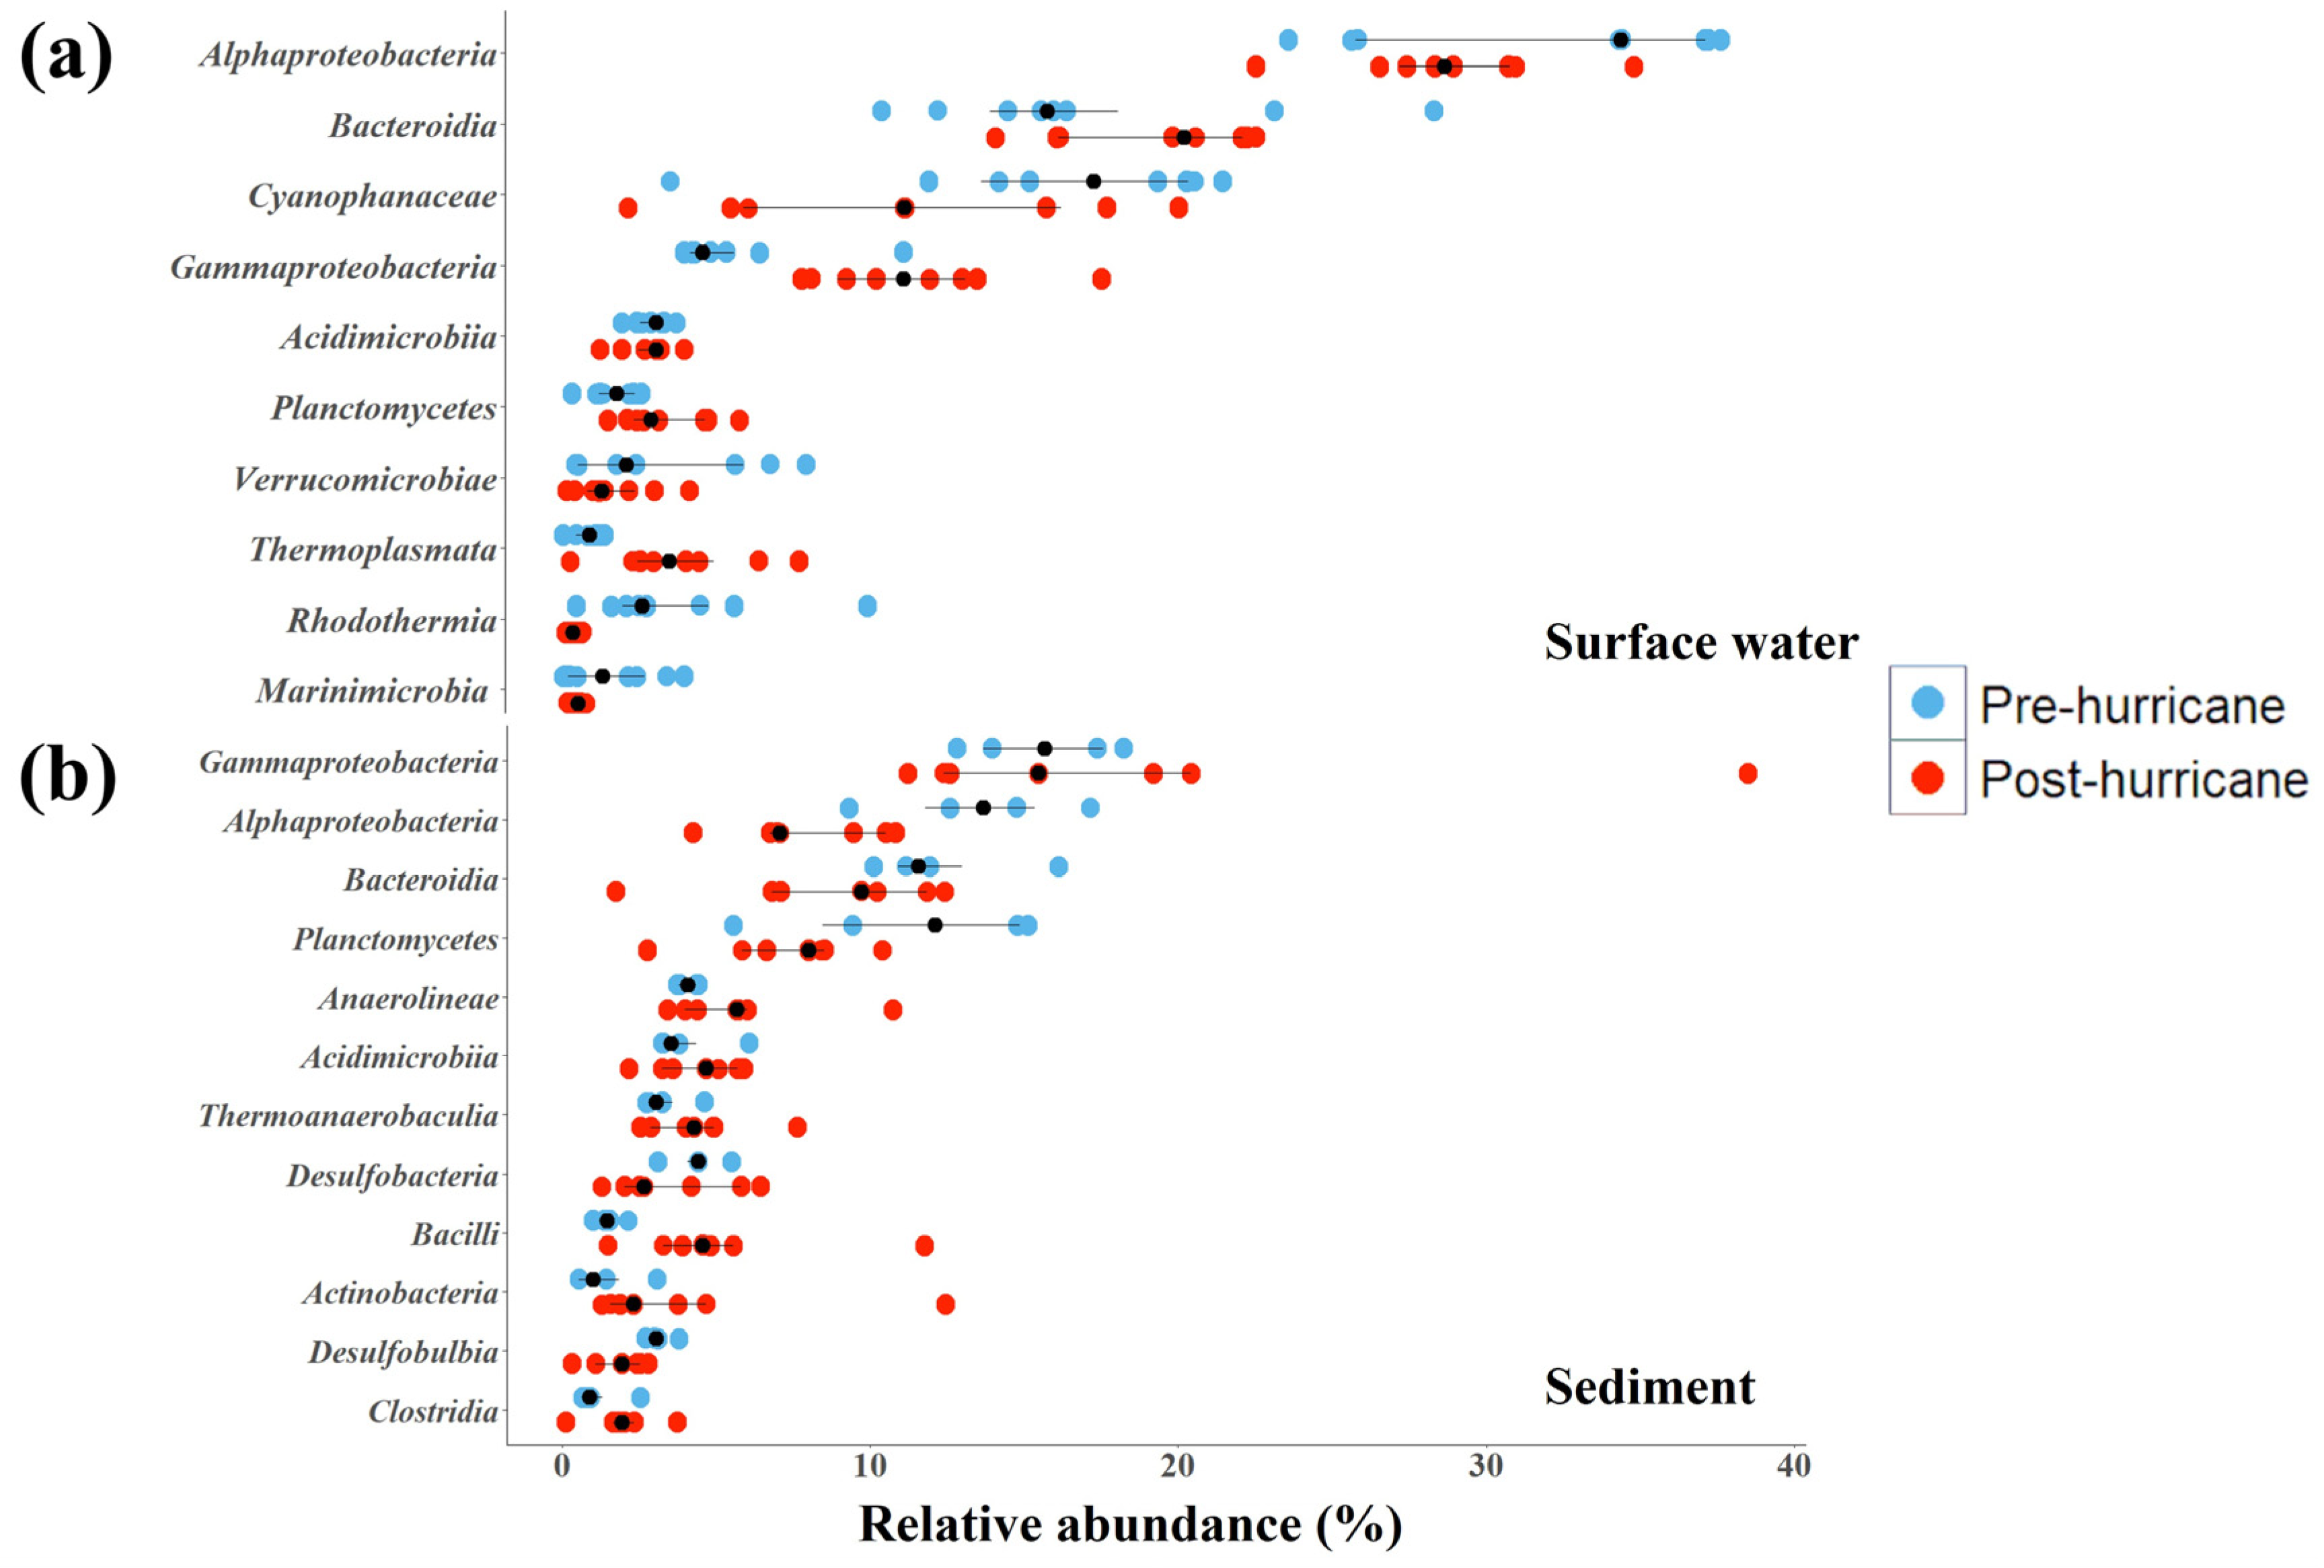
3.5. Microbial Community Structure

Prior to the hurricane, microbial alpha diversity was lower in the surface water than in the surface sediment (Hill-Shannon: t = 12.63, df = 6, p < 0.001. Richness: t = 7.74, df = 6, p < 0.001. Hill-InvSimp: t = 3.47, df = 6, p < 0.001) (Table A4 and Table A5). Post-hurricane, this difference in diversity between the sediment and water column was not observed (Hill-Shannon: t = 1.16, Iter = 9999, p = 0.281. Richness: t = 0.603, Iter = 9999, p = 0.566. Hill-InvSimp: t = 1.368, Iter = 9999, p = 0.181). Water column microbial diversity increased post-hurricane at all sites (Hill-Shannon: t = 5.10, df = 14, p < 0.001. Richness t = 7.15, df = 14, p < 0.001. Hill-InvSimp: t = 2.94, df = 14, p = 0.011) (Table A4). Mean sediment microbial diversity decreased post-hurricane (Table A5), but this difference was not significant (Hill-Shannon: t = 1.59, df = 4, p = 0.18. Richness: t = 2.18, df = 4, p = 0.095. Hill-InvSimp: t = 0.39, df = 4, p = 0.717). Microbial abundances were also determined in the surface waters (Figure A8). For total cell counts there was no difference were found between pre- or post- hurricane (df = 1,12; F = 1.594; p = 0.231) or between transects (df = 1,12; F = 1.20; p = 0.295). Picocyanobacteria counts were lower post-hurricane (df = 1,12; F = 13.04; p = 0.004) with no difference between transects (df = 1,12; F = 0.37; p = 0.553).
Microbial community composition also differed before and after the hurricane. Pre-hurricane surface water microbial communities were widely spread in ordination space, with a pattern reflecting their distance from shore and the mouth of the CRE. Site N5, near the mouth of the CRE, had the most distinct surface water microbial community. Post-hurricane surface water microbial communities were more clustered in ordination space and differed significantly from pre-hurricane communities (PERMANOVA, R2 = 0.267, p = 0.001), but still exhibited some inshore-offshore differentiation (Figure 6a). Comparisons among sediment microbial communities were complicated by the lack of pre-hurricane data from the south transect, and the lack of post-hurricane data for site N5. However, among sites sampled on both dates, there was a notable shift in sediment microbial communities and greater differentiation among sites post-hurricane (Figure 6b and Figure 7, Table A7). Sites N15 and N20, which had similar sediment microbial communities pre-hurricane had divergent communities post-hurricane (Figure 6a).
In the surface sediments, the dominant contributors to the microbial community were Gammaproteobacteria, Planctomycetes, Alphaproteobacteria, and Bacteroidia, but these taxa were impacted by the hurricane. Gammaproteobacteria in the sediments increased post hurricane, from an average of 15.6% to 18.5% relative abundance (Figure 7b, Table A7). Planctomycetes (11.2–7.2%), Alphaproteobacteria (13.8–7.9%), and Bacteroidia (12.3–8.6%) all decreased in relative abundance post-hurricane. The minor contributors that increased in relative abundance after the hurricane were Bacilli (1.5–5.0%), Actinobacteria (1.4–4.0%) and Clostridia (1.2–1.9%). The increases in relative abundance by Gammaproteobacteria and the minor contributors were largely driven by offshore sites, in particular N20 and S20 (Figure 7b, Table A7), but a fair pre-post hurricane comparison of these taxa can only be made for sites N10, N15, and N20 due to missing samples from the other sites (Table A7).
The surface water microbial communities were dominated by Alphaproteobacteria, Bacteroidia, Cyanophyceae, and Gammaproteobacteria, but relative abundances of these groups shifted after the hurricane (Figure 7a, Table A6). Cyanophyceae had one of the largest changes in relative abundance, declining from an average of 17.7% pre-hurricane to 12.5% post-hurricane. Alphaproteobacteria also declined from 35.8% pre-hurricane to 32.3% post-hurricane. Both Gammaproteobacteria and Bacteroidia increased in relative abundance after the hurricane, 6.2% to 12.8% and 19.1% to 21.5%, respectively. Less abundant taxa in the water column also changed in relative abundance before and after the hurricane, such as Planctomycetes (1.9–3.8%) and the Archaea Thermoplasmata (0.89–4.3%) increased in relative abundance while Verrucomicrobiae (3.6–1.9%) and Rhodothermia (4.1–0.41%) declined.

4. Discussion

4.1. Hurricane Ian in Historic Context

The extent of the environmental damage wrought by tropical cyclones depends on individual storm characteristics like wind intensity, landfall location, and precipitation [5,60]. Hurricane Ian caused a higher surge (4.5 m) and caused more extensive coastal damage than other hurricanes that made landfall in the region in recent decades, despite not possessing the strongest winds or lowest pressures. For example, Hurricane Charley (2004, Category 4 at landfall near Cayo Costa, FL) had a trajectory and intensity similar to Hurricane Ian, but was more compact and faster moving, generating a maximum storm surge of 2.5 m [61]. Hurricane Wilma (2005, Category 3 at landfall near Cape Romano, FL) was weaker, but produced a storm surge of 2.7 m [62]. Hurricane Irma (2017, Category 3 at landfall near Cudjoe Key, FL) crossed just inland of the southwest Florida coastline and was associated with a major freshwater discharge disturbance, but not a significant storm surge or wave disturbance on the SWFS [63]. To summarize, Hurricane Ian’s disturbance to the SWFS was not exceptional in terms of freshwater discharge but was more severe in terms of waves and storm surge than other storms of the prior two decades [64].

4.2. Changes in Water Quality

Images captured by NASA’s MODIS satellite two days after Hurricane Ian’s landfall indicate reduced optical water quality due to both wave action and coastal discharge (Figure A7). Cloudy waters offshore are attributable to the resuspension of carbonate-rich seafloor sediments by deep wave bases, while dark-hued plumes extending from the mouths of estuaries onto the shelf indicate the discharge of freshwater, CDOM, and various pollutants from the Myakka, Peace, and Caloosahatchee Rivers [65]. This pattern was also evident in our observations as increases of both turbidity and CDOM following the hurricane (Figure 3).
Discharges from Lake Okeechobee to the CRE through an artificial connection add to local watershed flows and greatly influence physico-chemical properties of the estuary and SWFS waters [66]. During Hurricane Ian, freshwater discharge from the Franklin Lock and Dam (S-79) water control structure to the CRE surpassed optimal flow levels for the estuary’s health (73.6 m3/s) by eleven-fold, peaking at over 680 m3/s [67,68]. While the most extreme flows were brief, they were followed by a prolonged period of >73.6 m3/s S-79 discharges to the SWFS. The 60-day mean discharge from S-79 on 31 August 2022 (during the pre-hurricane sampling period for this study) was 29.95 m3/s. By contrast it was 111.9 m3/s on October 31st (during the post-hurricane sampling period) [67,68]. Reductions in salinity and increases in CDOM throughout the SWFS study region are likely explained by this large introduction of freshwater.
In addition to reducing salinity, tropical cyclones can rapidly reduce sea surface temperatures by 3–5 °C through deep mixing by large waves and entrainment of upwelled cold waters [69,70,71,72,73]. This, in combination with seasonal cooling, likely explains the 5 °C post-hurricane temperature reduction in this study (Figure A2). The mixing and cooling effect of the hurricane may also have been responsible for the increased DO concentrations and abatement of bottom hypoxia on the SWFS after the storm. This increase contrasts with a decrease in DO typically observed in Southwest Florida estuaries after hurricanes [74]. The difference between shelf and estuarine DO responses might be explained by predominance of physical mixing effects on the shelf versus predominance of increased biological oxygen demand and salinity stratification in estuaries [74,75]. Our nearshore sites (N5 and S5) did exhibit a modest decrease in DO post-hurricane, which is consistent with the notion that DO drops are more inshore, estuarine dynamics. However, because these sites were sampled two weeks later than the other sites it is uncertain whether the drop was site-related or time-related.
The increased concentrations of nutrients (nitrate, nitrite, orthophosphate, and ammonia) following Hurricane Ian (Figure 3 and Figure A3) are consistent with previously reported post-hurricane changes [18,76]. These increases can be attributed to a combination of factors, including the decomposition of terrestrial organic matter [77,78,79], nutrient-rich freshwater discharge [80,81], and deep-mixing and benthic flux on the shelf [82,83,84]. The decrease in DO at nearshore stations (N5 and S5) is consistent with decomposition of terrestrial organic matter as a nutrient source. However, the specific contribution of each source remains unclear. In the marine nitrogen cycle, nitrate, nitrite, and ammonia are interconnected and undergo transformations during the breakdown and re-mineralization of organic matter [85,86,87,88]. Ammonia, resulting from the breakdown of organic matter, can be further oxidized into nitrite and then nitrate through the oxidation of ammonia i.e., nitrification [89,90,91]. The rates of nitrification can be influenced by environmental conditions such as DO, light, temperature, salinity, and turbidity [91,92,93], which likely contributes to the observed elevated levels of nitrite and nitrate. In addition to the remineralization or organic matter, the increase of orthophosphate is likely associated with runoff, sediment resuspension and dissolution, and sedimentary fluxes [94]. Furthermore, changes in nutrient concentrations at offshore sites post-hurricane could be influenced by deepwater mixing and upwelling [95]. In contrast, the general decrease in silica concentrations can be attributed to the biological uptake by diatoms, whose abundances are known to be influenced by storm activity [96,97].
Typically, there is an increase in chlorophyll a concentrations following major tropical cyclones [72,98,99,100,101]. The increase in chlorophyll a after storms, may stem from terrigenous and upwelled nutrient inputs, and offshore advection of coastal waters by wind-driven currents [72,102]. However, no clear pattern could be discerned for pre- and post-hurricane changes in chlorophyll a in the current study (Figure 3). This may be due to already-high chlorophyll a concentrations in the study region at the time of the hurricane; typical for late summer in the northeastern GOM [78,103,104,105], and to countervailing effects of increased nutrients and reduced optical water quality in the aftermath of the storm. Remote sensing approaches examining broader regions of the SWFS might reveal aspects of the post-hurricane phytoplankton community response not captured in this more localized, nearshore study [72,106,107].
The timescale for post-hurricane algal bloom development may also exceed the timescale of sampling for this study. Others have associated high freshwater and nutrient flux to the SWFS following hurricanes with HABs that develop several months to a year after the immediate disturbance [32,33].

4.3. Changes in Substrates and Benthos

Hurricane Ian significantly altered benthic habitats in the study region, reducing the availability of hard bottom substrate and most types of biotic cover at the sites surveyed. These changes likely reflect initial scouring away of epibenthic biota by strong currents and suspended debris, and burial by transported and deposited sediments [22,108,109] (Figure A4a,b). The near complete loss of epibiota and hard bottom substrate from both 10 m depth sites, and their replacement with sand and silt, indicates bulk sediment transport and burial to considerable depth. Prior to the hurricane these sites had ~30 cm tall colonies of the scleractinian corals Solenastrea bournoni and Oculina robusta, which appeared to have been completely buried during the storm. Unconsolidated sediment deposits on the SWFS are spatially heterogeneous, including shoreface-connected sand sheets at <8 m depth, and alternating sand ridges (up to 4 m high) and exposed hard bottom beyond the 8 m isobath [110]. Critical threshold velocities for erosion of fine sand from smooth bottom (17.2 cm/s) [111], were far exceeded even at 20 m depth during Hurricane Ian, as indicated by the tilt meter data from Site N20. I.e., there was an ample supply of unconsolidated sediments in the area, and ample energy to move it during the hurricane, to the detriment of the organisms buried at N10 and S10. Further offshore at N20, the percentage of exposed hard bottom habitat also declined sharply, from 35% to 5%, but it appeared less deeply buried, with many soft corals and sponges protruding through the sediment veneer. The lack of deep burial at Sites N20 and S5 might be due to the relatively high relief of the limestone ledge habitats at those sites, or due to other aspects of their structure and setting. Identifying hard bottom features on the SWFS that have persisted and are likely to persist through tropical cyclones could help managers set priority seabed areas for protection from anthropogenic disturbance.
Organisms remaining after the storm included some tall and strongly attached taxa that may be resistant to scour and burial, such as sponges and soft coral (Figure 5a,b), as well as some resilient taxa like fleshy macroalgae that may have quickly regrown or recolonized at sites where hard substrates persisted through the storm [20,21]. The sponge community in the region surveyed was comprised largely of encrusting and firmly-attached forms, which others have found are resistant to tropical cyclone impacts [112]. Some of the biotic cover groups most negatively impacted by Hurricane Ian (seagrass, calcareous green algae, and fleshy macroalgae) have been identified as vulnerable to physical disturbance in other storm disturbance studies, as well [112,113,114]. However, these relatively fast-growing taxa are also known to fluctuate seasonally in this region [115], thus determining if they have suffered a long-term loss will require additional assessment. In ecosystems with pronounced seasonal fluctuations in environmental conditions, such as temperate estuaries, benthic communities may return to baseline conditions quickly after storm disturbance [75]. However, where seasonal fluctuation is less pronounced and benthic ecosystems are comprised of slower-growing, structure-forming species, severe disturbances can lead to enduring changes in ecosystem state [5].
The north transect of this study was likely more severely impacted by Hurricane Ian than the south transect, as the hurricane’s path came closer to the north study sites (Figure 1) and these sites were closer to freshwater discharges from the CRE. The greater contribution of fine-grained sediment along the north transect versus the south is consistent with an influence of sediments borne by freshwater discharge [116]. However, aerial imagery indicates a large amount of sediment resuspension across the entire SWFS (Figure A8), and a resorting of grain sizes due to differential settling velocity would leave smaller sized sediment fractions on top [108]. Thus, the conspicuous, fine-grained sediment deposits seen after the storm are likely from a combination of riverine export and resorting of existing shelf sediments.
Decreased sediment organic matter post-hurricane, may be due to resuspension, decomposition, and advection of low-density organic matter from the system, or due to an influx of fine sediments with higher contributions from inorganic minerals, relative to the original sediments. Moisture content in the sediments also decreased post hurricane, possibly due to mechanisms similar to those that changed the organic matter content [117]. There is precedent for large scale advective transport of fine sediments during tropical cyclone events in shelf waters. For example, in 2005, between Hurricanes Katrina and Rita, 1.16 × 10¹⁵ ± 1.56 × 10¹⁴ g of sediment were remobilized along the Louisiana and Texas shelves [118]. Further, immediately following Typhoon Chan-hom’s passage in the East China Sea, the suspended sediment concentration increased 50 times compared to pre-typhoon concentrations and was transported both along-shelf and cross-shelf [119]. The suspended sediment concentrations returned to pre-storm levels 2–3 days following the passage of the typhoon [119]. It is likely that much of the fine sediment resuspended by Hurricane Ian also settled to the benthos in the weeks between the storm and our post-hurricane sampling.

4.4. Microbial Community Changes

Surface water microbial communities changed after Hurricane Ian, but it is unclear to what extent the changes were due to the hurricane as opposed to regular seasonal variation, since the seasonality of microbial communities of the SWFS has not been characterized. Among the microbial community changes likely attributable to the hurricane are increases in prevalence of heterotrophs (Gammaproteobacteria and Bacteroidia) and the reduction of autotrophs (Cyanophyceae) in surface water, supported by picocyanobacteria counts. Similar changes were observed following a typhoon passing New Caledonia in the South Pacific [120]. This may reflect a shift in community metabolism towards heterotrophic decomposition, perhaps in response to the increased supply of complex and simple carbohydrates [121]. Given the high river discharges and run-off to the SWFS post-hurricane [67,68], large amounts of allochthonous dissolved organic carbon (DOC) were likely imported, prompting the shift in marine community composition. Extreme weather events can account for 20–50% of annual riverine DOC flux to coastal regions [79,122]. A shift from autotrophs to heterotrophs was also documented in the coastal waters of the Outer Banks, North Carolina after the hurricanes Florence and Michael sequentially hit the region in the 2018 hurricane season [123]. That study also found that at marine sites (>25 ppt) Flavobacteriia, Gammaproteobacteria, and unclassified Bacteroidetes all increased in relative abundance during the 2018 hurricane season when compared to communities from 2016 and 2019. They also saw a decrease in Alphaproteobacteria, as in this study. This could indicate an increase in nutrient concentrations as many marine Alphaproteobacteria are adapted to oligotrophic conditions [124,125].
Some of the taxa in sediments that increased post-hurricane (Actinobacteria, Clostridia, and Bacilli) are predominantly freshwater and terrestrially associated. Although Actinobacteria is widespread and can account for up to 13% relative abundance in other marine sediments, it can indicate human influence on coastal waters [126,127]. Some taxa among Actinobacteria, Clostridia, and Bacilli degrade woody recalcitrant lignin [128,129], and their increases in relative abundance may be in response to the large fluxes of lignin to the coast known to occur after major storm events [123]. The reduction of Planctomycetes and Bacteroidia may be due to the decline of fleshy macroalgae seen post-hurricane, as these microbes are important components of the biofilms of macroalgae [130,131]. Planctomycetes and sediment Bacteroidia are the typical anerobic mineralizers of marine sediments, responding to polysaccarides of algal origin that end up within the sediment [131,132]. Post-hurricane, these taxa may have been displaced by estuary-associated decomposers of more recalcitrant materials. Overall, the microbial community changes observed post-hurricane are consistent with an estuarization of the shelf by freshwater and terrigenous inputs.

5. Conclusions

Hurricane Ian significantly impacted the water quality, microbial communities, substrates, and benthic habitats of the SWFS through a combination of physical and chemical disturbances. The intense wave energy generated by the storm caused widespread scouring and sediment transport, leading to significant physical alterations in substrate availability and composition. Similarly, the massive influx of freshwater from coastal watersheds introduced large quantities of nutrients, DOC, and sediments, which triggered chemical changes that reshaped both water column dynamics and benthic ecosystem structure. These disturbances led to significant changes in microbial community composition and a dramatic decline in macrobenthic cover, with especially notable losses in habitat building groups like seagrass, stony corals, and calcareous algae.
While hurricanes are a natural part of the disturbance regime of the SWFS, anthropogenic pressures, including altered watershed hydrology, coastal development, and nutrient pollution, can synergistically worsen the effects [32,133,134]. In addition to better understanding the mechanisms of hurricane disturbance to shelf environments and identifying the potential to mitigate them through watershed management actions, there is a need to better understand the dynamics of recovery and resilience on the SWFS. Future research must prioritize understanding the resilience and recovery dynamics of benthic habitats across different substrate types, depth gradients, and proximity to riverine inputs. Patch dynamics, rates of ecological succession, and resistance/resilience of continental shelf habitats to multiple disturbances must be explored across the ecotones of the SWFS (e.g., hard and soft substrate habitats, nearshore, and offshore). Improved mapping of hard-bottom habitats and routine monitoring of water quality and benthic communities are essential for establishing baseline conditions, detecting early signs of degradation, and assessing the cumulative impacts of natural and anthropogenic stressors. E.g., one value of routine monitoring would be enabling assessment of how long post-disturbance ecosystem changes endure in this system. Given the expected increase in tropical cyclone intensity due to climate change, it is crucial to develop proactive plans to protect the biodiversity and health of the SWFS. These plans should include flexible management approaches, involve local communities, and support research across different fields to help maintain the resilience and long-term health of this important marine ecosystem.

Author Contributions

Conceptualization, J.G.D., P.L.A. and H.U.; methodology, M.C.T., J.G.D. and A.B.C.; software, T.R.T.; validation, J.G.D.; formal analysis, M.C.T. and T.R.T.; investigation, M.C.T., R.M.S., T.R.T. and A.B.C.; resources, P.L.A.; data curation, M.C.T., R.M.S. and T.R.T.; writing—original draft preparation, M.C.T. and R.M.S.; writing—review and editing, A.B.C., H.U., P.L.A. and J.G.D.; visualization, M.C.T.; supervision, M.C.T., P.L.A., H.U. and J.G.D.; project administration, M.C.T. and J.G.D.; funding acquisition, J.G.D., H.U. and P.L.A. All authors have read and agreed to the published version of the manuscript.

Funding

This work was supported by the U.S. Environmental Protection Agency grant number SF-02D20922 to J.G.D., and National Science Foundation Award No. OCE-2309659 to P.L.A., and partial ship time to the investigators was awarded by the Florida Institute of Oceanography.

Data Availability Statement

The raw data supporting the conclusions of this article will be made available by the authors on request.

Acknowledgments

We would like to acknowledge the captain and crew of R/V Hogarth for their help with sampling efforts, all the undergraduate students and divers who assisted with fieldwork, and Brian Bovard for providing critical insight on statistical analyses.

Conflicts of Interest

The authors declare no conflicts of interest. The funders had no role in the design of the study; in the collection, analyses, or interpretation of data; in the writing of the manuscript; or in the decision to publish the results.

Abbreviations

The following abbreviations are used in this manuscript:
DODissolved Oxygen
DOCDissolved Organic Carbon
CRECaloosahatchee River Estuary
SWFSSouthwest Florida Shelf
FGCUFlorida Gulf Coast University
GOMGulf of Mexico
DOMDissolved Organic Matter
CTSBCross-Shelf Transport Barrier
FIOFlorida Institute of Oceanography
US EPAUnited States Environmental Protection Agency
PSUPractical Salinity Unit
NTUNephelometric Turbidity Unit
CDOMChromophoric Dissolved Organic Matter

Appendix A

Table A1. Depths and locations of each site, and 2022 sampling dates (month/day) for video, water quality, and sediment and microbial community samples. Pre- and Post- indicate pre-Hurricane Ian and post-Hurricane Ian sampling periods, respectively. Blanks indicate where no samples of that type were obtained.
SiteDepth (m)Latitude and Longitude VideoWater QualitySediment Grain SizeSediment MicrobialWater Microbial
Pre-Post-Pre-Post-Pre-Post-Pre-Post-Pre-Post-
N5326.4722° N, 081.9771° W9/211/28/2311/29/2 9/2 8/2311/2
N101026.3086° N, 082.0963° W 9/210/218/2410/219/210/219/210/218/2410/21
N151526.25751° N, 082.2623° W9/610/228/2510/229/610/229/610/228/2510/22
N202026.21683° N, 082.3791° W9/610/228/2610/229/610/229/610/228/2610/22
S5526.17203° N, 081.8234° W9/111/28/2511/29/111/2 11/28/2511/2
S101026.14049° N, 081.9140° W9/110/238/2610/239/110/23 10/238/2610/23
S151526.05257° N, 082.0984° W9/810/238/2710/239/810/23 10/238/2710/23
S202025.97247° N, 082.2164° W9/810/238/2810/239/810/23 10/238/2810/23
Table A2. Sampling method information for water quality parameters, including in-situ methodology and laboratory analysis method if applicable.
Parameter In Situ Method Laboratory Analysis
Salinity (PSU)YSI EXO II conductivity sensor N/A
Temperature (°C)YSI EXO II thermistor sensor N/A
Dissolved oxygen (mg/L)YSI EXO II optical sensorN/A
Turbidity (NTU)YSI EXO II turbidity sensorN/A
Chromophoric Dissolved Organic Matter (CDOM)Collected with Van Dorn, or Niskin bottle, filtered seawater with 0.45 µm nylon filterTrilogy Fluorometer, CDOM/fDOM module
Chlorophyll aCollected with Van Dorn, or Niskin bottle, filtered onto 0.7 µm GF/F filter, wrapped in aluminum foil and frozen at −20 °CFilters extracted with 90% acetone and quantified with Trilogy Fluorometer with
module CHL-A-ACID (Model 7200–040
Ammonia (NH3)Collected with Van Dorn, or Niskin bottle, filtered seawater with 0.45 µm nylon filter, frozen until analysisSEAL AA500 autoanalyzer, method A-043-19
Nitrite (NO2)Collected with Van Dorn, or Niskin bottle, filtered seawater with 0.45 µm nylon filter, frozen until analysisSEAL AA500 autoanalyzer, A-044-19 method
Nitrate (NO3)Collected with Van Dorn, or Niskin bottle, filtered seawater with 0.45 µm nylon filter, frozen until analysisSEAL AA500 autoanalyzer, A-044-19 method
Orthophosphate (oP)Collected with Van Dorn, or Niskin bottle, filtered seawater with 0.45 µm nylon filter, frozen until analysisSEAL AA500 autoanalyzer, A-005-19 method
Total nitrogen (TN)Van Dorn/Niskin bottle, frozen until analysis Shimadzu TOC with TNM-L accessory
Total phosphorus (TP)Van Dorn, frozen until analysis Manual persulfate digestion, SEAL AA500 Autoanalyzer, A005-19-3 method
Table A3. Statistical analyses applied, and results of analyses, for each response variable from benthic video transects. (*) indicates p-value < 0.05, (**) indicates p-value < 0.01, (***) indicates p-value < 0.001. Surface water (SW) and surface sediment (Sed) abbreviated in the response variable column and south transect (ST) is abbreviated in the samples excluded column. A two-way permutational ANOVA has the same interpretation of a parametric two-way ANOVA but the p-value is calculated differently. The observed data is used to calculate the f-value as in a traditional two-way ANOVA, then the response variable is repeatedly shuffled randomly (i.e., iterations) and assigned to different sample-IDs while keeping group sizes constant. For each iterated data set, a f-value is calculated and compared to the observed f-value. The p-value is the proportion of iterations that have a test statistic equal to or larger than that of the observed data.
Response VariableFactors & InteractionsSample Size (n)Testp-ValuesSamples Excluded
Benthos and Substrate
Hard Bottom CoverDate
Transect
Date × Transect
300Permutation Two-way ANOVA<2 × 10⁻¹⁶ ***
<2 × 10⁻¹⁶ ***
0.5811
N/A
Total Biotic CoverDate
Transect
Date × Transect
300Permutation Two-way ANOVA<2 × 10⁻¹⁶ ***
<2 × 10⁻¹⁶ ***
0.6545
N/A
Stony Coral % CoverDate
Transect
Date × Transect
300Permutation Two-way ANOVA<2 × 10⁻¹⁶ ***
0.3194 0.1061
N/A
Soft Coral % CoverDate
Transect
Date × Transect
300Permutation Two-way ANOVA 0.8235
<2 × 10⁻¹⁶ ***
0.6545
N/A
Sponge % CoverDate
Transect
Date × Transect
300Permutation Two-way ANOVA0.00620 **
0.3402
0.1714
N/A
Sessile Invertebrate % CoverDate
Transect
Date × Transect
300Permutation Two-way ANOVA<2 × 10⁻¹⁶ ***
0.1401
0.1510
N/A
Seagrass % CoverDate
Transect
Date × Transect
300Permutation Two-way ANOVA0.0008 ***
0.0040 **
0.0112 *
N/A
Calcareous Green Algae % CoverDate
Transect
Date × Transect
300Permutation Two-way ANOVA<2 × 10⁻¹⁶ ***
0.0024 **
0.0102 *
N/A
Fleshy Macroalgae % CoverDate
Transect
Date × Transect
300Permutation Two-way ANOVA<2 × 10⁻¹⁶ ***
<2 × 10⁻¹⁶ ***
0.2377
N/A
Water Quality and Nutrients
Chlorophyll aDate
Transect
Date × Transect
48Permutation Two-way ANOVA0.9804
0.8627
0.6429
N/A
Ammonia (NH3) Date
Transect
Date × Transect
48Permutation Two-way ANOVA0.0044 *
0.4622 0.4444
N/A
Nitrate (NO3) Date
Transect
Date × Transect
48Permutation Two-way ANOVA0.2922
0.2182
0.7647
N/A
Nitrite (NO2) Date
Transect
Date × Transect
48Permutation Two-way ANOVA <0.001 **
0.3924
0.1523
N/A
Orthophosphate (oP) Date
Transect
Date × Transect
48Permutation Two-way ANOVA 0.0146 *
0.2153 0.7451
N/A
Silica (SiO2) Date
Transect
Date × Transect
48Permutation Two-way ANOVA 0.0158 *
0.0548
0.0633
N/A
Total Nitrogen (TN) Date
Transect
Date × Transect
48Permutation Two-way ANOVA <0.0001 ***
0.6667 0.9804
N/A
Total Phosphorus (TP) Date
Transect
Date × Transect
48Permutation Two-way ANOVA <0.001 **
<0.001 **
<0.001 **
N/A
CDOM (PPB) Date
Transect
Date × Transect
48Permutation Two-way ANOVA <0.001 **
0.8824
0.5542
N/A
Turbidity (NTU) Date
Transect
Date × Transect
48Permutation Two-way ANOVA <0.001 **
0.1924 0.8039
N/A
Sediment Characteristics
Volumetric Water Content (%) Date
Transect
Date × Transect
7Permutation Two-way ANOVA <0.001 *
0.3552
0.9608
N5
Organic Matter Content (%) Date
Transect
Date × Transect
7Two-way ANOVA 0.0124 *
0.1515
0.9623
N5
Shell fraction (%) Date
Transect
Date × Transect
7Permutation Two-way ANOVA 0.8039
1.0000
0.2170
N5
Fine shell fraction (%)Date
Transect
Date × Transect
7Permutation Two-way ANOVA 0.6429
0.5412
0.8431
N5
Coarse sand fraction (%)Date
Transect
Date × Transect
7Permutation Two-way ANOVA 0.3043
0.5412
0.7255
N5
Fine sand fraction (%)Date
Transect
Date × Transect
7Permutation Two-way ANOVA 0.9216
0.0188 *
0.4906
N5
Silt fraction (%)Date
Transect
Date × Transect
7Permutation Two-way ANOVA 0.0570
0.0140 *
0.1230
N5
Microbial Alpha Diversity and Abundances
Surface water -RichnessDate8Paired
T-test
<0.001 **N/A
Surface water -Hill-ShannonDate8Paired
T-test
<0.001 **N/A
Surface water -Hill-InvSimpsonDate8Paired
T-test
0.011 *N/A
Sediment-RichnessDate6Paired
T-test
0.095N5, ST
Sediment -Hill-ShannonDate6Paired
T-test
0.187N5, ST
Sediment -Hill-InvSimpDate6Paired
T-test
0.717N5, ST
Pre-SW + Sed RichnessSample type8Paired
T-test
<0.001 **ST
Pre-SW + Sed Hill-ShannonSample type8Paired
T-test
<0.001 **ST
Pre-SW + Sed Hill- InvSimp Sample type8Paired
T-test
<0.001 **ST
Post-SW + Sed RichnessSample type14Two-Sample Fisher-Pitman Permutation Test0.5664N5
Post-SW + Sed Hill-ShannonSample type14Two-Sample Fisher-Pitman Permutation Test0.2805N5
Post-SW + Sed Hill-InvSimpSample type14Two-Sample Fisher-Pitman Permutation Test0.1806N5
Total cell count (surface water)Date
Transect
Date × Transect
162-way ANOVA0.231
0.295
0.848
N/A
Picocyanobacteria counts (surface water)Date
Transect
Date × Transect
162-way ANOVA0.0034 *
0.5528
0.4950
N/A
Table A4. Hill Diversity values for surface water microbial communities pre- and post-hurricane (August 2022 “Pre” and October 2022 “Post”). Mean values across all samples pre- and post- hurricane shown with standard deviation.
Species RichnessHill-ShannonHill-InvSimpson
SitePrePostPrePostPrePost
N528735394.15109.2344.1745.66
N1026338666.75127.6128.3661.34
N15287448103.12180.8256.63100.55
N2024737382.15146.6742.4872.20
S522648653.31118.3516.8938.64
S1024038955.87109.9418.8541.37
S1525334793.54133.4949.5477.27
S2027236987.82144.2742.9683.38
Mean259 ± 22394 ± 4879.59 ± 18.72133.80 ± 23.7137.48 ± 14.4765.05 ± 22.18
Table A5. Hill Diversity values for surface sediment microbial communities pre- and post-hurricane (August 2022 “Pre” and October 2022 “Post). Mean and standard deviation are shown for just N10, N15, and N20, as these were the only sites for which sediment microbial community data were obtained both before and after the hurricane. Not determined abbreviated as n.d.
Species RichnessHill-ShannonHill-InvSimpson
SitePrePostPrePostPrePost
N51606n.d909.79n.d411.27n.d
N1010981213666.69867.73337.06589.46
N151339371914.63261.69585.9174.09
N201799167813.495.87135.651.07
S5n.d994n.d470.06n.d92.65
S10n.d673n.d426.79n.d239.42
S15n.d461n.d302.1n.d159.46
S20n.d310n.d105.42n.d15.78
Mean of N10, N15, N201412 ± 356584 ± 554798.24 ± 124.66408.45 ± 406.31352.85 ± 225.56271.54 ± 282.11
Table A6. Relative abundance (%) of the top 10 taxa at the class level in surface water microbial communities in the pre-hurricane (August 2022, “Pre”) and post-hurricane (October 2022, “Post”) samples. Mean values shown with standard deviation.
TaxonTimeN5N10N15N20S5S10S15S20Mean
AlphaproteobacteriaPre38.4826.4241.7238.5728.7428.9541.6042.1735.83 ± 6.64
Post29.7334.6831.7734.4525.2632.4339.0130.7332.26 ± 4.04
Cyanophyceae Pre3.9323.0113.3621.6624.0522.7317.0215.8917.70 ± 6.78
Post17.6312.446.7812.5022.4319.812.416.1412.52 ± 7.11
Bacteroidia Pre31.7325.9216.2213.6617.4317.8618.3611.6219.10 ± 6.60
Post18.0223.0422.2115.7624.7418.1024.9225.2421.50 ± 3.70
Gammaproteobacteria Pre12.424.464.824.455.395.974.717.186.18 ± 2.69
Post19.6311.4514.5710.359.068.7115.1013.3812.78 ± 3.66
Verrucomicrobiae Pre2.000.486.308.880.590.532.697.563.63 ± 3.43
Post0.451.552.431.350.181.113.364.651.88 ± 1.52
Acidimicrobiia Pre2.903.723.232.723.613.702.184.163.28 ± 0.65
Post3.474.443.013.422.173.591.373.423.11 ± 0.94
PlanctomycetesPre1.522.831.241.372.592.892.440.351.90 ± 0.92
Post1.653.515.326.445.172.982.722.353.77 ± 1.68
Thermoplasmata Pre1.531.340.520.031.020.480.941.230.89 ± 0.51
Post2.833.314.517.170.282.564.998.634.29 ± 2.67
Rhodothermia Pre0.526.273.061.805.0211.122.792.334.11 ± 3.36
Post0.520.490.300.120.720.730.230.150.41 ± 0.24
Marinimicrobia (SAR406_clade) Pre0.050.553.812.731.450.252.384.441.79 ± 1.78
Post0.190.400.610.851.670.680.550.580.51 ± 0.22
Table A7. Relative abundance (%) of the top 12 taxa at the class level in surface sediment microbial communities in the pre-hurricane (August 2022, “Pre”) and post-hurricane (October 2022, “Post”) samples. Mean for just N10, N15, and N20 is shown, as these were the only sites for which sediment microbial community data were obtained both before and after the hurricane. Not determined abbreviated as n.d. Mean values shown with standard deviation.
TaxonTimeN5N10N15N20S5S10S15S20Mean N10, N15, N20
GammaproteobacteriaPre18.2317.3613.9512.82n.d.n.d.n.d.n.d.14.71 ± 2.36
Postn.d.11.2215.4612.5820.4012.3719.2038.4913.09 ± 2.16
PlanctomycetesPre5.569.4314.7815.11n.d.n.d.n.d.n.d.13.11 ± 3.19
Postn.d.5.858.402.7510.407.998.506.645.67 ± 2.83
AlphaproteobacteriaPre14.7512.609.3217.13n.d.n.d.n.d.n.d.13.02 ± 3.92
Postn.d.6.979.456.7410.817.0710.524.237.72 ± 1.51
BacteroidiaPre16.1110.1011.9411.16n.d.n.d.n.d.n.d.11.07 ± 0.92
Postn.d.11.859.7210.2312.417.096.821.7410.60 ± 1.11
AcidimicrobiiaPre3.296.083.783.24n.d.n.d.n.d.n.d.4.36 ± 1.51
Postn.d.2.165.083.245.704.675.913.593.49 ± 1.48
AnaerolineaePre4.354.423.823.73n.d.n.d.n.d.n.d.3.99 ± 0.37
Postn.d.5.674.005.734.3810.726.013.425.13 ± 0.98
ThermoanaerobaculiaPre2.732.854.613.24n.d.n.d.n.d.n.d.3.57 ± 0.92
Postn.d2.554.934.032.894.894.287.633.84 ± 1.20
DesulfobacteriaPre5.493.114.404.42n.d.n.d.n.d.n.d.3.98 ± 0.75
Postn.d.4.192.025.801.286.442.512.644.00 ± 1.90
BacilliPre1.002.131.541.38n.d.n.d.n.d.n.d.1.68 ± 0.40
Postn.d.3.275.5711.751.493.914.564.816.86 ± 4.39
ActinobacteriaPre1.443.070.530.53n.d.n.d.n.d.n.d.1.38 ± 1.47
Postn.d.1.284.6712.441.871.562.313.756.13 ± 5.72
ClostridiaPre0.662.530.910.86n.d.n.d.n.d.n.d.1.43 ± 0.95
Postn.d.3.741.950.122.332.021.801.661.93 ± 1.81
DesulfobulbiaPre2.703.122.983.79n.d.n.d.n.d.n.d.3.30 ± 0.43
Postn.d.2.782.431.071.092.531.950.312.09 ± 0.90
Figure A1. Pre-hurricane (August 2022) and post-hurricane (October 2022) salinity measurements in practical salinity units (PSU) for sites on the north and south transects (N5–N20 and S5–S20, respectively).
Coasts 05 00016 g0a1
Figure A2. Pre-hurricane (August 2022) and post-hurricane (Oct 2022) water temperature profiles for sites on the north and south transects (N5–N20 and S5–S20, respectively).
Coasts 05 00016 g0a2
Figure A3. Pre- (left) and post-hurricane (right) (August 2022 and October 2022, respectively) values for ammonia (NH3), nitrite (NO2), nitrate (NO3), orthophosphate (oP), silica (SiO2), total nitrogen, total phosphorous, turbidity, chromophoric-dissolved organic matter (CDOM), and chlorophyll a at surface, middle, and bottom depths. Not determined abbreviated as N.D.
Coasts 05 00016 g0a3aCoasts 05 00016 g0a3b
Figure A4. Sediment grain size composition across all sites (a) pre-hurricane and (b) post-hurricane. Not determined abbreviated as N.D.
Coasts 05 00016 g0a4
Figure A5. Sediment organic matter content (%) at each site pre-hurricane (August 2022) and post-hurricane (October 2022). Error bars are S.E.M of technical replicates (N = 3). Not determined abbreviated as N.D.
Coasts 05 00016 g0a5
Figure A6. Sediment volumetric water content (%) pre-hurricane (August 2022) and post-hurricane (October 2022). Error bars are S.E.M. of technical replicates (N = 3). Not determined abbreviated as N.D.
Coasts 05 00016 g0a6
Figure A7. Image from NASA MODIS satellite showing suspended carbonate sediment offshore and tannic, freshwater discharge from the coast on the SWFS on 30 September 2022, two days after Hurricane Ian’s landfall [62].
Coasts 05 00016 g0a7
Figure A8. Cell count (cells/mL) in the surface water pre-hurricane (August 2022) and post-hurricane (October 2022). (a) total cell counts (b) picocyanobacteria counts.
Coasts 05 00016 g0a8

References

  1. Caddy, J.F.; Carocci, F.; Coppola, S. Have Peak Fishery Production Levels Been Passed in Continental Shelf Areas? Some Perspectives Arising from Historical Trends in Production per Shelf Area. J. Northwest Atl. Fish. Sci. 1998, 23, 191–220. [Google Scholar] [CrossRef]
  2. Nelson, J.R.; Eckman, J.E.; Robertson, C.Y.; Marinelli, R.L.; Jahnke, R.A. Benthic Microalgal Biomass and Irradiance at the Sea Floor on the Continental Shelf of the South Atlantic Bight: Spatial and Temporal Variability and Storm Effects. Cont. Shelf Res. 1999, 19, 477–505. [Google Scholar] [CrossRef]
  3. Ogston, A.S.; Cacchione, D.A.; Sternberg, R.W.; Kineke, G.C. Observations of Storm and River Flood-Driven Sediment Transport on the Northern California Continental Shelf. Cont. Shelf Res. 2000, 20, 2141–2162. [Google Scholar] [CrossRef]
  4. Harris, P.T.; Heap, A.D. Cyclone-Induced Net Sediment Transport Pathway on the Continental Shelf of Tropical Australia Inferred from Reef Talus Deposits. Cont. Shelf Res. 2009, 29, 2011–2019. [Google Scholar] [CrossRef]
  5. Feehan, C.J.; Filbee-Dexter, K.; Thomsen, M.S.; Wernberg, T.; Miles, T. Ecosystem Damage by Increasing Tropical Cyclones. Commun. Earth Environ. 2024, 5, 674. [Google Scholar] [CrossRef]
  6. Rees, E.I.S.; Nicholaidou, A.; Laskaridou, P. The Effects of Storms on the Dynamics of Shallow Water Benthic Associations. In Biology of Benthic Organisms; Elsevier: Amsterdam, The Netherlands, 1977; pp. 465–474. [Google Scholar] [CrossRef]
  7. Harris, P.T.; Coleman, R. Estimating Global Shelf Sediment Mobility Due to Swell Waves. Mar. Geol. 1998, 150, 171–177. [Google Scholar] [CrossRef]
  8. Harris, P.T. On Seabed Disturbance, Marine Ecological Succession and Applications for Environmental Management: A Physical Sedimentological Perspective. In Sediments, Morphology and Sedimentary Processes on Continental Shelves; Li, M.Z., Sherwood, C.R., Hill, P.R., Eds.; Wiley: Hoboken, NJ, USA, 2012; pp. 387–404. [Google Scholar] [CrossRef]
  9. Fiorendino, J.M.; Gaonkar, C.C.; Henrichs, D.W.; Campbell, L. Drivers of Microplankton Community Assemblage Following Tropical Cyclones. J. Plankton Res. 2023, 45, 205–220. [Google Scholar] [CrossRef]
  10. Wada, A.; Midorikawa, T.; Ishii, M.; Motoi, T. Carbon System Changes in the East China Sea Induced by Typhoons Tina and Winnie in 1997. J. Geophys. Res. 2011, 116, 2010JC006701. [Google Scholar] [CrossRef]
  11. Zhang, H.; He, H.; Zhang, W.-Z.; Tian, D. Upper Ocean Response to Tropical Cyclones: A Review. Geosci. Lett. 2021, 8, 1. [Google Scholar] [CrossRef]
  12. Chen, F.; Lao, Q.; Lu, X.; Wang, C.; Chen, C.; Liu, S.; Zhou, X. A Review of the Marine Biogeochemical Response to Typhoons. Mar. Pollut. Bull. 2023, 194, 115408. [Google Scholar] [CrossRef]
  13. Chen, C.; Hsieh, C.; Cheng, Y.; Huang, W.; Chou, W.; Shiah, F.; Gong, G.; Chen, T. Effect of a Tropical Cyclone on the Pelagic Ecosystem of a Continental Shelf. Limnol. Oceanogr. 2024, 69, 2975–2990. [Google Scholar] [CrossRef]
  14. Pan, G.; Chai, F.; Tang, D.; Wang, D. Marine Phytoplankton Biomass Responses to Typhoon Events in the South China Sea Based on Physical-Biogeochemical Model. Ecol. Model. 2017, 356, 38–47. [Google Scholar] [CrossRef]
  15. Wang, T.; Liu, G.; Gao, L.; Zhu, L.; Li, D. Biological Responses to Nine Powerful Typhoons in the East China Sea. Reg. Environ. Change 2017, 17, 465–476. [Google Scholar] [CrossRef]
  16. Lao, Q.; Lu, X.; Chen, F.; Jin, G.; Chen, C.; Zhou, X.; Zhu, Q. Effects of Upwelling and Runoff on Water Mass Mixing and Nutrient Supply Induced by Typhoons: Insight from Dual Water Isotopes Tracing. Limnol. Oceanogr. 2023, 68, 284–295. [Google Scholar] [CrossRef]
  17. Chen, C.; Lao, Q.; Zhou, X.; Jin, G.; Zhu, Q.; Chen, F. Tracks of Typhoon Movement (Left and Right Sides) Control Marine Dynamics and Eco-Environment in the Coastal Bays after Typhoons: A Case Study in Zhanjiang Bay. Sci. Total Environ. 2024, 912, 168944. [Google Scholar] [CrossRef]
  18. Kurtay, G.; Prevost, H.J.; Stauffer, B.A. Pico- and Nanoplankton Communities on a near to Offshore Transect along the Continental Shelf of the Northwestern Gulf of Mexico in the Aftermath of Hurricane Harvey. Limnol. Oceanogr. 2021, 66, 2779–2796. [Google Scholar] [CrossRef]
  19. Connell, J.H. Diversity in Tropical Rain Forests and Coral Reefs: High Diversity of Trees and Corals Is Maintained Only in a Nonequilibrium State. Science 1978, 199, 1302–1310. [Google Scholar] [CrossRef]
  20. VanBlaricom, G.R. Disturbance, Predation, and Resource Allocation in a High-Energy Sublittoral Sand-Bottom Ecosystem: Experimental Analyses of Critical Structuring Processes for the Infaunal Community. Ph.D. Thesis, University of California San Diego, La Jolla, CA, USA, 1978. [Google Scholar]
  21. Thistle, D. Natural Physical Disturbances and Communities of Marine Soft Bottoms. Mar. Ecol. Prog. Ser. 1981, 6, 223–228. [Google Scholar] [CrossRef]
  22. Harris, P.T. Shelf and Deep-Sea Sedimentary Environments and Physical Benthic Disturbance Regimes: A Review and Synthesis. Mar. Geol. 2014, 353, 169–184. [Google Scholar] [CrossRef]
  23. O’Leary, J.K.; Micheli, F.; Airoldi, L.; Boch, C.; De Leo, G.; Elahi, R.; Ferretti, F.; Graham, N.A.J.; Litvin, S.Y.; Low, N.H.; et al. The Resilience of Marine Ecosystems to Climatic Disturbances. BioScience 2017, 67, 208–220. [Google Scholar] [CrossRef]
  24. Hughes, T.P. Catastrophes, Phase Shifts, and Large-Scale Degradation of a Caribbean Coral Reef. Science 1994, 265, 1547–1551. [Google Scholar] [CrossRef] [PubMed]
  25. Walsh, K.J.E.; McBride, J.L.; Klotzbach, P.J.; Balachandran, S.; Camargo, S.J.; Holland, G.; Knutson, T.R.; Kossin, J.P.; Lee, T.; Sobel, A.; et al. Tropical Cyclones and Climate Change. WIREs Clim. Change 2016, 7, 65–89. [Google Scholar] [CrossRef]
  26. Knutson, T.; Camargo, S.J.; Chan, J.C.L.; Emanuel, K.; Ho, C.-H.; Kossin, J.; Mohapatra, M.; Satoh, M.; Sugi, M.; Walsh, K.; et al. Tropical Cyclones and Climate Change Assessment: Part II: Projected Response to Anthropogenic Warming. Bull. Am. Meteorol. Soc. 2020, 101, E303–E322. [Google Scholar] [CrossRef]
  27. Ibarra-García, E.C.; Abarca-Arenas, L.G.; Ortiz, M.; Rodríguez-Zaragoza, F.A. Impact of Hurricane Dean on Chinchorro Bank Coral Reef (Western Caribbean): Temporal Variation in the Food Web Structure. Ecol. Indic. 2020, 118, 106712. [Google Scholar] [CrossRef]
  28. Keenan, S.F.; Switzer, T.S.; Knapp, A.; Weather, E.J.; Davis, J. Spatial Dynamics of the Quantity and Diversity of Natural and Artificial Hard Bottom Habitats in the Eastern Gulf of Mexico. Cont. Shelf Res. 2022, 233, 104633. [Google Scholar] [CrossRef]
  29. Walker, B.K.; Eagan, S.; Ames, C.; Brooke, S.; Keenan, S.; Baumstark, R. Shallow-Water Coral Communities Support the Separation of Marine Ecoregions on the West-Central Florida Gulf Coast. Front. Ecol. Evol. 2020, 8, 210. [Google Scholar] [CrossRef]
  30. Able, K.W. A Re-Examination of Fish Estuarine Dependence: Evidence for Connectivity between Estuarine and Ocean Habitats. Estuar. Coast. Shelf Sci. 2005, 64, 5–17. [Google Scholar] [CrossRef]
  31. Milbrandt, E.C.; Martignette, A.J.; Thompson, M.A.; Bartleson, R.D.; Phlips, E.J.; Badylak, S.; Nelson, N.G. Geospatial Distribution of Hypoxia Associated with a Karenia Brevis Bloom. Estuar. Coast. Shelf Sci. 2021, 259, 107446. [Google Scholar] [CrossRef]
  32. Medina, M.; Kaplan, D.; Milbrandt, E.C.; Tomasko, D.; Huffaker, R.; Angelini, C. Nitrogen-Enriched Discharges from a Highly Managed Watershed Intensify Red Tide (Karenia Brevis) Blooms in Southwest Florida. Sci. Total Environ. 2022, 827, 154149. [Google Scholar] [CrossRef]
  33. Urakawa, H.; Adhikari, P.L.; Urakawa, H.E.; Bartleson, R.D.; Rumbold, D.G. Microbial Assessment of the Ecological Linkage between a Red Tide of Karenia Brevis and Bottom Water Anoxia off the Coast of Fort Myers and Sanibel Island, Florida. Reg. Stud. Mar. Sci. 2024, 78, 103765. [Google Scholar] [CrossRef]
  34. Hu, C.; Muller-Karger, F.E.; Swarzenski, P.W. Hurricanes, Submarine Groundwater Discharge, and Florida’s Red Tides. Geophys. Res. Lett. 2006, 33, 2005GL025449. [Google Scholar] [CrossRef]
  35. Phlips, E.J.; Badylak, S.; Nelson, N.G.; Havens, K.E. Hurricanes, El Niño and Harmful Algal Blooms in Two Sub-Tropical Florida Estuaries: Direct and Indirect Impacts. Sci. Rep. 2020, 10, 1910. [Google Scholar] [CrossRef]
  36. Alarcon, J.; Ward, L.; Pan, K.; Gonsoroski, E.; Uejio, C.K.; Beitsch, L.; Lichtveld, M.Y.; Harville, E.W.; Sherchan, S. HABs Karenia Brevis and Pseudo-Nitzschia Pre- and Post-Hurricane Michael. J. Water Health 2023, 21, 491–500. [Google Scholar] [CrossRef]
  37. Yang, H.; Weisberg, R.H.; Niiler, P.P.; Sturges, W.; Johnson, W. Lagrangian Circulation and Forbidden Zone on the West Florida Shelf. Cont. Shelf Res. 1999, 19, 1221–1245. [Google Scholar] [CrossRef]
  38. Olascoaga, M.J.; Rypina, I.I.; Brown, M.G.; Beron-Vera, F.J.; Koçak, H.; Brand, L.E.; Halliwell, G.R.; Shay, L.K. Persistent Transport Barrier on the West Florida Shelf. Geophys. Res. Lett. 2006, 33, 2006GL027800. [Google Scholar] [CrossRef]
  39. Hampel, J.J.; McCarthy, M.J.; Reed, M.H.; Newell, S.E. Short Term Effects of Hurricane Irma and Cyanobacterial Blooms on Ammonium Cycling along a Freshwater–Estuarine Continuum in South Florida. Front. Mar. Sci. 2019, 6, 640. [Google Scholar] [CrossRef]
  40. Turley, B.D.; Karnauskas, M.; Campbell, M.D.; Hanisko, D.S.; Kelble, C.R. Relationships between Blooms of Karenia Brevis and Hypoxia across the West Florida Shelf. Harmful Algae 2022, 114, 102223. [Google Scholar] [CrossRef]
  41. Bucci, L.; Alaka, L.; Hagen, A.; Delgado, S.; Beven, J. Hurricane Ian (AL092022); National Hurricane Center Tropical Cyclone Report; National Hurricane Center: Miami, FL, USA, 2023; p. 72. Available online: https://www.nhc.noaa.gov/data/tcr/AL092022_Ian.pdf (accessed on 26 April 2025).
  42. Kirby-Smith, W.W.; Ustach, J. Resistance to Hurricane Disturbance of an Epifaunal Community on the Continental Shelf off North Carolina. Estuar. Coast. Shelf Sci. 1986, 23, 433–442. [Google Scholar] [CrossRef]
  43. Lugo-Fernández, A.; Gravois, M. Understanding Impacts of Tropical Storms and Hurricanes on Submerged Bank Reefs and Coral Communities in the Northwestern Gulf of Mexico. Cont. Shelf Res. 2010, 30, 1226–1240. [Google Scholar] [CrossRef]
  44. Landsea, C.W.; Franklin, J.L. Atlantic Hurricane Database Uncertainty and Presentation of a New Database Format. Mon. Weather Rev. 2013, 141, 3576–3592. [Google Scholar] [CrossRef]
  45. Martin, T.; Muller, J. The Geologic Record of Hurricane Irma in a Southwest Florida Back-Barrier Lagoon. Mar. Geol. 2021, 441, 106635. [Google Scholar] [CrossRef]
  46. Javaruski, J.; Adhikari, P.L.; Muller, J.; Parsons, M.L. Preservation of Brevetoxins in Southwest Florida Coastal Sediments. Harmful Algae 2022, 114, 102222. [Google Scholar] [CrossRef]
  47. Zhang, H.; Wang, J.J. Loss on Ignition Method. In Soil Test Methods from the Southeastern United States; Southern Cooperative Series; Clemson University: Clemson, SC, USA; pp. 155–157.
  48. Parada, A.E.; Needham, D.M.; Fuhrman, J.A. Every Base Matters: Assessing Small Subunit rRNA Primers for Marine Microbiomes with Mock Communities, Time Series and Global Field Samples. Environ. Microbiol. 2016, 18, 1403–1414. [Google Scholar] [CrossRef]
  49. Bolyen, E.; Rideout, J.R.; Dillon, M.R.; Bokulich, N.A.; Abnet, C.C.; Al-Ghalith, G.A.; Alexander, H.; Alm, E.J.; Arumugam, M.; Asnicar, F.; et al. Reproducible, Interactive, Scalable and Extensible Microbiome Data Science Using QIIME 2. Nat. Biotechnol. 2019, 37, 852–857. [Google Scholar] [CrossRef]
  50. Callahan, B.J.; McMurdie, P.J.; Rosen, M.J.; Han, A.W.; Johnson, A.J.A.; Holmes, S.P. DADA2: High-Resolution Sample Inference from Illumina Amplicon Data. Nat. Methods 2016, 13, 581–583. [Google Scholar] [CrossRef]
  51. Quast, C.; Pruesse, E.; Yilmaz, P.; Gerken, J.; Schweer, T.; Yarza, P.; Peplies, J.; Glöckner, F.O. The SILVA Ribosomal RNA Gene Database Project: Improved Data Processing and Web-Based Tools. Nucleic Acids Res. 2012, 41, D590–D596. [Google Scholar] [CrossRef]
  52. Robeson, M.S.; O’Rourke, D.R.; Kaehler, B.D.; Ziemski, M.; Dillon, M.R.; Foster, J.T.; Bokulich, N.A. RESCRIPt: Reproducible Sequence Taxonomy Reference Database Management. PLoS Comput. Biol. 2021, 17, e1009581. [Google Scholar] [CrossRef]
  53. R Core Team. R: A Language and Environment for Statistical Computing; R foundation for Statistical Computing: Vienna, Austria, 2022. [Google Scholar]
  54. Wheeler, B.; Torchiano, M. lmPerm: Permutation Tests for Linear Models. 2025. Available online: https://cran.r-project.org/web/packages/lmPerm/lmPerm.pdf (accessed on 26 April 2025).
  55. Hothorn, T.; Hornik, K.; Wiel, M.A.V.D.; Zeileis, A. Implementing a Class of Permutation Tests: The Coin Package. J. Stat. Soft. 2008, 28, 1–23. [Google Scholar] [CrossRef]
  56. McMurdie, P.J.; Holmes, S. Phyloseq: An R Package for Reproducible Interactive Analysis and Graphics of Microbiome Census Data. PLoS ONE 2013, 8, e61217. [Google Scholar] [CrossRef]
  57. Li, D. hillR: Taxonomic, Functional, and Phylogenetic Diversity and Similarity through Hill Numbers. JOSS 2018, 3, 1041. [Google Scholar] [CrossRef]
  58. Oksanen, J.; Simpson, G.L.; Blanchet, F.G.; Kindt, R.; Legendre, P.; Minchin, P.R.; O’Hara, R.B.; Solymos, P.; Stevens, M.H.H.; Szoecs, E.; et al. Vegan: Community Ecology Package. R Package Version 2001, 2, 321–326. [Google Scholar] [CrossRef]
  59. Wickham, H. Data Analysis. In Ggplot2: Elegant Graphics for Data Analysis; Wickham, H., Ed.; Springer International Publishing: Berlin/Heidelberg, Germany, 2016; pp. 189–201. [Google Scholar] [CrossRef]
  60. Weisberg, R.H.; Zheng, L. Hurricane Storm Surge Simulations for Tampa Bay. Estuaries Coasts 2006, 29, 899–913. [Google Scholar] [CrossRef]
  61. Pasch, R.J.; Brown, D.P.; Blake, E.S. Hurricane Charley (AL032004). In National Hurricane Center Tropical Cyclone Report; National Hurricane Center: Miami, FL, USA, 2004; p. 23. Available online: https://www.nhc.noaa.gov/data/tcr/AL032004_Charley.pdf (accessed on 9 May 2025).
  62. Pasch, R.J.; Blake, E.S.; Cobb III, H.D.; Roberts, D.P. Hurricane Wilma (AL252005); National Hurricane Center: Miami, FL, USA, 2006; p. 27. Available online: https://www.nhc.noaa.gov/data/tcr/AL252005_Wilma.pdf (accessed on 9 May 2025).
  63. Cangialosi, J.P.; Latto, A.S.; Berg, R. Hurricane Irma (AL112017). In National Hurricane Center Tropical Cyclone Report; National Hurricane Center: Miami, FL, USA, 2021; p. 111. Available online: https://www.nhc.noaa.gov/data/tcr/AL112017_Irma.pdf (accessed on 26 April 2025).
  64. Bregy, J.C.; Wallace, D.J.; Totten, R.L.; Cruz, V.J. 2500-Year Paleotempestological Record of Intense Storms for the Northern Gulf of Mexico, United States. Mar. Geol. 2018, 396, 26–42. [Google Scholar] [CrossRef]
  65. Hansen, K. Watercolor seas in the wake of Hurricane Ian. NASA Earth Observatory. Available online: https://earthobservatory.nasa.gov/images/150435/watercolor-seas-in-the-wake-of-hurricane-ian (accessed on 26 April 2025).
  66. Rumbold, D.G.; Doering, P.H. Water Quality and Source of Freshwater Discharge to the Caloosahatchee Estuary, Florida: 2009–2018. Fla. Sci. 2020, 83, 1–20. [Google Scholar]
  67. Reidenbach, L.; Bartleson, R.; Depaolis, M. Caloosahatchee and Estuary Conditions Report September 20–26, 2022; Memorandum; Sanibel Captiva Conservation Foundation: Sanibel, FL, USA, 2022; p. 3. Available online: https://sccf.org/wp-content/uploads/2023/06/Sept-27-2022.pdf (accessed on 26 April 2025).
  68. Reidenbach, L.; Bartleson, R.; Depaolis, M. Caloosahatchee and Estuary Conditions Report October 18-24, 2022; Caloosahatchee & Estuary Conditions Report; Memorandum; Sanibel Captiva Conservation Foundation: Sanibel, Florida, USA, 2022; p. 3. Available online: https://sccf.org/wp-content/uploads/2023/06/Oct-25-2022.pdf (accessed on 26 April 2025).
  69. Price, J.F. Upper Ocean Response to a Hurricane. J. Phys. Oceanogr. 1981, 11, 153–175. [Google Scholar] [CrossRef]
  70. D’Asaro, E.A.; Sanford, T.B.; Niiler, P.P.; Terrill, E.J. Cold Wake of Hurricane Frances. Geophys. Res. Lett. 2007, 34, 2007GL030160. [Google Scholar] [CrossRef]
  71. Monaldo, F.M.; Sikora, T.D.; Babin, S.M.; Sterner, R.E. Satellite Imagery of Sea Surface Temperature Cooling in the Wake of Hurricane Edouard (1996). Mon. Wea. Rev. 1997, 125, 2716–2721. [Google Scholar] [CrossRef]
  72. Avila-Alonso, D.; Baetens, J.M.; Cardenas, R.; De Baets, B. Oceanic Response to Hurricane Irma (2017) in the Exclusive Economic Zone of Cuba and the Eastern Gulf of Mexico. Ocean Dyn. 2020, 70, 603–619. [Google Scholar] [CrossRef]
  73. Le Hénaff, M.; Domingues, R.; Halliwell, G.; Zhang, J.A.; Kim, H.; Aristizabal, M.; Miles, T.; Glenn, S.; Goni, G. The Role of the Gulf of Mexico Ocean Conditions in the Intensification of Hurricane Michael (2018). JGR Ocean. 2021, 126, e2020JC016969. [Google Scholar] [CrossRef]
  74. Tomasko, D.A.; Anastasiou, C.; Kovach, C. Dissolved Oxygen Dynamics in Charlotte Harbor and Its Contributing Watershed, in Response to Hurricanes Charley, Frances, and Jeanne—Impacts and Recovery. Estuaries Coasts 2006, 29, 932–938. [Google Scholar] [CrossRef]
  75. Montagna, P. Benthic Infauna Are Resistant and Resilient to Hurricane Disturbance. Mar. Ecol. Prog. Ser. 2023, 707, 1–13. [Google Scholar] [CrossRef]
  76. Steichen, J.L.; Labonté, J.M.; Windham, R.; Hala, D.; Kaiser, K.; Setta, S.; Faulkner, P.C.; Bacosa, H.; Yan, G.; Kamalanathan, M.; et al. Microbial, Physical, and Chemical Changes in Galveston Bay Following an Extreme Flooding Event, Hurricane Harvey. Front. Mar. Sci. 2020, 7, 186. [Google Scholar] [CrossRef]
  77. Acker, J.; Lyon, P.; Hoge, F.; Shen, S.; Roffer, M.; Gawlikowski, G. Interaction of Hurricane Katrina with Optically Complex Water in the Gulf of Mexico: Interpretation Using Satellite-Derived Inherent Optical Properties and Chlorophyll Concentration. IEEE Geosci. Remote Sens. Lett. 2009, 6, 209–213. [Google Scholar] [CrossRef]
  78. Da Silva, C.E.; Castelao, R.M. Mississippi River Plume Variability in the Gulf of Mexico from SMAP and MODIS-Aqua Observations. JGR Ocean. 2018, 123, 6620–6638. [Google Scholar] [CrossRef]
  79. Yan, G.; Labonté, J.M.; Quigg, A.; Kaiser, K. Hurricanes Accelerate Dissolved Organic Carbon Cycling in Coastal Ecosystems. Front. Mar. Sci. 2020, 7, 248. [Google Scholar] [CrossRef]
  80. Gilbes, F.; Armstrong, R.A.; Webb, R.M.T.; Müller-Krager, F.E. SeaWiFS Helps Assess Hurricane Impact on Phytoplankton in Caribbean Sea. EoS Trans. 2001, 82, 529–533. [Google Scholar] [CrossRef]
  81. Anglès, S.; Jordi, A.; Campbell, L. Responses of the Coastal Phytoplankton Community to Tropical Cyclones Revealed by High-frequency Imaging Flow Cytometry. Limnol. Oceanogr. 2015, 60, 1562–1576. [Google Scholar] [CrossRef]
  82. Huang, S.-M.; Oey, L. Right-side Cooling and Phytoplankton Bloom in the Wake of a Tropical Cyclone. JGR Ocean. 2015, 120, 5735–5748. [Google Scholar] [CrossRef]
  83. McGee, L.; He, R. Mesoscale and Submesoscale Mechanisms behind Asymmetric Cooling and Phytoplankton Blooms Induced by Hurricanes: A Comparison between an Open Ocean Case and a Continental Shelf Sea Case. Ocean Dyn. 2018, 68, 1443–1456. [Google Scholar] [CrossRef]
  84. Chapman, P.; DiMarco, S.F.; Knap, A.H.; Quigg, A.; Walker, N.D. The Effects of Hurricane Harvey on Texas Coastal-Zone Chemistry. Ocean Sci. 2023, 19, 209–227. [Google Scholar] [CrossRef]
  85. Stedmon, C.A.; Markager, S.; Tranvik, L.; Kronberg, L.; Slätis, T.; Martinsen, W. Photochemical Production of Ammonium and Transformation of Dissolved Organic Matter in the Baltic Sea. Mar. Chem. 2007, 104, 227–240. [Google Scholar] [CrossRef]
  86. Burkhardt, B.G.; Watkins-Brandt, K.S.; Defforey, D.; Paytan, A.; White, A.E. Remineralization of Phytoplankton-Derived Organic Matter by Natural Populations of Heterotrophic Bacteria. Mar. Chem. 2014, 163, 1–9. [Google Scholar] [CrossRef]
  87. Moran, M.A.; Kujawinski, E.B.; Stubbins, A.; Fatland, R.; Aluwihare, L.I.; Buchan, A.; Crump, B.C.; Dorrestein, P.C.; Dyhrman, S.T.; Hess, N.J.; et al. Deciphering Ocean Carbon in a Changing World. Proc. Natl. Acad. Sci. USA 2016, 113, 3143–3151. [Google Scholar] [CrossRef] [PubMed]
  88. Hemsley, V.; Füssel, J.; Duret, M.T.; Rayne, R.R.; Iversen, M.H.; Henson, S.A.; Sanders, R.; Lam, P.; Trimmer, M. Suspended Particles Are Hotspots of Microbial Remineralization in the Ocean’s Twilight Zone. Deep Sea Res. Part II Top. Stud. Oceanogr. 2023, 212, 105339. [Google Scholar] [CrossRef]
  89. Smil, V. Global Material Cycles and Energy. In Encyclopedia of Energy; Elsevier: Amsterdam, The Netherlands, 2004; pp. 23–32. [Google Scholar] [CrossRef]
  90. Ward, B.B. Nitrification in Marine Systems. In Nitrogen in the Marine Environment; Elsevier: Amsterdam, The Netherlands, 2008; pp. 199–261. [Google Scholar] [CrossRef]
  91. Carlson, C.A.; Hansell, D.A. DOM Sources, Sinks, Reactivity, and Budgets. In Biogeochemistry of Marine Dissolved Organic Matter; Elsevier: Amsterdam, The Netherlands, 2015; pp. 65–126. [Google Scholar] [CrossRef]
  92. Lavrentyev, P.; Gardner, W.; Johnson, J. Cascading Trophic Effects on Aquatic Nitrification: Experimental Evidence and Potential Implications. Aquat. Microb. Ecol. 1997, 13, 161–175. [Google Scholar] [CrossRef]
  93. Heiss, E.M.; Fulweiler, R.W. Coastal Water Column Ammonium and Nitrite Oxidation Are Decoupled in Summer. Estuar. Coast. Shelf Sci. 2016, 178, 110–119. [Google Scholar] [CrossRef]
  94. Wang, P.; Hu, B.; Wang, C.; Lei, Y. Phosphorus Adsorption and Sedimentation by Suspended Sediments from Zhushan Bay, Taihu Lake. Env. Sci. Pollut. Res. 2015, 22, 6559–6569. [Google Scholar] [CrossRef]
  95. Jiang, C.; Cao, R.; Lao, Q.; Chen, F.; Zhang, S.; Bian, P. Typhoon Merbok Induced Upwelling Impact on Material Transport in the Coastal Northern South China Sea. PLoS ONE 2020, 15, e0228220. [Google Scholar] [CrossRef]
  96. Penna, A.; Magnani, M.; Fenoglio, I.; Fubini, B.; Cerrano, C.; Giovine, M.; Bavestrello, G. Marine Diatom Growth on Different Forms of Particulate Silica: Evidence of Cell/Particle Interaction. Aquat. Microb. Ecol. 2003, 32, 299–306. [Google Scholar] [CrossRef]
  97. Nodine, E.R.; Gaiser, E.E. Seasonal Differences and Response to a Tropical Storm Reflected in Diatom Assemblage Changes in a Southwest Florida Watershed. Ecol. Indic. 2015, 57, 139–148. [Google Scholar] [CrossRef]
  98. Babin, S.M.; Carton, J.A.; Dickey, T.D.; Wiggert, J.D. Satellite Evidence of Hurricane-induced Phytoplankton Blooms in an Oceanic Desert. J. Geophys. Res. 2004, 109, C03043. [Google Scholar] [CrossRef]
  99. Hanshaw, M.N.; Lozier, M.S.; Palter, J.B. Integrated Impact of Tropical Cyclones on Sea Surface Chlorophyll in the North Atlantic. Geophys. Res. Lett. 2008, 35, L01601. [Google Scholar] [CrossRef]
  100. Zhang, S.; Xie, L.; Hou, Y.; Zhao, H.; Qi, Y.; Yi, X. Tropical Storm-Induced Turbulent Mixing and Chlorophyll-a Enhancement in the Continental Shelf Southeast of Hainan Island. J. Mar. Syst. 2014, 129, 405–414. [Google Scholar] [CrossRef]
  101. Avila-Alonso, D.; Baetens, J.M.; Cardenas, R.; De Baets, B. The Impact of Hurricanes on the Oceanographic Conditions in the Exclusive Economic Zone of Cuba. Remote Sens. Environ. 2019, 233, 111339. [Google Scholar] [CrossRef]
  102. Oey, L.-Y.; Ezer, T.; Wang, D.-P.; Fan, S.-J.; Yin, X.-Q. Loop Current Warming by Hurricane Wilma. Geophys. Res. Lett. 2006, 33, L08613. [Google Scholar] [CrossRef]
  103. Martínez-López, B.; Zavala-Hidalgo, J. Seasonal and Interannual Variability of Cross-Shelf Transports of Chlorophyll in the Gulf of Mexico. J. Mar. Syst. 2009, 77, 1–20. [Google Scholar] [CrossRef]
  104. Son, Y.B.; Gardner, W.D.; Richardson, M.J.; Ishizaka, J.; Ryu, J.-H.; Kim, S.-H.; Lee, S.H. Tracing Offshore Low-Salinity Plumes in the Northeastern Gulf of Mexico during the Summer Season by Use of Multispectral Remote-Sensing Data. J. Ocean. 2012, 68, 743–760. [Google Scholar] [CrossRef]
  105. Muller-Karger, F.E.; Smith, J.P.; Werner, S.; Chen, R.; Roffer, M.; Liu, Y.; Muhling, B.; Lindo-Atichati, D.; Lamkin, J.; Cerdeira-Estrada, S.; et al. Natural Variability of Surface Oceanographic Conditions in the Offshore Gulf of Mexico. Prog. Oceanogr. 2015, 134, 54–76. [Google Scholar] [CrossRef]
  106. Morey, S.L.; Martin, P.J.; O’Brien, J.J.; Wallcraft, A.A.; Zavala-Hidalgo, J. Export Pathways for River Discharged Fresh Water in the Northern Gulf of Mexico. J. Geophys. Res. 2003, 108, 3303. [Google Scholar] [CrossRef]
  107. Morey, S.L.; Schroeder, W.W.; O’Brien, J.J.; Zavala-Hidalgo, J. The Annual Cycle of Riverine Influence in the Eastern Gulf of Mexico Basin. Geophys. Res. Lett. 2003, 30, 1867. [Google Scholar] [CrossRef]
  108. Riley, S.J.; Bryant, T. The Relationship between Settling Velocity and Grainsize Values. J. Geol. Soc. Aust. 1979, 26, 313–315. [Google Scholar] [CrossRef]
  109. Bender, E.A.; Case, T.J.; Gilpin, M.E. Perturbation Experiments in Community Ecology: Theory and Practice. Ecology 1984, 65, 1–13. [Google Scholar] [CrossRef]
  110. Finkl, C.W.; Benedet, L.; Andrews, J.L.; Suthard, B.; Locker, S.D. Sediment Ridges on the West Florida Inner Continental Shelf: Sand Resources for Beach Nourishment. J. Coast. Res. 2007, 231, 143–159. [Google Scholar] [CrossRef]
  111. Harrison, S.E.; Locker, S.D.; Hine, A.C.; Edwards, J.H.; Naar, D.F.; Twichell, D.C.; Mallinson, D.J. Sediment-Starved Sand Ridges on a Mixed Carbonate/Siliciclastic Inner Shelf off West-Central Florida. Mar. Geol. 2003, 200, 171–194. [Google Scholar] [CrossRef]
  112. Blair, S.M.; McIntosh, T.L.; Mostkoff, B.J. Impacts of Hurricane Andrew on the Offshore Reef Systems of Central and Northern Dade County, Florida. Bull. Mar. Sci. 1994, 54, 961–973. [Google Scholar]
  113. Fourqurean, J.W.; Rutten, L.M. The Impact of Hurricane Georges on Soft-Bottom, Back Reef Communities: Site- and Species-Specific Effects in South Florida Seagrass Beds. Bull. Mar. Sci. 2004, 75, 239–257. [Google Scholar]
  114. Krause, J.R.; Lopes, C.C.; Wilson, S.S.; Boyer, J.N.; Briceño, H.O.; Fourqurean, J.W. Status and Trajectories of Soft-Bottom Benthic Communities of the South Florida Seascape Revealed by 25 Years of Seagrass and Water Quality Monitoring. Estuaries Coasts 2023, 46, 477–493. [Google Scholar] [CrossRef]
  115. Phillips, N.W.; Gettleson, D.A.; Spring, K.D. Benthic Biological Studies of the Southwest Florida Shelf. Am. Zool. 1990, 30, 65–75. [Google Scholar] [CrossRef]
  116. Bainbridge, Z.T.; Wolanski, E.; Álvarez-Romero, J.G.; Lewis, S.E.; Brodie, J.E. Fine Sediment and Nutrient Dynamics Related to Particle Size and Floc Formation in a Burdekin River Flood Plume, Australia. Mar. Pollut. Bull. 2012, 65, 236–248. [Google Scholar] [CrossRef]
  117. Avnimelech, Y.; Ritvo, G.; Meijer, L.E.; Kochba, M. Water Content, Organic Carbon and Dry Bulk Density in Flooded Sediments. Aquac. Eng. 2001, 25, 25–33. [Google Scholar] [CrossRef]
  118. Goni, M.A.; Alleau, Y.; Corbett, R.; Walsh, J.P.; Mallinson, D.; Allison, M.A.; Gordon, E.; Petsch, S.; Dellapenna, T.M. The Effects of Hurricanes Katrina and Rita on the Seabed of the Louisiana Shelf. TSR 2007, 5, 4–9. [Google Scholar] [CrossRef]
  119. Cong, S.; Wu, X.; Ge, J.; Bi, N.; Li, Y.; Lu, J.; Wang, H. Impact of Typhoon Chan-Hom on Sediment Dynamics and Morphological Changes on the East China Sea Inner Shelf. Mar. Geol. 2021, 440, 106578. [Google Scholar] [CrossRef]
  120. Meyneng, M.; Lemonnier, H.; Le Gendre, R.; Plougoulen, G.; Antypas, F.; Ansquer, D.; Serghine, J.; Schmitt, S.; Siano, R. Subtropical Coastal Microbiome Variations Due to Massive River Runoff after a Cyclonic Event. Environ. Microbiome 2024, 19, 10. [Google Scholar] [CrossRef]
  121. Edwards, J.L.; Smith, D.L.; Connolly, J.; McDonald, J.E.; Cox, M.J.; Joint, I.; Edwards, C.; McCarthy, A.J. Identification of Carbohydrate Metabolism Genes in the Metagenome of a Marine Biofilm Community Shown to Be Dominated by Gammaproteobacteria and Bacteroidetes. Genes 2010, 1, 371–384. [Google Scholar] [CrossRef]
  122. Bianucci, L.; Balaguru, K.; Smith, R.W.; Leung, L.R.; Moriarty, J.M. Contribution of Hurricane-Induced Sediment Resuspension to Coastal Oxygen Dynamics. Sci. Rep. 2018, 8, 15740. [Google Scholar] [CrossRef]
  123. Garrison, C.E.; Roozbehi, S.; Mitra, S.; Corbett, D.R.; Field, E.K. Coastal Microbial Communities Disrupted during the 2018 Hurricane Season in Outer Banks, North Carolina. Front. Microbiol. 2022, 13, 816573. [Google Scholar] [CrossRef]
  124. Morris, R.M.; Rappé, M.S.; Connon, S.A.; Vergin, K.L.; Siebold, W.A.; Carlson, C.A.; Giovannoni, S.J. SAR11 Clade Dominates Ocean Surface Bacterioplankton Communities. Nature 2002, 420, 806–810. [Google Scholar] [CrossRef] [PubMed]
  125. Luo, H.; Csűros, M.; Hughes, A.L.; Moran, M.A. Evolution of Divergent Life History Strategies in Marine Alphaproteobacteria. mBio 2013, 4, e00373-13. [Google Scholar] [CrossRef]
  126. Duran, R.; Bielen, A.; Paradžik, T.; Gassie, C.; Pustijanac, E.; Cagnon, C.; Hamer, B.; Vujaklija, D. Exploring Actinobacteria Assemblages in Coastal Marine Sediments under Contrasted Human Influences in the West Istria Sea, Croatia. Environ. Sci. Pollut. Res. 2015, 22, 15215–15229. [Google Scholar] [CrossRef]
  127. Wang, F.-Y.; Liu, M.-Y. Microbial Community Diversity of Coral Reef Sediments on Liuqiu Island, Southwestern Taiwan. JMSE 2023, 11, 85. [Google Scholar] [CrossRef]
  128. Bianchi, T.S. The Role of Terrestrially Derived Organic Carbon in the Coastal Ocean: A Changing Paradigm and the Priming Effect. Proc. Natl. Acad. Sci. USA 2011, 108, 19473–19481. [Google Scholar] [CrossRef] [PubMed]
  129. Fernandes, T.A.R.; Silveira, W.B.D.; Passos, F.M.L.; Zucchi, T.D. Laccases from Actinobacteria—What We Have and What to Expect. AiM 2014, 4, 285–296. [Google Scholar] [CrossRef]
  130. Goecke, F.; Thiel, V.; Wiese, J.; Labes, A.; Imhoff, J.F. Algae as an Important Environment for Bacteria – Phylogenetic Relationships among New Bacterial Species Isolated from Algae. Phycologia 2013, 52, 14–24. [Google Scholar] [CrossRef]
  131. Lage, O.M.; Bondoso, J. Planctomycetes and Macroalgae, a Striking Association. Front. Microbiol. 2014, 5, 267. [Google Scholar] [CrossRef]
  132. McKew, B.A.; Dumbrell, A.J.; Taylor, J.D.; McGenity, T.J.; Underwood, G.J.C. Differences between Aerobic and Anaerobic Degradation of Microphytobenthic Biofilm-Derived Organic Matter within Intertidal Sediments. FEMS Microbiol. Ecol. 2013, 84, 495–509. [Google Scholar] [CrossRef]
  133. Dupont, J.; Hallock, P.; Jaap, W. Ecological Impacts of the 2005 Red Tide on Artificial Reef Epibenthic Macroinvertebrate and Fish Communities in the Eastern Gulf of Mexico. Mar. Ecol. Prog. Ser. 2010, 415, 189–200. [Google Scholar] [CrossRef]
  134. Stys, B.; Foster, T.; Fuentes, M.; Glazer, B.; Karish, K.; Montero, N.; Reece, J. Climate Change Impacts on Florida’s Biodiversity and Ecology. In Florida’s Climate: Changes, Variations, & Impacts; Florida Climate Institute: Gainesville, FL, USA, 2017. [Google Scholar] [CrossRef]
Figure 1. Sampling sites along the SWFS in relation to the track of Hurricane Ian. Site symbols include a letter indicating transect (N = North, S = South) and a number indicating the approximate depth in meters at the site. Sites that had extensive hard-bottom substrate during the initial survey are indicated by green circles, and sites that were predominantly unconsolidated sediments when first surveyed are indicated by brown triangles. Hurricane Ian track and intensity data are from the Atlantic hurricane database, HURDAT2 [44].
Coasts 05 00016 g001
Figure 2. Pre-hurricane (August 2022) and post-hurricane (October 2022) dissolved oxygen (DO) concentrations for sites on the north and south transects (N5–N20 and S5–S20, respectively).
Coasts 05 00016 g002
Figure 3. Pre- and post-hurricane (August 2022 and October 2022) concentrations for (a) ammonia (NH3) (b) nitrite (NO2) (c) nitrate (NO3) (d) orthophosphate (PO43−) (e) silica (SiO2) (f) total nitrogen (g) total phosphorous (h) chromophoric -dissolved organic matter (CDOM) (i) turbidity and (j) chlorophyll a averaged across three depths (surface, middle, bottom) for each site along the north transect (N5–N20) and south transect (S5–S20). Error bars are S.E.M. (N = 3).
Coasts 05 00016 g003aCoasts 05 00016 g003b
Figure 4. Benthic cover composition by site and date as determined by video monitoring. Pre-hurricane and post-hurricane dates were August 2022 and October 2022, respectively. Error bars are S.E.M. (N = 20). (a) Hard bottom cover. (b) Total biotic cover.
Coasts 05 00016 g004
Figure 5. Benthic cover composition by site, date, and biotic category as determined by video monitoring. Pre-hurricane (a) and post-hurricane (b) dates were August 2022 and October 2022, respectively. CGA = Calcareous Green Algae.
Coasts 05 00016 g005
Figure 6. Non-metric multidimensional scaling (NMDS) of microbial community samples taken from all sites pre-hurricane (August 2022, blue marks) and post-hurricane (October 2022, red marks). Ordination is based on Bray-Curtis dissimilarity. Panel (a) surface water microbial community NMDS (stress = 0.088). Panel (b) surface sediment microbial community NMDS (stress = 0.138).
Coasts 05 00016 g006
Figure 7. Microbial relative abundance by taxonomic class, sample type (surface water or sediment), and date for all sites sampled. Pre-hurricane and post-hurricane dates were August 2022 and October 2022, respectively. Each point represents a sample. Black points represent the median relative abundance of each class pre- and post-hurricane, and the black line represents the inter quartile range (IQR). (a) Top 10 taxa at the class level in surface water microbial communities. (b) Top 12 taxa at the class level in surface sediment microbial communities.
Coasts 05 00016 g007
Disclaimer/Publisher’s Note: The statements, opinions and data contained in all publications are solely those of the individual author(s) and contributor(s) and not of MDPI and/or the editor(s). MDPI and/or the editor(s) disclaim responsibility for any injury to people or property resulting from any ideas, methods, instructions or products referred to in the content.

