Article

Enhancing Coastal Management Through the Modified Fuzzy DEMATEL Approach and Power Dynamics Consideration

by
Mohsen Pourmohammad Shahvar
* and
Giovanni Marsella
Dipartimento di Fisica e Chimica “Emilio Segrè”, Università degli Studi di Palermo, 90128 Palermo, Italy
*
Author to whom correspondence should be addressed.
Coasts 2025, 5(2), 15; https://doi.org/10.3390/coasts5020015
Submission received: 25 March 2025 / Revised: 28 April 2025 / Accepted: 29 April 2025 / Published: 2 May 2025

Abstract

:
This study enhances coastal vulnerability assessment by introducing a Modified Fuzzy DEMATEL technique that incorporates socio-ecological and power dynamic considerations. The novelty of the study lies in integrating causal analysis with a participatory vulnerability framework tailored to coastal management. By analyzing multiple natural and socio-economic parameters, the results identify land use and land cover as the most influential factors, highlighting a shift toward socio-economic prioritization. The model also acknowledges limitations due to reliance on expert judgment and the absence of ground-truth validation. Our findings emphasize the need for location-specific vulnerability models rather than universal frameworks, offering insights for future participatory and evidence-based coastal management strategies.

1. Introduction

Coastal vulnerability refers to the susceptibility of coastal areas to natural, socio-economic, and anthropogenic hazards [1,2]. These regions, critical for global sustainability [3], are increasingly exposed to multi-hazard risks due to factors such as proximity to the sea, high population density, and intense economic activity [4,5,6]. Climate change exacerbates these risks, underscoring the urgent need for adaptive management strategies [7,8]. Effective planning, preparedness, and mitigation depend heavily on comprehensive coastal vulnerability assessments, which provide essential insights for risk reduction and sustainable development [9].
Comprehensive coastal vulnerability assessments, which evaluate socio-ecological systems’ exposure to multiple hazards, are critical for informed decision-making and the development of resilient strategies [10]. Beyond supporting sustainable development [11], these assessments must also account for complex governance structures. Traditional approaches, while advancing in technical scope [12], often overlook the influence of power dynamics and political processes that shape vulnerability patterns and management decisions [13]. Addressing these limitations requires moving beyond conventional methodologies toward more participatory and politically aware frameworks.
Coastal management inherently involves multiple stakeholders, whose competing interests and power asymmetries strongly influence vulnerability assessments and decision-making processes [14,15,16,17,18]. A comprehensive assessment must therefore integrate the role of governance and political structures. Participatory approaches, which actively engage local communities and stakeholders, are essential to capture diverse perspectives and lived experiences of coastal hazards [19,20]. Incorporating these elements ensures that vulnerability assessments more accurately reflect the realities faced by affected populations.
Analyzing existing governance structures and policy frameworks is crucial for addressing power dynamics in vulnerability assessments [21,22]. Navigating these complexities enables the development of more equitable and effective coastal management strategies. Moreover, coastal vulnerability inherently involves human judgments about exposure risks across natural and socio-economic systems [23,24]. Accurate quantification requires a comprehensive understanding of the diverse threats and risk factors affecting coastal populations.
Despite advancements in coastal vulnerability modeling, limited research systematically addresses the interplay of socio-economic variables, power structures, and causal dynamics in coastal risk assessments. This study addresses this gap by integrating Modified Fuzzy DEMATEL analysis with a participatory, location-specific framework.
Coastal vulnerability assessments vary widely in the number and type of variables considered. Bryan et al. [24] employed three main variables to identify high-risk areas in Europe, while Williams et al. [25,26] incorporated 54 variables to assess vulnerabilities in Devon and Cornwall. Kantamaneni [27] emphasized the importance of integrating natural, socio-economic, and man-made hazards in vulnerability assessments. Similarly, Ng et al. [28] assessed island vulnerability based on geological, environmental, and land use parameters.
Studies by Koroglu et al. [29,30], Mahmood et al. [31], and Sekovski et al. [32] highlight the diversity of variables employed in coastal vulnerability indices. These include geophysical factors such as sea-level rise, geomorphology, coastal slope, regional elevation, tidal amplitude, salinity, and shoreline dynamics. Mahmood et al. [31] additionally considered mangrove development in estuarine contexts. Such variability underscores the need for flexible and context-sensitive assessment frameworks.
Baig et al. [33] analyzed coastal vulnerability by considering variables such as geology, geomorphology, slope, shoreline change, sea-level rise, and tidal amplitude. Similarly, Sathiya Bama et al. [34] calculated a coastal vulnerability index using seven biogeophysical indicators, including shoreline change, coastal ecosystems, wind and wave exposure, sea-level rise, and relief.
Recognizing the complexity of coastal environments, recent research emphasizes the need to evaluate multiple variables simultaneously. Multivariate Assessment (MVA), based on multivariate statistical principles, facilitates the simultaneous observation and analysis of diverse vulnerability factors. Such approaches allow for flexible and context-specific frameworks suited to the varied conditions of coastal ecosystems and communities.
Building on these concepts, Huynh et al. [32] introduced a hybrid method combining fuzzy logic and the Decision-Making Trial and Evaluation Laboratory (DEMATEL) to analyze causal relationships within coastal urban projects. Their study demonstrated that Fuzzy-DEMATEL can effectively rank cause-and-effect relationships among strategic goals and success indicators.
Inspired by this approach, the present study applies a Modified Fuzzy DEMATEL framework to assess multi-hazard coastal vulnerability. The model integrates a broad range of data sources, including satellite imagery and climate projections, to offer a comprehensive and adaptable tool for vulnerability assessment across diverse coastal contexts.

2. Materials and Methods

2.1. Coastal Sensitivity Analysis Variables

Guided by a comprehensive literature review, this study strategically identifies 20 natural–physical variables and 5 socio-economic variables to assess coastal vulnerability. Within the realm of natural–physical factors, a spectrum of parameters including sea-level rise, storm exposure, coastal inundation, and storm surge intertwine with rock type, coast shield dynamics, and the pivotal role of coast protection via mangrove ecosystems. Additional variables encompass geological intricacies, morphological attributes, coastal slope gradients, regional elevation, shoreline change rates, and the intricate interplay of wind, wave exposure, wave height, tidal amplitude, bathymetry, salinity levels, sand dune ecosystems, relief, and the delicate tapestry of coastal ecosystems. Complementing these parameters, socio-economic dimensions infiltrate the analysis, encompassing household waste dynamics, nuclear lesions, population dynamics, socio-economic improvement trajectories, and the evolving intricacies of land use and land cover.

2.2. Fuzzy DEMATEL Approach in Coastal Vulnerability

In the realm of coastal hazard vulnerability assessments, the strategic utilization of multi-criteria indicators stands out as a crucial element supporting preventive management strategies [33,34]. These indicators help evaluate various factors and risks, enabling informed decision-making for coastal area protection. Multi-Criteria Decision Analysis (MCDA) is recognized as an effective approach in addressing coastal vulnerabilities [35]. MCDA encompasses concepts, models, and methods that assist decision-makers in evaluating, ranking, and selecting variables based on multiple criteria [36]. To enhance decision-making in coastal vulnerability assessments, a decision support system is considered highly effective [35,36,37]. This system enhances our comprehension of intricate relationships among natural, social, and economic variables, leading to more informed and robust decisions. However, navigating the multi-criteria decision-making process in this context is not without challenges, such as uncertainties, intricate indicators, and potential inaccuracies in human cognitive processes [38]. These challenges highlight the importance of addressing uncertainty and complexity in the decision-making process.
Acknowledging the inherent limitations of the DEMATEL method, particularly in uncertain environments and for group or multi-criteria decision-making scenarios, a specialized Fuzzy DEMATEL method has been proposed [39,40]. This advanced approach incorporates fuzzy theory and fuzzy language scales, introducing an additional layer of nuance to the decision-making process. The implementation involves gathering expert opinions, meticulously designing fuzzy language scales, conducting precise calculations of pairwise comparison matrices, deriving nuanced average opinion matrices, normalizing matrices to ensure consistency, obtaining final matrices, and ultimately creating causal relationship diagrams. This intricate process not only addresses the limitations of the traditional DEMATEL method in uncertain scenarios but also enhances decision-making by incorporating fuzzy logic to navigate the complexities of coastal vulnerability assessments.

2.3. Fuzzy DEMATEL Implementation

2.3.1. Formation of Fuzzy Direct Relation Matrix

To identify the pattern of relationships between n criteria, a n × n matrix (A) is first formed. The effect of the element in each row on the elements in the column in this matrix is entered as a fuzzy number. Table 1 shows the direct relation matrix, which is the pairwise comparison. Table 2 shows the fuzzy spectrum used in the model.

2.3.2. Normalization of Fuzzy Direct Relation Matrix

Normalization is achieved through the utilization of the subsequent formula [32,39,41]:
X = K × A
where
K = 1 / max 1     i     j n 1 a i j i , j = 1,2 , 3 , , n
See Table 3.

2.3.3. Calculation of Fuzzy Total Relation Matrix

  • Calculate the inverse of matrix
X: X (−1)
2.
Subtract the inverse from the unit matrix,
I: I − X(−1)
3.
Multiply the normal matrix X with the resulting matrix from step 2:
X × (I − X) (−1)
All the calculated matrices in Supplementary Document can be seen (Tables S4–S16).

2.3.4. Defuzzification of Total Relations Matrix Values

Table S17 displays the defuzzified values of the total relations matrix, obtained using Equation (5).

2.3.5. Threshold Calculations

During this process, any values in the definite total relation matrix that are below the mean of the total relation matrix are set to zero, meaning that the causal relationship is not considered. Table S18 displays the total relation matrix with the omitted values below the threshold. The causal relationships between the elements are then plotted based on Table S18. In the context of Fuzzy DEMATEL analysis, the threshold value determines which causal relationships are considered significant. Following established practices, this study adopts the mean value of the total relation matrix (0.096462486) as the threshold. This approach balances the need to retain meaningful relationships while eliminating weaker, noise-driven connections, ensuring clarity and interpretability in the causal diagram [39,40,41].

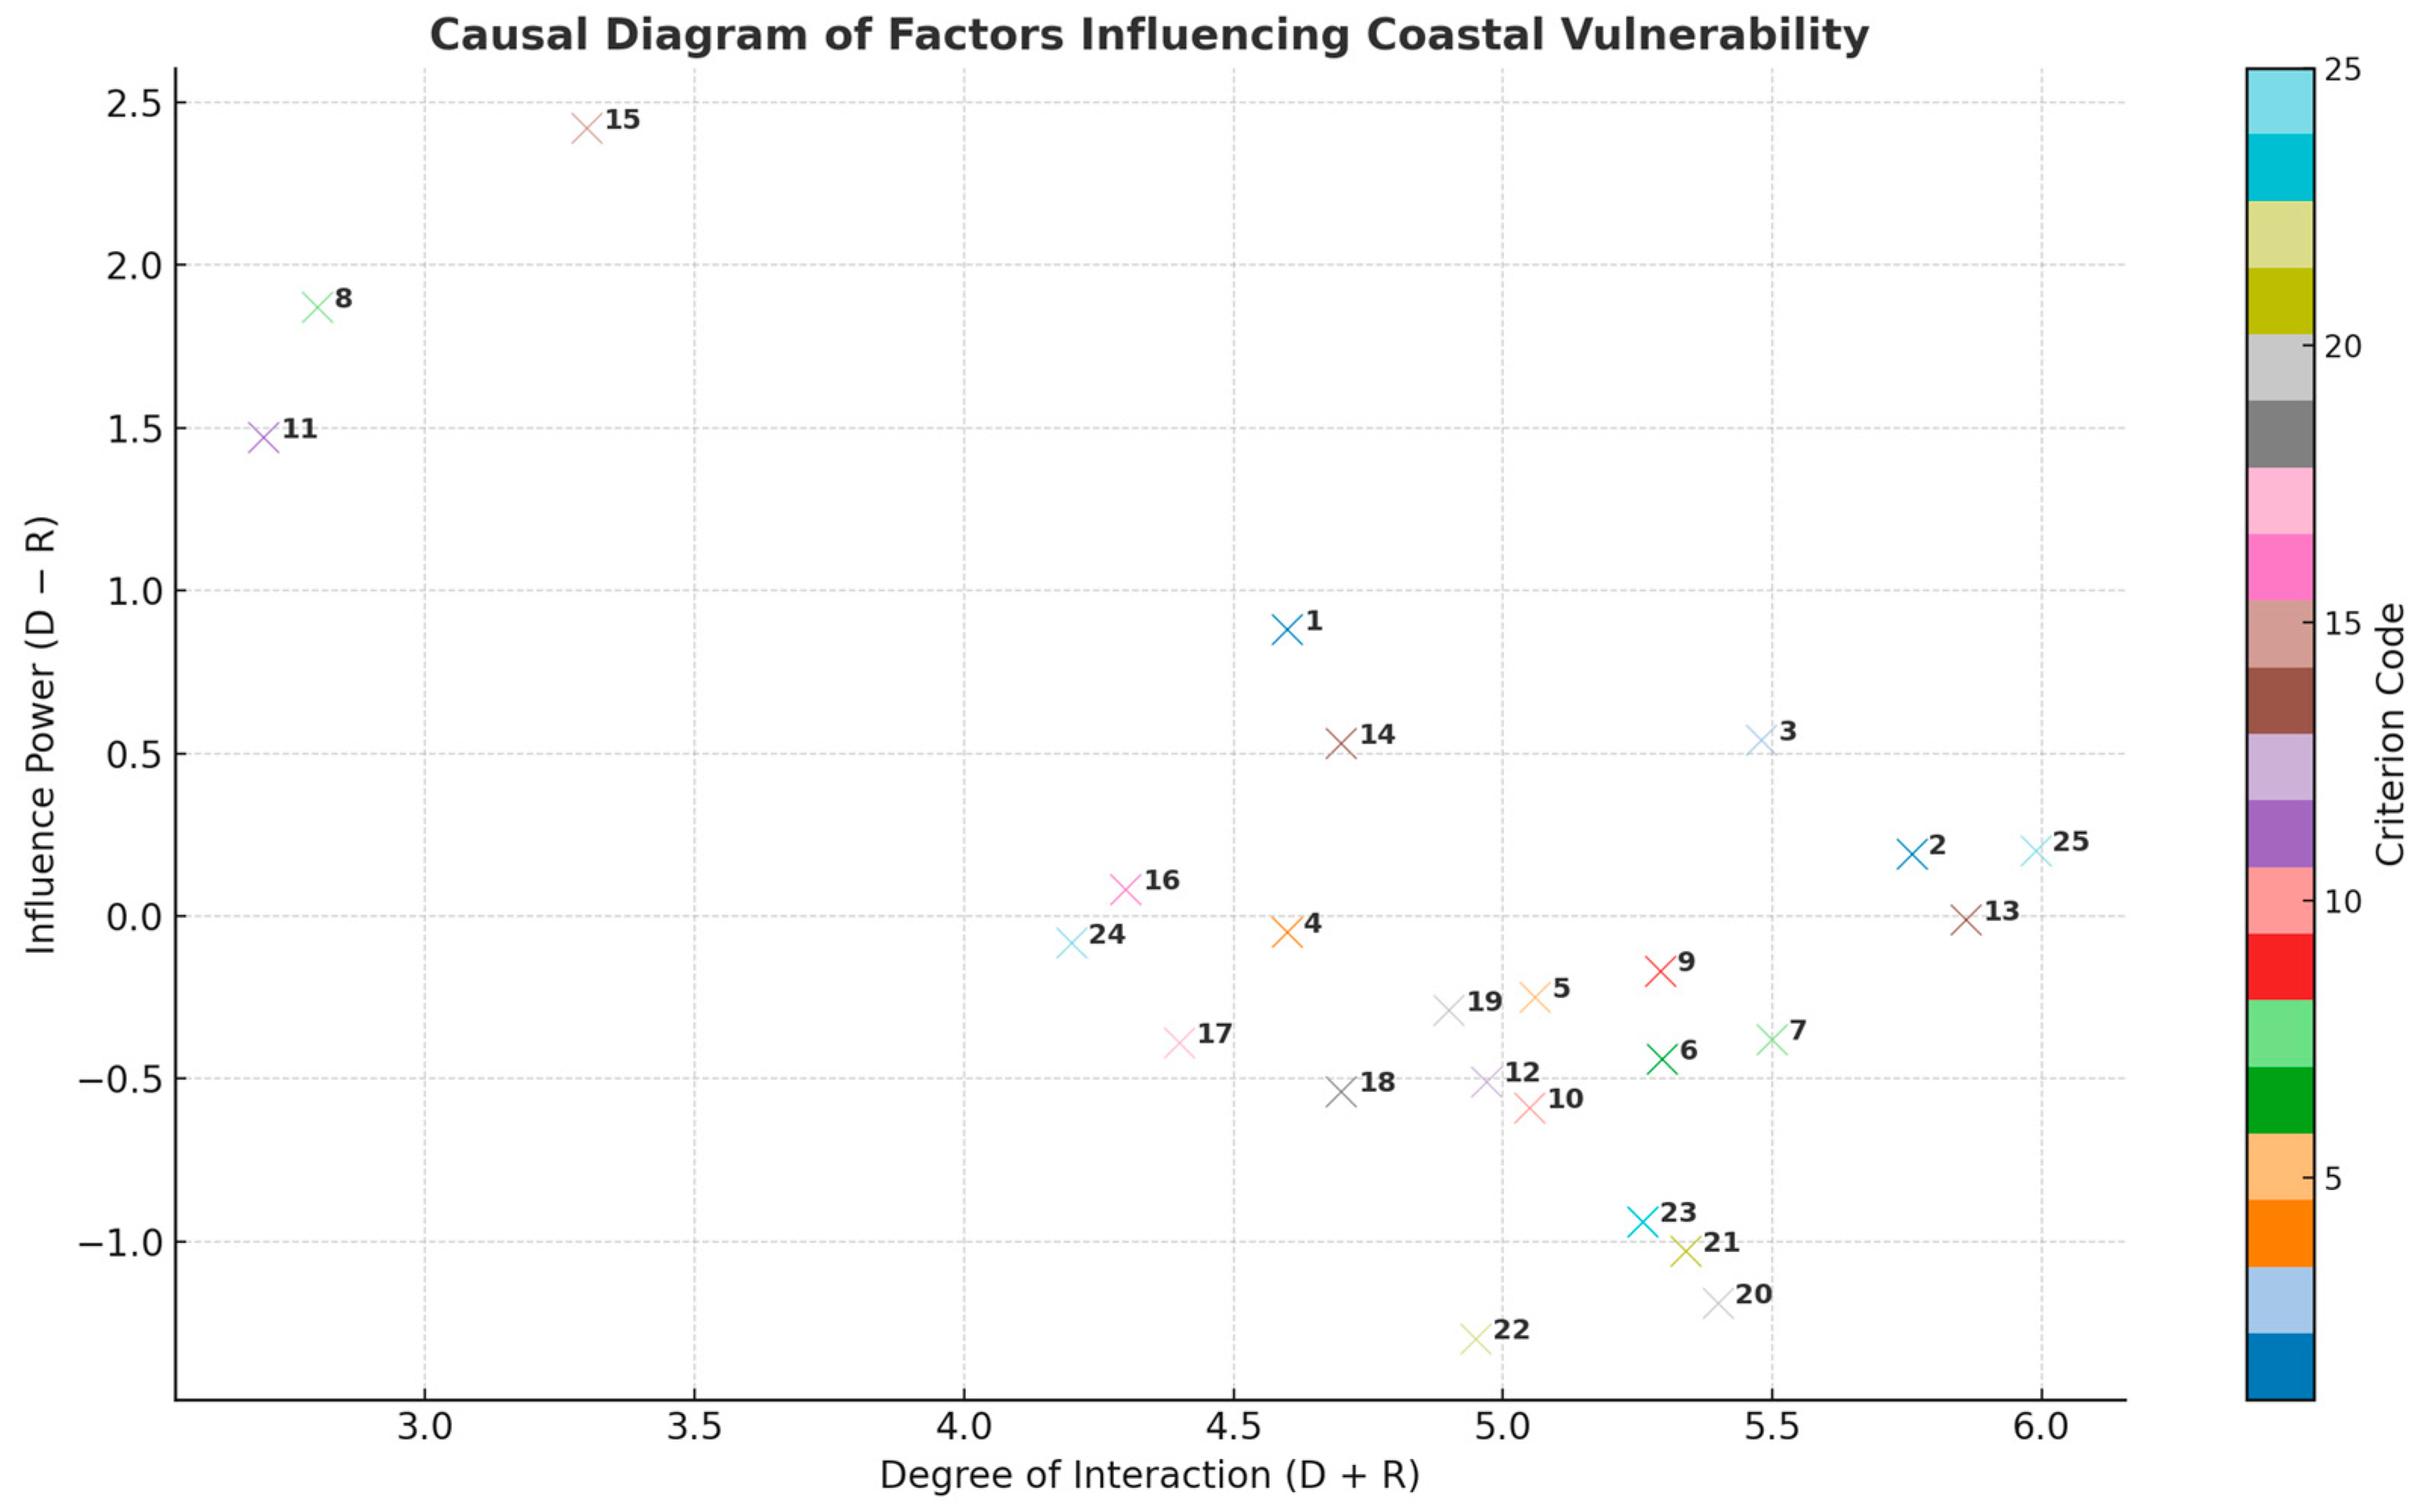
2.3.6. Final Output and Creation of the Causal Diagram

The subsequent step involves obtaining the sums of the rows and columns of the T matrix using Formulas (6)–(8) [32,39,40,41]. These sums are referred to as D (for rows) and R (for columns). Using D and R, we calculate the values of D + R and D − R, which represent the degree of interaction and the influence power of the factors, respectively. The resulting values are presented in Table S19 as the final output.
T = [tij]n × n i, j = 1, 2, 3, …, n
D = j = 1 n t i j n × 1
R = j = 1 n t i j 1 × n
Figure 1 also shows the pattern of meaningful relationships. This pattern is in the form of a diagram in which the longitudinal axis is D + R and the transverse axis is D − R. The position and relationships of each factor are determined by a point with coordinates (D + R, D − R).

3. Results

3.1. The Effectiveness of Variables

The sum of the elements of each row (D) for each factor indicates the extent to which that factor influences other factors in the system. In this study, land use and land cover have the most influence and coastal floods and storm surges, exposure to a hurricane, wind and wave exposure, tidal amplitude, sea-level rise, wave height, and flood in the next influence levels.

3.2. The Influence Degree of Variables

The sum of the elements of the column (R) for each factor indicates the degree to which that factor is affected by other factors in the system. In this study, the extent of coastal ecosystems is the most affected by other criteria. After that, nuclear lesions and household waste rank second and third in terms of vulnerability, respectively. Tidal amplitude has the least influence degree compared to other criteria.

3.3. Typology of Causal and Effect Variables

The horizontal vector (D + R) indicates the influence and degree of influence of the desired criterion in the system. In other words, the higher the D + R value, the more it interacts with other criteria affecting coastal vulnerability. In this study, land use and land cover have the most influence and exposure to wind and wave, exposure to storms, floods, coastal floods and storm surges, coastal ecosystems and nuclear lesions are in the next rank of influence. The vertical vector (D − R) indicates the power influence of each factor. In general, if the D − R is positive, the variable is a causal variable, and if it is negative, it is an effect. In this study, the criteria of tidal amplitude, geology, regional height, sea-level rise, coastal flood and storm surge, wave height, land use and land cover and exposure to storms and bathymetry are cause and the criteria of wind and wave exposure, type of rock, improving the economic situation, geomorphology, coast shield, relief, flood, salinity, coastal protection through mangrove development, shoreline change rate, sand dunes, coastal slope, population, nuclear lesions, coastal ecosystems, and household waste are effect.

4. Discussion

Causation serves as the linchpin in understanding the fundamental link between a cause and its corresponding effect. In the context of coastal vulnerability assessment, factors such as tidal amplitude, geology, regional elevation, sea-level rise, coastal flooding, hurricane waves, wave height, land use, land cover, exposure to hurricanes, and bathymetry act as causal elements. These, in turn, give rise to a spectrum of effects encompassing household waste, impacts on coastal ecosystems, nuclear lesions, population dynamics, alterations in coastal slope, transformations in sand dune structures, changes in coastline rates, and the reinforcement of coastal defenses through mangrove development. These interconnected cause-and-effect parameters collectively shape the landscape of coastal vulnerability, influencing and being influenced by salinity levels, floods, relief, and coastal shielding.
While theoretical aspects of causation are vital, the practical implications often take precedence in managing our environment effectively. Achieving environmental goals relies heavily on understanding these causal relationships. For example, heat depends on fire as an effect, and conversely, fire, as the source of heat, is a cause this relationship remains unidirectional. A similar principle applies to coastal vulnerabilities, emphasizing the reciprocal influence between causal factors and their associated effects.
In the domain of coastal vulnerability, the influence of factors such as tidal amplitude, geology, regional elevation, sea-level rise, coastal inundation, storm surges, wave height, land use, land cover, exposure to hurricanes, and bathymetry significantly determines the extent of coastal ecosystems. Conversely, in different contexts, the extent of coastal ecosystems can be perceived as a causative factor. A nuanced understanding of these cause-and-effect relationships is indispensable for devising strategies to prevent and mitigate potential damage.
While numerous studies have delved into assessing coastal vulnerabilities, few have comprehensively explored the causal connections among the involved parameters—a gap addressed by this study. Our investigation identified sea-level rise as a pivotal and causal element in assessing coastal vulnerability. This finding resonates with the observations of Huynh et al. [32], who underscored the substantial impact of sea-level rise on coastal environments, ecosystems, and human settlements. Similarly, Koroglu et al. [29] argued that analyzing tidal criteria on a large spatial scale, divorced from other factors, might not yield significant insights into identifying vulnerable coastal areas. In our study, we pinpointed tidal amplitude, among other criteria, as a contributing cause of coastal vulnerability. This aligns with the results of Benassai et al. [42], who emphasized that small tidal shorelines are highly susceptible to rising sea levels, and coastal ecosystems, such as wetlands, are less resilient to water level fluctuations considering changes in shorelines as effects of sea-level rise, echoing our study’s findings.
The culmination of our approach involves calculating the final weight of criteria based on the causal model devised by Shahi et al. [41]. Notably, the criterion of land use and land cover, acting as a cause, held the highest weight in this model, followed by coastal inundation and storm surge criteria (causes), storm exposure (cause), wind and wave exposure (effect), and tidal amplitude (cause), in descending order of importance.
However, amidst this crescendo, it is essential to acknowledge the inherent limitations of the Fuzzy DEMATEL approach. While orchestrating a symphony of causation, this method might unintentionally overlook power dynamics and politics an oversight calling for an enhanced chorus. In this symphony, critical scholarship finds resonance, encompassing power and politics in vulnerability assessments. Engaging in participatory harmonies with local communities, scrutinizing governance structures, and embracing diverse perspectives become integral to the comprehensive and equitable evaluation of coastal vulnerability.
This study advocates for a paradigm shift in vulnerability assessments by incorporating power dynamics and politics. By embracing participatory methodologies and considering the diverse realities, root causes, and drivers of coastal vulnerability, we can provide nuanced insights into the limitations of universal vulnerability models. Geographically situating the study to give context to the results becomes imperative, aligning the research with the aim and scope of the journal. A critical perspective recognizes that universal vulnerability models have limited application in different settings, emphasizing the need for evidence illustrating diverse conditions and drivers of vulnerability in coastal communities. Strengthening our manuscript’s alignment with the journal’s aim and scope requires a closer look at the vulnerability literature we draw upon and apply in our studies. The opportunity to critically evaluate existing models and methodologies remains crucial for advancing the field of coastal vulnerability assessment.
Thus, our study underscores the complexity of coastal vulnerability, weaving together causation, power dynamics, and participatory methodologies. While providing valuable insights, we acknowledge the call for further scrutiny and contextualization of results. As coastal vulnerability remains inherently diverse, our methodology offers a framework adaptable to distinct geographic contexts, acknowledging the intricate dance of variables shaping vulnerability landscapes globally.
While the Modified Fuzzy DEMATEL approach provides valuable insights into coastal vulnerability, it relies heavily on expert judgment, introducing potential subjective biases. Furthermore, the model has not yet been validated against empirical, ground-truth data. Future research should prioritize the integration of observational validation through field measurements and remote sensing datasets. Expanding the model to dynamic, time-evolving coastal vulnerability scenarios and applying it across diverse geographic contexts will enhance its robustness and applicability.

5. Conclusions

In summary, our exploration into coastal vulnerability assessment introduces the Modified Fuzzy DEMATEL technique, offering a nuanced lens into socio-ecological dynamics. The study identifies influential parameters, highlighting the pivotal role of socio-economic factors in tailoring coastal management strategies.
While the results emphasize land use and land cover as paramount, the findings also reveal governance-related limitations, advocating for a shift towards participatory approaches to enhance the comprehensiveness of vulnerability models. Challenging universality, the study underscores the need for context-specific vulnerability frameworks.
This research promotes a transformative approach by integrating causation analysis, power dynamics, and participatory methodologies into vulnerability assessments. Embracing diverse perspectives, scrutinizing governance structures, and situating analyses geographically are critical for holistic coastal vulnerability evaluation.
As the study navigates the intricate interplay of variables shaping vulnerability globally, it acknowledges the complexity and diversity of coastal landscapes. While offering valuable insights, continued scrutiny and contextualization of vulnerability models remain essential.
The application of Multi-Criteria Decision Analysis proves valuable for coastal hazard vulnerability assessments. Recognizing the limitations of traditional DEMATEL methods in uncertain environments, this study introduces a fuzzy extension to incorporate expert evaluations and address uncertainty. The outcomes particularly emphasize the significance of socio-economic factors, especially land use and land cover, in vulnerability assessments.
However, certain limitations must be acknowledged. The Modified Fuzzy DEMATEL approach relies heavily on expert judgment, introducing potential subjective biases. Furthermore, the model has not yet been validated against empirical, ground-truth data. Future research should prioritize the integration of observational validation through field measurements and remote sensing datasets. Expanding the model to dynamic, time-evolving coastal vulnerability scenarios and testing it across diverse geographic contexts will enhance its robustness and applicability.
In conclusion, while the Fuzzy DEMATEL approach serves as a valuable framework for assessing coastal vulnerabilities and prioritizing management actions, advancing participatory methodologies and incorporating critical scholarship remain vital. Future developments should ensure more comprehensive and equitable coastal management strategies.

Supplementary Materials

The following supporting information can be downloaded at: https://www.mdpi.com/article/10.3390/coasts5020015/s1, Table S1: Direct Relation Matrix; Table S2: Fuzzy Spectrum; Table S3: Fuzzy Direct Relation Matrix; Table S4: First Components Matrix of the Normalized Matrix (Hl); Table S5: Difference Between First Components Matrix of the Normalized Matrix (Hl) and the Identity Matrix; Table S6: Inverse of the Difference Between First Components Matrix of the Normalized Matrix (Hl) and the Identity Matrix; Table S7: Final Matrix Hl; Table S8: Second Components Matrix of the Normalized Matrix (Hm); Table S9: Difference Between Second Components Matrix of the Normalized Matrix (Hm) and the Identity Matrix; Table S10: Inverse of the Difference Between Second Components Matrix of the Normalized Matrix (Hm) and the Identity Matrix; Table S11: Final Matrix Hm; Table S12: Third Components Matrix of the Normalized Matrix (Hu); Table S13: Difference Between Third Components Matrix of the Normalized Matrix (Hu) and the Identity Matrix; Table S14: Inverse of the Difference Between Third Components Matrix of the Normalized Matrix (Hu) and the Identity Matrix; Table S15: Final Matrix Hu; Table S16: Total Relations Matrix; Table S17: Definite Total Relations Matrix; Table S18: Definite Total Relations Matrix After Removal of Lower Threshold Values; Table S19: Final Output.

Author Contributions

Conceptualization, M.P.S.; Validation, M.P.S.; Formal analysis, M.P.S.; Writing—original draft, M.P.S.; Supervision, G.M.; Project administration, G.M. All authors have read and agreed to the published version of the manuscript.

Funding

This research received no external funding.

Institutional Review Board Statement

Not applicable.

Informed Consent Statement

Not applicable.

Data Availability Statement

All data generated or analyzed during this study are included in this article and its Supplementary Material Files.

Conflicts of Interest

The authors declare no conflict of interest.

References

  1. Pham, H.V.; Dal Barco, M.K.; Pourmohammad Shahvar, M.; Furlan, E.; Critto, A.; Torresan, S. Bayesian Network Analysis for Shoreline Dynamics, Coastal Water Quality, and Their Related Risks in the Venice Littoral Zone, Italy. J. Mar. Sci. Eng. 2024, 12, 139. [Google Scholar] [CrossRef]
  2. Green, C.; McFadden, L. Coastal Vulnerability as Discourse About Meanings and Values. J. Risk Res. 2007, 10, 1027–1045. [Google Scholar] [CrossRef]
  3. Sudha Rani, N.N.V.; Satyanarayana, A.N.V.; Bhaskaran, P.K. Coastal vulnerability assessment studies over India: A review. Nat. Hazards 2015, 77, 405–428. [Google Scholar] [CrossRef]
  4. Balasuriya, A. Coastal Area Management: Biodiversity and Ecological Sustainability in Sri Lankan Perspective. In Biodiversity and Climate Change Adaptation in Tropical Islands; Elsevier: Amsterdam, The Netherlands, 2018; pp. 701–724. [Google Scholar]
  5. Cetin, M. Sustainability of urban coastal area management: A case study on Cide. J. Sustain. For. 2016, 35, 527–541. [Google Scholar] [CrossRef]
  6. Aslam, B.; Muhammad, J.; Muhammad, Z.I.; Gulraiz, A.; Quaid, I.A. GIS Mapping of Tsunami Susceptibility: Case Study of the Karachi City in Sindh, Pakistan. J. Geogr. Nat. Disasters 2017, 7, 2167-0587. [Google Scholar] [CrossRef]
  7. Kantamaneni, K.; Du, X.; Aher, S.; Singh, R. Building Blocks: A Quantitative Approach for Evaluating Coastal Vulnerability. Water 2017, 9, 905. [Google Scholar] [CrossRef]
  8. Sahoo, B.; Bhaskaran, P.K. Multi-hazard risk assessment of coastal vulnerability from tropical cyclones—A GIS based approach for the Odisha coast. J. Environ. Manag. 2018, 206, 1166–1178. [Google Scholar] [CrossRef]
  9. Almutairi, A.; Mourshed, M.; Ameen, R.F.M. Coastal community resilience frameworks for disaster risk management. Nat. Hazards 2020, 101, 595–630. [Google Scholar] [CrossRef]
  10. Gorokhovich, Y.; Leiserowitz, A.; Dugan, D. Integrating Coastal Vulnerability and Community-Based Subsistence Resource Mapping in Northwest Alaska. J. Coast. Res. 2013, 30, 158. [Google Scholar] [CrossRef]
  11. Kunte, P.D.; Jauhari, N.; Mehrotra, U.; Kotha, M.; Hursthouse, A.S.; Gagnon, A.S. Multi-hazards coastal vulnerability assessment of Goa, India, using geospatial techniques. Ocean. Coast. Manag. 2014, 95, 264–281. [Google Scholar] [CrossRef]
  12. Marchau, V.A.W.J.; Walker, W.E.; Bloemen, P.J.T.M.; Popper, S.W. (Eds.) Decision Making Under Deep Uncertainty; Springer International Publishing: Cham, Switzerland, 2019. [Google Scholar]
  13. Stanton, M.C.B.; Roelich, K. Decision making under deep uncertainties: A review of the applicability of methods in practice. Technol. Forecast. Soc. Change 2021, 171, 120939. [Google Scholar] [CrossRef]
  14. Forsyth, T. Climate justice is not just ice. Geoforum 2014, 54, 230–232. [Google Scholar] [CrossRef]
  15. Chelleri, L.; Waters, J.; Olazabal, M.; Minucci, G. Resilience trade-offs: Addressing multiple scales and temporal aspects of urban resilience. Environ. Urban. 2015, 27, 181–198. [Google Scholar] [CrossRef]
  16. Ribot, J. Cause and response: Vulnerability and climate in the Anthropocene. J. Peasant. Stud. 2014, 41, 667–705. [Google Scholar] [CrossRef]
  17. Ribot, J. Vulnerability before adaptation: Toward transformative climate action. Glob. Environ. Chang. 2011, 21, 1160–1162. [Google Scholar] [CrossRef]
  18. De Serio, F.; Armenio, E.; Mossa, M.; Petrillo, A.F. How to Define Priorities in Coastal Vulnerability Assessment. Geosciences 2018, 8, 415. [Google Scholar] [CrossRef]
  19. Sowman, M.; Raemaekers, S. Socio-ecological vulnerability assessment in coastal communities in the BCLME region. J. Mar. Syst. 2018, 188, 160–171. [Google Scholar] [CrossRef]
  20. Noble, I.R.; Huq, S.; Anokhin, Y.A.; Carmin, J.; Goudou, D.; Lansigan, F.P.; Osman-Elasha, B.; Villamizar, A. Adaptation Needs and Options. In Climate Change 2014: Impacts, Adaptation, and Vulnerability. Part A: Global and Sectoral Aspects; Contribution of Working Group II to the Fifth Assessment Report of the Intergovernmental Panel on Climate Change; Field, C.B., Barros, V.R., Dokken, D.J., Mach, K.J., Mastrandrea, M.D., Bilir, T.E., Chatterjee, M., Ebi, K.L., Estrada, Y.O., Genova, R.C., et al., Eds.; Cambridge University Press: Cambridge, UK; New York, NY, USA, 2014; pp. 833–868. [Google Scholar]
  21. Bellanger, M.; Speir, C.; Blanchard, F.; Brooks, K.; Butler, J.R.A.; Crosson, S.; Fonner, R.; Gourguet, S.; Holland, D.S.; Kuikka, S.; et al. Addressing Marine and Coastal Governance Conflicts at the Interface of Multiple Sectors and Jurisdictions. Front. Mar. Sci. 2020, 7, 544440. [Google Scholar] [CrossRef]
  22. Mafi-Gholami, D.; Zenner, E.K.; Jaafari, A.; Riyahi Bakhtyari, H.R.; Tien Bui, D. Multi-hazards vulnerability assessment of southern coasts of Iran. J. Environ. Manage. 2019, 252, 109628. [Google Scholar] [CrossRef]
  23. Thumerer, T.; Jones, A.P.; Brown, D. A GIS based coastal management system for climate change associated flood risk assessment on the east coast of England. Int. J. Geogr. Inf. Sci. 2000, 14, 265–281. [Google Scholar] [CrossRef]
  24. Bryan, B.; Harvey, N.; Belperio, T.; Al, E. Distributed process modeling for regional assessment of coastal vulnerability to sea-level rise. Environ. Model. Assess. 2001, 6, 57–65. [Google Scholar] [CrossRef]
  25. Williams, A.T.; Davies, P.; Chrr, R.; Koh, A.; Bodéré, J.-C.; Hallegouet, B.; Meur, C.; Yoni, C. Checklist assessment of dune vulnerability and protection in Devon and Cornwall, UK. In Proceedings of the 8th Symposium on Coastal and Ocean Management, New Orleans, LA, USA, 19 July 1993; Volume 3, pp. 3394–3408. [Google Scholar]
  26. Mclaughlin, S.; Cooper, J.A.G. A multi-scale coastal vulnerability index: A tool for coastal managers? Environ. Hazards 2010, 9, 233–248. [Google Scholar] [CrossRef]
  27. Koroglu, A.; Ranasinghe, R.; Jiménez, J.A.; Dastgheib, A. Comparison of Coastal Vulnerability Index applications for Barcelona Province. Ocean Coast. Manag. 2019, 178, 104799. [Google Scholar] [CrossRef]
  28. Mahmood, R.; Ahmed, N.; Zhang, L.; Li, G. Coastal vulnerability assessment of Meghna estuary of Bangladesh using integrated geospatial techniques. Int. J. Disaster Risk Reduct. 2020, 42, 101374. [Google Scholar] [CrossRef]
  29. Sekovski, I.; Del Río, L.; Armaroli, C. Development of a coastal vulnerability index using analytical hierarchy process and application to Ravenna province (Italy). Ocean Coast. Manag. 2020, 183, 104982. [Google Scholar] [CrossRef]
  30. Baig, M.R.I.; Shahfahad; Ahmad, I.A.; Tayyab, M.; Asgher, M.S.; Rahman, A. Coastal Vulnerability Mapping by Integrating Geospatial Techniques and Analytical Hierarchy Process (AHP) along the Vishakhapatnam Coastal Tract, Andhra Pradesh, India. J. Indian Soc. Remote Sens. 2021, 49, 215–231. [Google Scholar] [CrossRef]
  31. Sathiya Bama, V.P.; Rajakumari, S.; Ramesh, R. Coastal vulnerability assessment of Vedaranyam swamp coast based on land use and shoreline dynamics. Nat. Hazards 2020, 100, 829–842. [Google Scholar] [CrossRef]
  32. Huynh, T.T.M.; Tran, D.-H.; Pham, A.-D.; Le-Hoai, L. Quantitative Structuring for the Strategy Map of Coastal Urban Projects Using a Hybrid Approach of Fuzzy Logic and DEMATEL. In Proceedings of the International Conference on Sustainable Civil Engineering and Architecture, Singapore, 28 July 2020; pp. 957–968. [Google Scholar]
  33. Nguyen, T.T.X.; Bonetti, J.; Rogers, K.; Woodroffe, C.D. Indicator-based assessment of climate-change impacts on coasts: A review of concepts, methodological approaches and vulnerability indices. Ocean Coast. Manag. 2016, 123, 18–43. [Google Scholar] [CrossRef]
  34. Serafim, M.B.; Siegle, E.; Corsi, A.C.; Bonetti, J. Coastal vulnerability to wave impacts using a multi-criteria index: Santa Catarina (Brazil). J. Environ. Manage. 2019, 230, 21–32. [Google Scholar] [CrossRef]
  35. Smith, R.A.E.; Bates, P.D.; Hayes, C. Evaluation of a coastal flood inundation model using hard and soft data. Environ. Model. Softw. 2012, 30, 35–46. [Google Scholar] [CrossRef]
  36. Ishizaka, A.; Nemery, P. Multi-Criteria Decision Analysis; Wiley: Hoboken, NJ, USA, 2013. [Google Scholar]
  37. Westmacott, S. Developing decision support systems for integrated coastal management in the tropics: Is the ICM decision-making environment too complex for the development of a useable and useful DSS? J. Environ. Manag. 2001, 62, 55–74. [Google Scholar] [CrossRef] [PubMed]
  38. Pamučar, D.; Mihajlović, M.; Obradović, R.; Atanasković, P. Novel approach to group multi-criteria decision making based on interval rough numbers: Hybrid DEMATEL-ANP-MAIRCA model. Expert Syst. Appl. 2017, 88, 58–80. [Google Scholar] [CrossRef]
  39. Lin, C.L.; Wu, W. A Fuzzy Extension of the Dematel Method for Group Decision Making. 2004. Available online: https://api.semanticscholar.org/CorpusID:62248201 (accessed on 28 April 2025).
  40. Lin, K.-P.; Tseng, M.-L.; Pai, P.-F. Sustainable supply chain management using approximate fuzzy DEMATEL method. Resour. Conserv. Recycl. 2018, 128, 134–142. [Google Scholar] [CrossRef]
  41. Shahi, E.; Alavipoor, F.S.; Karimi, S. The development of nuclear power plants by means of modified model of Fuzzy DEMATEL and GIS in Bushehr, Iran. Renew. Sustain. Energy Rev. 2018, 83, 33–49. [Google Scholar] [CrossRef]
  42. Benassai, G.; Di Paola, G.; Aucelli, P.P.C. Coastal risk assessment of a micro-tidal littoral plain in response to sea level rise. Ocean. Coast. Manag. 2015, 104, 22–35. [Google Scholar] [CrossRef]
Figure 1. Causal diagram illustrating the degree of interaction (D + R) and influence power (D − R) for each variable affecting coastal vulnerability. Positive D − R values indicate causal factors, while negative D − R values indicate effect factors. Variable codes correspond to the legends listed in Table S19.
Coasts 05 00015 g001
Table 1. Relation matrix (full table in the Supplementary).
Sea Level RiseExposure to HurricaneImproving the Economic SituationLand Use and Land Cover
Sea level rise000899111678
exposure to hurricane 899000111678
coastal floods and storm surges899899111678
Rock type111889234456
Coast Shield899889678678
Coastal protection through mangrove development678889678678
Flood456234111678
Geology111678456234
Geomorphology234678678456
Coastal slope111678678456
Regional height111678678678
Shoreline change rate234456678678
Wind and wave exposure678889111678
Wave height456456234678
Tidal amplitude899678456678
Bathymetry678889456234
Salinity level111456889889
Sand dunes456678456678
Relief456889456234
Coastal ecosystems111234889678
Nuclear lesions111111111678
Household waste111111111456
population111234889889
Improving the economic situation111889000676
Land use and land cover456889889000
Table 2. Fuzzy spectrum.
Code.Verbal PhraseU *M *L *
1No impact111
2Very low impact432
3Low impact654
4High impact876
5Very high impact998
* U = Upper Spectrum, M = Medium Spectrum, L = Lower Spectrum.
Table 3. Final output for causal diagram.
CodeCriterion NameDRD − RD + RCriterion TypeWiWfinal
1.Sea level rise2.741.90.884.6cause5.480.0455
2.exposure to hurricane 2.982.80.195.76cause5.950.0494
3.coastal floods and storm surges3.012.50.545.48cause6.020.0499
4.Rock type2.262.3−0.054.6effect4.550.0377
5.Coast Shield2.402.7−0.255.06effect4.810.0399
6.Coastal protection through mangrove development2.432.9−0.445.296effect4.8560.0403
7.Flood2.583−0.385.5effect5.120.0425
8.Geology2.330.51.872.8cause4.670.0387
9.Geomorphology2.562.7−0.175.293effect5.1230.0425
10.Coastal slope2.232.8−0.595.05effect4.460.0370
11.Regional height2.10.61.472.7cause4.170.0346
12.Shoreline change rate2.232.74−0.514.97effect4.460.0370
13.Wind and wave exposure2.922.94−0.0125.86effect5.8480.0485
14.Wave height2.622.090.534.7cause5.230.0434
15.Tidal amplitude2.880.462.423.3cause5.720.0474
16.Bathymetry2.22.130.0814.3cause4.3810.0363
17.Salinity level22.39−0.394.4effect4.010.0332
18.Sand dunes2.092.64−0.544.7effect4.160.0345
19.Relief2.32.59−0.294.9effect4.610.0382
20.Coastal ecosystems2.123.3−1.195.4effect4.210.0349
21.Nuclear lesions2.163.19−1.035.34effect4.310.0357
22.Household waste1.83.13−1.34.95effect3.650.0303
23.population2.163.1−0.945.26effect4.320.0358
24.Improving the economic situation2.072.15−0.0834.2effect4.1170.0341
25.Land use and land cover3.092.90.25.99cause6.190.0514
Disclaimer/Publisher’s Note: The statements, opinions and data contained in all publications are solely those of the individual author(s) and contributor(s) and not of MDPI and/or the editor(s). MDPI and/or the editor(s) disclaim responsibility for any injury to people or property resulting from any ideas, methods, instructions or products referred to in the content.

