Article

Experimental Study on Foam Stability in Tailwater Discharge from Coastal Power Plants in Marine Environments

1
Guangdong Research Institute of Water Resources and Hydropower, Guangzhou 510635, China
2
Guangdong Key Laboratory of Hydrodynamic Research, Guangzhou 510635, China
3
State and Local Joint Engineering Laboratory of Estuarine Hydraulic Technology, Guangzhou 510635, China
4
Guangdong Provincial Science and Technology Collaborative Innovation Center for Water Safety, Guangzhou 510635, China
5
School of Civil Engineering and Transportation, South China University of Technology, Guangzhou 510641, China
6
Guangdong No.3 Water Conservancy and Hydro-Electric Engineering Board Co., Ltd., Guangzhou 510030, China
*
Author to whom correspondence should be addressed.
Submission received: 21 November 2024 / Revised: 25 January 2025 / Accepted: 8 February 2025 / Published: 3 March 2025

Abstract

:
Foam pollution in the tailwater discharge from coastal power plants poses a significant challenge. However, the mechanisms underlying foam formation and stability remain understudied, which hinders the development of effective control strategies. This study investigated the impacts of temperature and algal concentration on foam stability in tailwater discharge from coastal power plants through simulation experiments to elucidate mechanisms of foam stability. A laboratory simulation device was developed to adjust temperature and algal concentration and measure foam layer height, half-life, bubble diameter, surface tension, and viscosity. This device was used to replicate foam scenarios typical of coastal power plant tailwater discharge to analyze the effects of temperature and algal concentration on foam stability through comprehensive data collection and analysis across various operational conditions. The findings revealed that foam stability decreased with increasing temperatures (15–45 °C). However, during hot summer months, higher temperatures (range of 30–40 °C) hindered foam dissipation owing to algal blooms and the release of surface-active substances. The functional relationship between foam stability index (half-life, foam layer height, bubble diameter) and temperature and algae concentration was established, which provides a scientific basis for predicting foam stability under different conditions. This research elucidates the complex dynamics of foam in the tailwater discharge from coastal power plants and provides insights for developing more effective foam control strategies, potentially mitigating adverse impacts on the marine ecosystem. In future research, by adding experimental conditions such as pH, ionic strength, and different types of protein polysaccharides, a more comprehensive understanding of the mechanism of bubble generation can be achieved, providing more accurate foam suppression optimization solutions for future engineering practices.

1. Introduction

Most coastal thermal/nuclear power plants globally use seawater in their cooling water systems to cool steam. After the heat exchange process, the water flows into the siphon well and is then discharged back into the sea [1]. The siphon well features an overflow weir that stabilizes the water level and siphon height in the drainage system. This design reduces pump head and operating costs, thereby ensuring the safe operation of the circulating water system. However, as water falls over the weir, it mixes with air to produce numerous bubbles. These bubbles are discharged into the sea along with the tailwater, forming a persistent bubble pollution zone that can lead to sensory impacts and psychological concerns [1,2]. Generally, in hydro-engineering buildings such as the Three Gorges Dam, Baihetan, and Xiluodu, flood discharge leads to a significant amount of air mixing with water, forming numerous bubbles of different sizes. The water body beneath the dam is similar to a “white” mixture of water and gas [3,4]. However, bubbles tend to break and disperse over short distances and time. The key difference between these two phenomena is that the first event involves seawater, while the second event involves freshwater. In coastal power plants, seawater is used as cooling water. As the circulating water pump extracts seawater from the condensing system, biocides are typically added to the seawater to inhibit the growth and attachment of marine organisms to the inner surfaces of the condenser tubes. This results in a higher concentration of plankton carcasses in the cooling water [5]. Bubbles produced by the falling water in the siphon well can easily adhere to the surfaces of this plankton debris. With the discharge of water, bubbles, and debris into nearby waters, the movement of wind and waves causes the bubbles to accumulate and form foam.
In pristine natural environments, such as humus water in tropical rainforests and ocean surfaces, bubbles can easily form owing to air mixing and mechanical agitation [6]. The small organisms present in these environments may be damaged or dead, resulting in debris. Upon decomposition, these organisms release organic matter, which acts as a natural surfactant [2]. Owing to their hydrophilicity and viscosity, the bubbles adhere to natural surfaces, which enhances their stability. Additionally, seasonal changes, such as higher water temperatures during the summer, increase the metabolic rates of marine organisms and promote their growth, further facilitating the attachment of bubbles to surfaces [7]. Kováts et al. [8] investigated the effect of liquid-phase surface tension on bubble stability and concluded that the movement of small bubbles is significantly affected by surface tension. In summary, the stability of bubbles in the tailwater discharge areas of coastal power plants is mainly influenced by water temperature and plankton content. A comprehensive analysis of bubble (or foam) stability in these areas is crucial for developing effective measures to inhibit foam formation. Most existing studies on foam stability have mainly focused on food, pharmaceuticals, chemicals, and other industries [2,9,10,11,12,13,14,15,16], with only a few examining bubble (or foam) stability in the tailwater discharge areas of coastal power plants. In situ tests are inherently limited by natural uncertainties, such as variations in climate, light, and sea currents, which complicate the accurate assessment of the individual and combined effects on bubble stability. Therefore, conducting indoor mechanism tests is vital.
This study focuses on the influence of water quality factors on the stability of foam by setting up a set of indoor bubble generation device. By systematically measuring the parameters such as foam half-life, foam layer height and bubble diameter under the condition of single factor or composite factors, we can deeply understand the mechanism of bubble stability, which can be used as the key index to evaluate the bubble stability in the coastal power plant tail water discharge sea area. The flowchart of research methodology is shown in Figure 1.

2. Materials and Methods

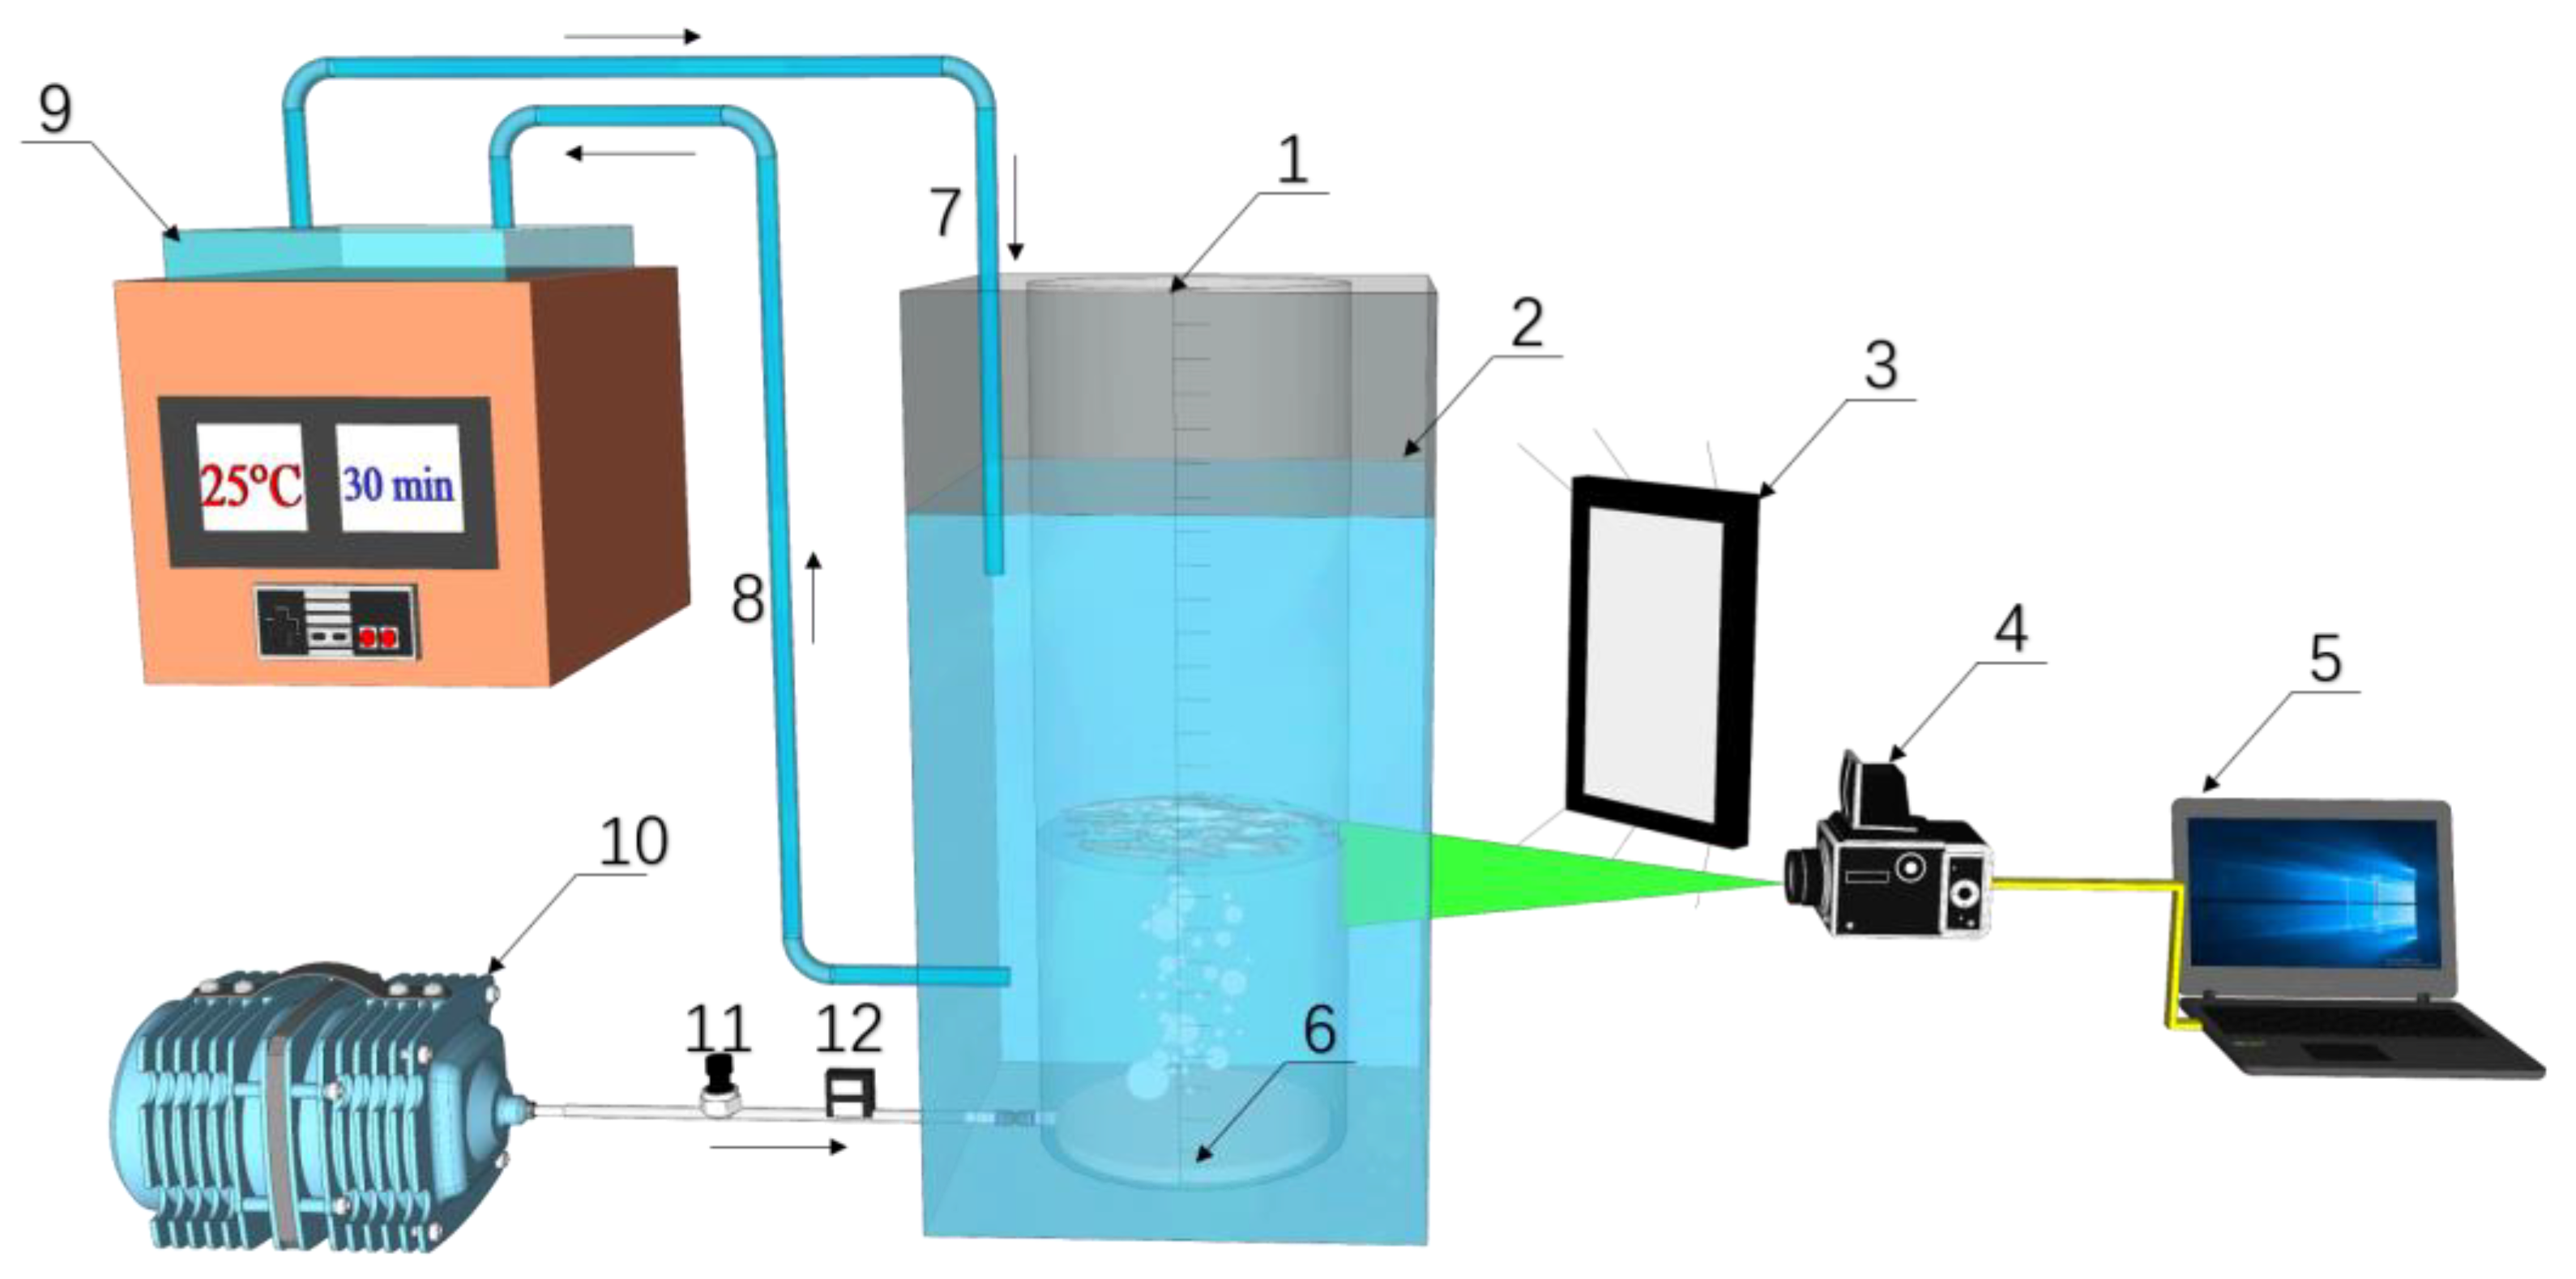
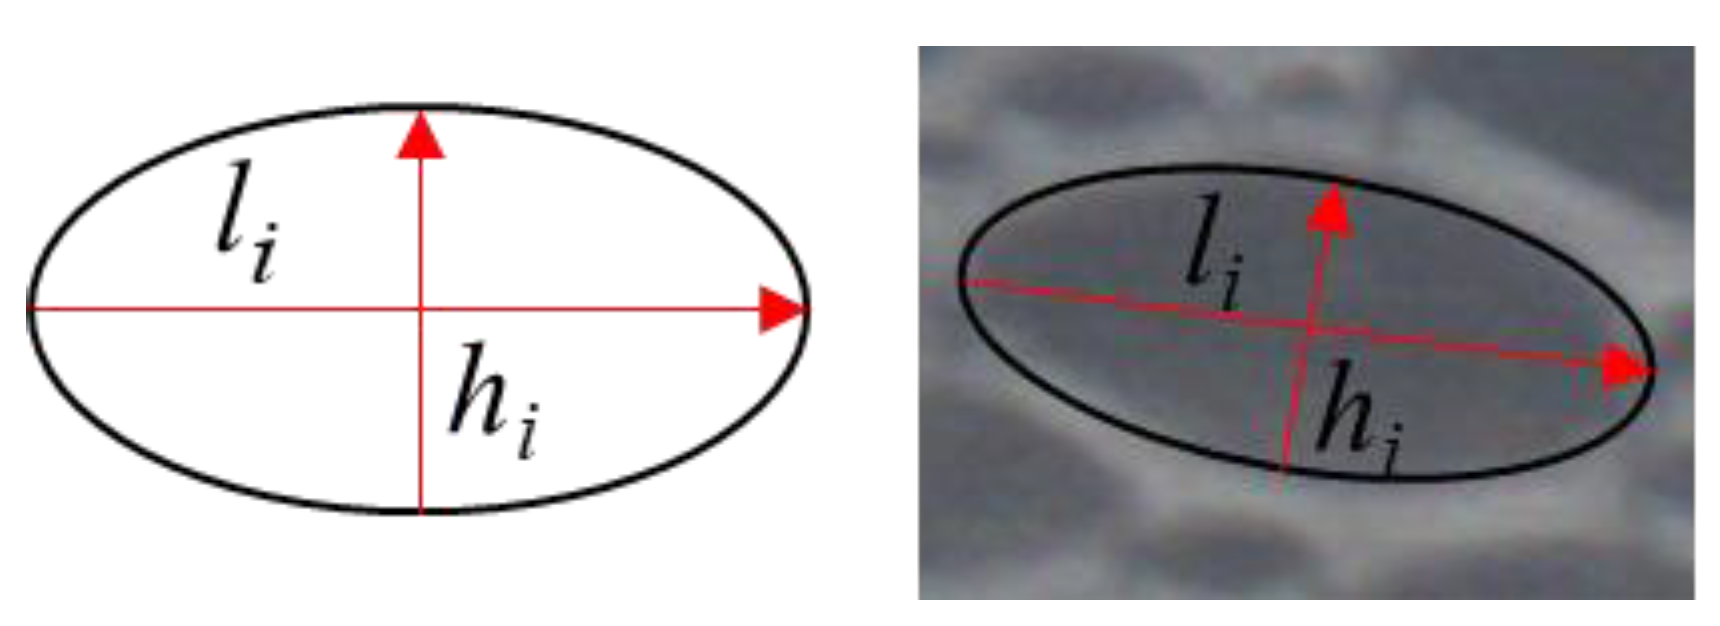
2.1. Experimental Setup

The experimental setup comprises a measuring cylinder, an air pump, a gas distributor, a thermostatic bath, a gas pump, a gas flowmeter, an industrial camera, a flat light source, and a computer (Figure 2). The manufacturer of the measuring cylinder and the insulation is Gaosong Fish Pond Equipment Co., Ltd., Guangzhou, China. The other equipment was sourced from Shuer Experimental Equipment Co., Ltd., Foshan, China. Particularly, the measuring cylinder features an inner diameter of 10 cm and a height of 50 cm. At the bottom of the cylinder, a fixed gas distributor with a diameter of 10 cm is connected to an air pump that operates with a flow rate of 0.5 to 12 L/min. This setup facilitates aeration to ensure a uniform distribution of bubbles. The water in the cylinder is regulated by a thermostat temperature-controlled tank, while a thermal insulation layer surrounds the cylinder, which serves as a water bath. This setup maintains a temperature range of 10–50 °C, and the temperature control accuracy is 0.1 °C or even 0.01 °C. During the experiment, a flat LED light serves as a backlight, and the camera aperture is adjusted to capture clear images. An industrial video camera is positioned in front of the measuring cylinder to photograph and record the phenomena of bubble rise, aggregation, and fragmentation. A computer and camera host are utilized for data transmission and image recording. The experimental photos are shown in the following Figure 3.

2.2. Experimental Design

Seawater collected from the outfall of a coastal power plant served as a benchmark. To accurately simulate the debris or residue from damaged or dead microorganisms in the tailwater of the power plant, we purchased a specific quantity of shells and sea mud before the experiment. We used a small mixer to break the shells and sea mud and then passed the mixture through a 300-mesh sieve multiple times. We prepared the seawater by adding 50 mL of crushed shells and 10 mL of sea mud to 1000 mL of seawater, resulting in a volume ratio of 5% shells and 1% sea mud. Thus, the final mixture contained 5% shell meat and 1% sea mud. The initial salinity of the water sample is 35‰, and the pH value is about 8. Through preliminary tests and a literature review, we found that Streptomyces meso-costalis predominates in offshore waters [17,18]. Therefore, this study inoculated Streptomyces meso-costalis as the planktonic algae in the experimental water. The water temperature and planktonic algal concentrations in the experimental setup were adjusted accordingly. To ensure accurate results, three parallel experiments were conducted for each set of working conditions.
At the beginning of the experiment, a gas pump generated bubbles (or foams) at a flow rate of 0.5 L/min through a gas distributor in a measuring cylinder containing 400 mL of experimental water. The height of the stabilized bubbles, denoted as H, was recorded. After aeration was stopped, the time required for the bubble height, H, to decrease by half was considered the half-life of the bubbles, t1/2. High-speed video cameras were used to capture images of bubbles at distances of 0–50 mm above the liquid surface. Images were captured once per minute, with at least 100 bubbles measured in each image file. The long and short axes of the bubbles were analyzed using image processing software (ImagePy 3.11) (Figure 4). The equivalent diameter of the elliptical bubbles (dbi) was calculated using Equation (1), while the Sauter’s mean diameter of the bubbles was determined using Equation (2) (dbs). This diameter served as a metric for assessing bubble stability. The experimental conditions and results are shown in Table 1.
d b i = h i l i 2 1 / 3
d b s = n i d b i 3 n i d b i 2
where: dbi refers to the equivalent diameter of the ith bubble, m; hi refers to the length of the short axis of the ith bubble, m; li refers to the length of the long axis of the ith bubble, m; ni refers to the number of bubbles; and dbs refers to the Sauter’s mean diameter of the bubble.

3. Results

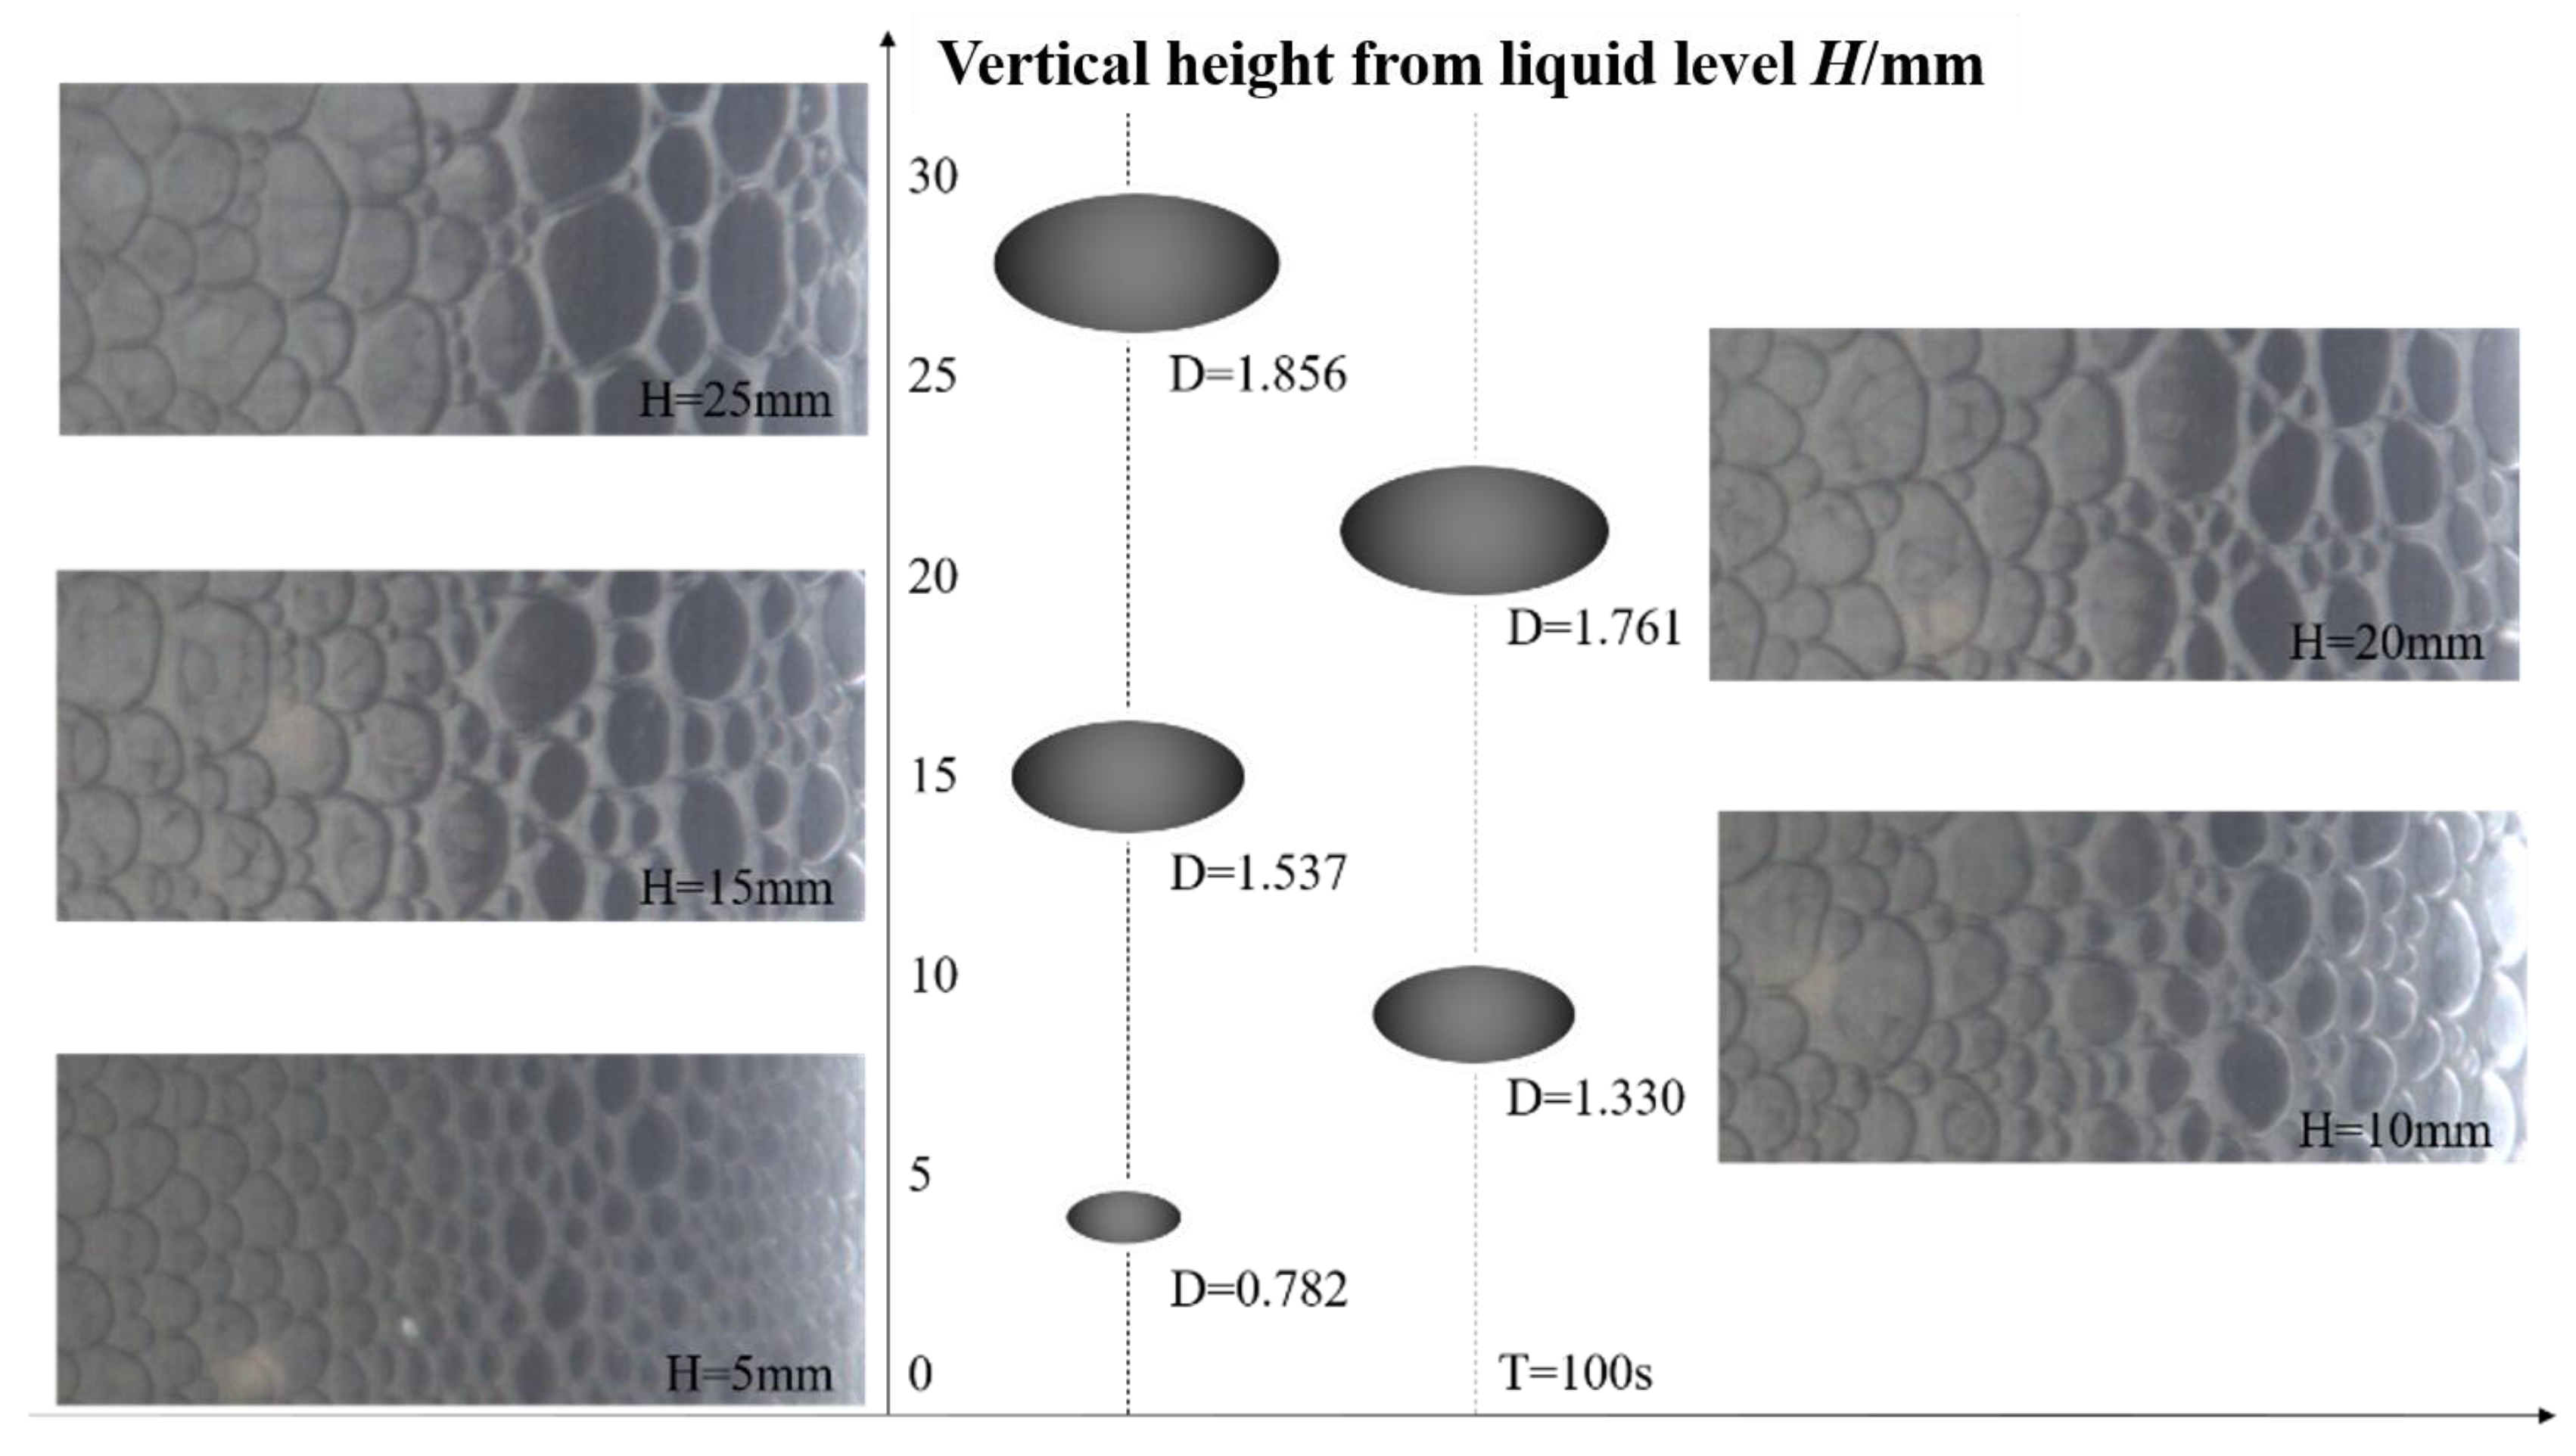
3.1. Vertical Distribution of Bubbles

For working condition 3 (Table 1), the temperature was set at 25 °C, and the algal concentration was 250 cells/μL. Images were captured using a camera to analyze the variation in bubble diameter with vertical height from 0 to 30 mm above the liquid surface (Figure 5).
The size of foam increases with the increase of radial height, indicating that smaller bubbles are present in the lower section of the foam layer, while larger bubbles are found in the upper section (Figure 5). Additionally, the equivalent diameter of the bubbles increases with the height of the foam layer, leading to a transition in the shape of a single bubble from spherical or ellipsoidal to dodecahedral. Furthermore, the variation in bubble diameter becomes more pronounced, with a vertical height of 25 mm corresponding to a bubble diameter of ~5 mm, indicating a ratio of ~2.37 times.
The distribution trend of bubble size is influenced by gravity, which causes a downward flow of liquid within the foam layer, leading to unstable bubble aggregation [6]. According to foam boundary layer theory, a liquid film exists between the bubbles (Figure 6) [19], with a thickness significantly smaller than both the curvature radius of the boundary and the radius of the bubbles. Thus, the liquid film exhibits higher pressure than the Plateau boundary layer, resulting in liquid flow from the liquid film to the Plateau boundary layer. During bubble formation, the liquid in the bubble liquid film flows downward owing to gravity and exits through the Plateau boundary layer at the bottom of the bubble. As the liquid is discharged, the liquid film gradually becomes thinner, leading to bubble instability, coalescence, and the formation of bubbles with larger diameters [20]. To mitigate bubble formation and enhance bubble concentration in the drainage siphon well, the power plant implements effective measures. One approach involves installing a partition in the middle of the siphon well, which enables bubbles to accumulate to a certain height and dissipate naturally.

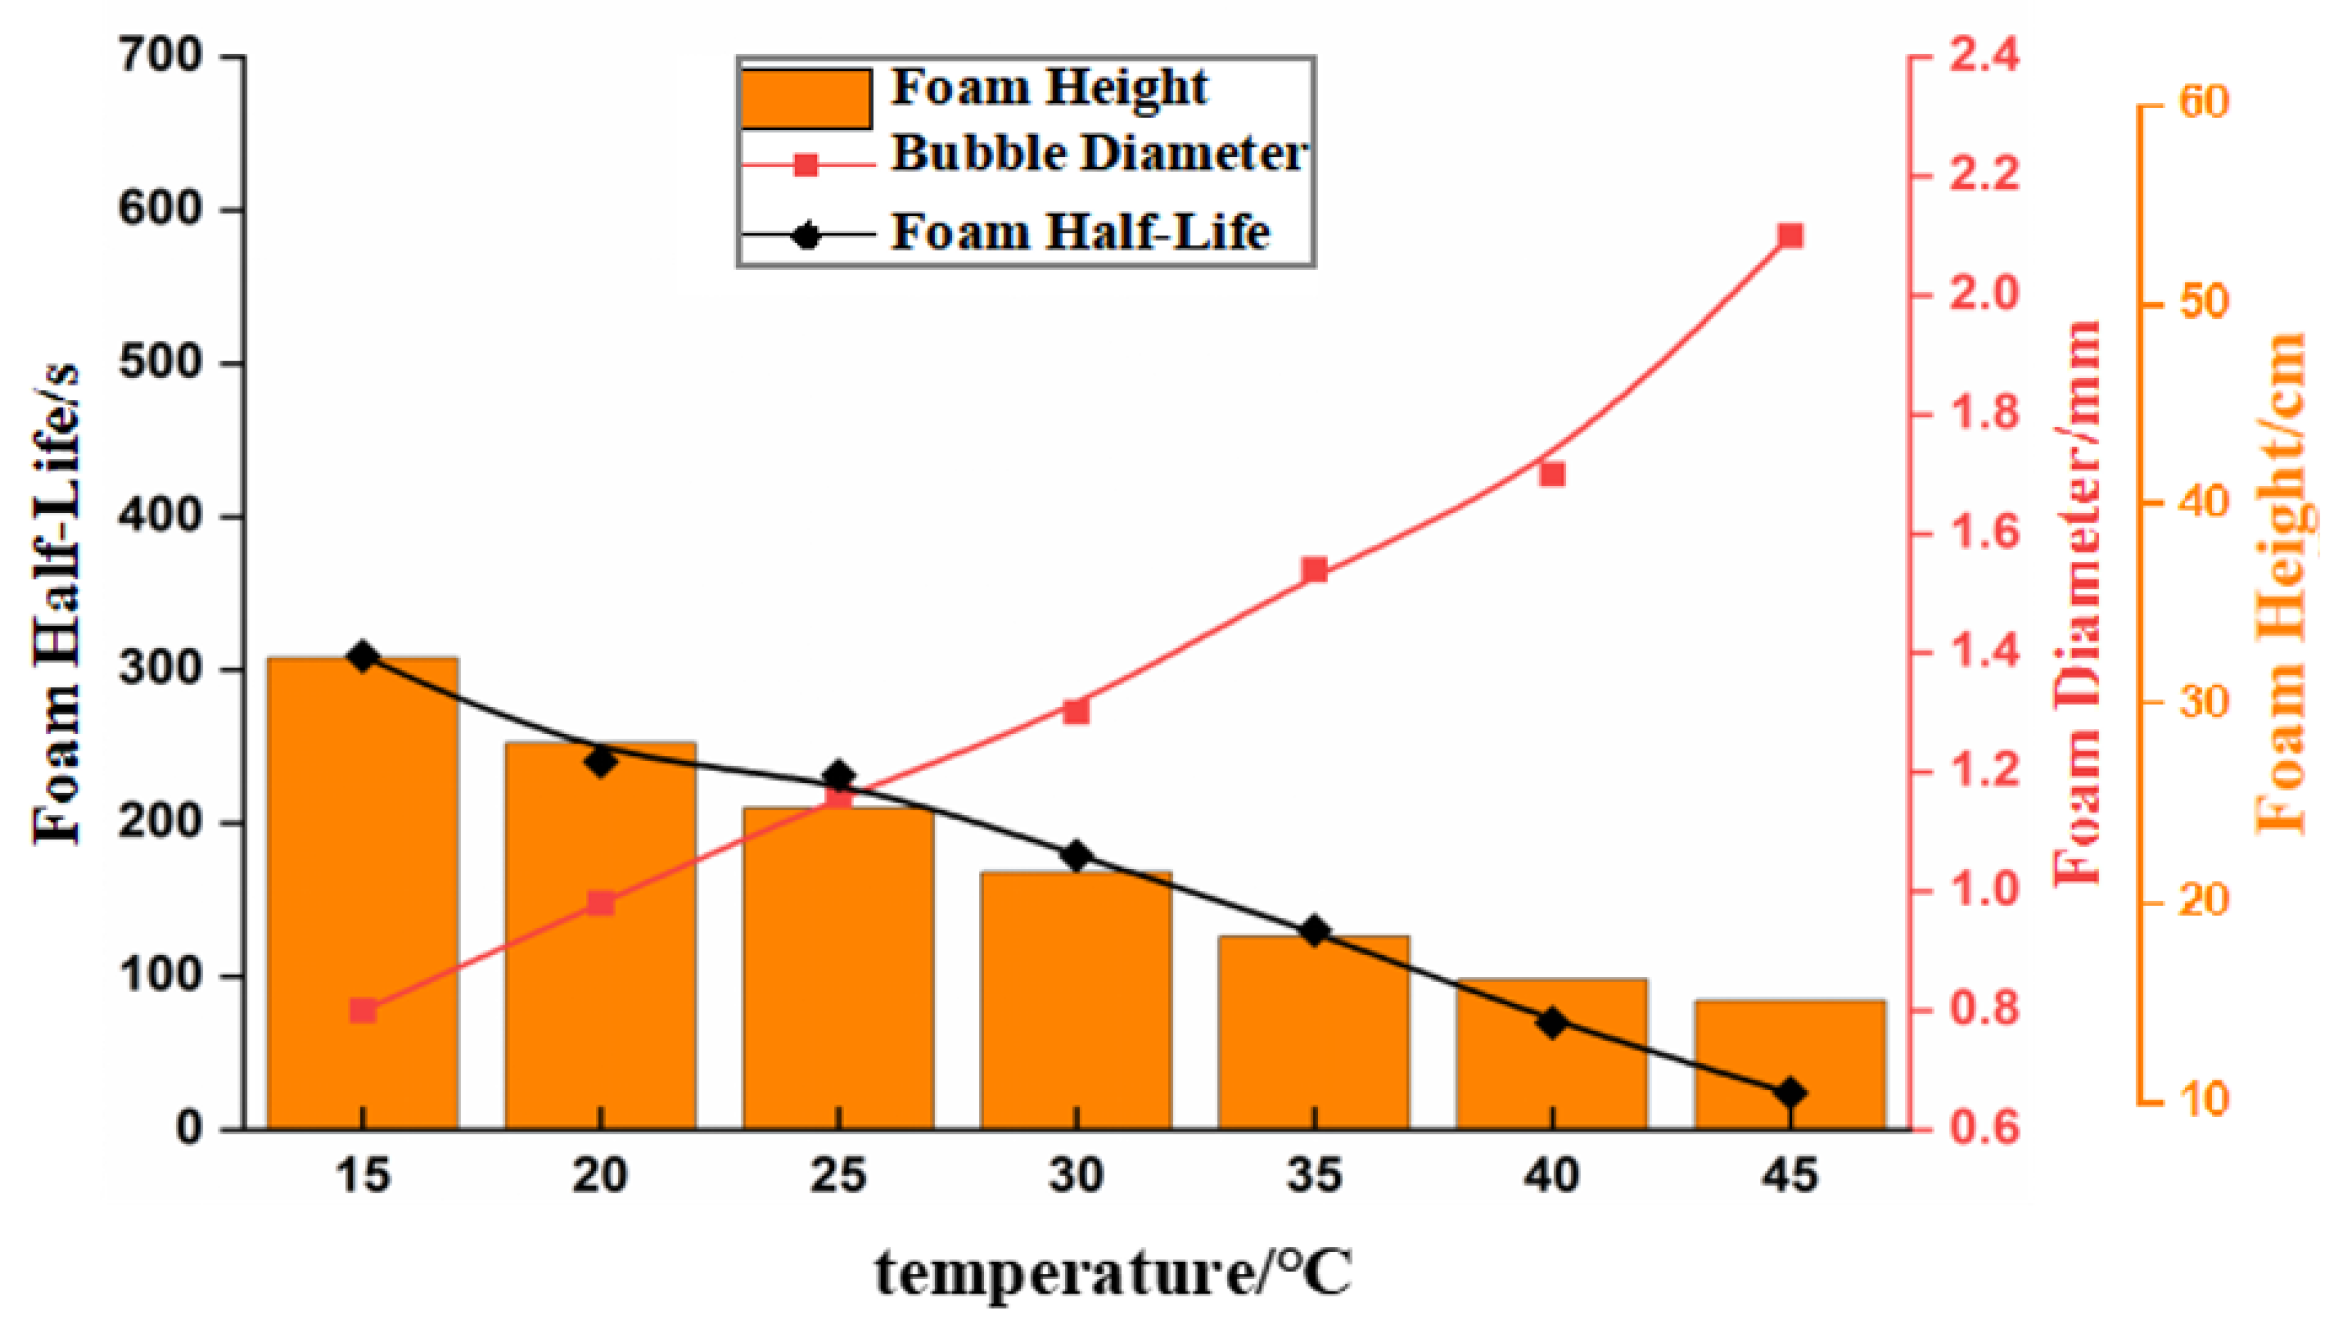
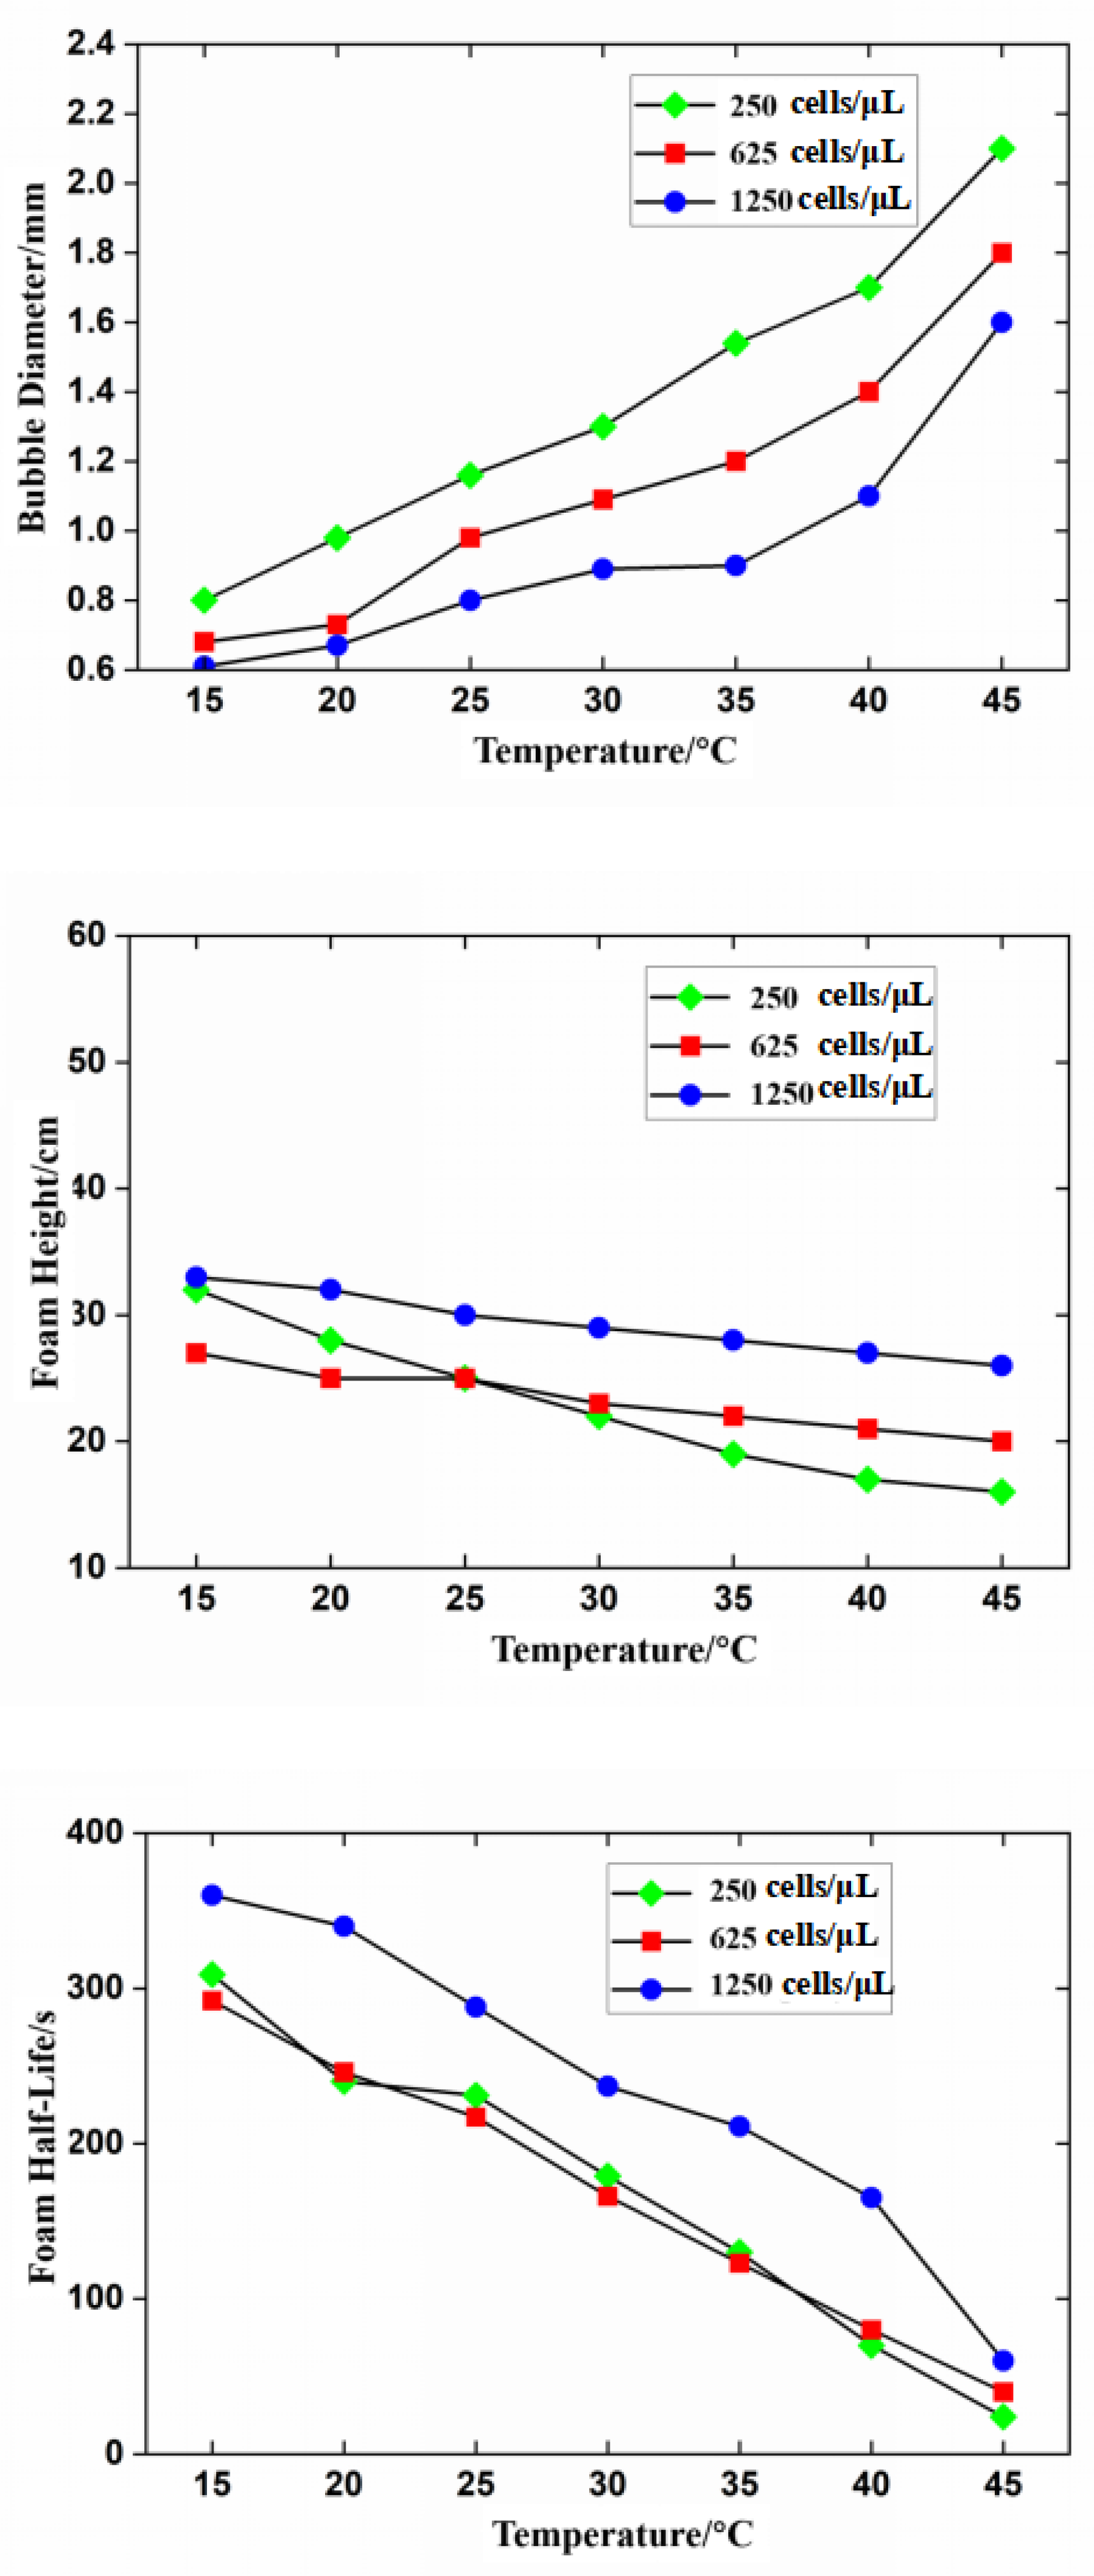
3.2. Effect of Temperature on Foam Stability

At an algal concentration of 250 cells/μL and temperatures of 15, 20, 25, 30, 35, 40, and 45 °C, foam images were collected at different vertical heights using an industrial camera to assess the foam layer height at flow equilibrium across various temperatures. The foam half-life and bubble diameter were measured. The results are presented in Figure 7.
At temperatures ranging from 15 to 45 °C, both the foam layer height and foam half-life decreased with increasing temperature, while the bubble diameter increased (Figure 6). This indicates a significant reduction in foam stability. Notably, the bubble diameter at 45 °C was ~2.63 times that at 15 °C, while the foam half-life exceeded 285 s at 15 °C compared with that at 45 °C. Additionally, the height of the foam layer at 45 °C was ~50% of that at 15 °C. At 15 °C, the foam layer height and foam half-life reached their maximum values, while the bubble diameter reached its minimum. The height of the foam layer at 45 °C was ~50% of that at 15 °C. This indicates that the foam collapsed faster at higher temperatures, resulting in larger bubble diameters. This trend was evident as the foam layer height rapidly decreased at higher temperatures.

3.3. Effect of Algal Concentration on Foam Stability

At a temperature of 25 °C, algal concentrations of 2.5, 25, 250, 625, and 1250 cells/μL were set to measure the foam layer height, foam half-life, and bubble diameter. This setup was used to analyze the changes in the foam layer height, foam half-life, and bubble diameter with the concentration of the algal species. The results are shown in Figure 8.
With increasing algal concentration, both the foam layer height and foam half-life increased, while the bubble diameter decreased [21] (Figure 8). Moreover, foam stability significantly increased with increasing algal concentration, indicating a significant positive correlation. As the algal concentration varied from 25 to 1250 μL, the foam half-life increased by 170 s, the foam layer height increased by 13 cm, and the bubble diameter decreased by 0.28 mm, representing a reduction of 31%.

3.4. Effect of Temperature on Foam Stability at Different Algal Concentrations

According to the previous experiments, further investigations were conducted to assess the variations in foam layer height, foam half-life, and bubble diameter with temperature across different algal concentrations. The results (Figure 9) revealed that at algal concentrations of 250, 625, and 1250 cells/μL, the foam layer height decreased from 32, 27, and 33 cm at 15 °C to 16, 20, and 26 cm at 45 °C. Similarly, the bubble half-life decreased from 309, 292, and 360 s at 15 °C to 24, 40, and 60 s at 45 °C, while the bubble diameter increased from 0.8, 0.68, and 0.55 mm at 15 °C to 2.1, 1.8, and 1.6 mm at 45 °C, respectively. These findings indicate that increased temperature led to a reduction in bubble stability across different algal concentrations.
In summary, the foam layer height and foam half-life exhibited a negative correlation with temperature. Conversely, the bubble diameter featured a positive correlation with temperature. Foam stability decreased with increasing temperature within the range tested in this experiment. At 15 °C, the foam stability was maximized across all algal concentrations. Particularly, the foam maintained significantly higher stability at higher algal concentrations compared with lower concentrations, consistent with the conclusions drawn from the one-way analysis.
To effectively elucidate the factors influencing foam stability, we conducted linear regression analysis on all experimental data. In this analysis, the foam layer height, foam half-life, and bubble diameter were treated as dependent variables, while temperature and algal concentration were considered independent variables. The regression equations were established (Equations (3)–(5)). Here, H represents foam layer height, t1/2 denotes foam half-life, d indicates bubble diameter, T denotes temperature, and C signifies algal concentration. The regression equation model of the foam characteristics was used to integrate the test variable factor values into the regression equations to calculate predicted values. The comparison between these predicted values and the actual values is shown in Figure 10, Figure 11 and Figure 12.
The regression equation for the foam layer height is given by Equation (3):
H = 28.568 0.318 T + 0.008 C R 2 = 0.83
Except for some singular points, the fluctuation range between the measured and predicted values of the foam layer height is less than 2.4 cm. The linear model exhibits an R2 value of 0.83 (Figure 10). This indicates that model accuracy meets the required standards, making it suitable for predicting and analyzing foam layer height.
Equation (4) represents the regression equation for foam half-life:
t 1 / 2 = 501.157 10.538 T + 0.050 C R 2 = 0.68
Most predicted and measured values of the foam half-life fluctuate within a range of less than 40 s (Figure 11). The linear model exhibits an R2 value of 0.68, indicating a fair level of prediction accuracy.
Equation (5) outlines the regression equation for bubble diameter:
d = 0.39 + 0.035 T 0.000419 C R 2 = 0.93
The fluctuation range of all predicted and measured values for bubble diameter is less than 0.1 mm. The linear model features an R2 value of 0.93, indicating a high level of prediction accuracy (Figure 12).

4. Discussion

The discharge of foam from coastal power plants into the sea is mainly caused by water flowing over the top of the overflow weir, which creates a suction effect in the siphon well. This process generates numerous bubbles, forming a foamy water flow. This prolonged collapse time of these bubbles enhances their stability and facilitates greater accumulation, contributing to the rich marine life surrounding the power plants. To prevent marine organisms from breeding in cooling water pipelines, chlorination and biocide treatments are implemented. Surface-active substances released from the remains of dead marine organisms treated with biocides further enhance bubble stability. Additionally, warmer water discharged from power plants or heated summer conditions promotes algal blooms and the release of surface-active substances, further enhancing foam stability. Consequently, a longer-lasting and denser foam is formed [22]. To investigate this phenomenon, we measured the liquid-phase viscosity and surface tension under different operating conditions (Figure 13).
The effect of temperature on these characteristics can be attributed to changes in the physicochemical properties of seawater [23,24]. Both the surface tension and liquid-phase viscosity of the seawater decreased with increasing temperature (Figure 13a). Particularly, the surface tension decreased from 0.093 to 0.077 N/m, representing a reduction of 17.2%, while the liquid-phase viscosity decreased from 11.13 to 5.65 mm2/s, indicating a decrease of 49.2%. Higher temperatures resulted in a reduction in the surface tension of the foam system, which enhanced foam stability. However, surface tension was not the dominant factor affecting foam stability. Instead, the significant reduction in liquid-phase viscosity at higher temperatures resulted in a rapid discharge of the liquid film, which facilitated the aggregation of bubbles and increased their size, thereby reducing foam stability. This suggests that at lower temperatures, foam rupture was mainly attributed to gas diffusion and foam aggregation. At higher temperatures, foam rupture was mainly caused by the rapid liquid discharge from the foam. The mechanism by which temperature affects foam stability involved two factors. First, higher temperatures reduced the adsorption of surface-active substances on the gas–liquid interface, thereby weakening the liquid film strength [25]. Second, increased temperatures reduced the solution viscosity, which accelerated the discharge rate. This combination resulted in reduced foam stability and promoted foam aggregation, leading to accelerated foam rupture. Therefore, power plants can utilize thermal radiation and other methods to increase temperatures and effectively eliminate foam [26,27].
The effect of algae on foam stability was mainly attributed to various mechanisms, such as the release of surface-active substances, an increase in solution viscosity, and a reduction in surface tension. With increasing algal concentration, the surface tension decreased, while the kinematic viscosity increased (Figure 13b). Particularly, the surface tension decreased from 0.11 to 0.085 N/m, representing a reduction of 22.7%, while the liquid-phase viscosity increased from 9.8 to 11.96 mm2/s, indicating an increase of 22%. Analysis of the foam composition in the tailwater revealed that the seawater responsible for foam formation contained numerous microorganisms, shellfish, and algae, which decomposed proteins after their death [8]. Additionally, with the introduction of biocides into the circulating water, shellfish, algae, microorganisms, and other organisms in the seawater were eliminated. Upon decay, these organisms decomposed into proteins, leading to an increase in organic matter in the seawater. This organic material modified the physicochemical properties of seawater, leading to a reduction in surface tension that facilitates foam formation and an increase in liquid-phase viscosity, thereby effectively enhancing foam stability [28,29,30]. In seawater rich in marine organisms, wind or waves can induce self-mixing of seawater with gas, forming resilient bubbles. The vortex effect within the fluid further contributed to foam formation, thereby enhancing foam stability and reducing its susceptibility to collapse [8]. Currently, power plants employ physical methods, such as interception and water-drenching methods, to manage foam [1,7]. However, these approaches are often ineffective owing to the physicochemical properties of the cooling water, such as higher viscosity and lower surface tension. Additionally, the presence of seabed residues and surface-active substances released from decomposed seabed organisms is not adequately addressed. Consequently, under favorable seawater temperatures or hydrodynamic conditions, foam can reform in areas distant from the outfall [7].

5. Conclusions

This study simulated the foam in the tailwater discharge area of a coastal power plant under laboratory conditions to analyze foam layer height, foam half-life, bubble diameter, surface tension, and viscosity. The stability and properties of the foam were evaluated across different temperatures and algal concentrations. Additionally, a regression model was developed through linear regression analysis. The key conclusions are summarized as follows:
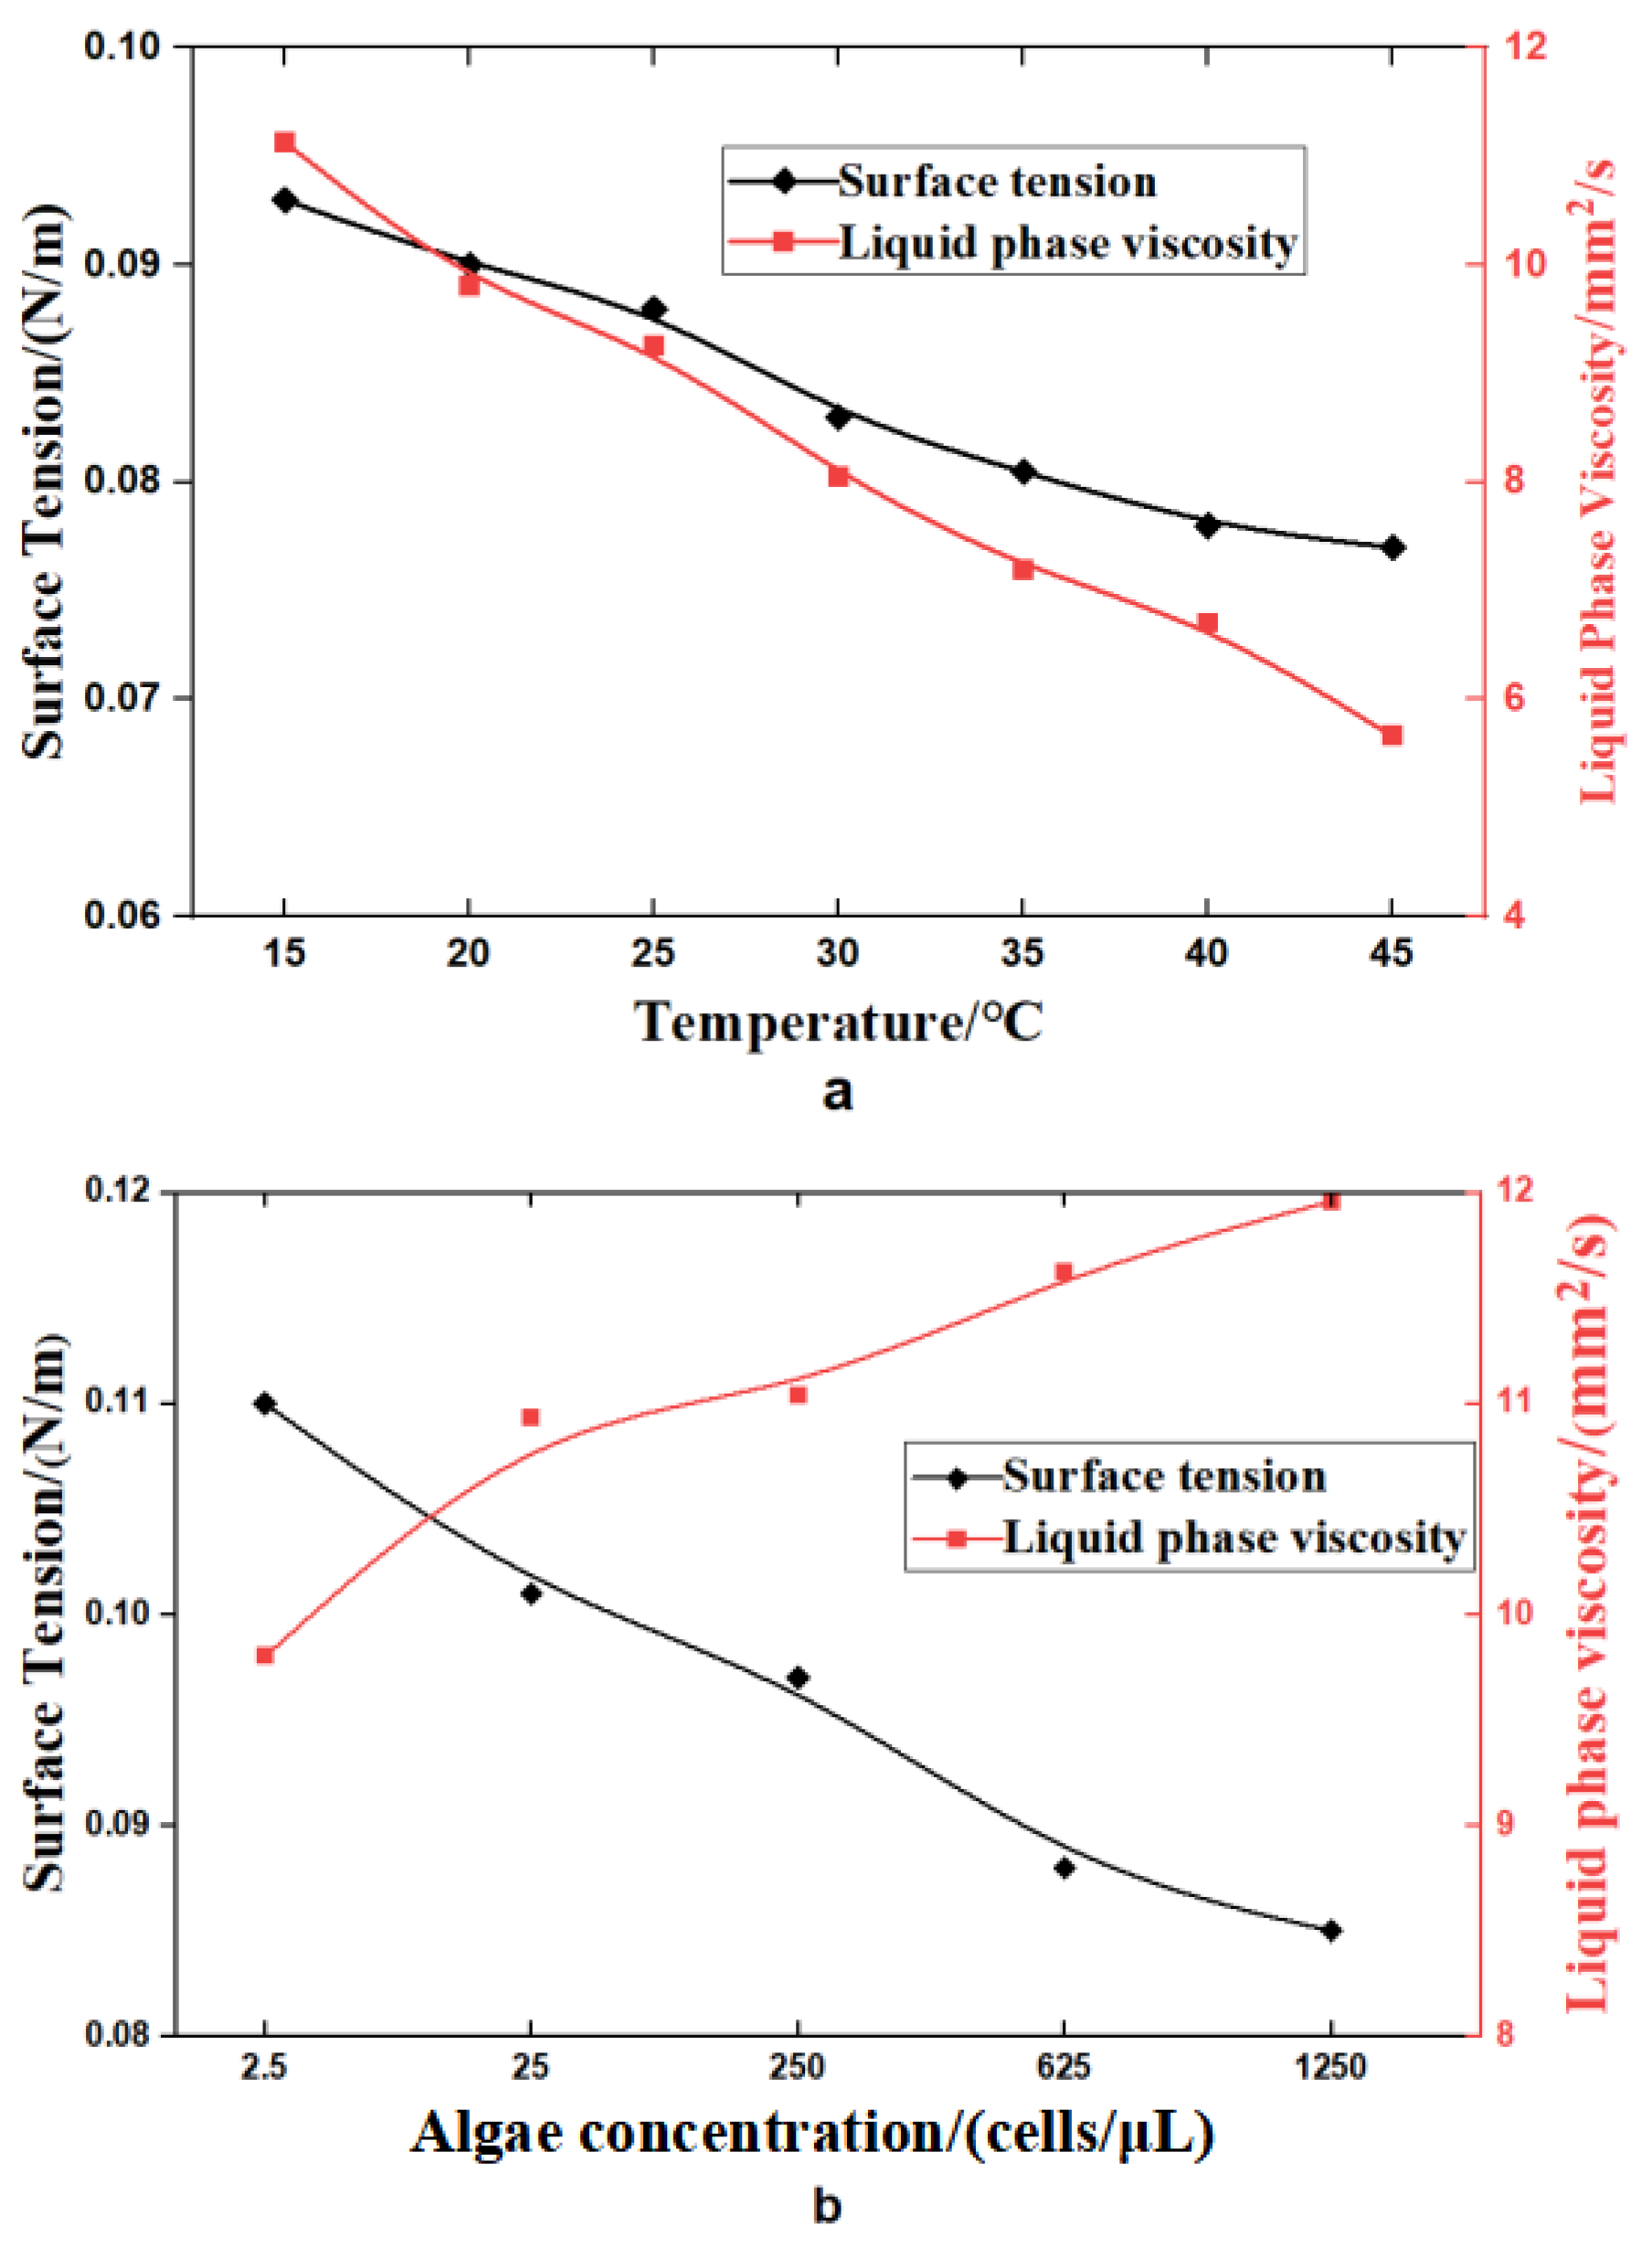
  • The effects of temperature and algal concentration on foam stability are mainly attributed to changes in the physicochemical properties of seawater. The viscosity of the seawater significantly decreases with increasing temperature, leading to a significant reduction in foam stability. Conversely, the surface tension significantly decreases with increasing algal concentration, which promotes the formation and stabilization of the foam.
  • Foam stability decreases with increasing temperature. In summer, the high water temperature in the power plant hinders foam dissipation, indicating that temperature is not the main factor affecting foam stability. Instead, the high temperatures at the cooling water outlet promote the growth and reproduction of marine organisms. This indicates that the persistent and dense foam downstream of the outfall is mainly due to algal blooms and the release of surface-active substances.
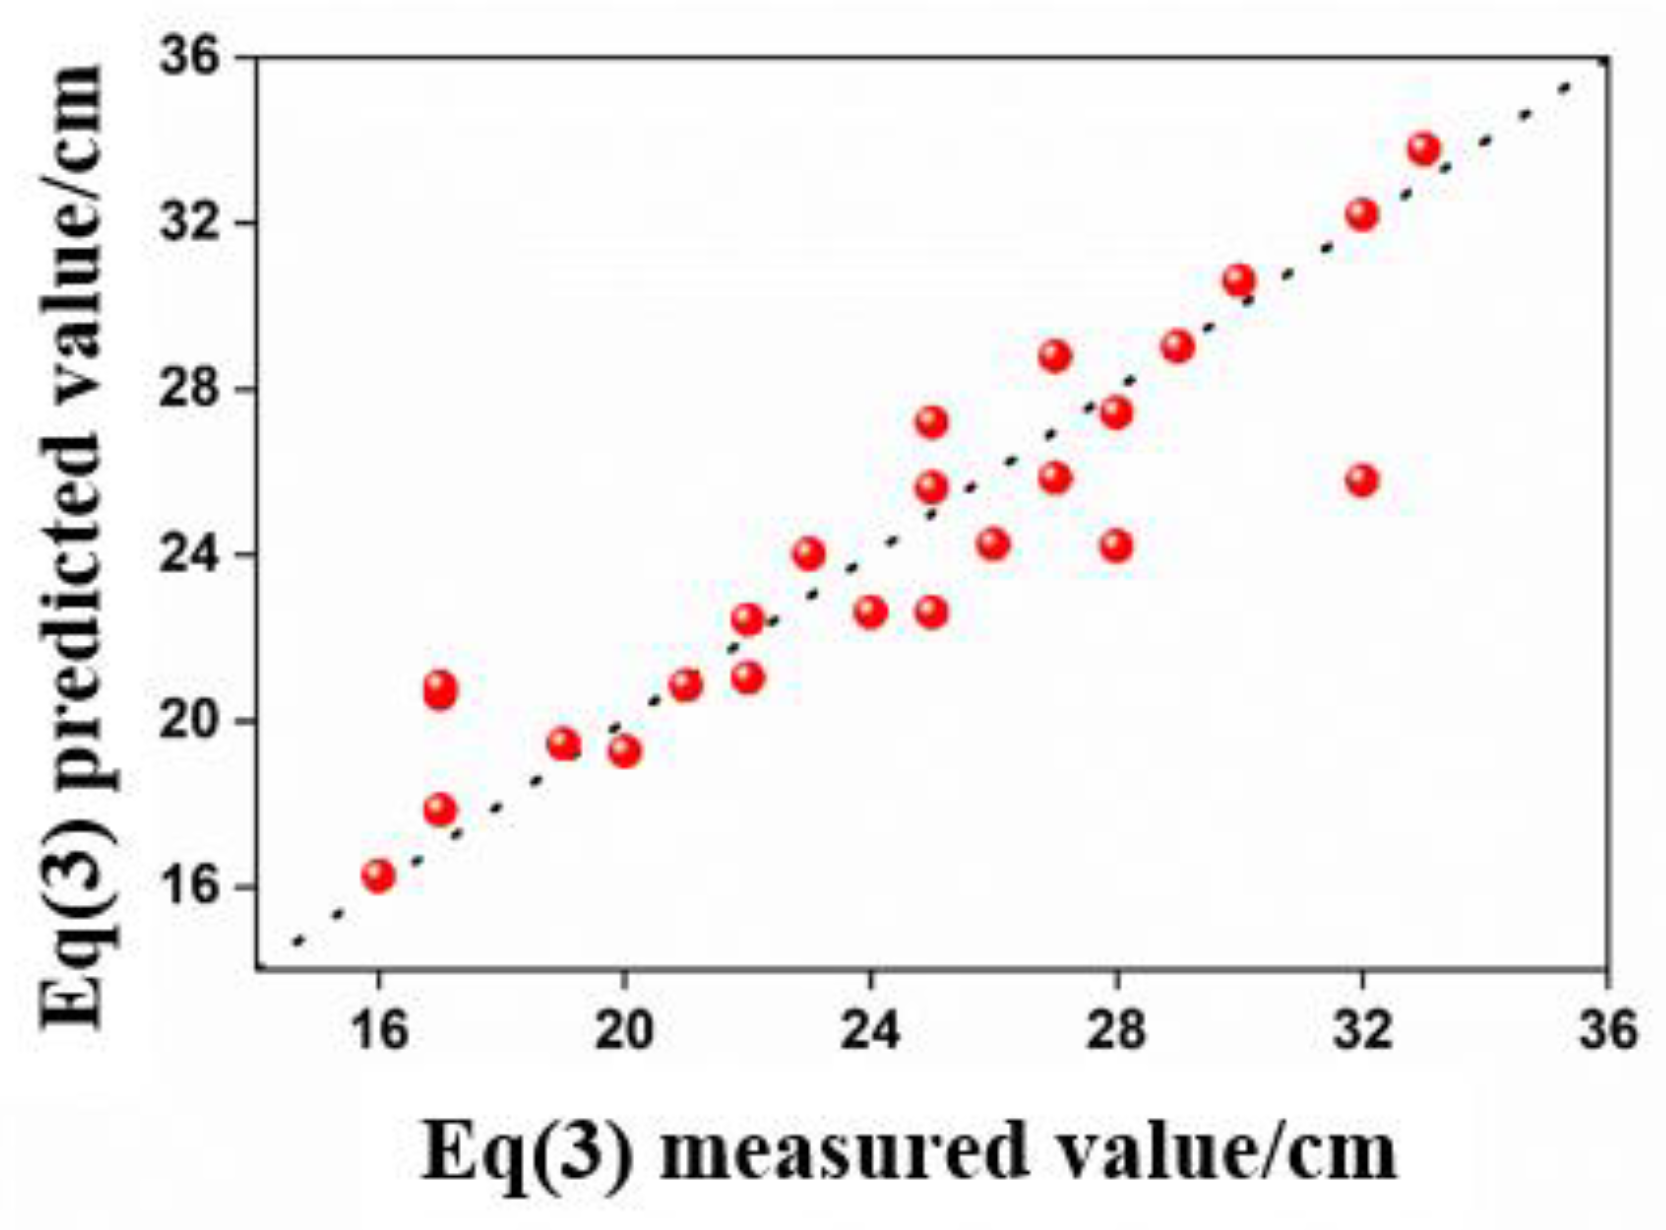
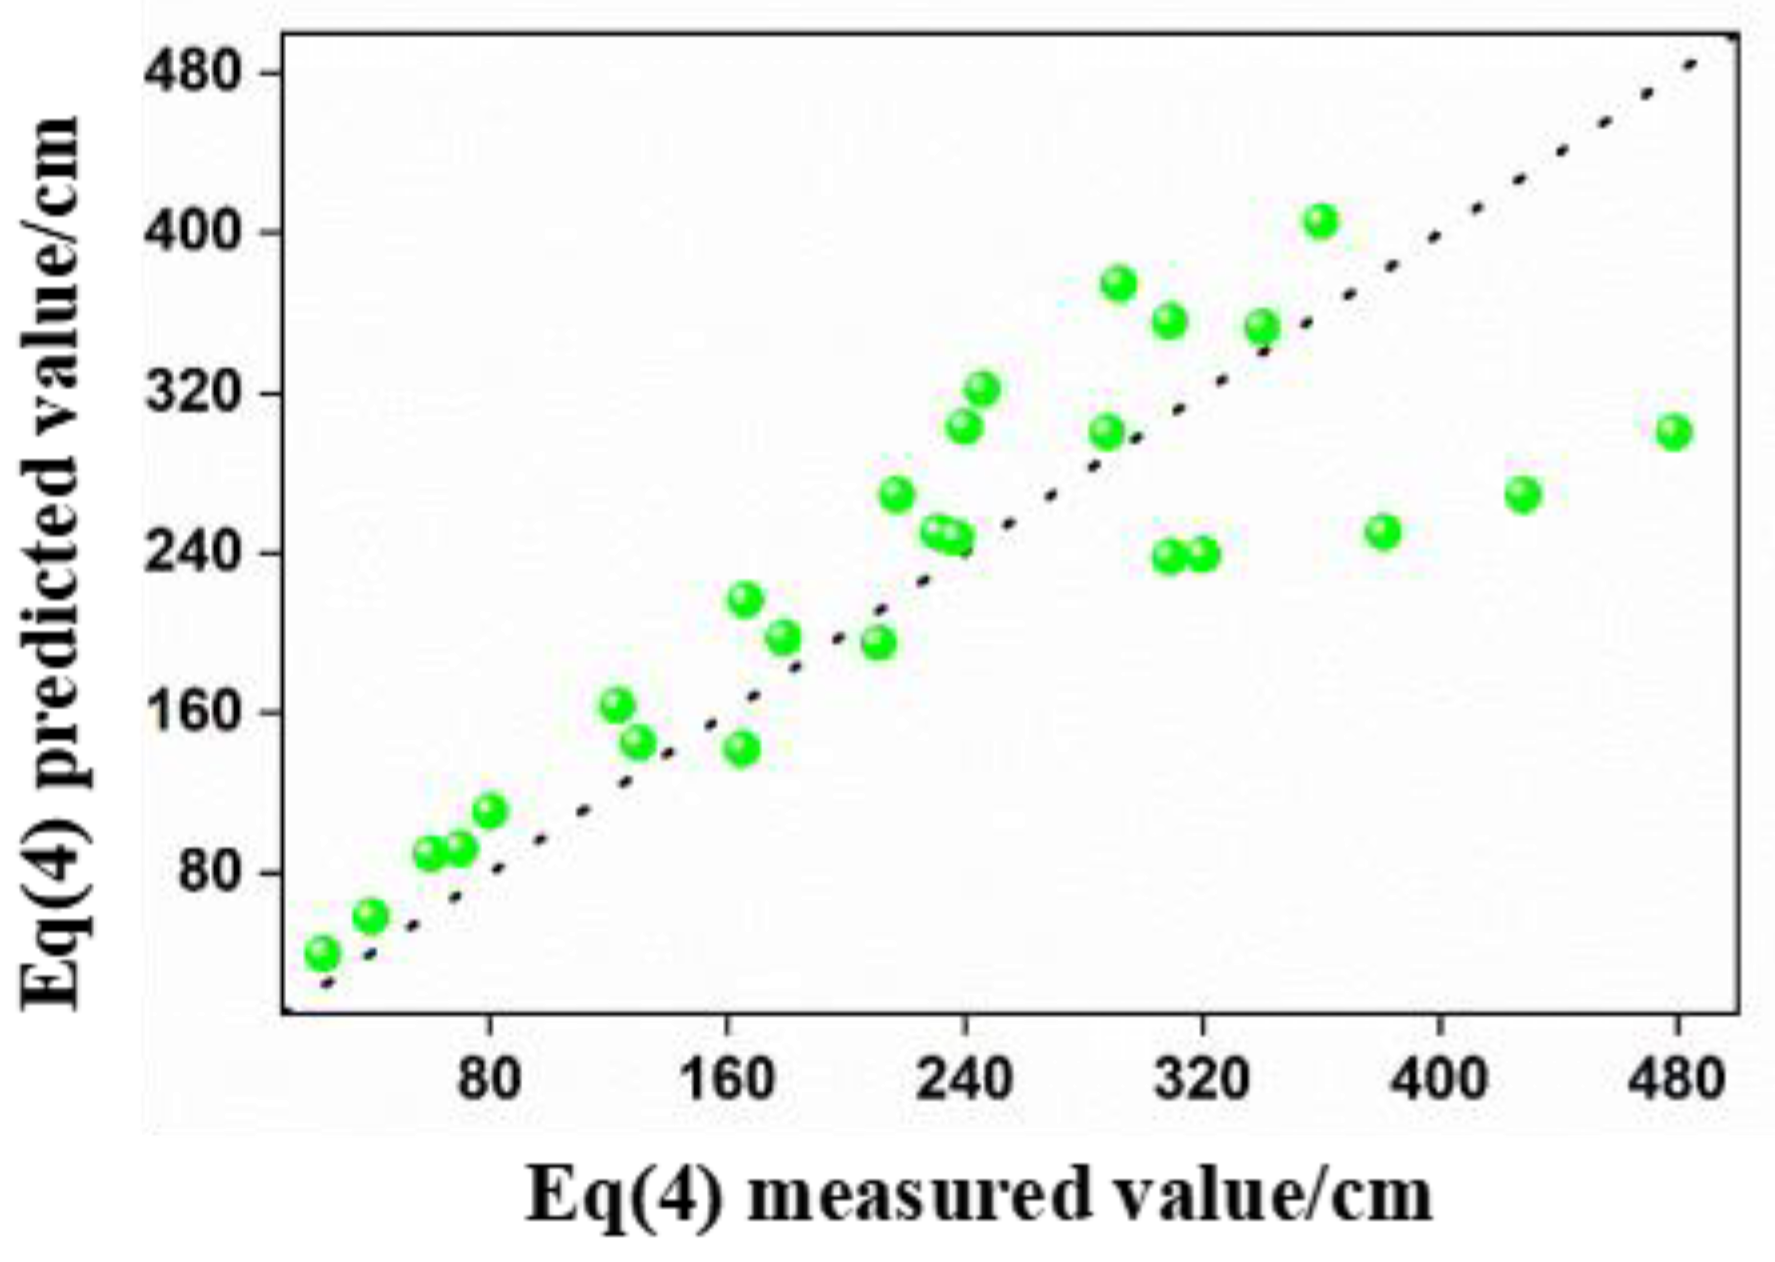
  • The regression models for predicting foam layer height and bubble diameter exhibit high accuracy, while the model for predicting foam half-life exhibits moderate accuracy. This study provides a strong basis for further research and prediction and presents methods for mitigating the adverse environmental impacts of foams on the surrounding sea area.
Through experiments and numerical simulation technology, this paper analyzes the reasons for the formation and disappearance of foam in the coastal power plant sea area, and explores the distribution characteristics of bubbles. However, in the future research, the following aspects need to be deepened and expanded:
  • By adding experimental conditions such as pH, ionic strength, and different types of protein polysaccharides, a more comprehensive understanding of the mechanism of bubble generation can be achieved, providing more accurate foam suppression optimization solutions for future engineering practices.
  • The existing simulation experimental equipment cannot express the complex marine environment (climate, lighting, ocean currents, etc.) of the discharge sea area. Therefore, it is considered to introduce more environmental parameters, such as water quality, meteorology, to more realistically simulate the impact of coastal power plant drainage on the surrounding sea area.

Author Contributions

Methodology, D.L.; formal analysis, L.S.; resources, L.G.; writing—original draft preparation, H.L.; writing—review and editing, X.C.; visualization, C.H. All authors have read and agreed to the published version of the manuscript.

Funding

This research was funded by [Guangdong Provincial Department of Science and Technology] grant number [2024A1111120010].

Informed Consent Statement

Not applicable.

Data Availability Statement

Study data is available upon reasonable request.

Acknowledgments

We would like to thank all of the interviewees who offered their time and expertise for this study and all individuals included in this section have consented to the acknowledgement.

Conflicts of Interest

Author Lubin Sun was employed by the company Guangdong No.3 Water Conservancy and Hydro-Electric Engineering Board Co., Ltd. The remaining authors declare that the research was conducted in the absence of any commercial or financial relationships that could be construed as a potential conflict of interest.

References

  1. Wang, X.; Zhu, X.; Zuo, S.; Mei, M. Application of Defoaming Agent in Seawater Circulating Cooling System of Coastal NPPs. Radiat. Prot. Bull. 2015, 35, 21–24. [Google Scholar]
  2. Hill, C.; Eastoe, J. Foams: From Nature to Industry. Adv. Colloid Interface Sci. 2017, 247, 496–513. [Google Scholar] [CrossRef]
  3. Stefani, F.; Salerno, F.; Copetti, D.; Rabuffetti, D.; Guidetti, L.; Torri, G.; Naggi, A.; Iacomini, M.; Morabito, G.; Guzzella, L. Endogenous Origin of Foams in Lakes: A Long-Term Analysis for Lake Maggiore (Northern Italy). Hydrobiologia 2016, 767, 249–265. [Google Scholar] [CrossRef]
  4. Kesaulya, I.; Leterme, S.C.; Mitchell, J.G.; Seuront, L. The Impact of Turbulence and Phytoplankton Dynamics on Foam Formation, Seawater Viscosity and Chlorophyll Concentration in the Eastern English Channel. Oceanologia 2008, 50, 167–182. [Google Scholar]
  5. Schippers, P.; Lürling, M.; Scheffer, M. Increase of Atmospheric CO2 Promotes Phytoplankton Productivity. Ecol. Lett. 2004, 7, 446–451. [Google Scholar] [CrossRef]
  6. Schilling, K.; Zessner, M. Foam in the Aquatic Environment. Water Res. 2011, 45, 4355–4366. [Google Scholar] [CrossRef]
  7. Oh, S.-H.; Oh, Y.M.; Kim, J.-Y.; Kang, K.-S. A Case Study on the Design of Condenser Effluent Outlet of Thermal Power Plant to Reduce Foam Emitted to Surrounding Seacoast. Ocean Eng. 2012, 47, 58–64. [Google Scholar] [CrossRef]
  8. Kováts, P.; Thévenin, D.; Zähringer, K. Influence of Viscosity and Surface Tension on Bubble Dynamics and Mass Transfer in a Model Bubble Column. Int. J. Multiph. Flow 2020, 123, 103174. [Google Scholar] [CrossRef]
  9. Huang, X.; Sun, Q.; Chen, X.; Wang, Z.; Mao, J. Research Progress on the Enhancement of Protein Foaming Properties by Plant Polyphenols. J. Food Saf. Qual. Insp. 2024, 15, 220–228. [Google Scholar]
  10. Tan, B.; Wang, Q.; Zheng, X.; Liu, J.; Yang, B.; Shen, W. Foam motion modeling simulation and stability experiments of printing paste foam. Wool Text. J. 2024, 52, 26–32. [Google Scholar]
  11. Li, X. Structural Characterization and Ultrasonic Modification of a Wheat-Derived Protein Affecting Beer Foam Properties. Master’s Thesis, Shandong Agricultural University, Tai’an, China, 2024. [Google Scholar]
  12. Zhao, Y. Study on Stability Regulation and Application of Buckwheat Protein—Based Pickering Foam. Master’s Thesis, Jilin Agricultural University, Changchun, China, 2024. [Google Scholar]
  13. Luo, H.; Gao, J.; Liu, J.; Sun, T. Chemical Process and Application of Continuous Foam Drainage Gas Production in Low Production Gas Wells. Contemp. Chem. Ind. 2024, 53, 1585–1589. [Google Scholar]
  14. Xu, J.; Zhu, Y.; Xu, X.; Bao, H. Study on multidimensional evaluation method of foam performance of daily chemicals. China Surfactant Deterg. Cosmet. 2022, 52, 506–513. [Google Scholar]
  15. He, Z. Study on Foam Stabilization Mechanism of Janus Nanoparticles in Porous Media. Master’s Thesis, Xi’an Shiyou University, Xi’an, China, 2022. [Google Scholar]
  16. Narsimhan, G.; Xiang, N. Role of proteins on formation, drainage, and stability of liquid food foams. Annu. Rev. Food Sci. Technol. 2018, 9, 45–63. [Google Scholar] [CrossRef]
  17. Li, L.; Ma, F.; Zhai, X.; Yang, W.; Ye, P.; Liu, Y. Analysis on the key factors for the population evolution and early warning of harmful algal blooms based on an algal bloom in Shenzhen bay, the South China Sea. Ecol. Sci. 2022, 41, 82–89. [Google Scholar]
  18. Wu, Y.; Fu, Y.; Zhang, Y.; Pu, X.; Zhou, C. Phytoplankton distribution and its relation to the runoff in the YANGZTE estuary. Oceanol. Limnol. Sin. 2004, 246–251. [Google Scholar]
  19. Wang, J.; Nguyen, A.V.; Farrokhpay, S. A critical review of the growth, drainage and collapse of foams. Adv. Colloid Interface Sci. 2016, 228, 55–70. [Google Scholar] [CrossRef]
  20. Han, J.; Li, Y.; Chen, P. Research progress on phenomenon and mechanism in flotation froth phase. Nonferrous Met. Miner. Process. Sect. 2023, 17–28. [Google Scholar]
  21. Nguyen, A.V.; Phan, C.M.; Evans, G.M. Effect of the Bubble Size on the Dynamic Adsorption of Frothers and Collectors in Flotation. Int. J. Miner. Process. 2006, 79, 18–26. [Google Scholar] [CrossRef]
  22. Lin, H.; Liu, D.; Huang, B.; Cheng, X.; Sun, L.; Yin, X. Study of siphon well drainage foam in coastal power plant. China Water Transp. 2023, 23, 64–66. [Google Scholar]
  23. Wang, H.; Guo, W.; Zheng, C.; Wang, D.; Zhan, H. Effect of Temperature on Foaming Ability and Foam Stability of Typical Surfactants Used for Foaming Agent. J. Surfactants Deterg. 2017, 20, 615–622. [Google Scholar] [CrossRef]
  24. Oetjen, K.; Bilke-Krause, C.; Madani, M.; Willers, T. Temperature Effect on Foamability, Foam Stability, and Foam Structure of Milk. Colloids Surf. A Physicochem. Eng. Asp. 2014, 460, 280–285. [Google Scholar] [CrossRef]
  25. Schwenzfeier, A.; Lech, F.; Wierenga, P.A.; Eppink, M.H.; Gruppen, H. Foam Properties of Algae Soluble Protein Isolate: Effect of pH and Ionic Strength. Food Hydrocoll. 2013, 33, 111–117. [Google Scholar] [CrossRef]
  26. Tang, S.; Shang, Z.; Huang, H.; Zhang, Y. Ecological impacts of coastal power plants associated with once-through cooling in China and mitigation: A preliminary evaluation. J. Appl. Oceanogr. 2020, 39, 590–599. [Google Scholar]
  27. Li, J. Influence factors and control measures to the foam at drainage outlet of cooling water in coastal power plant. Guangdong Chem. Ind. 2021, 48, 128, 150. [Google Scholar]
  28. Wang, Q.; Xi, H.; Zuo, Y. Review on measurement techniques of performance and influence factors of stability for foam. Energy Chem. Ind. 2007, 25–30. [Google Scholar]
  29. Zhao, X. Summary of foam stability. Drill. Fluid Complet. Fluid 1992, 9, 7–14+23+2. [Google Scholar]
  30. Wang, M.; Chang, Z.; Xi, H.; Zuo, Y.; Liu, H.; Li, W. Advances of Research and Measurement of Stability of Aqueous Foam. Chem. Ind. Eng. Prog. 2005, 24, 723–728. [Google Scholar]
Figure 1. Technology roadmap.
Coasts 05 00009 g001
Figure 2. Bubble stability experimental device. 1 Measuring cylinder; 2 Insulation; 3 Flat plate light source; 4 Industrial camera; 5 Computer; 6 Gas distributor; 7 Water bath inlet; 8 Water bath outlet; 9 Thermostatic bath; 10 Air pump; 11 Check valve; 12 Gas flow meter.
Coasts 05 00009 g002
Figure 3. Experimental photos.
Coasts 05 00009 g003
Figure 4. Schematic diagram for measuring the long and short axes of bubbles.
Coasts 05 00009 g004
Figure 5. Bubble size varies with vertical height.
Coasts 05 00009 g005
Figure 6. Structure and components of foam.
Coasts 05 00009 g006
Figure 7. Effect of temperature on foam layer height, foam half-life and bubble diameter.
Coasts 05 00009 g007
Figure 8. Effects of algal concentration on foam layer height, foam half-life and bubble diameter.
Coasts 05 00009 g008
Figure 9. Variation curve of foam layer height, foam half-life and bubble diameter with temperature under different algal concentrations.
Coasts 05 00009 g009
Figure 10. Comparison diagram of predicted and measured foam layer height.
Coasts 05 00009 g010
Figure 11. Comparison diagram of predicted and measured foam half-life.
Coasts 05 00009 g011
Figure 12. Comparison diagram of predicted and measured bubble diameter.
Coasts 05 00009 g012
Figure 13. Influence of temperature and algal concentration on the surface tension and liquid-phase viscosity of seawater. (a) the effect of temperature on the surface tension and liquid-phase viscosity; (b) the effect of algae concentration on the surface tension and liquid-phase viscosity.
Coasts 05 00009 g013
Table 1. Experimental conditions and results.
Experiment No.Temperature (°C)Algae Concentration (cells/μL)Foam Layer Height (cm)Foam Half-Life (s)Bubble Diameter (mm)
115250323090.8
220250282400.98
325250252311.16
430250221791.3
535250191301.54
64025017701.7
74525016242.1
8252.5173091.3
92525173201.23
1025250243811.16
1125625254280.98
12251250304790.8
1315625272920.68
1420625252460.73
1525625252170.98
1630625231661.09
1735625221231.2
184062521801.4
194562520401.8
20151250333600.55
21201250323400.67
22251250302880.8
23301250292370.89
24351250282110.9
25401250271651.1
2645125026601.6
Disclaimer/Publisher’s Note: The statements, opinions and data contained in all publications are solely those of the individual author(s) and contributor(s) and not of MDPI and/or the editor(s). MDPI and/or the editor(s) disclaim responsibility for any injury to people or property resulting from any ideas, methods, instructions or products referred to in the content.

