Article

Changes in Seagrass Landscape Configuration in a Caribbean Reef Lagoon Indicate an Ecosystem Shift After Repeated Disturbances

by
S. Valery Ávila-Mosqueda
1,*,
Brigitta I. van Tussenbroek
1,* and
Joaquín Rodrigo Garza-Pérez
2
1
Unidad Académica de Sistemas Arrecifales, Instituto de Ciencias del Mar y Limnología, Universidad Nacional Autónoma de México, Puerto Morelos 77580, Mexico
2
Unidad Multidisciplinaria de Docencia e Investigación Sisal, Facultad de Ciencias, Universidad Nacional Autónoma de México, Puerto de Abrigo S/N, Sisal 97356, Mexico
*
Authors to whom correspondence should be addressed.
Submission received: 25 September 2024 / Revised: 1 January 2025 / Accepted: 31 January 2025 / Published: 11 February 2025

Abstract

:
Since 2011, recurring Sargassum Brown Tides (SBTs), caused by periodic massive influxes of holopelagic Sargassum spp., have impacted seagrass meadows in the 50–200 m wide nearshore fringes of Mexican Caribbean reef lagoons. The present study aimed to assess the cumulative effects of SBTs in 2015 and 2018–2019 through a spatial–temporal analysis of seagrass meadows in the Puerto Morelos reef lagoon. We hypothesized that the impacts of the SBTs likely extended beyond the near-shore fringe and were detectable across the seagrass landscape throughout the entire reef lagoon. Through time, the spatial configuration of the seagrass meadows presented a new self-organized configuration linked to spatial fragmentation, an increase in the number of patches but a decrease in size, and changes in vegetation communities, indicating a shift in ecosystem state. This shift may serve as an early warning signal of reef system deterioration. Monitoring seagrass meadow status using this approach provides a deeper understanding of their dynamics, shifts and resilience, and will facilitate the development of timely management strategies.

1. Introduction

Seagrass meadows are marine vegetation communities in coastal zones around the world. They provide important ecosystem services, such as carbon capture and storage [1], serve as a refuge and a source of nourishment for juvenile stages of commercially important species [2] and enhance coastal stability through wave attenuation and sediment retention [3]. In the Caribbean, seagrass meadows cover the sandy bottoms of shallow reef lagoons. Calm waters and high solar irradiation promote their development [4].
The aerial extent and structure of seagrass meadows have changed globally over the last few decades, mainly due to human activities [5,6]. Seagrass meadows in the Caribbean have followed this global trend [4]. Periodic massive influxes of holopelagic Sargassum spp. (sargassum from hereon) since 2011 [7] and the Sargassum Brown Tides (SBTs) caused by these massive influxes have increased the pressure on the Caribbean coastal ecosystems [8]. SBTs are generated by decomposition of beached sargassum as the resultant leachates and particulate organic matter (POM) turn nearshore waters brown [8,9]. A SBT causes hypoxia or anoxia, resulting in partial or total loss of the benthos in near-shore fringing zones (~50–200 m wide), including the seagrasses [8,10]. Depending on the site and recurrence frequency of the SBTs, the seagrass meadows in the near-shore fringes can shift towards communities from slow-growing robust seagrass species towards a community dominated by algae or pioneer seagrass species with high epiphytic algal loads [8].
Although the impact of the SBTs on seagrass meadows closest to the shoreline is evident, the influence of these brown tides most likely extends much further into the reef system, as particulate organic material and contaminants (nutrients, metals) are likely distributed kms offshore [10,11], amongst others decreasing water transparency [8].
Since the identification of floating sargassum as a threat to coastal systems’ integrity along the Caribbean, there has been numerous efforts focused on the identification of floating sargassum mats using a variety of remote sensing platforms, the prediction of their trajectories and the quantification of the beached sargassum [12,13,14,15,16,17] but almost none focused on the identification of the derived SBTs [18,19].
Remote sensing analysis using satellite images is a useful tool to understand benthic habitats at large landscape scales [20,21]. Such an approach may aid in discerning the possible impact of the recurring SBTs on seagrass meadows beyond the near-shore fringe.
For seagrass meadows in general, remote sensing analysis can provide valuable insights into the ecosystems, such as the classification of key community components [22], quantification of blue carbon stocks [23], monitoring changes in seagrass communities over long time periods at large spatial scales [24] and identification of priority sites for conservation [25], among other applications.
However, it is essential to understand the properties and limitations of satellite imagery to use it effectively for each specific research objective [26]. Satellite images vary in spatial, temporal, spectral, and radiometric resolution, depending on the sensor [20,22,24]. Examples include sensors like SPOT, IKONOS, QuickBird, WorldView-2, Sentinel-2, and Planet Scope. If the goal is to map large areas without focusing on the components of the seafloor, a Landsat image with a 30 × 30 m spatial resolution may suffice [27]. However, if the objective is to characterize the seafloor’s components in detail, sensors like Sentinel-2 or PlanetScope may be more suitable [22,24].
These properties are continuously evolving, and advances in satellite imagery now make it easier to obtain high-quality images that enhance our understanding of ecosystems [26]. Nevertheless, fully leveraging the benefits of any sensor remains challenging, and achieving optimal results depends on careful analysis and consensus [26].
Furthermore, it is important to recognize that seagrass meadows are complex and dynamic ecosystems, making it difficult to map various properties accurately [28]. Some of the key limitations of using satellite imagery for studying these ecosystems include challenges in turbid waters [29], and deeper environments (e.g., greater than 20 m) [27], the difficulty of identifying patchy or isolated meadows [25] and the challenge of classifying different algae and seagrass species within the same meadow [30].
Theoretical studies have shown that changes in the spatial characteristics of a system could provide early warning signs of approaching nonlinear transitions [31,32,33], but empirical studies that support such theoretical early warning signs are limited [34]. Seagrass ecosystems are maintained by positive feedbacks and complex interactions between seagrass plants, algae, animals, environmental factors, etc., presenting abrupt unexpected shifts in ecosystem state preluded by changes in spatial heterogeneity [35,36].
The present study evaluates the changes in the configuration of the landscape seagrass meadows in a Mexican Caribbean reef lagoon through time and how the components of the bottom evolve after repeated disturbances by recurring SBTs. We hypothesize that the impacts by the SBTs could be detectable as changes in the spatial heterogeneity of the seagrass meadow beyond the near-shore zone, possibly indicating an ecosystem shift in the reef lagoon and an early warning sign of deterioration.

2. Materials and Methods

2.1. Study Site

The Puerto Morelos reef lagoon, in the northeastern part of the Yucatan Peninsula, is bordered on the seaside by a fringing reef, and on the landside by a beach–dune system that separates the mangrove marshlands from the sea.
The lagoon has a mean depth of ~3–4 m [20]. The bottom of the lagoon is composed of carbonate sediments covered by seagrass meadows consisting of Thalassia testudinum, Syringodium filiforme and Halodule wrightii, along with rhizophytic algae such as Halimeda spp., Penicillus spp. and Udotea spp. [37]. Tidal differences are small with a mean tidal range of ~0.17 m [38]. The seagrass meadows are interspersed with patches of corals and octocorals [37].
The study area is located between 20°50’27.16”N, 86°52’32.63”W and 20°52’3.76”N, 86°51’18.55”W and encompasses 244 hectares (Figure 1).

2.2. Sargassum Brown Tides (SBTs)

The first Sargassum Brown Tides (SBTs) were reported from July to October 2015 [39], followed by major influx seasons during 2018 and 2019 [40].
From June 2018 to November 2018 and May to October 2019, spatial assessment of the extent of Sargassum Brown Tides (SBTs) and onshore sargassum accumulations was evaluated during predicted sargassum-influx seasons (by SaWS; https://optics.marine.usf.edu/projects/saws.html, accessed on 20 June 2019), using 12 Planet satellite images from Planetscope constellation (one image per month, all provided by Planet.com) employing a k-means Cluster Analysis algorithm in SNAP 9.0.0 software, analyzed and edited in ArcGIS 10.8.2. The presence of sargassum on the shore and SBTs was confirmed for a beach section monitored with a video-monitoring system (https://sammo.icmyl.unam.mx/cam1.php, accessed on 22 June 2019, see also [41]) and occasional beach verification and sampling [42].
Each image has a spatial resolution of 3 m per pixel, and a spectral resolution of 4 bands (NIR, red, green and blue). Imagery has radiometric and sensor corrections, orthorectification and is projected to a UTM projection (Planet.com).
The approximate distance encompassing the greatest effects of the SBTs over the seagrass meadows at Puerto Morelos is a ~150–200 m wide fringe along the shoreline [8]. Based on this fringe width, the unsupervised classifications were cropped from the shoreline to the first 200 m using a shapefile mask for the analysis.
Two classes were determined: S1 SBT as indicated by brown water and S2 sargassum accumulated on the beach and in nearshore water (light brown, red or golden color) [43].
The SBT class was converted to a shapefile, and the covered area (m2), mean length (m) and max length (m) were obtained for each image. A Mann–Whitney U test was applied due to the non-normality of the data [44] to assess differences between 2018 and 2019.

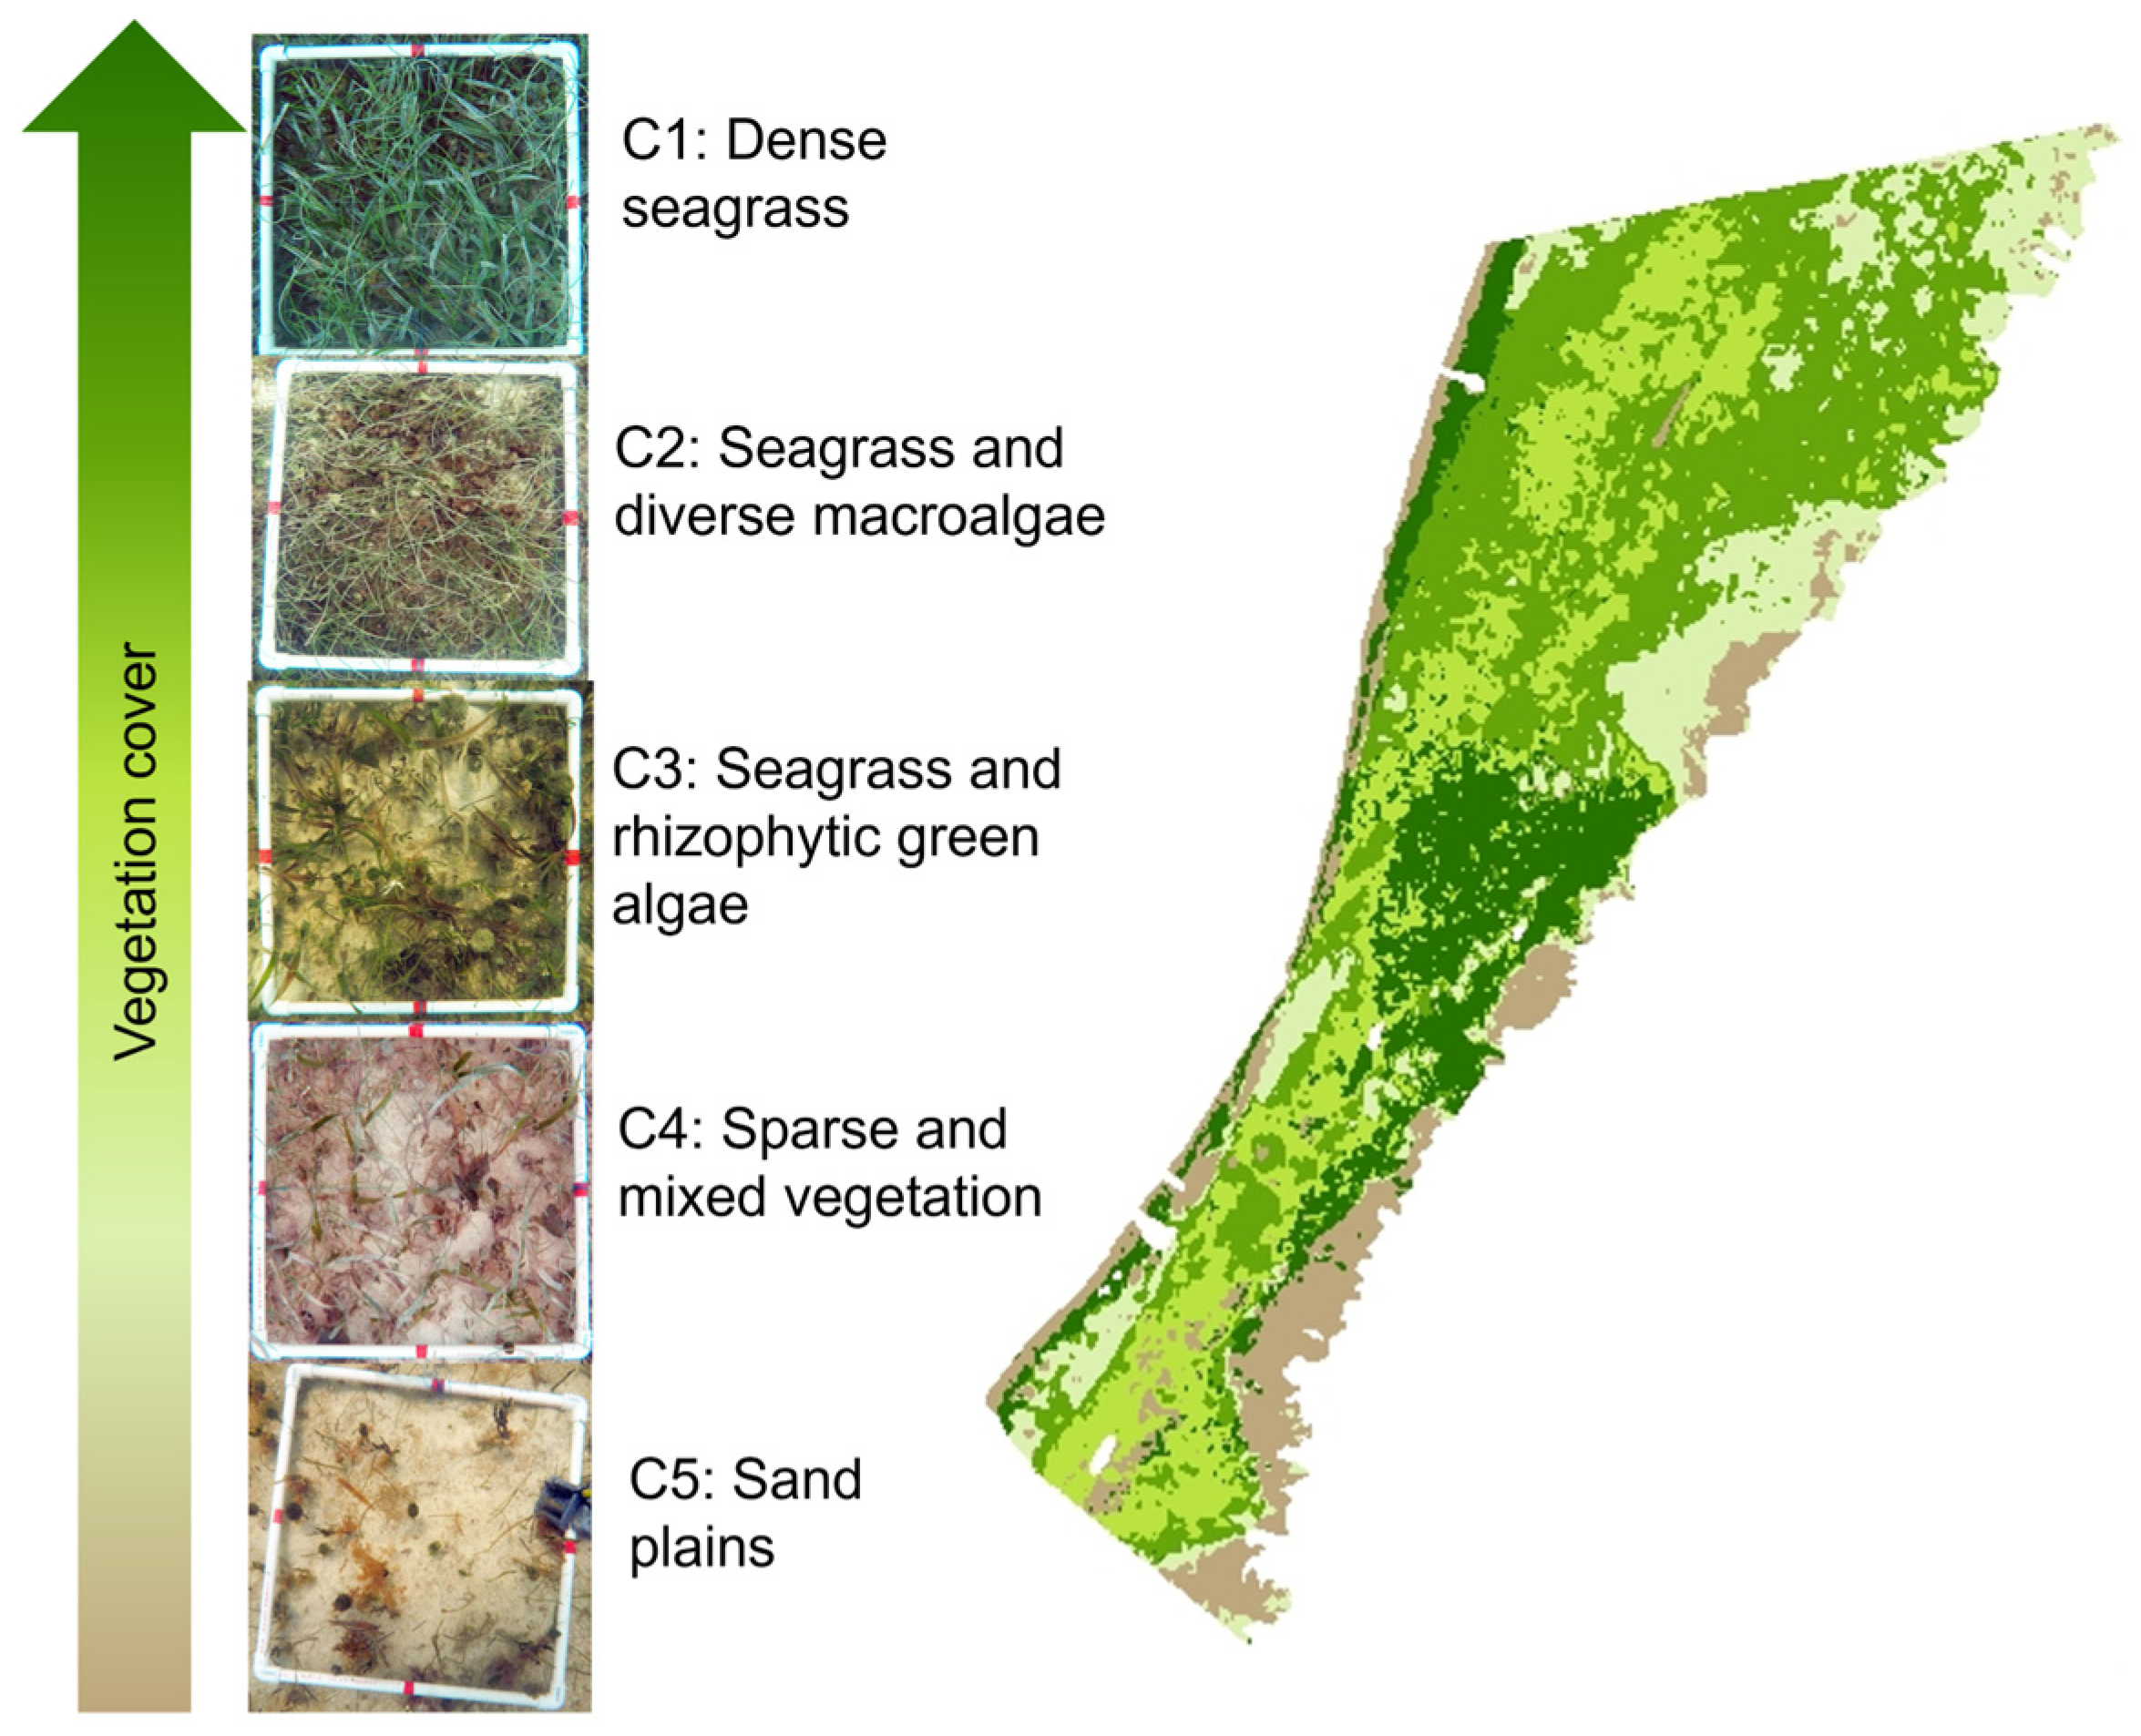
2.3. Thematic Maps of Seagrass Meadows

A total of eight satellite images were selected including three PlanetScope images from February 2020, February 2018, and December 2017, and five RapidEye images from February 2017, December 2015, April 2015, and April 2014. The images were processed using ENVI (5.3 L3 Harris Melbourne, Florida, USA) and ArcMap 10.8.2 (ESRI Inc.) The RapidEye images have a spatial resolution of 5 × 5 m per pixel and the same corrections as PlanetScope images (Planet.com)
The RapidEye images were resampled from 5 × 5 m to 3 × 3 m using the nearest neighbor function and then co-registered as ENVI (5.3 L3 Harris). Afterwards, the new images were masked using a vector shapefile to exclude land and boats and focus only on the area of interest (AOI). AOIs were preprocessed with the technique for correcting the effect of light extinction in the water column [45] (Figure S1).
Ground truth data, using a sampling design of 120 sites across the area, were collected by the end of 2019 to characterize the lagoon bottom. At each site, a 0.5 × 0.5 m section of the bottom, delimited by a PVC quadrant, was photographed using a GoPro Hero 4 Black (USA) camera with narrow lens mode. The percentages of vegetation cover (%) of were estimated by displaying the photographs on a high-resolution monitor and using a systematic grid of 21 points over each photograph. Seagrasses and algae in the photographs were identified using [46,47].
A hierarchical cluster analysis (Figure S2) was conducted to develop a classification scheme consisting of five classes (bottom types). A resemblance matrix was first constructed using the Bray–Curtis similarity coefficient [48] based on the percentage cover estimates for each photograph. This matrix served as the input for the clustering process, which was performed using PRIMER v7 software [49].
Supervised classification using the 120 sites (80% for training and 20% for accuracy assessment) and the maximum likelihood algorithm was applied to the 2020 image using ENVI (5.3 L3 Harris). To classify the images from previous years (back to 2014), the classified image from 2020 was overlapped with the image from 2018 and used to generate 120 training sites for the other images (backwards from 2018 to 2014) (Figures S3 and S4). The training points for each class were extracted from those areas that did not show a class change through time. Each thematic map was evaluated using the confusion matrix and kappa index using ENVI (5.3 L3 Harris) and the thematic maps were edited in ArcGis 10.8.2 (ESRI Inc.).

2.4. Near-Shore Seagrass Meadows

From each thematic map, a 150 m wide belt along the coast was extracted to assess the most impacted zone and carry out a spatial–temporal analysis of the highly impacted near-shore fringe.

2.5. Landscape Analysis

A majority filter (8 neighbors’ rule) was applied to each classified image to smooth and minimize the salt-and-pepper effect on spatial patterns [50] and to obtain more uniform patches for the landscape analysis using ArcGis 10.8.2 (ESRI Inc.). The spatial heterogeneity of the seagrass meadows was quantified by obtaining fragmentation metrics of classes, patch, and landscape, using Fragstats 4.2 [51] (Table 1). The Largest Patch Index was determined as the largest patch (from the same class) that accomplishes the 8 neighbor rules. Afterwards, a Kruskall–Wallis test analysis was applied due to the non-normality of the data to test for differences in the number of patches between years [44] using R studio software (RStudio 2024.04.2+764).

3. Results

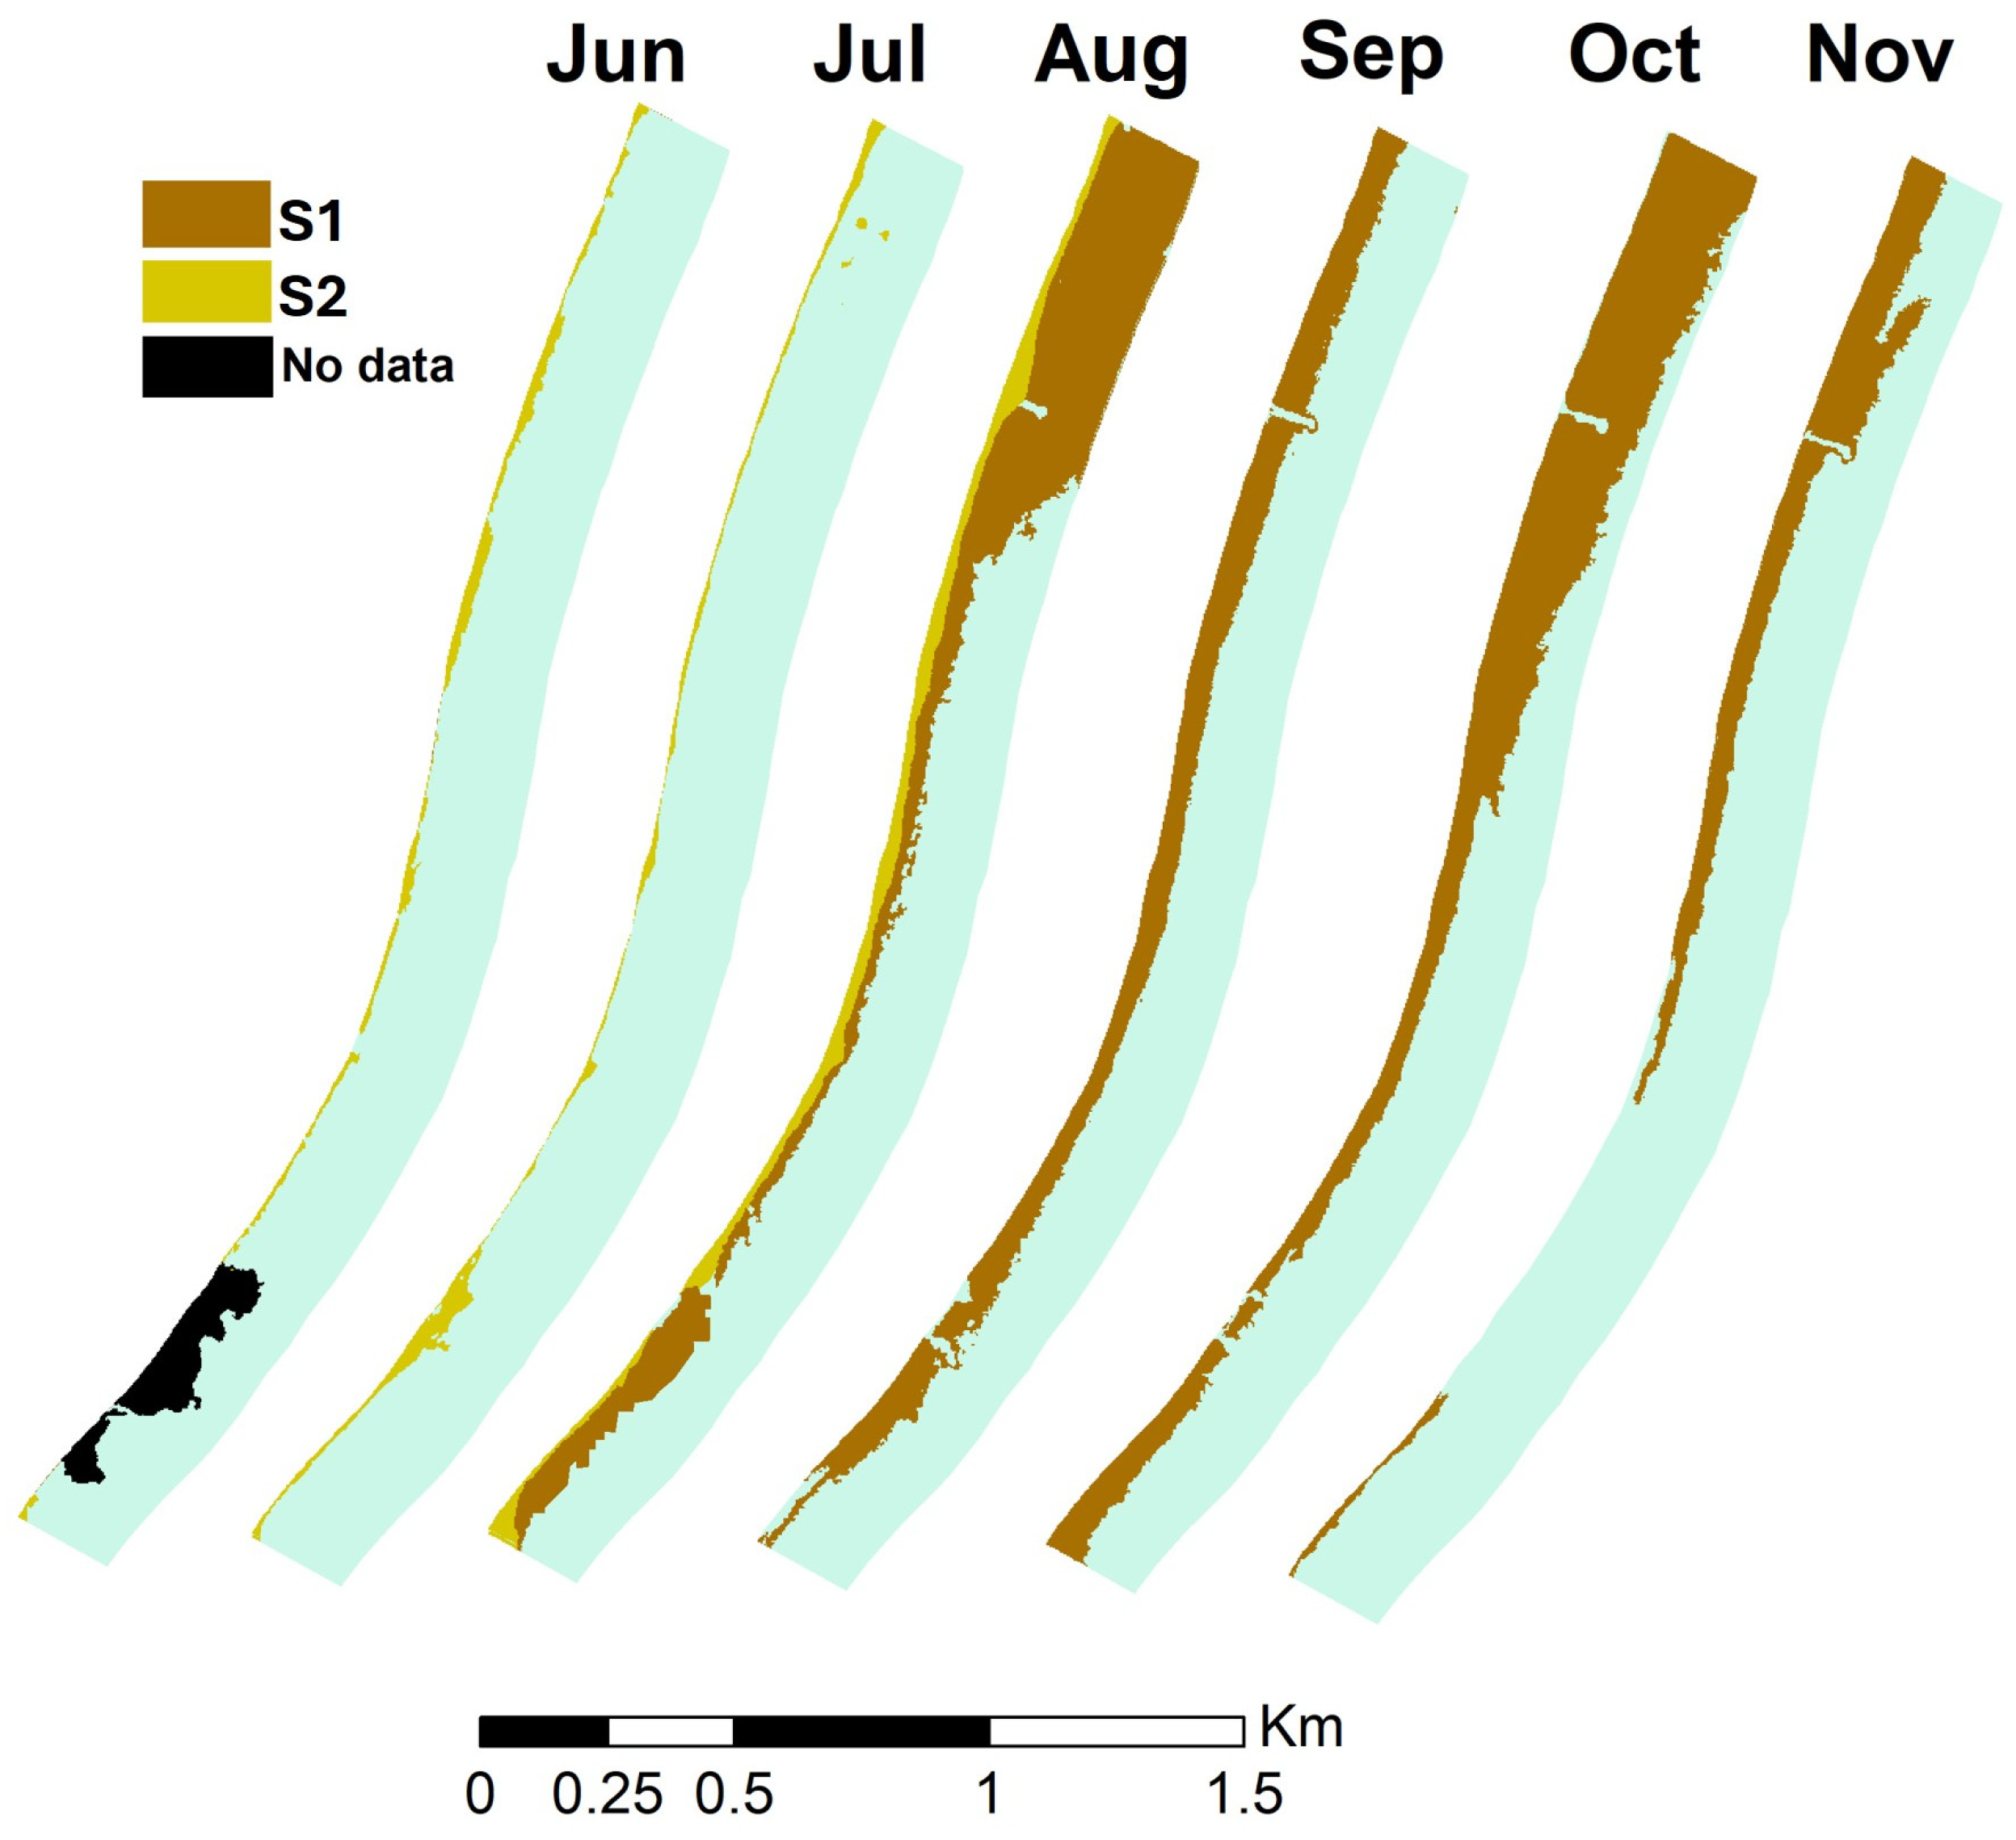
3.1. Detection of Sargassum Brown Tides (SBTs)

The SBTs could be visually effectively detected using the unsupervised classification due to the intense brown of the water that contrasts in transparency from the rest of the lagoon. In 2018 and 2019, the SBTs exhibited variation in extent across months, but no significant differences were found in the covered area (W = 19, p = 0.935), mean length (W = 19, p = 0.935), or maximum length (W = 20, p = 0.8068). In 2018, from June to July, small quantities of beach-cast sargassum were observed, and the SBTs became visible in the image from August onwards, increasing in size and color intensity until October (Figure 2). In October 2018, the SBTs extended beyond the 200 m wide mask (Table 2).

3.2. Accuracy of Thematic Maps for Seagrass Meadows

The cluster analysis of the field sites generated a classification scheme of five bottom-types, defined both by the composition of the bottom and the leaf area projected on bottom. C1 corresponds to dense seagrass meadows, with~ 80–100% cover of mono or multi-specific seagrass with sparse or no algae. C2 corresponds to seagrass and diverse macroalgae, with 60~70% of seagrass cover and ~30% coverage of green, red or brown macroalgae with or without epiphytes. C3 corresponds to seagrass beds and rhizophytic green algae, with the seagrasses covering 40% and rhizophytic green algae covering ~15–35%. C4 corresponded to sparse vegetation (seagrass and rooted algae), with ≤40% of vegetation cover of either seagrass, macroalgae or a combination of both. C5 corresponded to sand plains, with bare sand covering ≥60% (Figure 3).
The general accuracies of the obtained maps were 92% (kappa = 0.91), 90% (kappa = 0.87), 81% (kappa = 0.76) and 96% (kappa = 0.94) for April 2015, December 2015, February 2017 and February 2020, respectively (Figure 4 and Figure 5). The classification of 2017 showed confusion between C4 (sparse vegetation) and C5 (Sand plains). Confusion matrix data yielded a commission error of 51.01% and user precision of 48% for C4; as well as an omission error of 36% and producer precision of 63% for C5. The rest of the maps had commission errors below 19%, omission errors below 29%, and producer and user accuracies above 80% (Table S1).

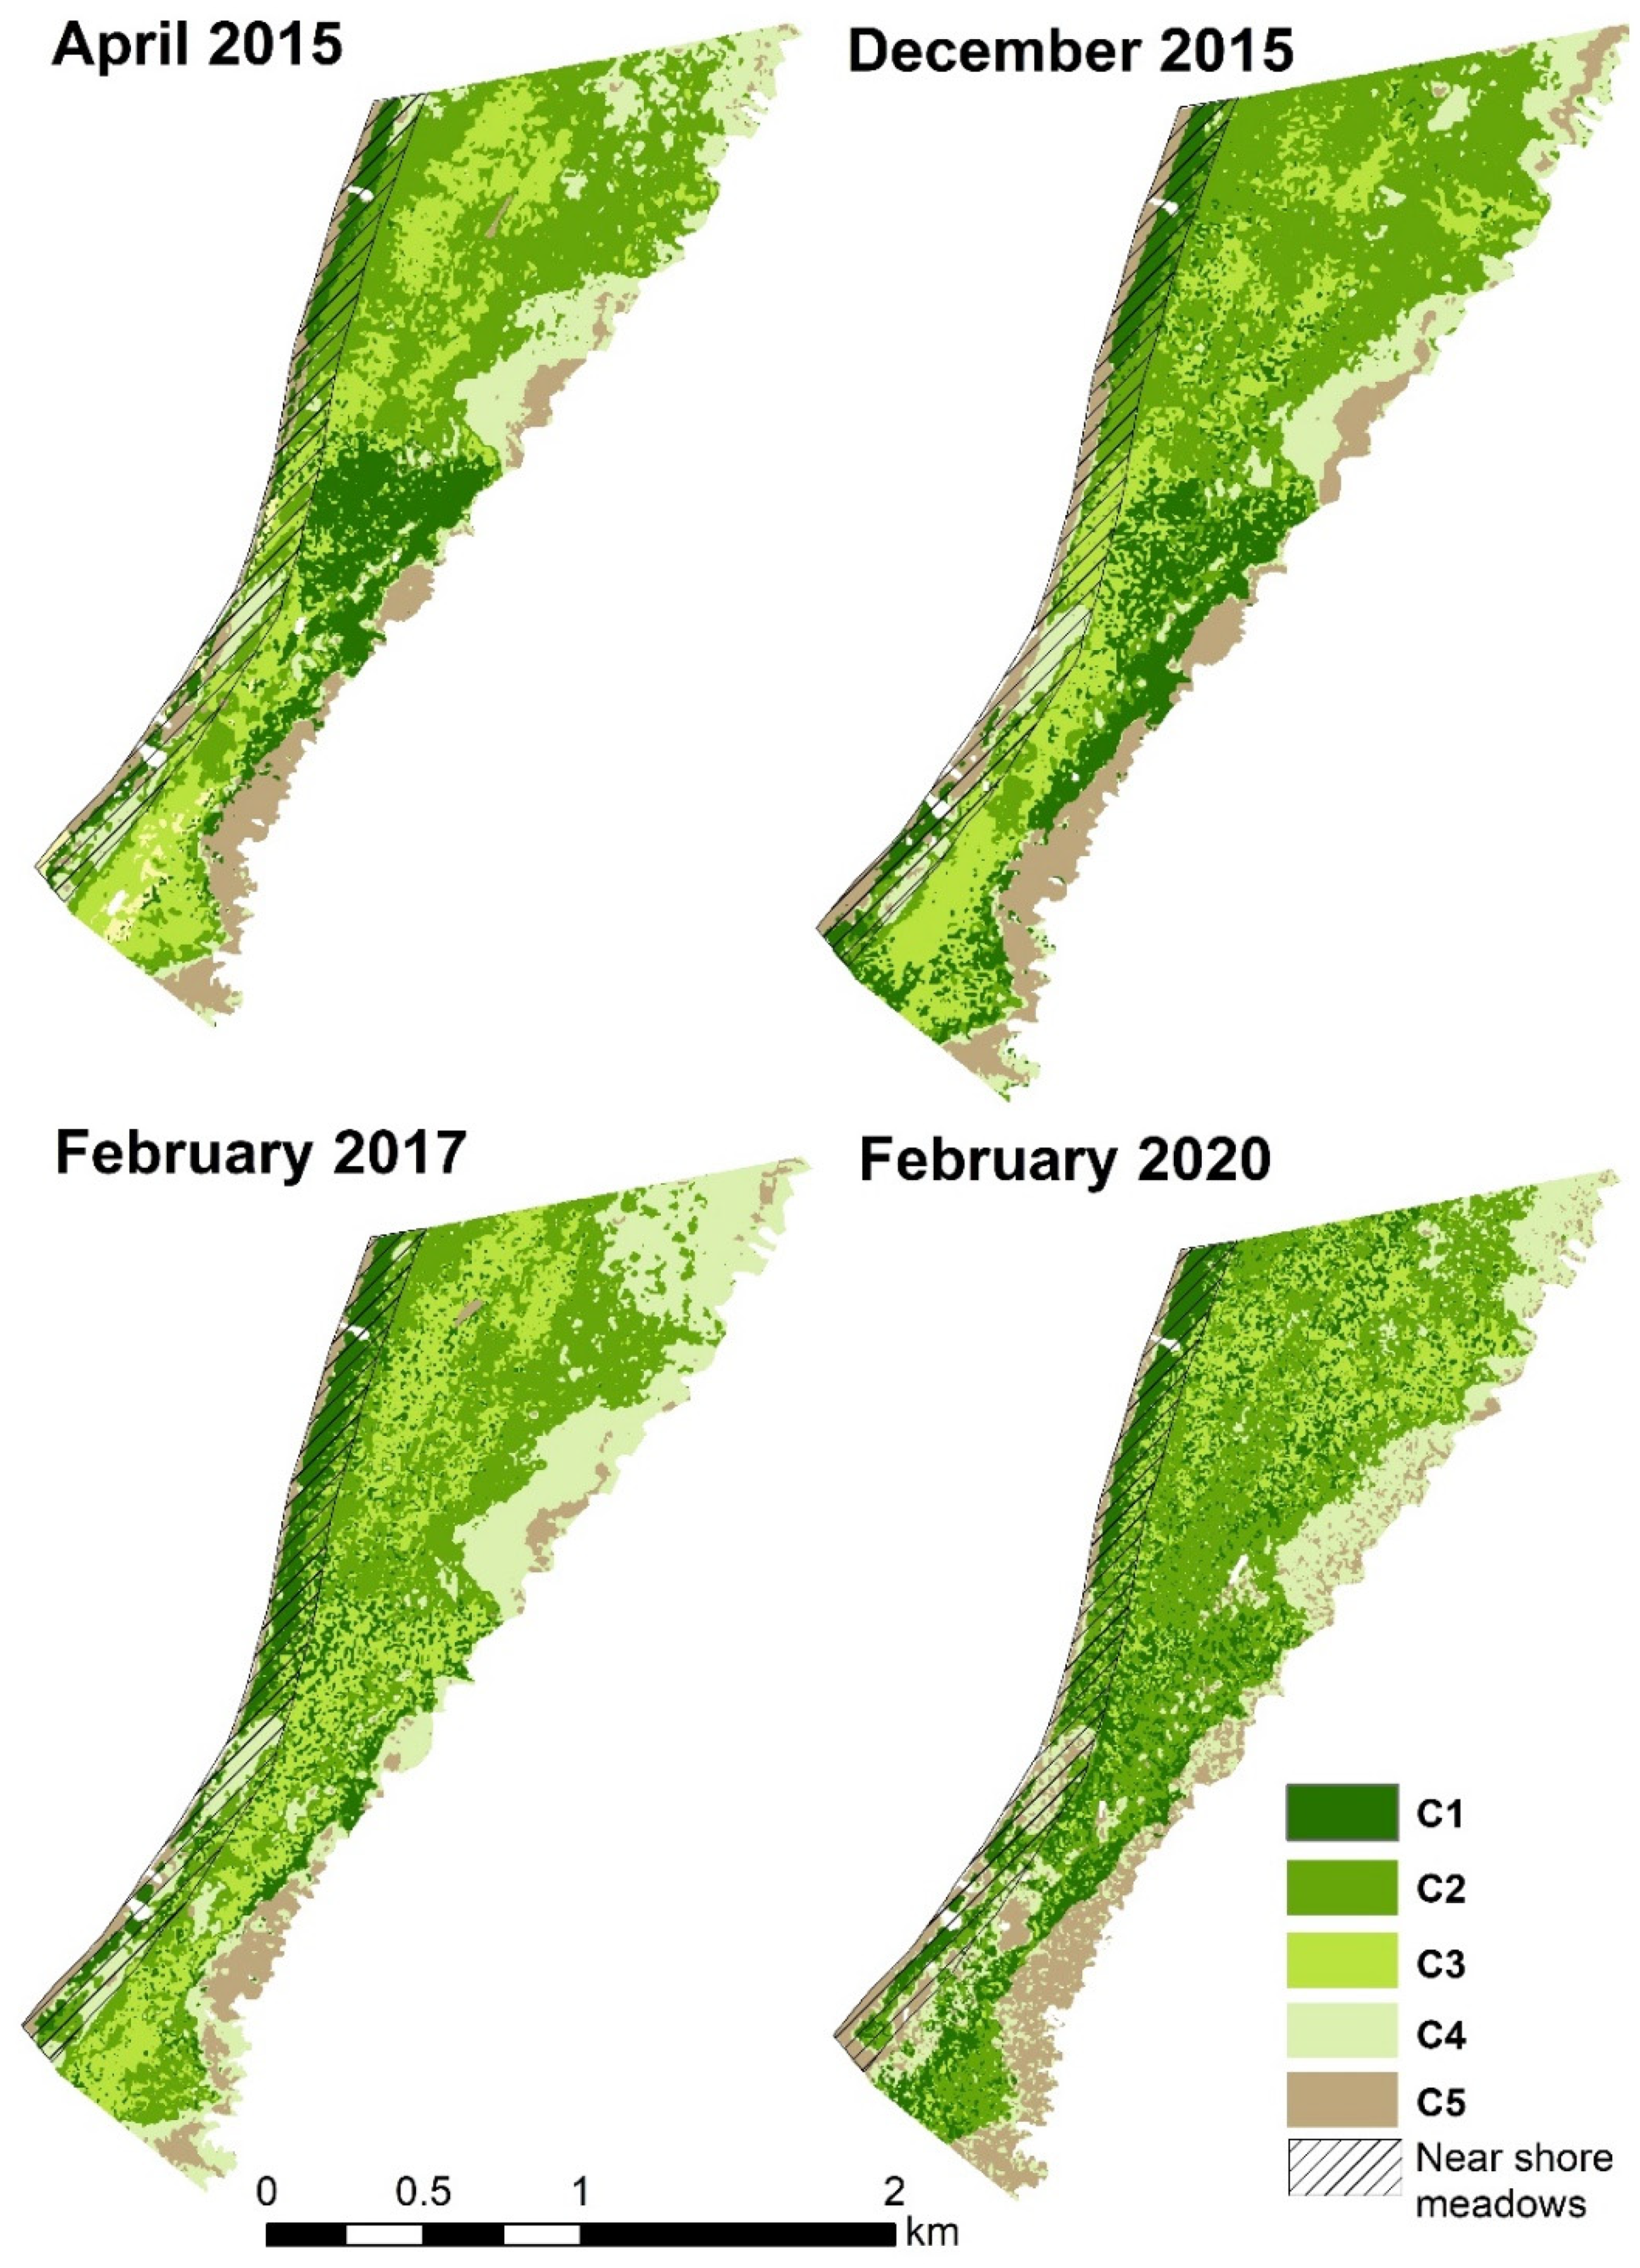
3.3. Near-Shore Seagrass Meadow Change Analysis

The near-shore seagrass meadows were highly dynamic, showing changes both in distribution (Figure 4) as well as total coverage of the bottom types (Table 3). In February 2017 and February 2020 after the SBT, increments in dense seagrass (C1) and seagrass and rhizophytic green algae (C3) were notable (Table 3).

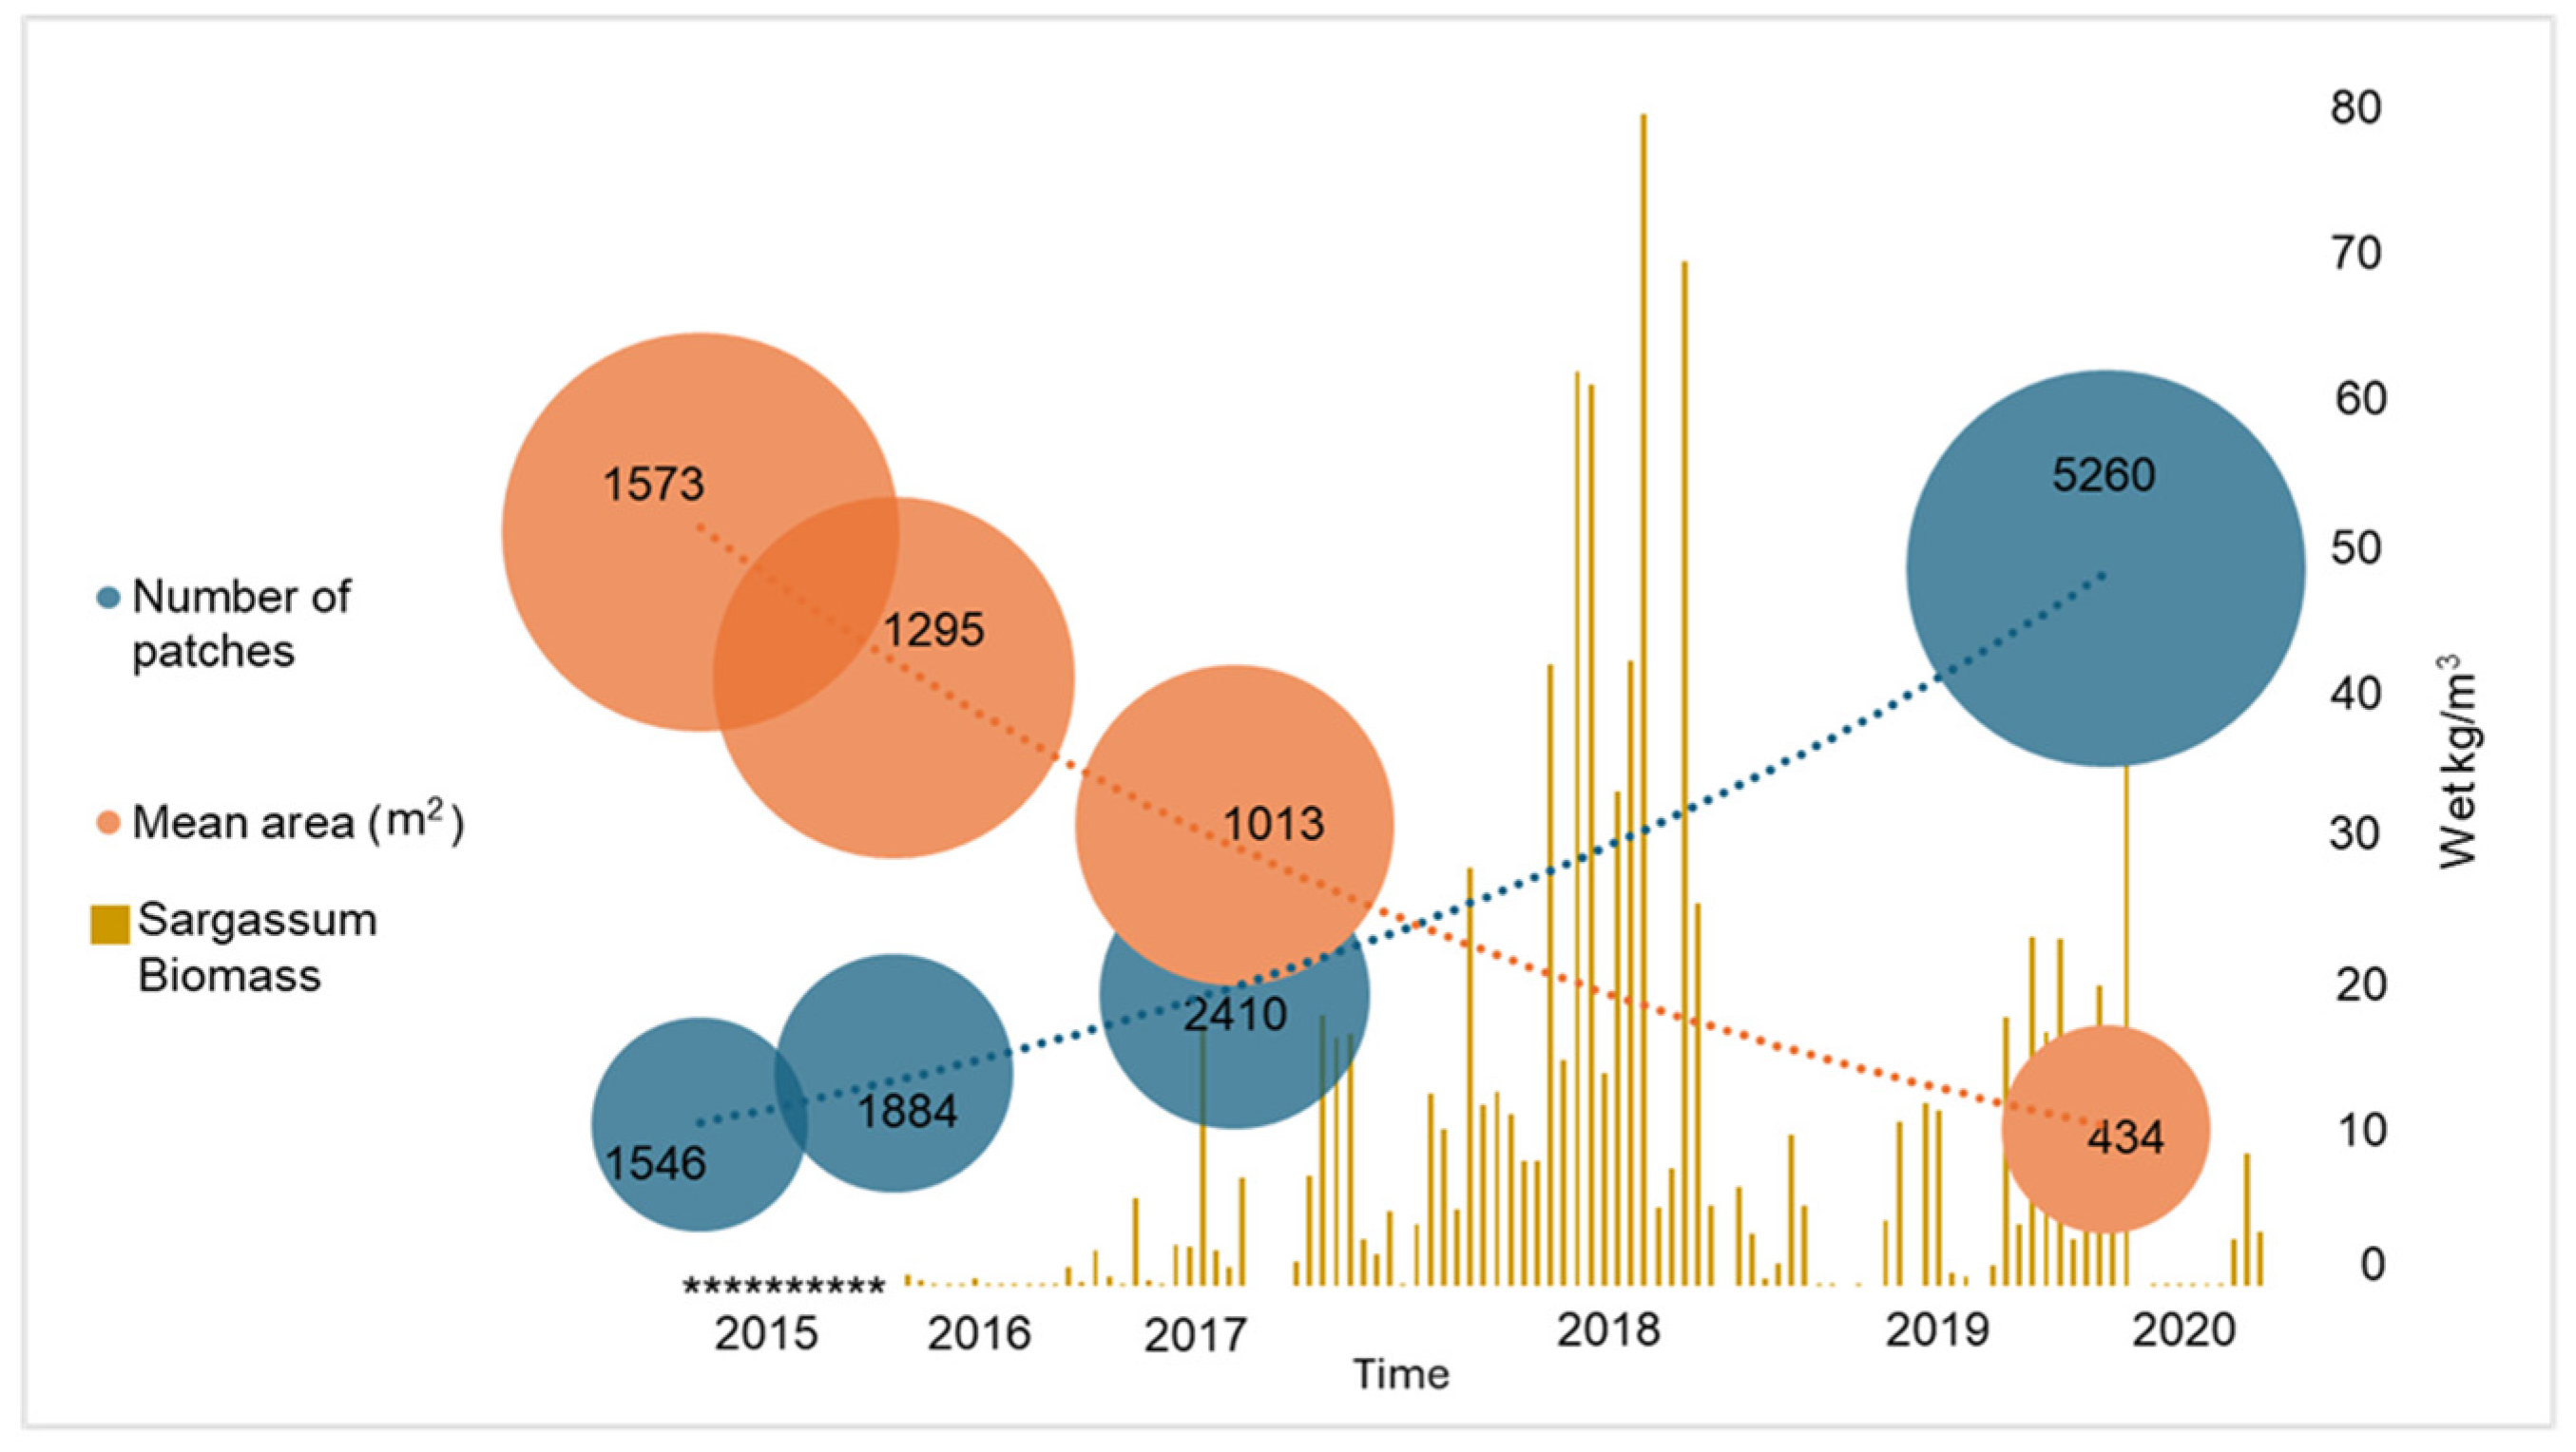
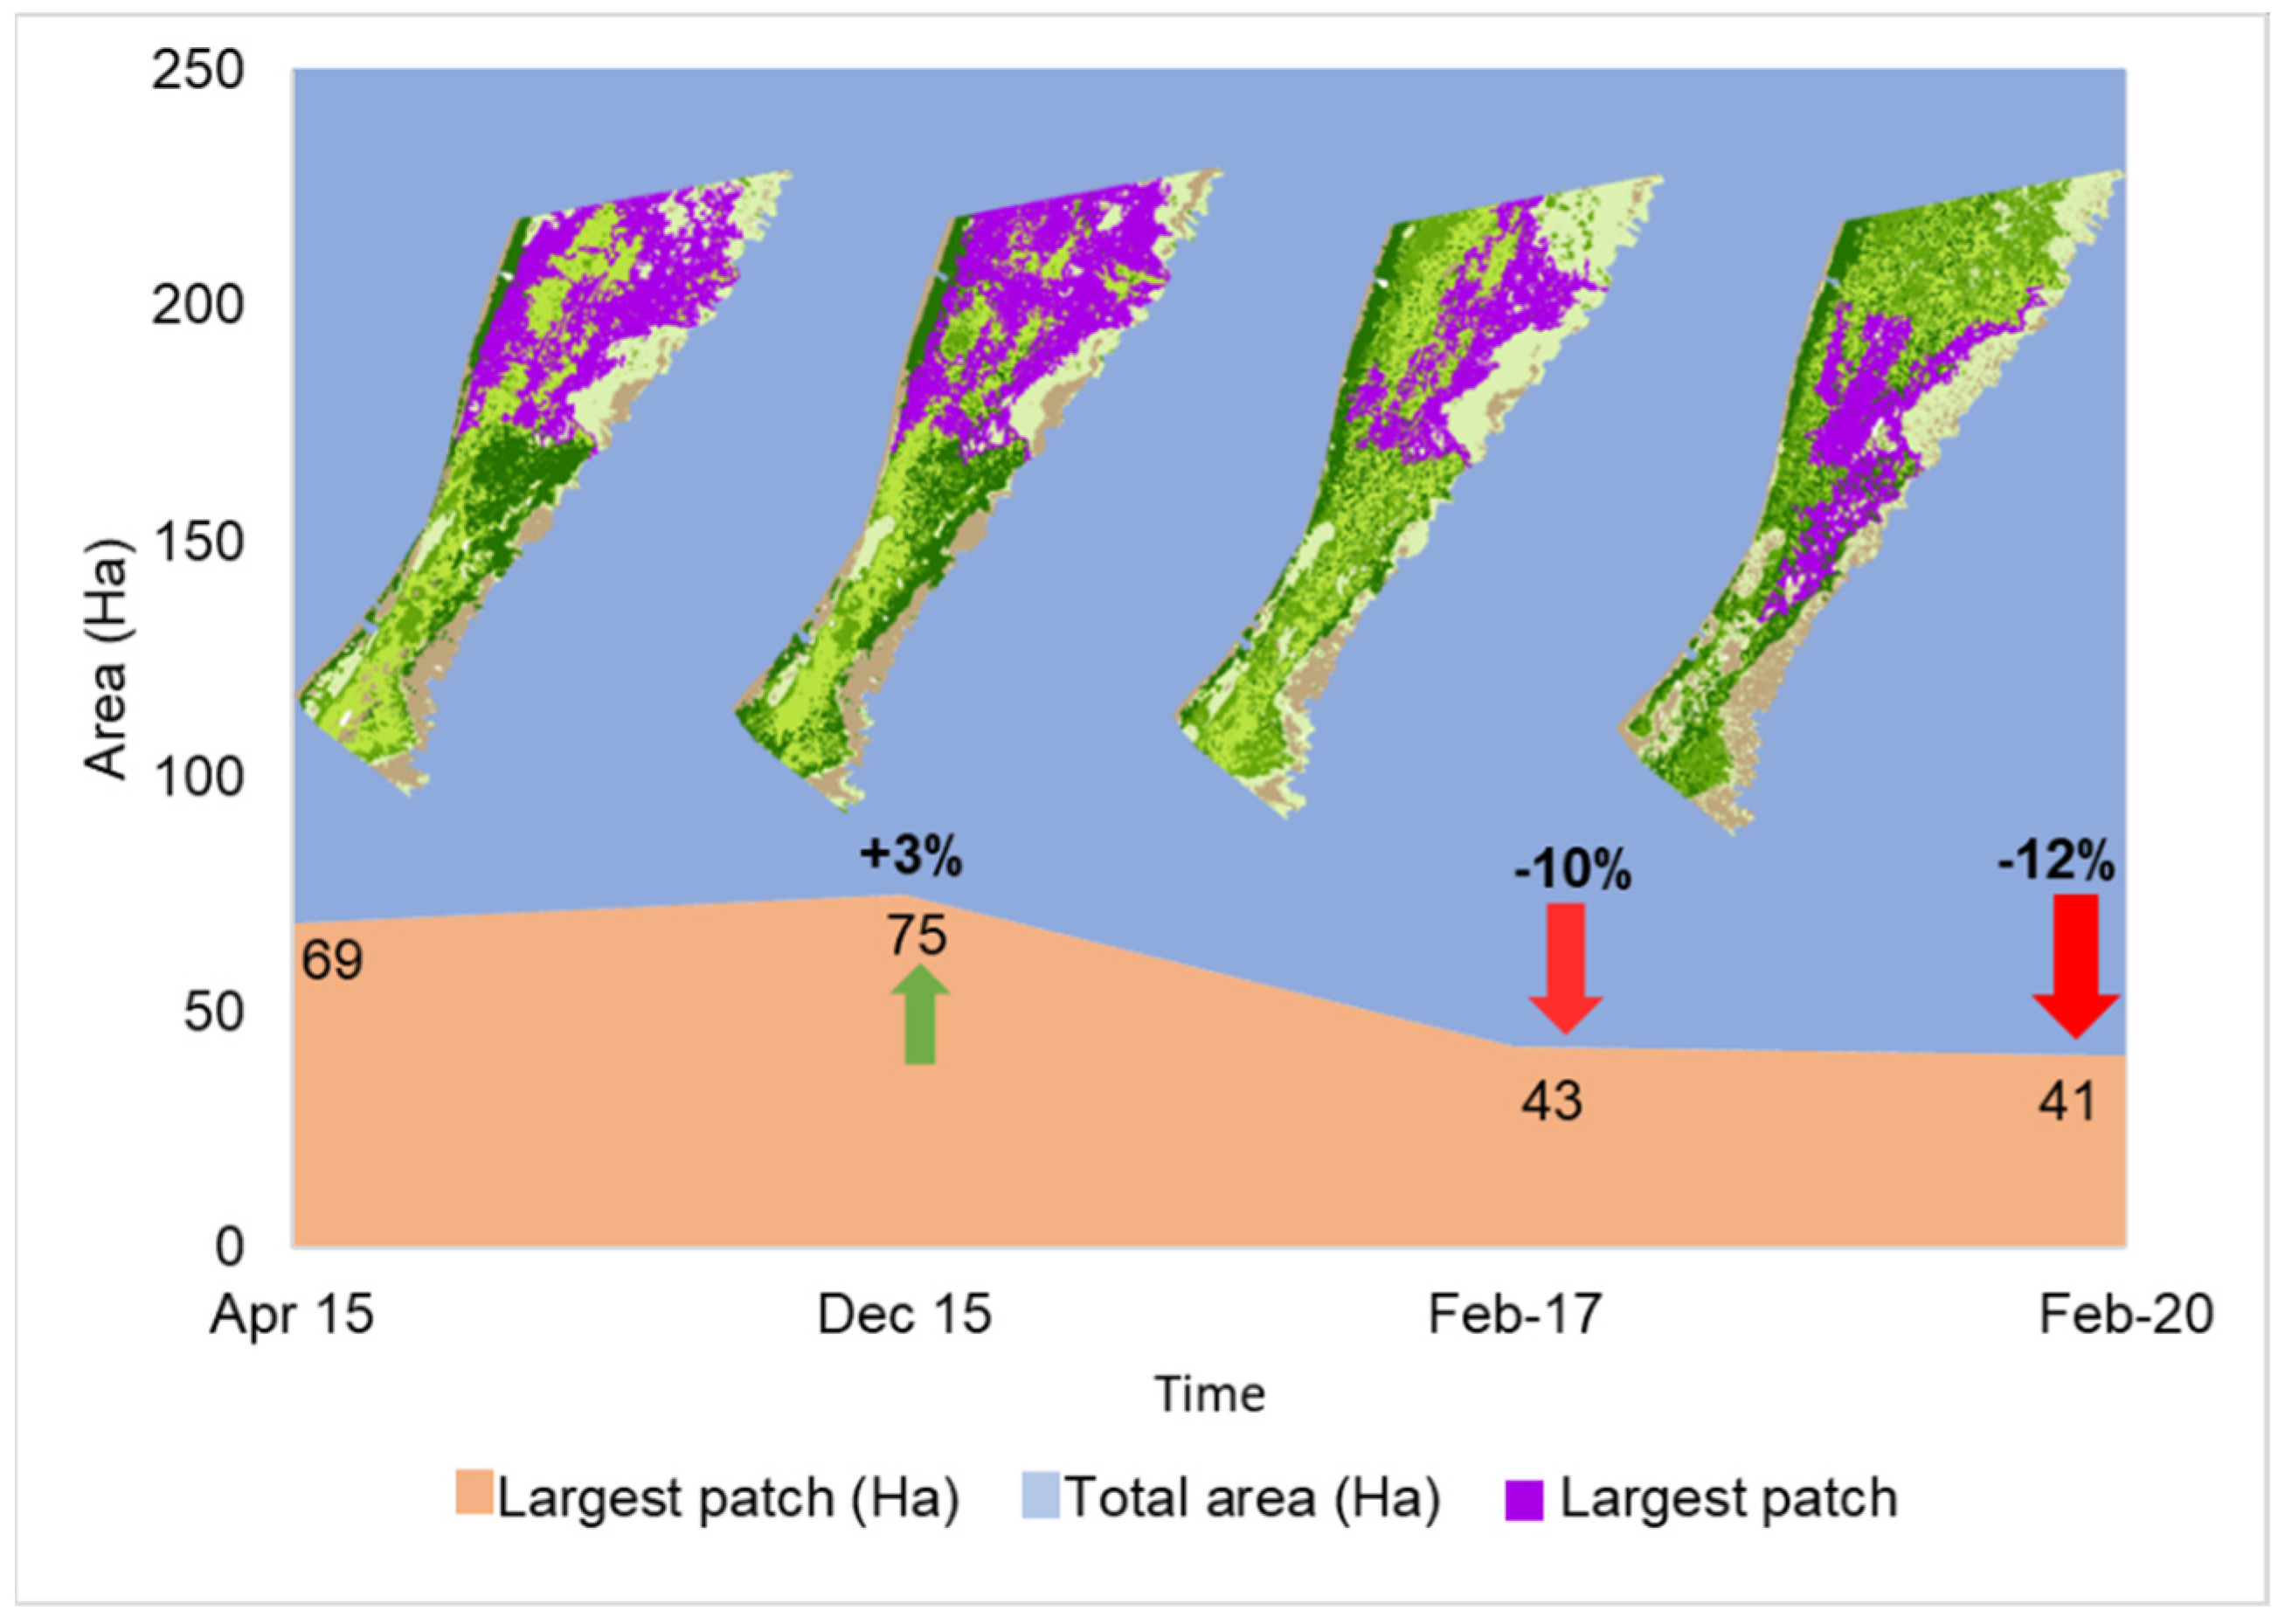
3.4. Changes in Seagrass Landscape Configuration and Fragmentation Analysis

The distribution of the five bottom classes changed significantly over the years on the lagoon landscape (Figure 5) with an overall increase in cover of seagrass and diverse macroalgae (Class 2) (Table 4). The metrics of landscape analysis show a tendency towards fragmentation over time as the number of patches increased whilst their area decreased (Figure 6) The Kruskall–Wallis test shows significant differences in the number of patches between years (chi-squared = 174, p-value < 2.2 × 10⁻¹⁶).
Also, the Largest Patch Index showed a decrease in size and connectivity in the lagoon over time, and class 2 replaced areas that were dominated by class 1 previously (Figure 7).

4. Discussion

We verified our hypothesis that repeated disturbances caused by recurring Sargassum Brown Tides (SBTs) could be detected as changes in the spatial heterogeneity of seagrass meadows extending beyond the area of direct impact. But the nearshore zone was the most affected area, presenting more erratic fluctuations in the bottom cover classes over time, supporting the findings of [8]. But beyond this coastal fringe, the recurring SBTs also had a detectable impact, albeit less obvious.

4.1. Sargassum Brown Tides

The SBTs were detected by the ISODATA algorithm in the nearshore area, where turbidity had a severe impact within the first 50–200 m [8]. In situ monitoring carried out by the existing beach camera systems and field observations can only cover so much area, making the use of satellite imagery very useful for wide area coverage.
Although the SBT was the most evident in the area closest to the coast, the particulate organic particles from sargassum dispersed and were transported further offshore throughout the system [41] and the increased nitrogen input from sargassum was evidenced by [11] and through isotopic traces (depleted δ15N) in Thalassia testudinum from 2014 to 2019 in various Mexican Caribbean coastal ecosystems [8,52].

4.2. Remote Sensing of the Seagrass Meadows

Monitoring the spatial distribution of seagrass and submerged vegetation at different spatial resolutions and through time has been achieved successfully using remote sensing approaches [53,54,55]; similar to these studies, we faced challenges regarding the availability of adequate locations. Even when using sensors relying on satellite constellations (+300 for PlanetScope satellites and 5 for RapidEye, from Planet Labs, San Francisco, CA, USA) that enhance the temporal resolution of the imagery, challenges included environment-related issues, such as significant cloud or haze cover, water turbidity (associated with suspended sediments), and surface sun-glint (associated with wind); and in the case of PlanetScope, sensor-related issues, like partial coverage of the area of interest and sensor artifacts as chromatic aberrations. The limitations imposed by these factors were a constraint for the incorporation of more images in the analysis and the AOIs in most of the available images between the selected dates of analysis were not useful (either cloudy, hazy, full of waves, turbid, with incomplete coverage of the AOI, or a combination of these). The very high overall accuracy (ranging from 96 to 98%) of the classified images for the thematic maps of seagrass meadows is related to (a) the relative low number of classes (five) as noted by [56]; (b) the robust sampling design of 120 field sites; (c) the contrasting differences in the bottom cover between classes; and (d) rigorous training based on robust statistical analysis and expert knowledge.

4.3. Changes in the Spatial Configuration of the Seagrass Meadows

Patterns of change in seagrass meadows depend on abiotic characteristics such as depth, water motion, nutrient, and light availability, organic matter, and biological interactions, such as herbivory and competition [11,57]. However, in addition, density-dependent interactions between seagrass and the environment or complex biotic interactions can produce feedback loops or non-linear relationships that alter the self-organization and spatial structure of the meadows [36,58,59].
Before the SBT, the spatial organization of the seagrasses in the Puerto Morelos reef lagoon was more continuous and uniform. Historically, until the 1990s, this reef lagoon was an oligotrophic system with the densest meadows near to the shore, well-developed meadows in the middle of the reef lagoon, and less dense vegetation closer to the reef [60,61]. From the 1990s onwards, the system has undergone gradual changes mainly attributed to the increasing nutrient inputs from urban landscapes [37,62,63]. Although the first SBTs in 2015 had a notorious effect on the near-shore fringe (Table 2; [8]), its impact on the seagrass landscape was not very notorious, and a slight increase in homogeneity was reported (Figure 7). However, after the second and third disturbances caused by the SBTs in 2018 and 2019, the landscape became more heterogeneous, and the area of the largest patch decreased (Figure 7). Visually, the bottom-type distribution is more fragmented in the 2020 map than in 2016, with a localized aerial increase in denser vegetations, which is a typical development after the eutrophication of originally oligotrophic systems [24,64], but also bare areas, likely caused by mortality due to the accumulation of organic matter masses from sargassum [8]. The number of isolated patches increased, and they decreased in size (Figure 6). Such a change to a more mosaic pattern in a landscape and fractional cover is an indicator of a community state shift [31,59,65].

4.4. Ecosystem Shift

In nonlinear systems, changes are often abrupt and “unexpected” [36]. In such systems, shifts in self-organization in communities are considered as early warning signs of approaching thresholds of changes to alternative stable states [31,66]. Once the threshold is crossed, and the seagrasses are (almost) lost, return to the previous state is unlikely, as the self-facilitative vegetation that modified the environment stopped modifying the environment, resulting in collapse of the seagrass ecosystem [31,64,66].
Community shifts in ecosystems are early warning indicators to anticipate system-state changes that could end in catastrophic shifts or ecosystem collapse [67]. Identifying the shifts and associated key patterns is challenging, and often, the temporal and spatial resolutions of the ecologic data are insufficient to discern these [68]. Ecosystem state shifts are related to resilience loss and increase in vulnerability to stochastic events such as hurricanes, heat waves, or diseases [67], which can cause the loss or degradation of the ecosystem, and thereby their ecosystem services [68]. Recovery strategies from catastrophic shifts, such as restoration, usually are challenging and expensive [67], and therefore, action is preferably undertaken before system-state changes occur. Different seagrass monitoring programs have been proposed to discern early warning signals to avoid degradation of the environment or loss of the ecosystem. Dennison [69] established a relationship between Secchi disc depth and the maximum depth limit for the survival of eelgrass, which can be applied to turbid waters, but not to relatively clear waters in shallow reef lagoons such as Puerto Morelos reef lagoon. Fourqurean and collaborators [70] constructed a predictive model for Florida Bay that assigned a probability of a vegetation type for a given combination of water quality variables. Van Tussenbroek and collaborators [4] suggested the ratio of the above-ground to total seagrass biomass as an indicator of environmental change for Caribbean seagrass meadows. The relatively low-effort analysis proposed in this study allows for historical back-tracking (whenever satellite images are available) and could be adapted and used to study key patterns and ecosystemic shifts in seagrass systems. It may, therefore, be worthwhile to include landscape analysis in seagrass monitoring programs.

5. Conclusions

This work explored the potential of using remote sensing tools to study large-scale seagrass ecosystem shifts and self-organization, which brings a new kind of understanding of seagrass meadows. This work found a change in landscape configuration after recurring Sargassum Brown Tides that could be an early warning sign of catastrophic shifts to an entirely other system with different attributes (e.g., large fields of Halimeda spp.). In this sense, we highlight the importance of serious actions to manage the significant sargassum influxes into the Caribbean through either in-sea collection or immediate removal after arrival onshore [40,71]. Ongoing spatial monitoring of the seagrass meadows can then detect potential improvements in ecosystem state due to these management actions.

Supplementary Materials

The following supporting information can be downloaded at: https://www.mdpi.com/article/10.3390/coasts5010008/s1, Figure S1. Sequence of the pre-processing steps applied to planet images. Figure S2. A hierarchical cluster analysis was obtained to create 5 types of bottoms. Figure S3. Sequence for the classification of images Figure S4. Thematic maps of seagrass meadows derived from the sequential supervised classification. Table S1. Quality of the thematic maps of the Puerto Morelos lagoon April 2014–February 2020.

Author Contributions

Conceptualization S.V.Á.-M., B.I.v.T. and J.R.G.-P.; methodology S.V.Á.-M., B.I.v.T. and J.R.G.-P.; Software S.V.Á.-M. and J.R.G.-P.; Validation S.V.Á.-M.; formal analysis, investigation, data curation S.V.Á.-M.; Resources S.V.Á.-M., B.I.v.T. and J.R.G.-P.; writing—original draft preparation S.V.Á.-M.; writing—review and editing S.V.Á.-M., B.I.v.T. and J.R.G.-P.; visualization S.V.Á.-M.; supervision B.I.v.T. and J.R.G.-P.; funding acquisition S.V.Á.-M., B.I.v.T. and J.R.G.-P. All authors have read and agreed to the published version of the manuscript.

Funding

This research was funded by Consejo Nacional de Humanidades, Ciencia y Tecnología (CONAHCYT). Master scholarship CVU no. 966910.

Institutional Review Board Statement

Not applicable.

Informed Consent Statement

Not applicable.

Data Availability Statement

Data viability under request.

Acknowledgments

The authors would like to thank Guadalupe Barba-Santos for the laboratory technical support provided, Hunahpu Marcos Benitez for the fieldwork support and to Servicio Academico de Monitoreo Meteorológico y Ocenaografico (SAMMO), UNAM for their assistance with the computer equipment for data processing.

Conflicts of Interest

The authors declare no conflict of interest.

References

  1. Fourqurean, J.W.; Duarte, C.M.; Kennedy, H.; Marbà, N.; Holmer, M.; Mateo, M.A.; Serrano, O. Seagrass ecosystems as a globally significant carbon stock. Nat. Geosci. 2012, 5, 505–509. [Google Scholar] [CrossRef]
  2. Heck, K.L., Jr.; Hays, G.; Orth, R.J. Critical evaluation of the nursery role hypothesis for seagrass meadows. Mar. Ecol. Prog. Ser. 2003, 253, 123–136. [Google Scholar] [CrossRef]
  3. Koch, E.W.; Ackerman, J.D.; Verduin, J.; Keulen, V.M. Fluid dynamics in seagrass ecology—From molecules to ecosystems. In Seagrasses: Biology, Ecology and Conservation; Larkum, A.W., Orth, R.J., Duarte, C.M., Eds.; Springer: Dordrecht, The Netherlands, 2007; pp. 193–225. [Google Scholar] [CrossRef]
  4. Van Tussenbroek, B.I.; Cortés, J.; Collin, R.; Fonseca, A.C.; Gayle, P.M.; Guzmán, H.M.; Weil, E. Caribbean-wide, long-term study of seagrass beds reveals local variations, shifts in community structure and occasional collapse. PLoS ONE 2014, 9, e98377. [Google Scholar] [CrossRef]
  5. Duarte, C.M.; Borum, J.; Short, F.T.; Walker, D.I. Seagrass ecosystems: Their global status and prospects. In Aquatic Ecosystems: Trends and Global Prospects; Cambridge University Press: Cambridge, UK, 2008; pp. 281–294. [Google Scholar] [CrossRef]
  6. Grech, A.; Chartrand-Miller, K.; Erftemeijer, P.; Fonseca, M.; McKenzie, L.; Rasheed, M.; Coles, R. A comparison of threats, vulnerabilities and management approaches in global seagrass bioregions. Environ. Res. Lett. 2012, 7, 024006. [Google Scholar] [CrossRef]
  7. Wang, M.; Hu, C.; Barnes, B.B.; Mitchum, G.; Lapointe, B.; Montoya, J.P. The Great Atlantic Sargassum Belt. Science 2019, 365, 83–87. [Google Scholar] [CrossRef]
  8. Van Tussenbroek, B.I.; Arana, H.A.H.; Rodríguez-Martínez, R.E.; Espinoza-Avalos, J.; Canizales-Flores, H.M.; González-Godoy, C.E.; Collado-Vides, L. Severe impacts of brown tides caused by Sargassum spp. on near-shore Caribbean seagrass communities. Mar. Pollut. Bull. 2017, 122, 272–281. [Google Scholar] [CrossRef]
  9. Vásquez-Elizondo, R.M.; Vázquez-Delfín, E. Muerte y destrucción del sargazo: Escenarios naturales de degradación. Av. Perspect. 2021, 10, 2. [Google Scholar]
  10. Rodríguez-Martínez, R.E.; Medina-Valmaseda, A.E.; Blanchon, P.; Monroy-Velázquez, L.V.; Almazán-Becerril, A.; Delgado-Pech, B.; Vásquez-Yeomans, L.; Francisco, V.; García-Rivas, M.C. Faunal mortality associated with massive beaching and decomposition of pelagic Sargassum. Mar. Pollut. Bull. 2019, 146, 201–205. [Google Scholar] [CrossRef]
  11. Velázquez-Ochoa, R.; Enríquez, S. Environmental degradation of the Mexican Caribbean reef lagoons. Mar. Pollut. Bull. 2023, 191, 114947. [Google Scholar] [CrossRef]
  12. Hu, C.; Feng, L.; Hardy, R.F.; Hochberg, E.J. Spectral and Spatial Requirements of Remote Measurements of Pelagic Sargassum Macroalgae. Remote Sens. Environ. 2015, 167, 229–246. [Google Scholar] [CrossRef]
  13. Wang, M.; Hu, C. Mapping and Quantifying Sargassum Distribution and Coverage in the Central West Atlantic Using MODIS Observations. Remote Sens. Environ. 2016, 183, 350–367. [Google Scholar] [CrossRef]
  14. Wang, M.; Hu, C. Predicting Sargassum Blooms in the Caribbean Sea from MODIS Observations. Geophys. Res. Lett. 2017, 44, 3265–3327. [Google Scholar] [CrossRef]
  15. Zhang, Y.; Hu, C.; McGillicuddy, D.J.; Barnes, B.B.; Liu, Y.; Kourafalou, V.H.; Zhang, S.; Hernandez, F.J. Pelagic sargassum in the Gulf of Mexico Driven by Ocean Currents and Eddies. Harmful Algae 2024, 132, 102566. [Google Scholar] [CrossRef] [PubMed]
  16. Lara-Hernández, J.; Enriquez, C.; Zavala-Hidalgo, J.; Cuevas, E.; van Tussenbroek, B.; Uribe-Martínez, A. Sargassum Transport Towards Mexican Caribbean Shores: Numerical Modeling for Research and Forecasting. J. Mar. Syst. 2024, 241, 103923. [Google Scholar] [CrossRef]
  17. De la Barreda-Bautista, B.; Metcalfe, S.E.; Smith, G.; Sjögersten, S.; Boyd, D.S.; Cerdeira-Estrada, S.; López-Ramírez, P.; Magaldi, A.; Ressl, R.; Perera-Valderrama, S.; et al. Monitoring Holopelagic Sargassum spp. Along the Mexican Caribbean Coast: Understanding and Addressing User Requirements for Satellite Remote Sensing. Front. Mar. Sci. 2023, 10, 1166000. [Google Scholar] [CrossRef]
  18. León-Pérez, M.C.; Reisinger, A.S.; Gibeaut, J.C. Spatial-Temporal Dynamics of Decaying Stages of Pelagic Sargassum spp. Along Shorelines in Puerto Rico Using Google Earth Engine. Mar. Pollut. Bull. 2023, 188, 114715. [Google Scholar] [CrossRef]
  19. Rodríguez-Muñoz, R.; Muñiz-Castillo, A.I.; Euán-Avila, J.I.; Hernández-Núñez, H.; Valdés-Lozano, D.S.; Collí-Dulá, R.C.; Arias-González, J.E. Assessing temporal dynamics on pelagic Sargassum influx and its relationship with water quality parameters in the Mexican Caribbean. Reg. Stud. Mar. Sci. 2021, 48, 102005. [Google Scholar] [CrossRef]
  20. Cerdeira-Estrada, S.; Heege, T.; Kolb, M.; Ohlendorf, S.; Uribe, A.; Muller, A.; Garza, R.; Ressl, R.; Aguirre, R.; Marino, I.; et al. Benthic Habitat and Bathymetry Mapping of Shallow Waters in Puerto Morelos Reefs Using Remote Sensing with Physics-Based Data Processing. In Proceedings of the 2012 IEEE International Geoscience and Remote Sensing Symposium, Munich, Germany, 22–27 July 2012; pp. 4383–4386. [Google Scholar] [CrossRef]
  21. Zapata-Ramírez, P.A.; Blanchon, P.; Olioso, A.; Hernandez-Nuñez, H.; Sobrino, J.A. Accuracy of IKONOS for mapping benthic coral-reef habitats: A case study from the Puerto Morelos Reef National Park, Mexico. Int. J. Remote Sens. 2013, 34, 3671–3687. [Google Scholar] [CrossRef]
  22. Wicaksono, P.; Lazuardi, W. Random Forest Classification Scenarios for Benthic Habitat Mapping Using PlanetScope Image. In Proceedings of the IGARSS 2019-2019 IEEE International Geoscience and Remote Sensing Symposium, Yokohama, Japan, 28 July–2 August 2019. [Google Scholar] [CrossRef]
  23. Blume, A.; Pertiwi, A.P.; Lee, C.B.; Traganos, D. Bahamian seagrass extent and blue carbon accounting using Earth observation. Front. Mar. Sci. 2023, 10, 1058460. [Google Scholar] [CrossRef]
  24. Hedley, J.D.; Velázquez-Ochoa, R.; Enríquez, S. Seagrass depth distribution mirrors coastal development in the Mexican Caribbean—An automated analysis of 800 satellite images. Front. Mar. Sci. 2021, 8, 733169. [Google Scholar] [CrossRef]
  25. Poursanidis, D.; Topouzelis, K.; Chrysoulakis, N. Mapping Coastal Marine Habitats and Delineating the Deep Limits of Neptune’s Seagrass Meadows Using Very High Resolution Earth Observation Data. Int. J. Remote Sens. 2018, 39, 8670–8687. [Google Scholar] [CrossRef]
  26. Veettil, B.K.; Ward, R.D.; Lima, M.D.A.C.; Stankovic, M.; Hoai, P.N.; Quang, N.X. Opportunities for Seagrass Research Derived from Remote Sensing: A Review of Current Methods. Ecol. Indic. 2020, 117, 106560. [Google Scholar] [CrossRef]
  27. Hossain, M.S.; Bujang, J.S.; Zakaria, M.H.; Hashim, M. The application of remote sensing to seagrass ecosystems: An overview and future research prospects. Int. J. Remote Sens. 2015, 36, 61–114. [Google Scholar] [CrossRef]
  28. Frederiksen, M.; Krause-Jensen, D.; Holmer, M.; Laursen, J.S. Spatial and Temporal Variation in Eelgrass (Zostera marina) Landscapes: Influence of Physical Setting. Aquat. Bot. 2004, 78, 147–165. [Google Scholar] [CrossRef]
  29. Lizcano-Sandoval, L.; Anastasiou, C.; Montes, E.; Raulerson, G.; Sherwood, E.; Muller-Karger, F.E. Seagrass distribution, areal cover, and changes (1990–2021) in coastal waters off West-Central Florida, USA. Estuar. Coast. Shelf Sci. 2022, 279, 108134. [Google Scholar] [CrossRef]
  30. Wicaksono, P.; Fauzan, M.A.; Kumara, I.S.W.; Yogyantoro, R.N.; Lazuardi, W.; Zhafarina, Z. Analysis of Reflectance Spectra of Tropical Seagrass Species and Their Value for Mapping Using Multispectral Satellite Images. Int. J. Remote Sens. 2019, 40, 8955–8978. [Google Scholar] [CrossRef]
  31. Rietkerk, M.; Dekker, S.; De Ruiter, P.C.; van de Koppel, J. Self-organized patchiness and catastrophic shifts in ecosystems. Science 2004, 305, 1926–1929. [Google Scholar] [CrossRef]
  32. Van Nes, E.H.; Scheffer, M. Implications of spatial heterogeneity for catastrophic regime shifts in ecosystems. Ecology 2005, 86, 1797–1807. [Google Scholar] [CrossRef]
  33. Kéfi, S.; Guttal, V.; Brock, W.A.; Carpenter, S.R.; Ellison, A.M.; Livina, V.N.; Seekell, D.A.; Scheffer, M.; Van Nes, E.H.; Dakos, V. Early warning signals of ecological transitions: Methods for spatial patterns. PLoS ONE 2014, 9, e92097. [Google Scholar] [CrossRef]
  34. Litzow, M.A.; Hunsicker, M.E. Early warning signals, nonlinearity, and signs of hysteresis in real ecosystems. Ecosphere 2016, 7, e01614. [Google Scholar] [CrossRef]
  35. Christianen, M.J.; Herman, P.M.; Bouma, T.J.; Lamers, L.P.; van Katwijk, M.M.; van der Heide, T.; van de Koppel, J. Habitat collapse due to overgrazing threatens turtle conservation in marine protected areas. Proc. R. Soc. B Biol. Sci. 2014, 281, 20132890. [Google Scholar] [CrossRef] [PubMed]
  36. Maxwell, P.S.; Eklöf, J.S.; van Katwijk, M.M.; O’Brien, K.R.; de la Torre-Castro, M.; Boström, C.; van der Heide, T. The fundamental role of ecological feedback mechanisms for the adaptive management of seagrass ecosystems—A review. Biol. Rev. 2017, 92, 1521–1538. [Google Scholar] [CrossRef] [PubMed]
  37. Van Tussenbroek, B.I. Dynamics of seagrasses and associated algae in coral reef lagoons. Hidrobiológica 2011, 21, 293–310. [Google Scholar]
  38. Coronado, C.; Candela, J.; Iglesias-Prieto, R.; Sheinbaum, J.; López, M.; Ocampo-Torres, F.J. On the circulation in the Puerto Morelos fringing reef lagoon. Coral Reefs 2007, 26, 149–163. [Google Scholar] [CrossRef]
  39. Rodríguez-Martínez, R.E.; van Tussenbroek, B.I.; Jordán-Dahlgren, E. Afluencia masiva de sargazo pelágico a la costa del Caribe mexicano (2014–2015). In Florecimientos Algales Nocivos en México; García-Mendoza, E., Quijano-Scheggia, S.I., Olivos-Ortiz, A., Núñez-Vázquez, E.J., Eds.; CICESE: Ensenada, Mexico, 2016; pp. 352–365. [Google Scholar]
  40. Chávez, V.; Uribe-Martínez, A.; Cuevas, E.; Rodríguez-Martínez, R.E.; Van Tussenbroek, B.I.; Francisco, V.; Silva, R. Massive influx of pelagic Sargassum spp. on the coasts of the Mexican Caribbean 2014–2020: Challenges and opportunities. Water 2020, 12, 2908. [Google Scholar] [CrossRef]
  41. Rutten, J.; Arriaga, J.; Montoya, L.D.; Mariño-Tapia, I.J.; Escalante-Mancera, E.; Mendoza, E.T.; Appendini, C.M. Beaching and natural removal dynamics of pelagic Sargassum in a fringing-reef lagoon. J. Geophys. Res. Ocean. 2021, 126, e2021JC017636. [Google Scholar] [CrossRef]
  42. García-Sánchez, M.; Graham, C.; Vera, E.; Escalante-Mancera, E.; Álvarez-Filip, L.; van Tussenbroek, B.I. Temporal changes in the composition and biomass of beached pelagic Sargassum species in the Mexican Caribbean. Aquat. Bot. 2020, 167, 103275. [Google Scholar] [CrossRef]
  43. Chandler, C.J.; Ávila-Mosqueda, S.V.; Salas-Acosta, E.R.; Magaña-Gallegos, E.; Mancera, E.E.; Reali, M.A.G.; de la Barreda-Bautista, B.; Boyd, D.S.; Metcalfe, S.E.; Sjogersten, S.; et al. Spectral characteristics of beached Sargassum in response to drying and decay over time. Remote Sens. 2023, 15, 4336. [Google Scholar] [CrossRef]
  44. Legendre, P.; Legendre, L. Numerical Ecology, 2nd ed.; Elsevier Science B.V.: Amsterdam, The Netherlands, 1998; p. 853. [Google Scholar]
  45. Lyzenga, D.R. Passive remote sensing techniques for mapping water depth and bottom features. Appl. Opt. 1978, 17, 379–383. [Google Scholar] [CrossRef]
  46. Van Tussenbroek, B.; Barba-Santos, M.G.; Wong, G.R.; van Dijk, J.K. A Guide to the Tropical Seagrasses of the Western Atlantic, 1st ed.; Universidad Nacional Autónoma de México, Instituto de Biología: Mexico City, Mexico, 2010; p. 75. [Google Scholar]
  47. Littler, D.S.; Littler, M.M. Caribbean Reef Plants, 1st ed.; Offshore Graphics, Inc.: Deerfield Beach, FL, 2000; p. 542. [Google Scholar]
  48. Clarke, K.R. Non-parametric multivariate analyses of changes in community structure. Austral Ecol. 1993, 18, 117–143. [Google Scholar] [CrossRef]
  49. Clarke, K.R.; Gorley, R.N. Primer v7: User Manual/Tutorial, 1st ed.; PRIMER-E: Plymouth, UK, 2015; p. 296. [Google Scholar]
  50. Su, T.C. A filter-based post-processing technique for improving homogeneity of pixel-wise classification data. Eur. J. Remote Sens. 2016, 49, 531–552. [Google Scholar] [CrossRef]
  51. McGarigal, K.; Cushman, S.A.; Ene, E. FRAGSTATS v4: Spatial Pattern Analysis Program for Categorical Maps; Computer Software Program Produced by the Authors. Available online: https://www.fragstats.org (accessed on 19 March 2021).
  52. Sánchez, A.; Gonzalez-Jones, P.; Camacho-Cruz, K.A.; Anguas-Cabrera, D.; Ortiz-Hernández, M.C.; Rey-Villiers, N. Influence of pelagic sargassum influxes on the δ15N in Thalassia testudinum of the Mexican Caribbean coastal ecosystem. Mar. Pollut. Bull. 2023, 192, 115091. [Google Scholar] [CrossRef] [PubMed]
  53. Roelfsema, C.M.; Lyons, M.; Kovacs, E.M.; Maxwell, P.; Saunders, M.I.; Samper-Villarreal, J.; Phinn, S.R. Multi-temporal mapping of seagrass cover, species and biomass: A semi-automated object-based image analysis approach. Remote Sens. Environ. 2014, 150, 172–187. [Google Scholar] [CrossRef]
  54. Yang, B.; Hawthorne, T.L.; Hessing-Lewis, M.; Duffy, E.J.; Reshitnyk, L.Y.; Feinman, M.; Searson, H. Developing an Introductory UAV/Drone Mapping Training Program for Seagrass Monitoring and Research. Drones 2020, 4, 70. [Google Scholar] [CrossRef]
  55. De Almeida, L.R.; Ávila-Mosqueda, S.V.; Silva, R.; Mendoza, E.; van Tussenbroek, B.I. Mapping the structure of mixed seagrass meadows in the Mexican Caribbean. Front. Mar. Sci. 2022, 9, 1063007. [Google Scholar] [CrossRef]
  56. Andréfouët, S.; Kramer, P.; Torres-Pulliza, D.; Joyce, K.E.; Hochberg, E.J.; Garza-Pérez, R.; Muller-Karger, F.E. Multi-site evaluation of IKONOS data for classification of tropical coral reef environments. Remote Sens. Environ. 2003, 88, 128–143. [Google Scholar] [CrossRef]
  57. Larkum, A.W.; Orth, R.J.; Duarte, C.M. Seagrasses: Biology, Ecology and Conservation; Springer: Amsterdam, The Netherlands, 2006; p. 691. [Google Scholar]
  58. Van der Heide, T.; Bouma, T.J.; van Nes, E.H.; van de Koppel, J.; Scheffer, M.; Roelofs, J.G.; Smolders, A.J. Spatial self-organized patterning in seagrasses along a depth gradient of an intertidal ecosystem. Ecology 2010, 91, 362–369. [Google Scholar] [CrossRef]
  59. Carr, J.A.; D’Odorico, P.; McGlathery, K.J.; Wiberg, P.L. Spatially explicit feedbacks between seagrass meadow structure, sediment, and light: Habitat suitability for seagrass growth. Adv. Water Resour. 2016, 93, 315–325. [Google Scholar] [CrossRef]
  60. Ruíz-Rentería, F.; van Tussenbroek, B.I.; Jordán-Dahlgren, E. Puerto Morelos, Quintana Roo, Mexico; CARICOMP: Caribbean Coral Reef, Seagrass, and Mangrove Sites; Special Report UNESCO: Paris, France, 1998; pp. 57–66. [Google Scholar]
  61. Rodríguez-Martínez, R.E.; Ruíz-Rentería, F.; van Tussenbroek, B.I.; Barba-Santos, G.; Escalante-Mancera, E.; Jordán-Garza, G.; Jordán-Dahlgren, E. Environmental state and tendencies of the Puerto Morelos CARICOMP site, Mexico. Rev. Biol. Trop. 2010, 58, 23–43. [Google Scholar]
  62. Null, K.A.; Knee, K.L.; Crook, E.D.; de Sieyes, N.R.; Rebolledo-Vieyra, M.; Hernández-Terrones, L.; Paytan, A. Composition and fluxes of submarine groundwater along the Caribbean coast of the Yucatan Peninsula. Cont. Shelf Res. 2014, 77, 38–50. [Google Scholar] [CrossRef]
  63. López-Mendoza, P.G.; Ruiz-Fernández, A.C.; Sanchez-Cabeza, J.A.; van Tussenbroek, B.I.; Cuellar-Martinez, T.; Pérez-Bernal, L.H. Temporal trends of organic carbon accumulation in seagrass meadows from the northern Mexican Caribbean. Catena 2020, 194, 104645. [Google Scholar] [CrossRef]
  64. Cortés, J.; Oxenford, H.A.; van Tussenbroek, B.I.; Jordán-Dahlgren, E.; Cróquer, A.; Bastidas, C.; Ogden, J.C. The CARICOMP Network of Caribbean Marine Laboratories (1985–2007): History, key findings, and lessons learned. Front. Mar. Sci. 2019, 5, 519. [Google Scholar] [CrossRef]
  65. Boström, C.; Jackson, E.L.; Simenstad, C.A. Seagrass landscapes and their effects on associated fauna: A review. Estuar. Coast. Shelf Sci. 2006, 68, 383–403. [Google Scholar] [CrossRef]
  66. Connell, S.D.; Fernandes, M.; Burnell, O.W.; Doubleday, Z.A.; Griffin, K.J.; Irving, A.D.; Falkenberg, L.J. Testing for thresholds of ecosystem collapse in seagrass meadows. Conserv. Biol. 2017, 31, 1196–1205. [Google Scholar] [CrossRef]
  67. Scheffer, M.; Carpenter, S.; Foley, J.A.; Folke, C.; Walker, B. Catastrophic shifts in ecosystems. Nature 2001, 413, 591–596. [Google Scholar] [CrossRef]
  68. Levin, P.S.; Möllmann, C. Marine ecosystem regime shifts: Challenges and opportunities for ecosystem-based management. Philos. Trans. R. Soc. B Biol. Sci. 2015, 370, 20130275. [Google Scholar] [CrossRef]
  69. Dennison, W.C. Effects of light on seagrass photosynthesis, growth and depth distribution. Aquat. Bot. 1987, 27, 15–26. [Google Scholar] [CrossRef]
  70. Fourqurean, J.W.; Boyer, J.N.; Durako, M.J.; Hefty, L.N.; Peterson, B.J. Forecasting responses of seagrass distributions to changing water quality using monitoring data. Ecol. Appl. 2003, 13, 474–489. [Google Scholar] [CrossRef]
  71. Hinds, C.; Oxenford, H.; Cumberbatch, J.; Fardin, F.; Doyle, E.; Cashman, A. Golden Tides: Management Best Practices for Influxes of Sargassum in the Caribbean with a Focus on Clean-Up; Centre for Resource Management and Environmental Studies (CERMES), The University of the West Indies, Cave Hill Campus: Kingston, Jamaica, 2016; 17p. [Google Scholar]
Figure 1. Puerto Morelos reef system, Mexican Caribbean. Base map provided by Earth Geographics in ArcMap 10.8.2 (ESRI Inc., Redlands, CA, USA).
Coasts 05 00008 g001
Figure 2. Temporal changes in the distribution of Sargassum and SBT in near-shore area of Puerto Morelos reef lagoon during the 2018 sargassum-influx season. S1 fringe of brown colored water produced by leachates of decomposed sargassum and S2 sargassum on the beach and near-shore water.
Coasts 05 00008 g002
Figure 3. Representation of the five detected types of the bottom (classes) in Puerto Morelos reef lagoon, and corresponding map in April 2015.
Coasts 05 00008 g003
Figure 4. Distribution maps of near-shore (150 m) seagrass meadows in Puerto Morelos reef lagoon. The map of April 2015 depicts the meadows just before the first SBTs in the study area. See Figure 3 for explanation of the classification of bottom types.
Coasts 05 00008 g004
Figure 5. Distribution maps of seagrass meadows in Puerto Morelos. The map of April 2015 represents the seagrass meadows before the first SBT reported in the area. See Figure 3 for explanation of the classification of bottom types. Near-shore area was analyzed separately.
Coasts 05 00008 g005
Figure 6. Trends detected by the fragmentation analysis showing the development of an inverse relationship between number of patches and their area over time. Beached sargassum biomass (wet kg/m2) in the study area from from [41]) (********** no biomass records).
Coasts 05 00008 g006
Figure 7. Changes in the seagrass landscape, indicated by changes in Largest Patch Index, after repeated disturbances by Sargassum Brown Tides during the main influx seasons of 2015, 2018–2019. The green arrow represents the increase in areas, while red arrows represent the decrease.
Coasts 05 00008 g007
Table 1. Landscape metrics for the fragmentation analysis adapted from [51].
MetricScaleDescription
Number of patches Patch/LandscapeTotal amount of individual patches inside the landscape
Mean patch sizePatchMean area of the patches (m2)
Patch number per classClassHow many patches compose each class
Largest patchClassSize of the largest patch around the study of a determinate class
Largest Patch Index (LPI)LandscapePercent of the landscape that the largest patch comprises:
Area (m2) of the largest patch (100)
Landscape area (m2)
Table 2. Spatial extension measures of SBT in Puerto Morelos study area during 2018 and 2019.
2018MayJun.Jul.Aug.Sep.Oct.Nov.
Covered area (m2)No data00221,198142,246264,986106,875
Mean length (m) No data006748.88241.7
Max length (m)No data0018969.7201124
2019
Covered area (m2)22,9230084,664390,339245,709No data
Mean length (m) 32003713179No data
Max length (m)130090200126No data
Table 3. Puerto Morelos near-shore seagrass (0–150 m; affected by visible SBTs) area cover per bottom class through time (hectares).
ClassDescriptionApril 2015December 2015February 2017February 2020
C1Dense seagrass19.410.118.116.9
C2Seagrass and diverse algae (red/brown and green)1.59.512.610.1
C3Seagrass and rhizophytic green algae4.313.26.45.6
C4Sparse vegetation (seagrass and algae)21.67.98.27.6
C5Sand plains, (with sparse or solitary seagrass or algae)2.69.65.210.2
Table 4. Puerto Morelos reef lagoon seagrass area cover (in hectares) per bottom class through time. See Figure 3 for explanation of the bottom classes.
ClassApril 2015December 2015February 2017February 2020
C135.242.836.251.3
C286.888.474.776.5
C352.550.855.636.5
C43930.160.246.2
C52631.817.733.7
Disclaimer/Publisher’s Note: The statements, opinions and data contained in all publications are solely those of the individual author(s) and contributor(s) and not of MDPI and/or the editor(s). MDPI and/or the editor(s) disclaim responsibility for any injury to people or property resulting from any ideas, methods, instructions or products referred to in the content.

