Article

Video Transect-Based Coral Demographic Investigation

1
ENTROPIE, IRD, IFREMER, CNRS, University of Reunion, University of New Caledonia, Noumea 98840, New Caledonia
2
Marine Science Institute, University of California, Santa Barbara, CA 93106, USA
3
Laboratoire d’Excellence CORAIL, F-75006 Paris, France
4
Graham Sustainability Institute, University of Michigan, Ann Arbor, MI 48109, USA
*
Author to whom correspondence should be addressed.
These two authors contribute equally to this work.
Coasts 2023, 3(4), 370-382; https://doi.org/10.3390/coasts3040022
Submission received: 11 September 2023 / Revised: 1 October 2023 / Accepted: 30 October 2023 / Published: 6 November 2023

Abstract

:
Demographic studies that quantify species’ performances for survival, growth, and reproduction are powerful means to characterize sources of demographic bottlenecks and predict community dynamics. However, they require fine-scale surveys of populations in the field, and are often too effort-intensive to be replicable at a large scale and in the long term. We developed a standardized digital approach for extracting demographic data on species’ abundances, sizes, and positions within video transects, enabling back-from-the-field data acquisition and therefore optimizing time spent in the field. The approach is based on manual species identification, size measurements, and mapping in video transects, mimicking what is traditionally performed in the field, though it can be automated in the future with the deployment of artificial intelligence. We illustrate our approach using video surveys of a reef-building coral community in New Caledonia. The results characterize the composition of the coral community and demographic performances as key ecological indicators of coral reef health, shed light on species’ life strategies and constraints to their demographics, and open paths for further quantitative investigations. Key findings include the diversity of life strategies with contrasting levels of investment in survival, growth, and reproduction found among the six taxa dominating the coral community (Acropora, Montipora, Porites, Galaxea, Favia, Millepora), indicating the diversity of demographic paths to ecological success. Our results also indicate that several species have adapted mechanisms to prevail under limiting hydrodynamic environments through the propagation of coral fragments. Our approach facilitates image-based demographic investigations, supporting endeavors in ecology and ecosystem management.

1. Introduction

As ecosystems face increasing environmental change and human impacts, performing ecological diagnostics is increasingly crucial to anticipate declines and identify solutions which support ecosystem resilience [1,2,3,4]. Demographic studies that quantify species’ dynamics and performances in key life cycle processes, such as survival, growth, and reproduction, are powerful tools for characterizing life strategies, influential regulatory mechanisms, and community trajectory predictions [5]. However, the high level of effort necessary to perform demographic surveys that track individual organisms over significant timeframes (e.g., multi-annual surveys) prevents a wider use of demographic approaches to inform their management. We developed a new digital approach for mapping and measuring individual organisms in fixed transects captured by video, replacing data collection tasks previously performed for long hours in the field. With growing camera resolution and computer power, digital tools are increasingly used to characterize ecosystem structure and dynamics, most of which focus on the community scale ecological metrics of species’ abundance such as percent cover [6,7,8], though more intensive computing tools requiring resources and expertise are also being developed [9,10,11]. Our digital approach differs from existing tools by providing a resource-efficient means to map the positions and measure the sizes of individual organisms within video transects, therefore enabling characterizations of community structure in terms of species’ composition, abundance, and size distribution at each observation, and estimations of species’ demographic performances in survival, growth, reproduction, and migration between consecutive surveys [12]. We describe the application of our approach to a reef-building coral community in New Caledonia.
Coral reefs are central to marine biodiversity and human well-being, but are declining due to increasingly altered coastal environments associated with coastal development, pollution, fishing, and climate change [1,4,13,14,15]. The declines in coral community abundance, composition, and size are major threats to tropical marine biodiversity and the societies that depend on these ecosystems for services such as food, shelter from storm waves, and economic and social fulfillment [15,16,17]. Researchers and managers currently use fine-scale surveys of coral populations to investigate the demographic mechanisms controlling coral reef resilience and to predict future trajectories [18,19,20,21]. However, these efforts lag far behind the challenge of coral reef conservation in the twenty-first century [1,4], and are often restricted to only a few eminent sites that benefit from high concentrations of scientific focus, excluding most of the world’s coral reefs. Because species mapping and size measurements are traditionally performed by hand in the field, with only field notes being recorded, the shift to image-based data extractions and archiving significantly improves the efficiency of data collection and archiving. This need is particularly acute for understanding remote and extreme environments, such as those under water. While the development and accessibility of high-definition cameras have opened paths for increased imagery-based approaches to ecosystem surveys, analytical tools for characterizing population and community dynamics remain restricted. We demonstrate the application of our digital approach by characterizing the abundance, composition, size distribution, and demographic performances of a coral community on the outer reef of New Caledonia over one year, and describe the benefits for ecological investigations in the future.

2. Materials and Methods

2.1. Field Survey and Data Extractions

We recorded six contiguous 5 m × 0.8 m (4 m2) video transects along a randomly selected representative 30 m stretch of the reef substrate at a permanent study site situated at a mid-range, 10 m water depth, on the outer reef slope of New Caledonia’s south-western barrier reef in March of 2021 and 2022 (Supplementary Material Figure S1). The mid-range depth on the outer reef is where the highest taxonomic diversity is typically found in New Caledonia reefs, which are among the most diverse and healthy in the world, in part due to the relatively small and concentrated human population compared to the size of the coral system [22,23,24,25]. However, our digital tool can be used to characterize community dynamics and demographic performances in any ecological environment, provided there are adequate lighting conditions for recording images. Video transects were recorded on SCUBA (self-contained underwater breathing apparatus) using GoPro cameras facing downward (90°) towards the substrate at a distance of 50 cm from the transect tape. All individual reef-building corals (scleractinians and the calcifying hydrozoan Millepora) in the video transects were identified by genus and morphotype, measured in two dimensions (length, width), and the position of their centroid was mapped using X-Y coordinates (Figure 1), an image-based adaptation of what is traditionally achieved in situ during long dives [12,18]. No major disturbance to the reef was recorded over the one-year span of the survey.
Coral mapping and measurements are performed by extracting individual video frames, and measuring coral size and position relative to the graduated transect tape (Figure 1). Only coral colonies entirely visible in the videos were considered, excluding those only partially visible. Information on coral taxonomic identity, morphotype, size, and position within transects was recorded in a data spreadsheet, enabling the characterization of the structure of the coral community for each survey as well as population dynamics between surveys. Coral identification was based on morphological characteristics as described in taxonomic guides (e.g., www.coralsoftheworld.org) (accessed on 1 February 2022), and knowledge of the local reef system. Individual coral performances in terms of survival, growth, and recruitment are characterized as described in Kayal et al. [12]. New recruits were defined as small corals absent from the 2021 video transects and visible in 2022. Corals were detected within a size of ~1 cm, with the smallest coral in this study measuring 0.7 cm in length and 0.3 in width, for an average diameter of 0.5 cm. Other coral dynamics (fragmentation, fission, fusion, and migration) were also quantified, but not considered in this study. Data extractions from the video transects were coded in Python, complemented with OpenCv (https://opencv.org) (accessed on 1 February 2022) and Tkinter (https://pythonbasics.org/tkinter/) (accessed on 1 February 2022) libraries (Material S1). Coral identification, mapping, and size measurements were performed by the same observer.

2.2. Data Analysis

For each year (2021 and 2022), we characterized the coral community abundance, composition, and size distribution of the six dominant coral genera (Acropora, Montipora, Porites, Galaxea, Favia, Millepora), for which we used individual coral dynamics across two surveys to estimate annual demographic performances in survival, growth, and recruitment. Size-dependent coral survival and growth rates were estimated using generalized linear mixed-effect models, and Kolmogorov–Smirnov tests were performed to compare size distributions among populations. Note that for coral survival and growth estimates, the sampling unit is the coral colony, not the transect. We accounted for size-dependent variation in our estimations of coral survival by relating survival probability to year y + 1 to initial size at year y, using generalized linear mixed-effect models to account for the random effects of longitudinal observations on individual colonies [12]. Similarly, size-dependent growth was characterized by relating final size at year y + 1 to initial size at year y. Coral sizes were log-transformed to reduce data dispersion, and the models were checked for assumptions of residual homogeneity. For coral abundance and recruitment estimates, preliminary analysis showed similar results when considering the 30 m stretch of the reef recorded in video as six contiguous 5 m long transects, versus dividing it into five 5 m long transects spaced by 1 m gaps, and the former was retained. All colonies were used to estimate the size distribution of coral populations. Modeling and graphing were performed in R (www.R-project.org) (accessed on 1 February 2022) supplemented with the NLME package [26].

3. Results

3.1. Coral Community Structure

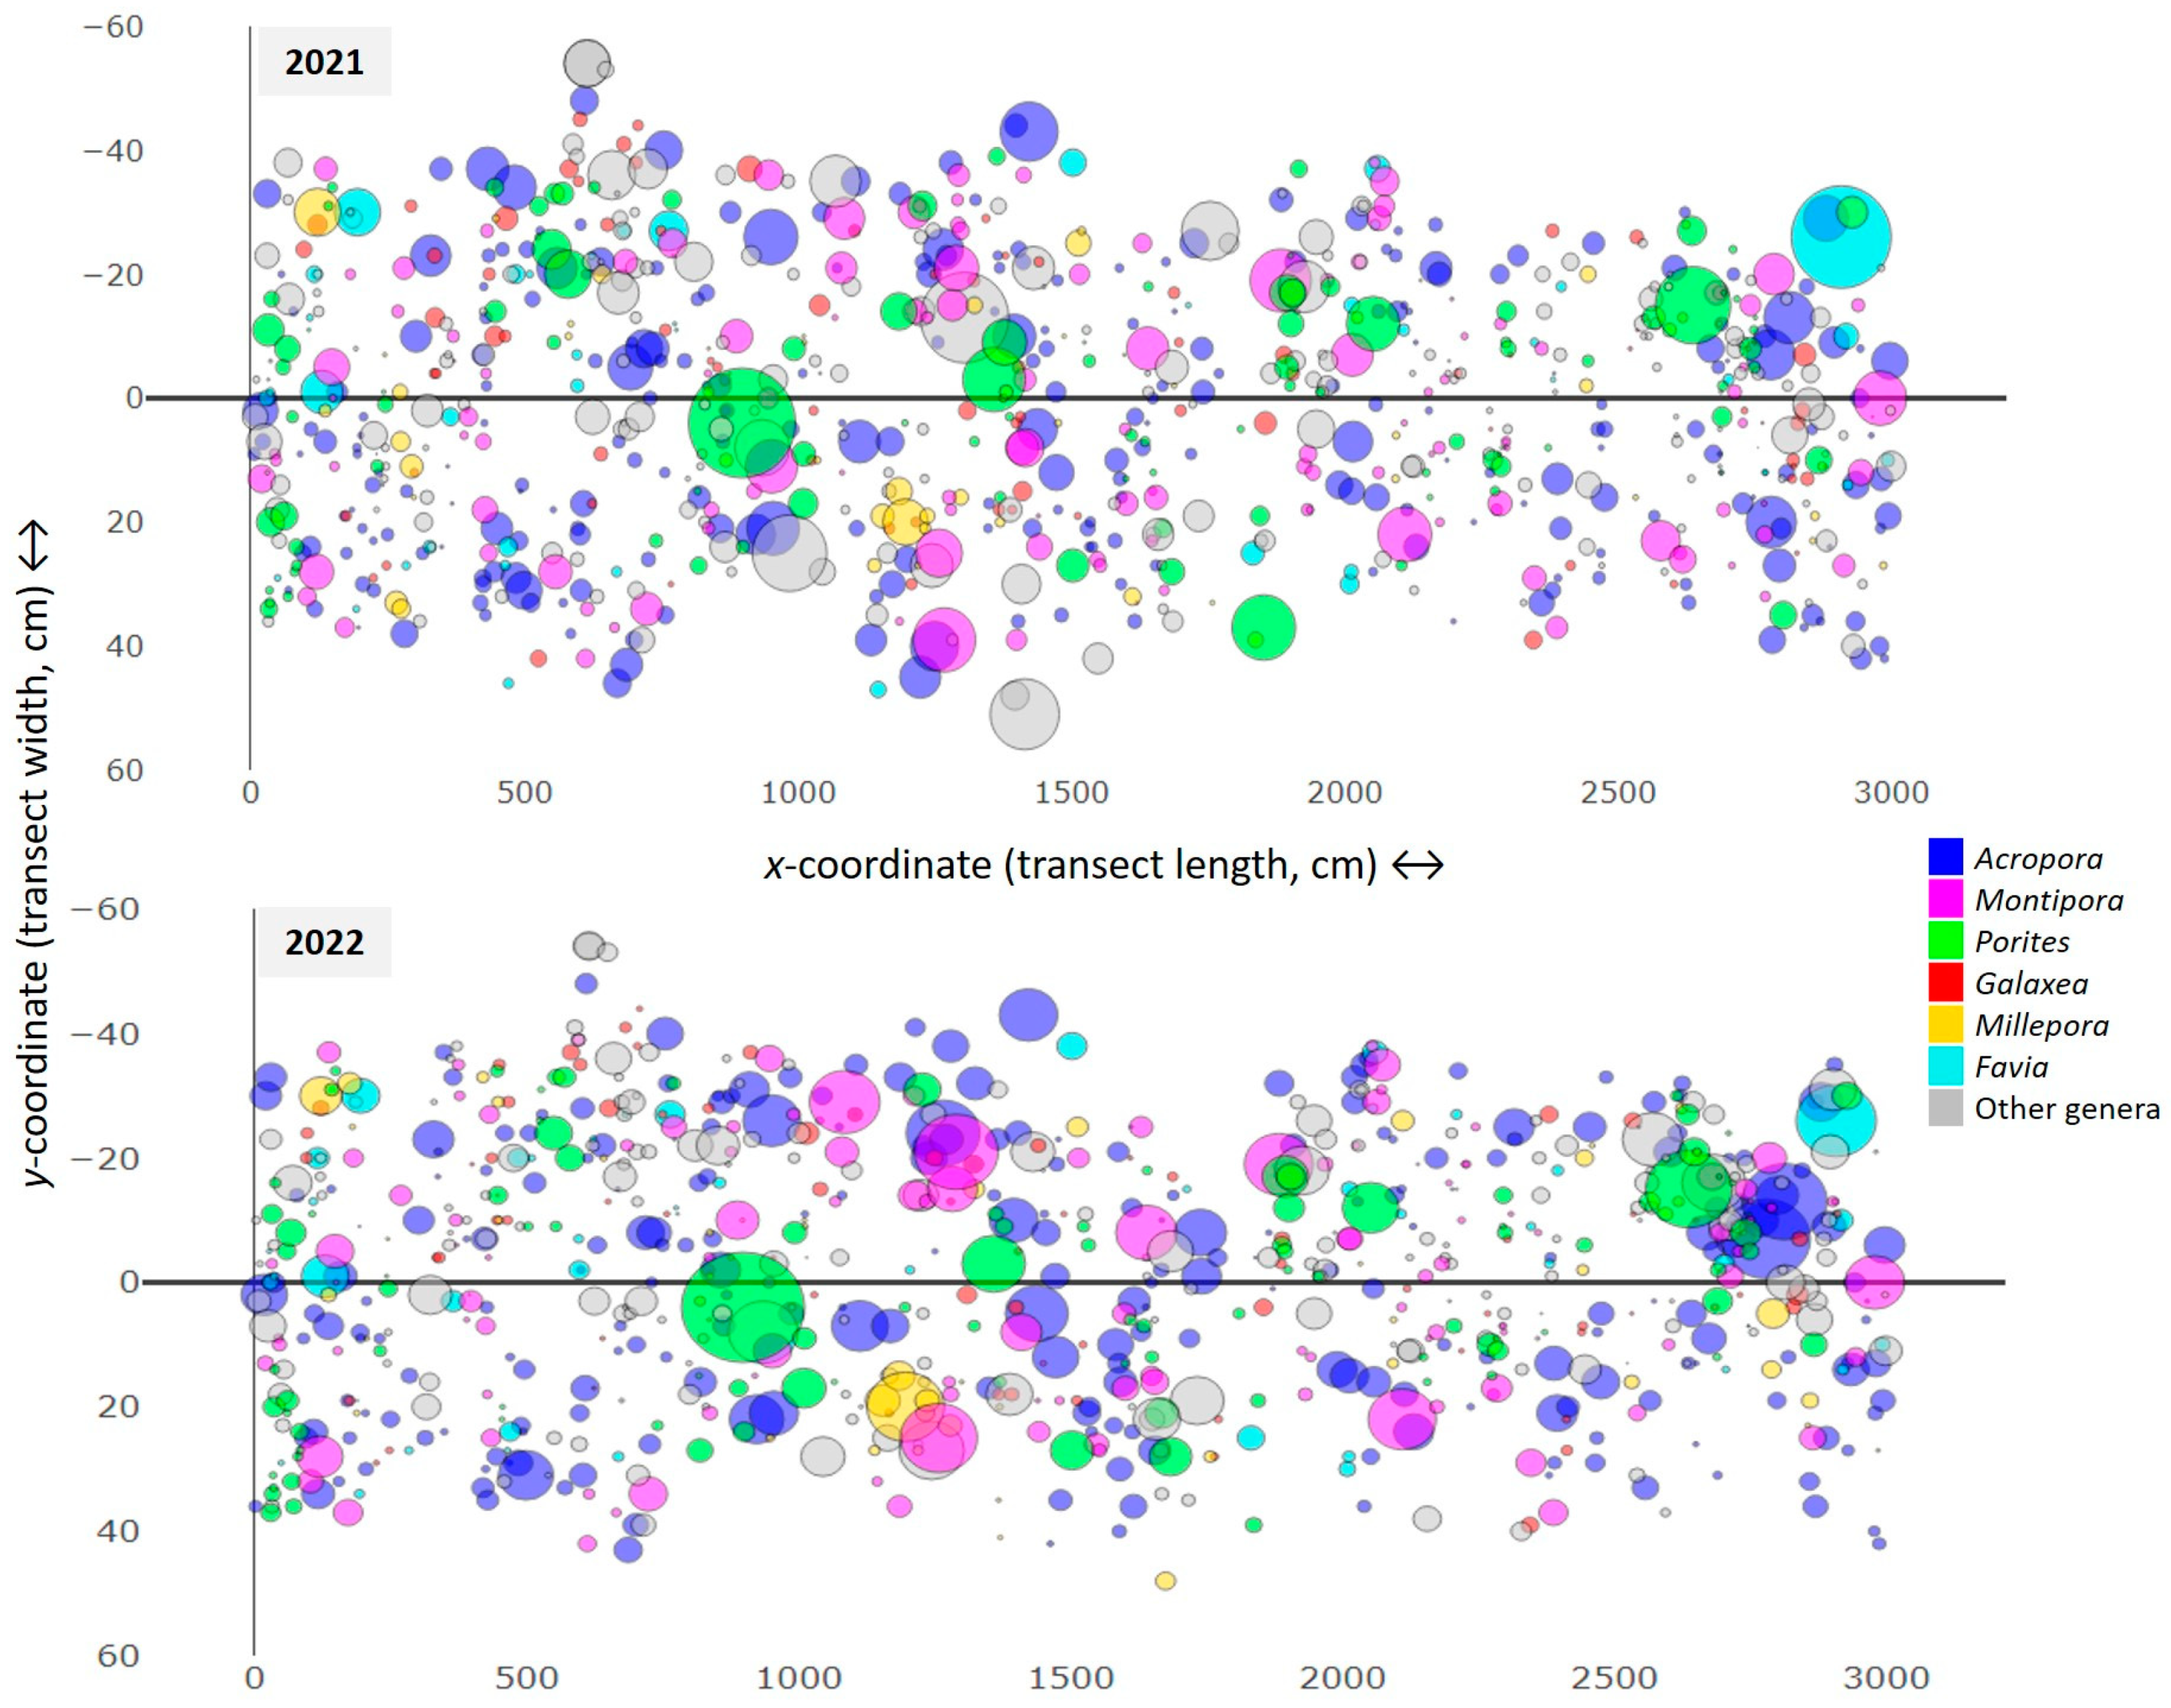
We identified, mapped, and measured 1104 corals from 26 different genera over the two years of our survey (2021–2022); 894 corals were recorded in 2021 and 838 in 2022, with 628 colonies observed in both years (Figure 2). The corals that were not observed in both years consisted of new recruits in 2022 (84), corals that had died between the two years (213), and those situated in the shadows or on the edges of the video transects and only visible in one of the survey years (157).
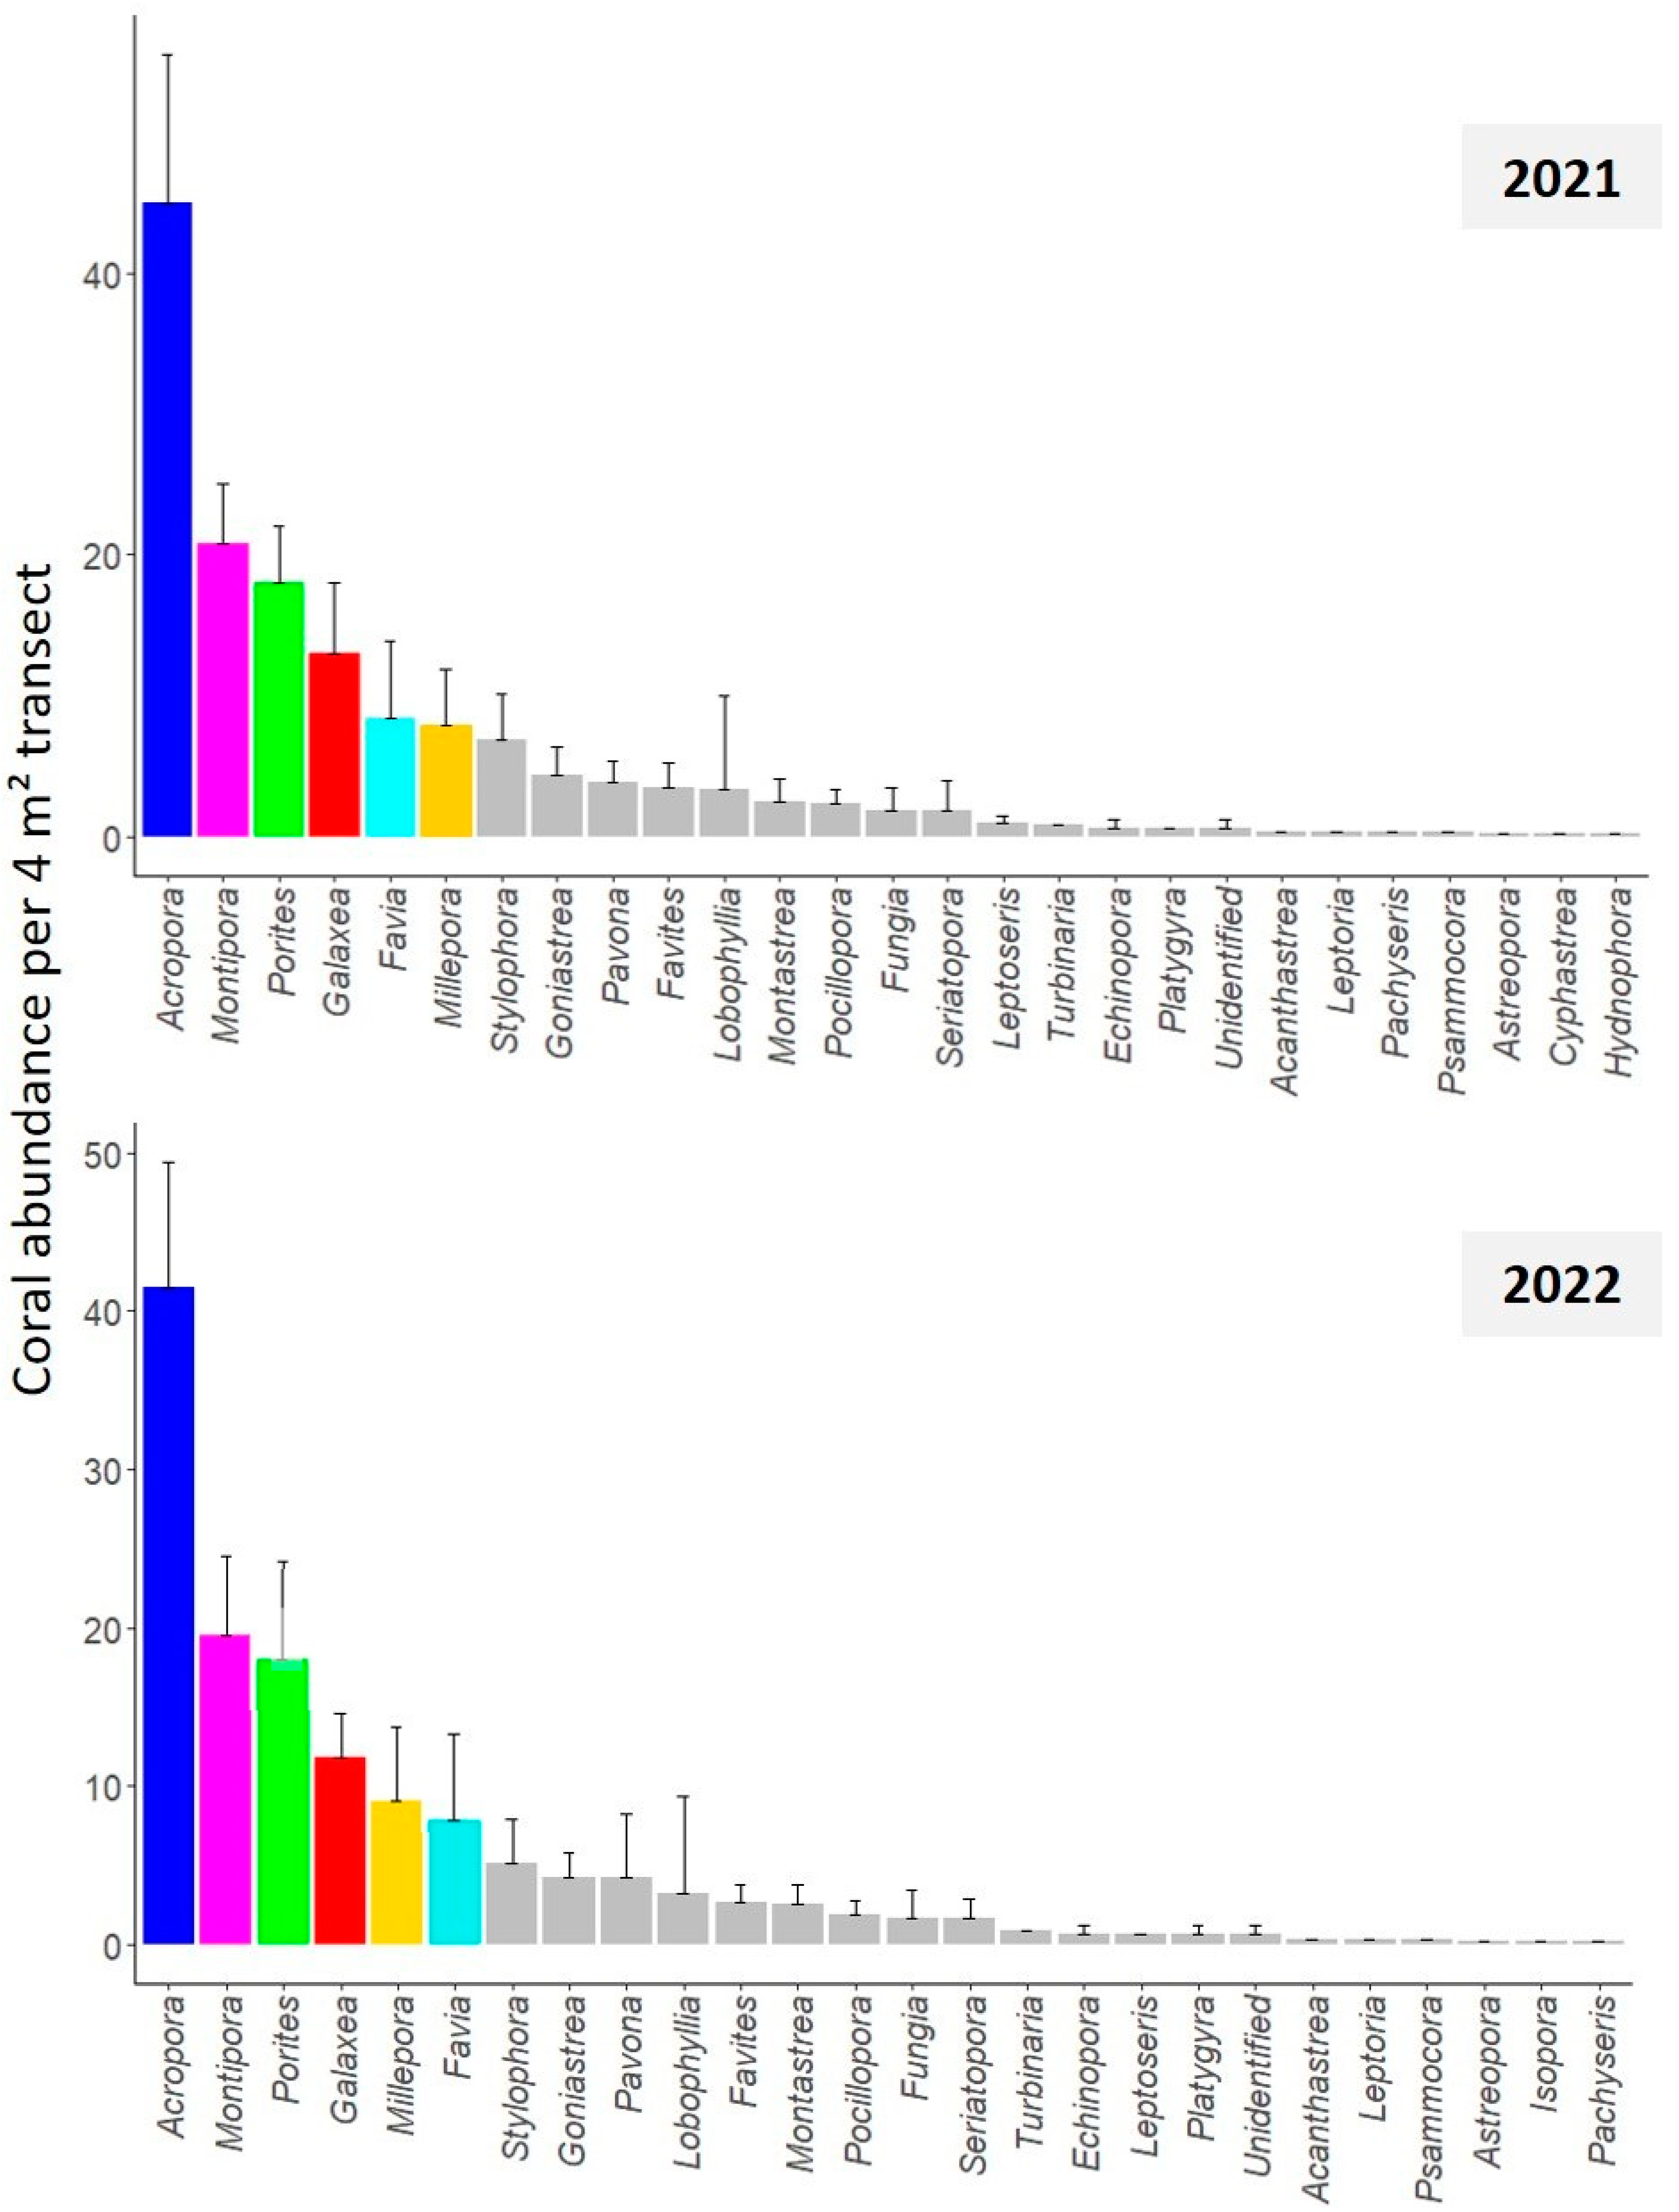
The coral community abundance averaged 149 colonies ± 24 SD (standard deviation) per 4 m2 transect (equivalent to 37 corals per m2) in 2021, and 140 corals ± 26 SD per 4 m2 (35 corals per m2) in 2022. Six genera dominated the coral community with, over the two surveys, 30% of colonies belonging to Acropora, 14% Montipora, 12% Porites, 9% Galaxea, 6% Millepora, and 6% Favia (Figure 3, Table S1).
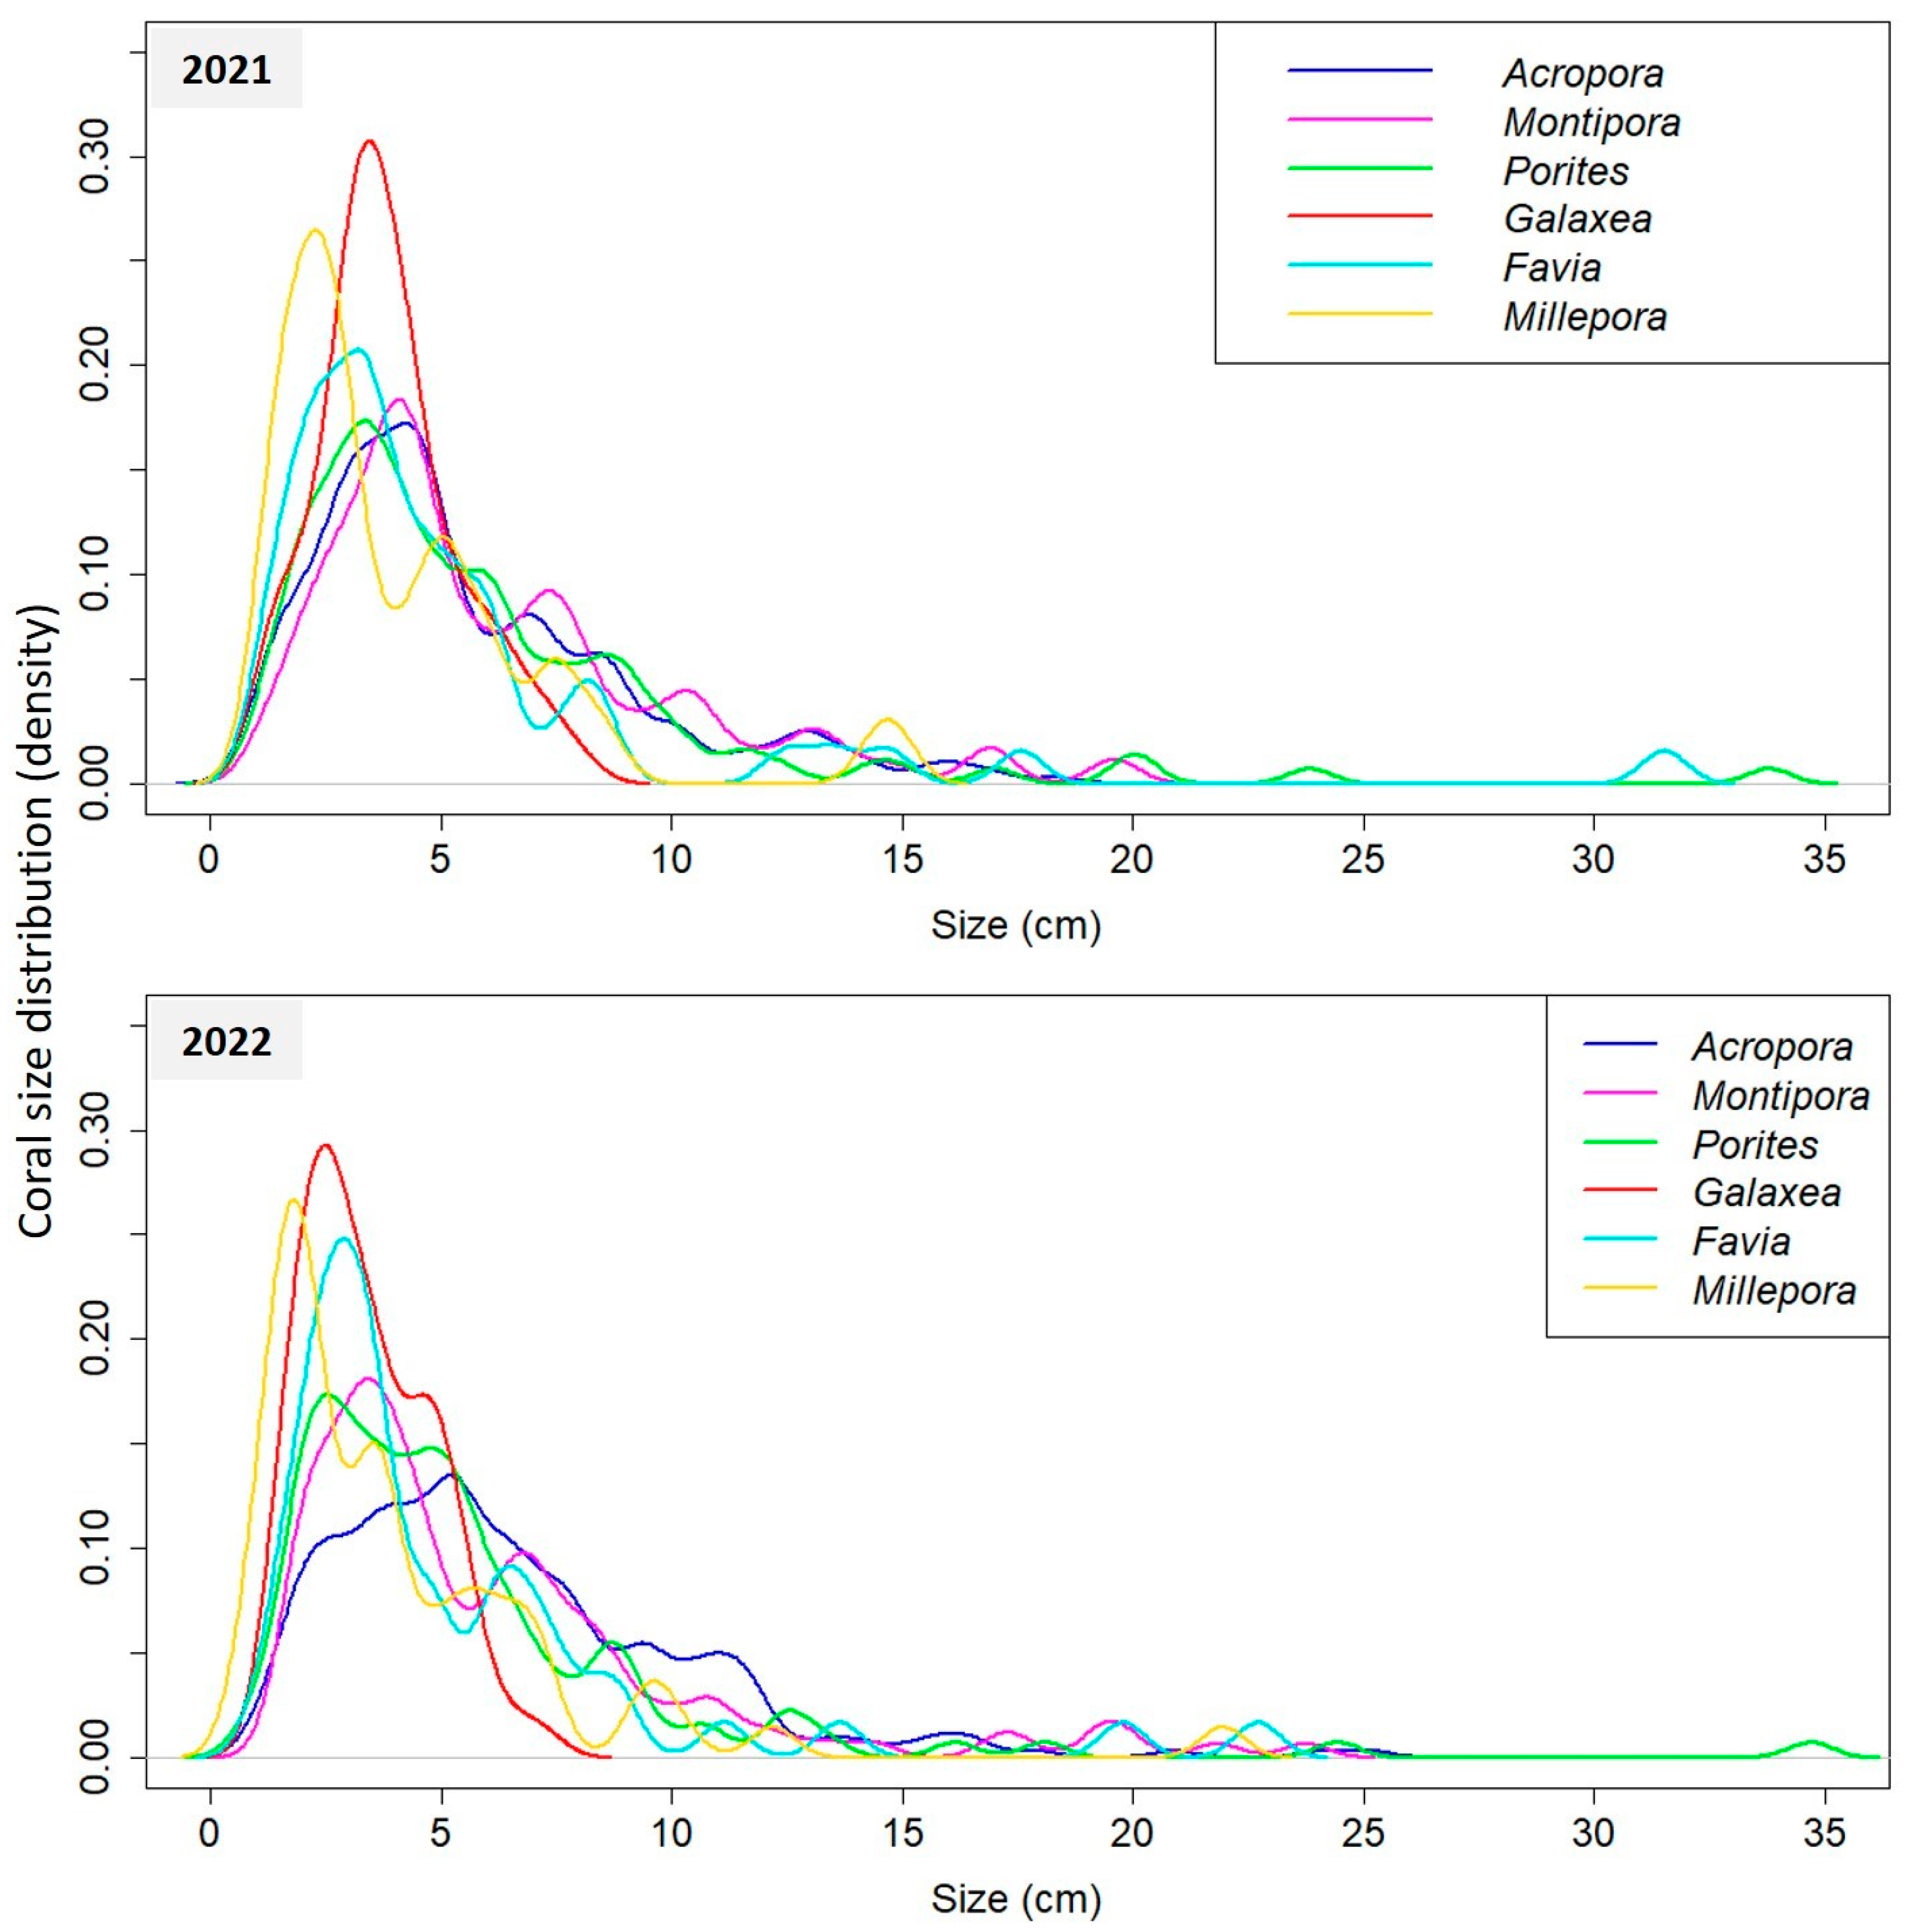
We compared the size distributions of populations among the six dominant coral genera in 2021 and 2022 using Kolmogorov–Smirnov tests (Table S2). Overall, the Acropora, Montipora, and Porites populations were characterized by larger coral sizes, with mean colony diameters > 5.6 cm (Figure 4 and Figure S2). In contrast, Galaxea, Favia, and Millepora populations were characterized by higher proportions of small colonies, with mean diameters < 5.3 cm.

3.2. Coral Demographic Performances

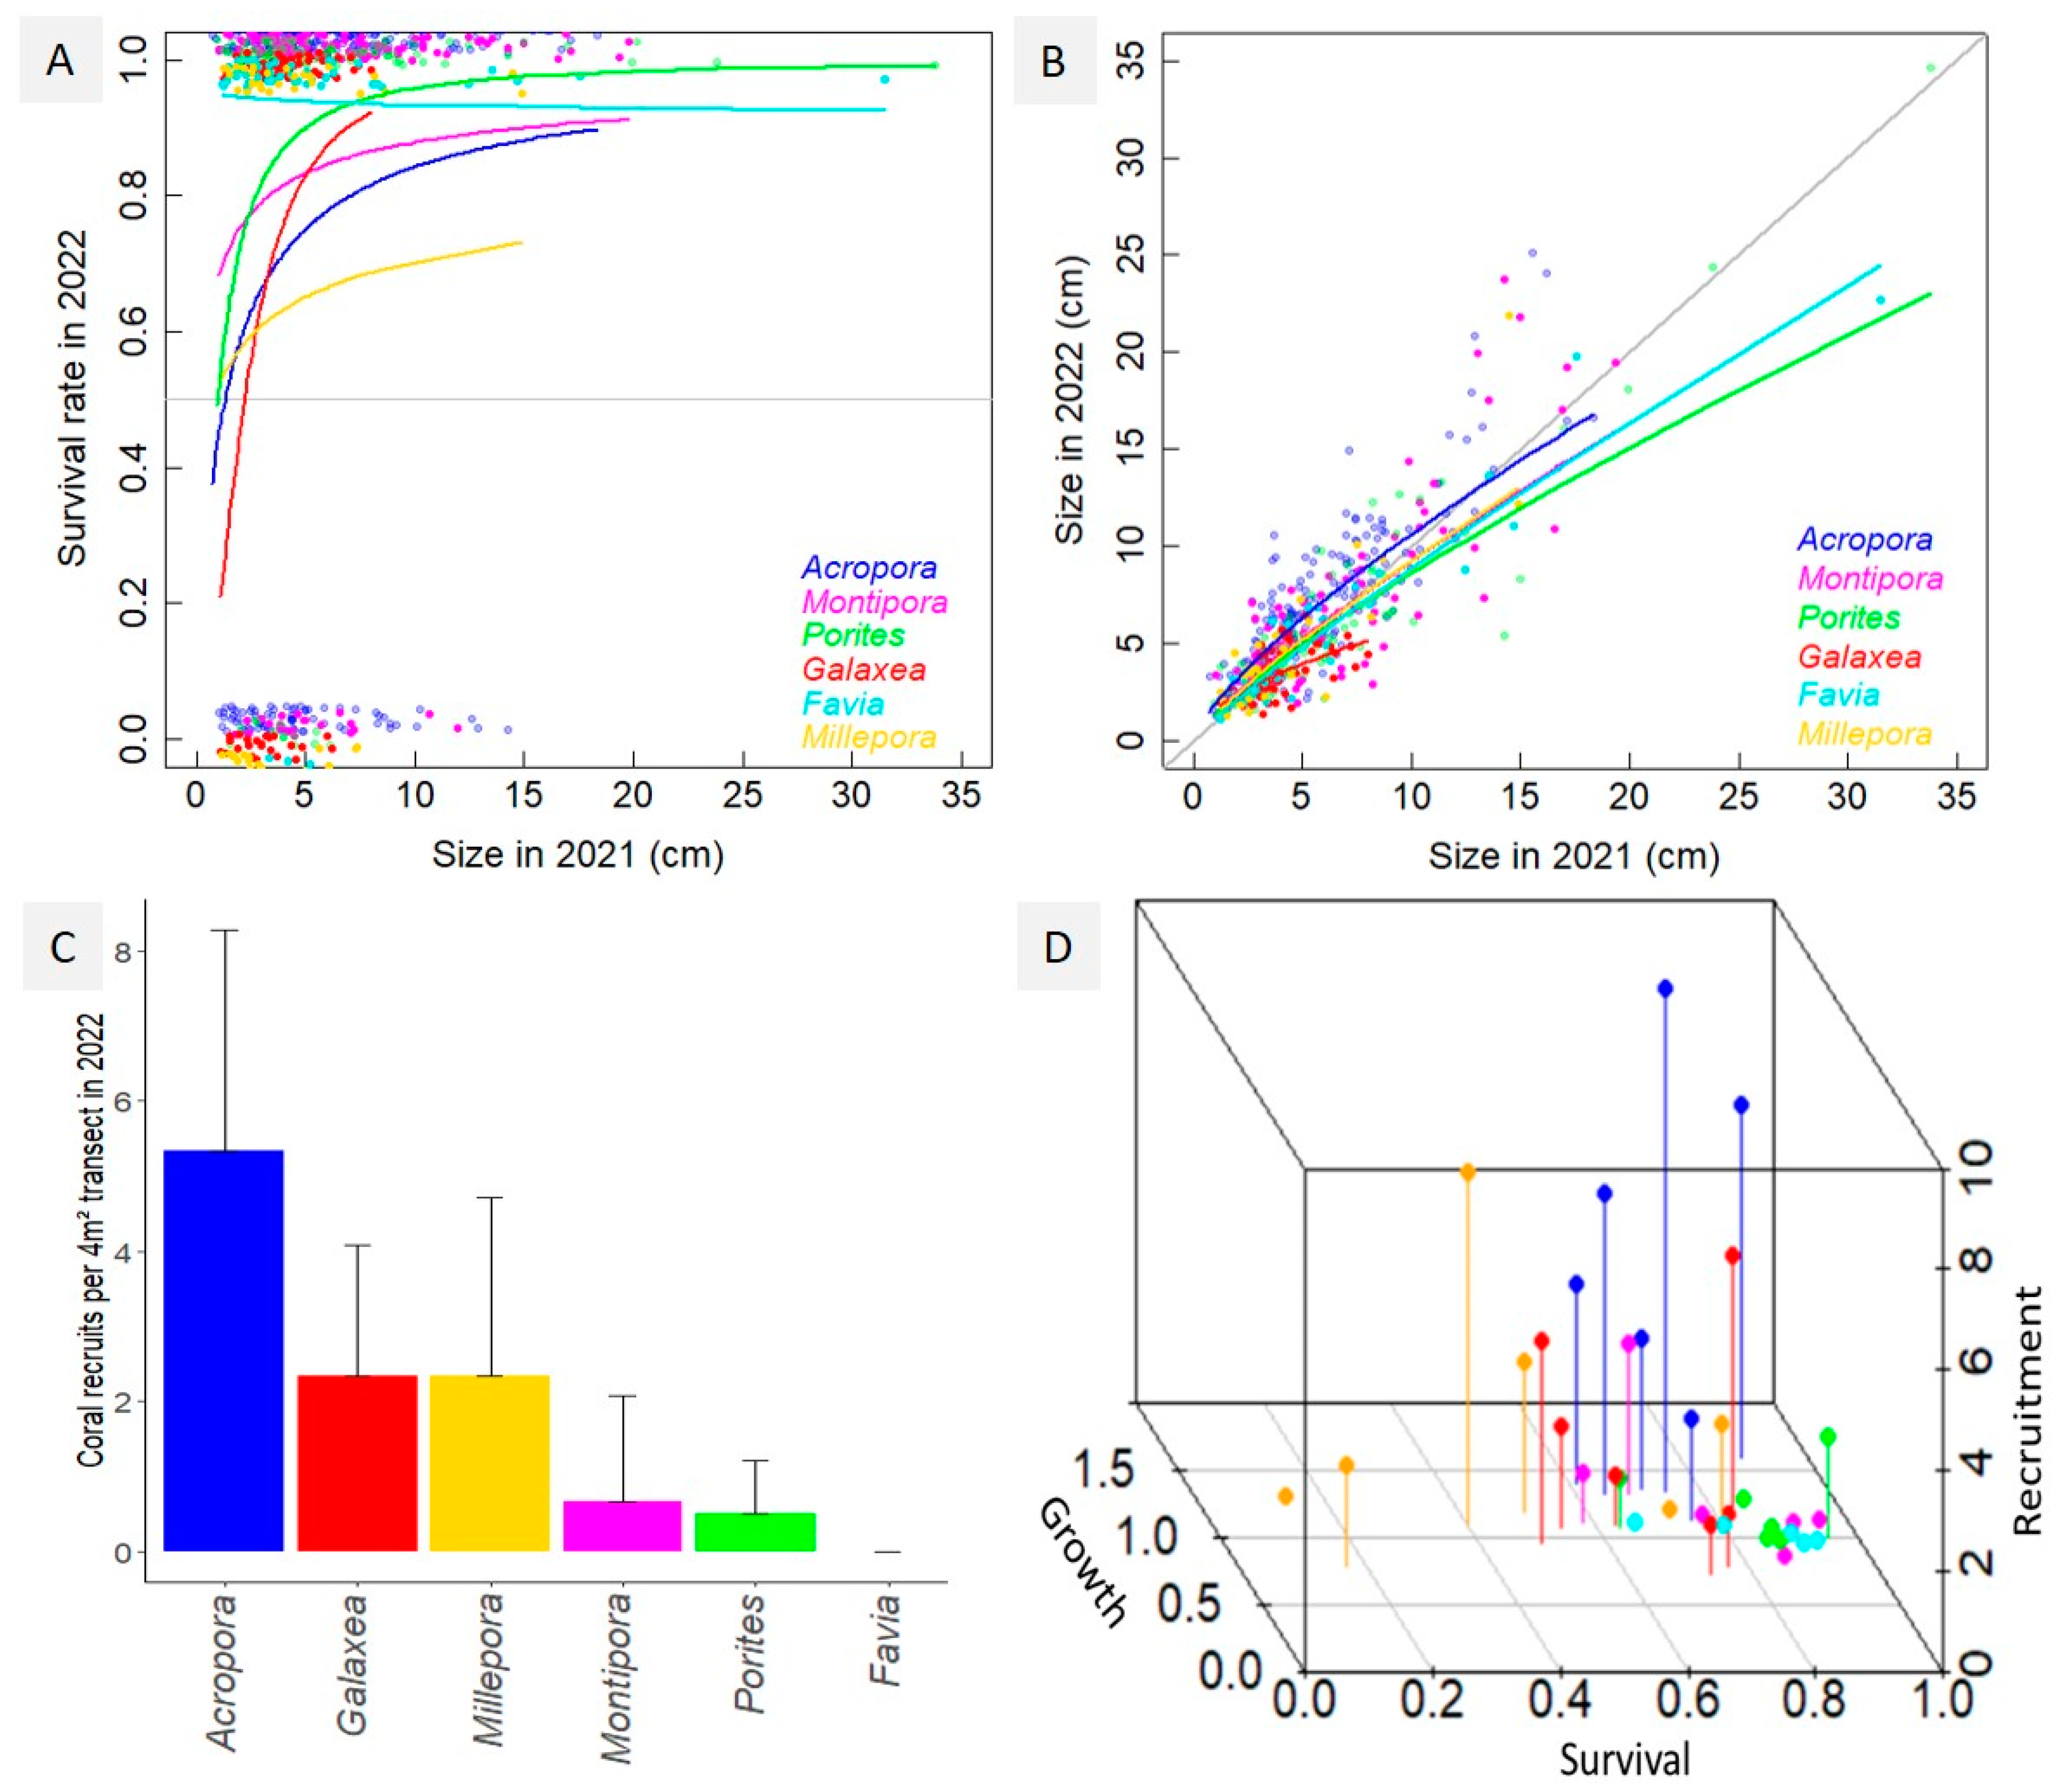
Coral survival was lowest at small sizes and increased with colony size, except for Favia, in which the probability of survival was consistently > 90% across the size range (Figure 5A). The other coral genera showed different degrees of size-refuging, i.e., when survival increases with size, as seen in many species [5,12,19], with Porites showing the highest survival, >90%, for colony sizes above 5 cm and ~98% beyond 10 cm. In contrast, survival was lowest for Millepora with a 70% chance of survival for a colony size of 10 cm. Galaxea had the lowest survival rate at small sizes, reaching the 50% survival size threshold at a mean colony diameter of 2.5 cm. Comparatively, Acropora and Porites colonies achieved a 50% survival probability at a size of ~1.5 cm, and the other genera at even smaller sizes.
In all genera, coral relative growth was highest at small sizes and shifted to colony shrinkage at larger sizes, though at different rates among taxa (Figure 5B). Acropora had the highest growth at all sizes, with colony shrinkage becoming predominant beyond an average size of 13 cm. In contrast, Galaxea had the lowest growth rate with many cases of colony shrinkage, even at small, mean diameter < 5 cm stages. The other genera showed intermediate patterns with, on average, positive growth until a size of ~7.5 cm, beyond which they tended to shrink.
For recruitment, 11 ± 4 SD coral recruits per 4 m2 transect were recorded, the majority being Acropora (5 ± 3 SD; Figure 5C). No recruits were recorded for Favia, while the other genera showed intermediate levels with 1–2 recruits per transect.
Summarizing coral demographic performances in survival, growth, and recruitment in a three-dimensional space enables a visual distinction of species’ life history characteristics (Figure 5D). High recruitment and growth rates set Acropora apart. Montipora, Porites, and Favia produce low numbers of recruits that have higher chances of survival, whereas the calcifying hydrozoan Millepora (also known as fire coral), compensates for low survival with intermediate recruitment rates. Galaxea displays intermediate features.

4. Discussion

4.1. Characterizing Coral Demographic Performances

Demographic studies are foundational to understanding the drivers of species’ dynamics and evaluating community responses to changing environments [5]. Yet, limitations in data acquisition have limited their large-scale applications in population ecology and ecosystem conservation. This is the case in New Caledonia, where one of the world’s largest and most prolific coral reef systems lies [23], but where no studies on coral demographic performances had hitherto been conducted. At a time when environmental changes and impacts on ecosystems press for increased quantitative knowledge of species’ dynamics and their drivers, our relatively simple digital approach enables extracting data on community abundance and composition, and the dynamics of individuals therein, from video transects, facilitating resource-effective, image-based demographic investigations. Applied to our underwater, outer reef coral community in New Caledonia, we characterize the community composition and demographic performances of the dominant reef-building coral taxa over a year, providing insight into species’ life histories and constraints to their demographics.
The studied coral community comprised 26 genera occupying the reef substrate with a density of 36 colonies per m2, with six dominant genera representing > 75% of corals, by order of abundance: Acropora, Montipora, Porites, Galaxea, Favia, and Millepora. Coral populations were predominantly composed of small, <5 cm colonies, with Acropora, Montipora, and Porites displaying higher proportions of larger corals. These six genera typically dominate coral communities in Southwest Pacific reefs, as well as the global reefscape [13,24,27,28].
Taxonomic differences in coral abundance, size, survival, growth, and recruitment reveal a variety of life histories among the dominant genera and shed light on the diverse evolutionary pathways towards the ecological success of dominant coral taxa—a segregation of ecological niches promoting species’ coexistence and high levels of biodiversity [25,29,30]. The most abundant genus, Acropora (representing 30% of surveyed corals) prevailed in recruitment and growth, which is unsurprising as these are the two prominent features of this taxon reported in various regions [12,14,31]. In contrast, higher survival compensated for lower recruitment and growth in Montipora, Porites, and Favia. The massive growth forms of Porites and Favia are archetypes of the stress-tolerant life strategy in corals, typically dominating reefs in extreme and altered environments, whereas Montipora often exhibits intermediate life history features between Acropora and Porites, although within-genera differences also prevail [13,18]. Galaxea and Millepora are also differentiated from the other taxa, achieving abundant populations despite relatively low survival and intermediate recruitment rates.
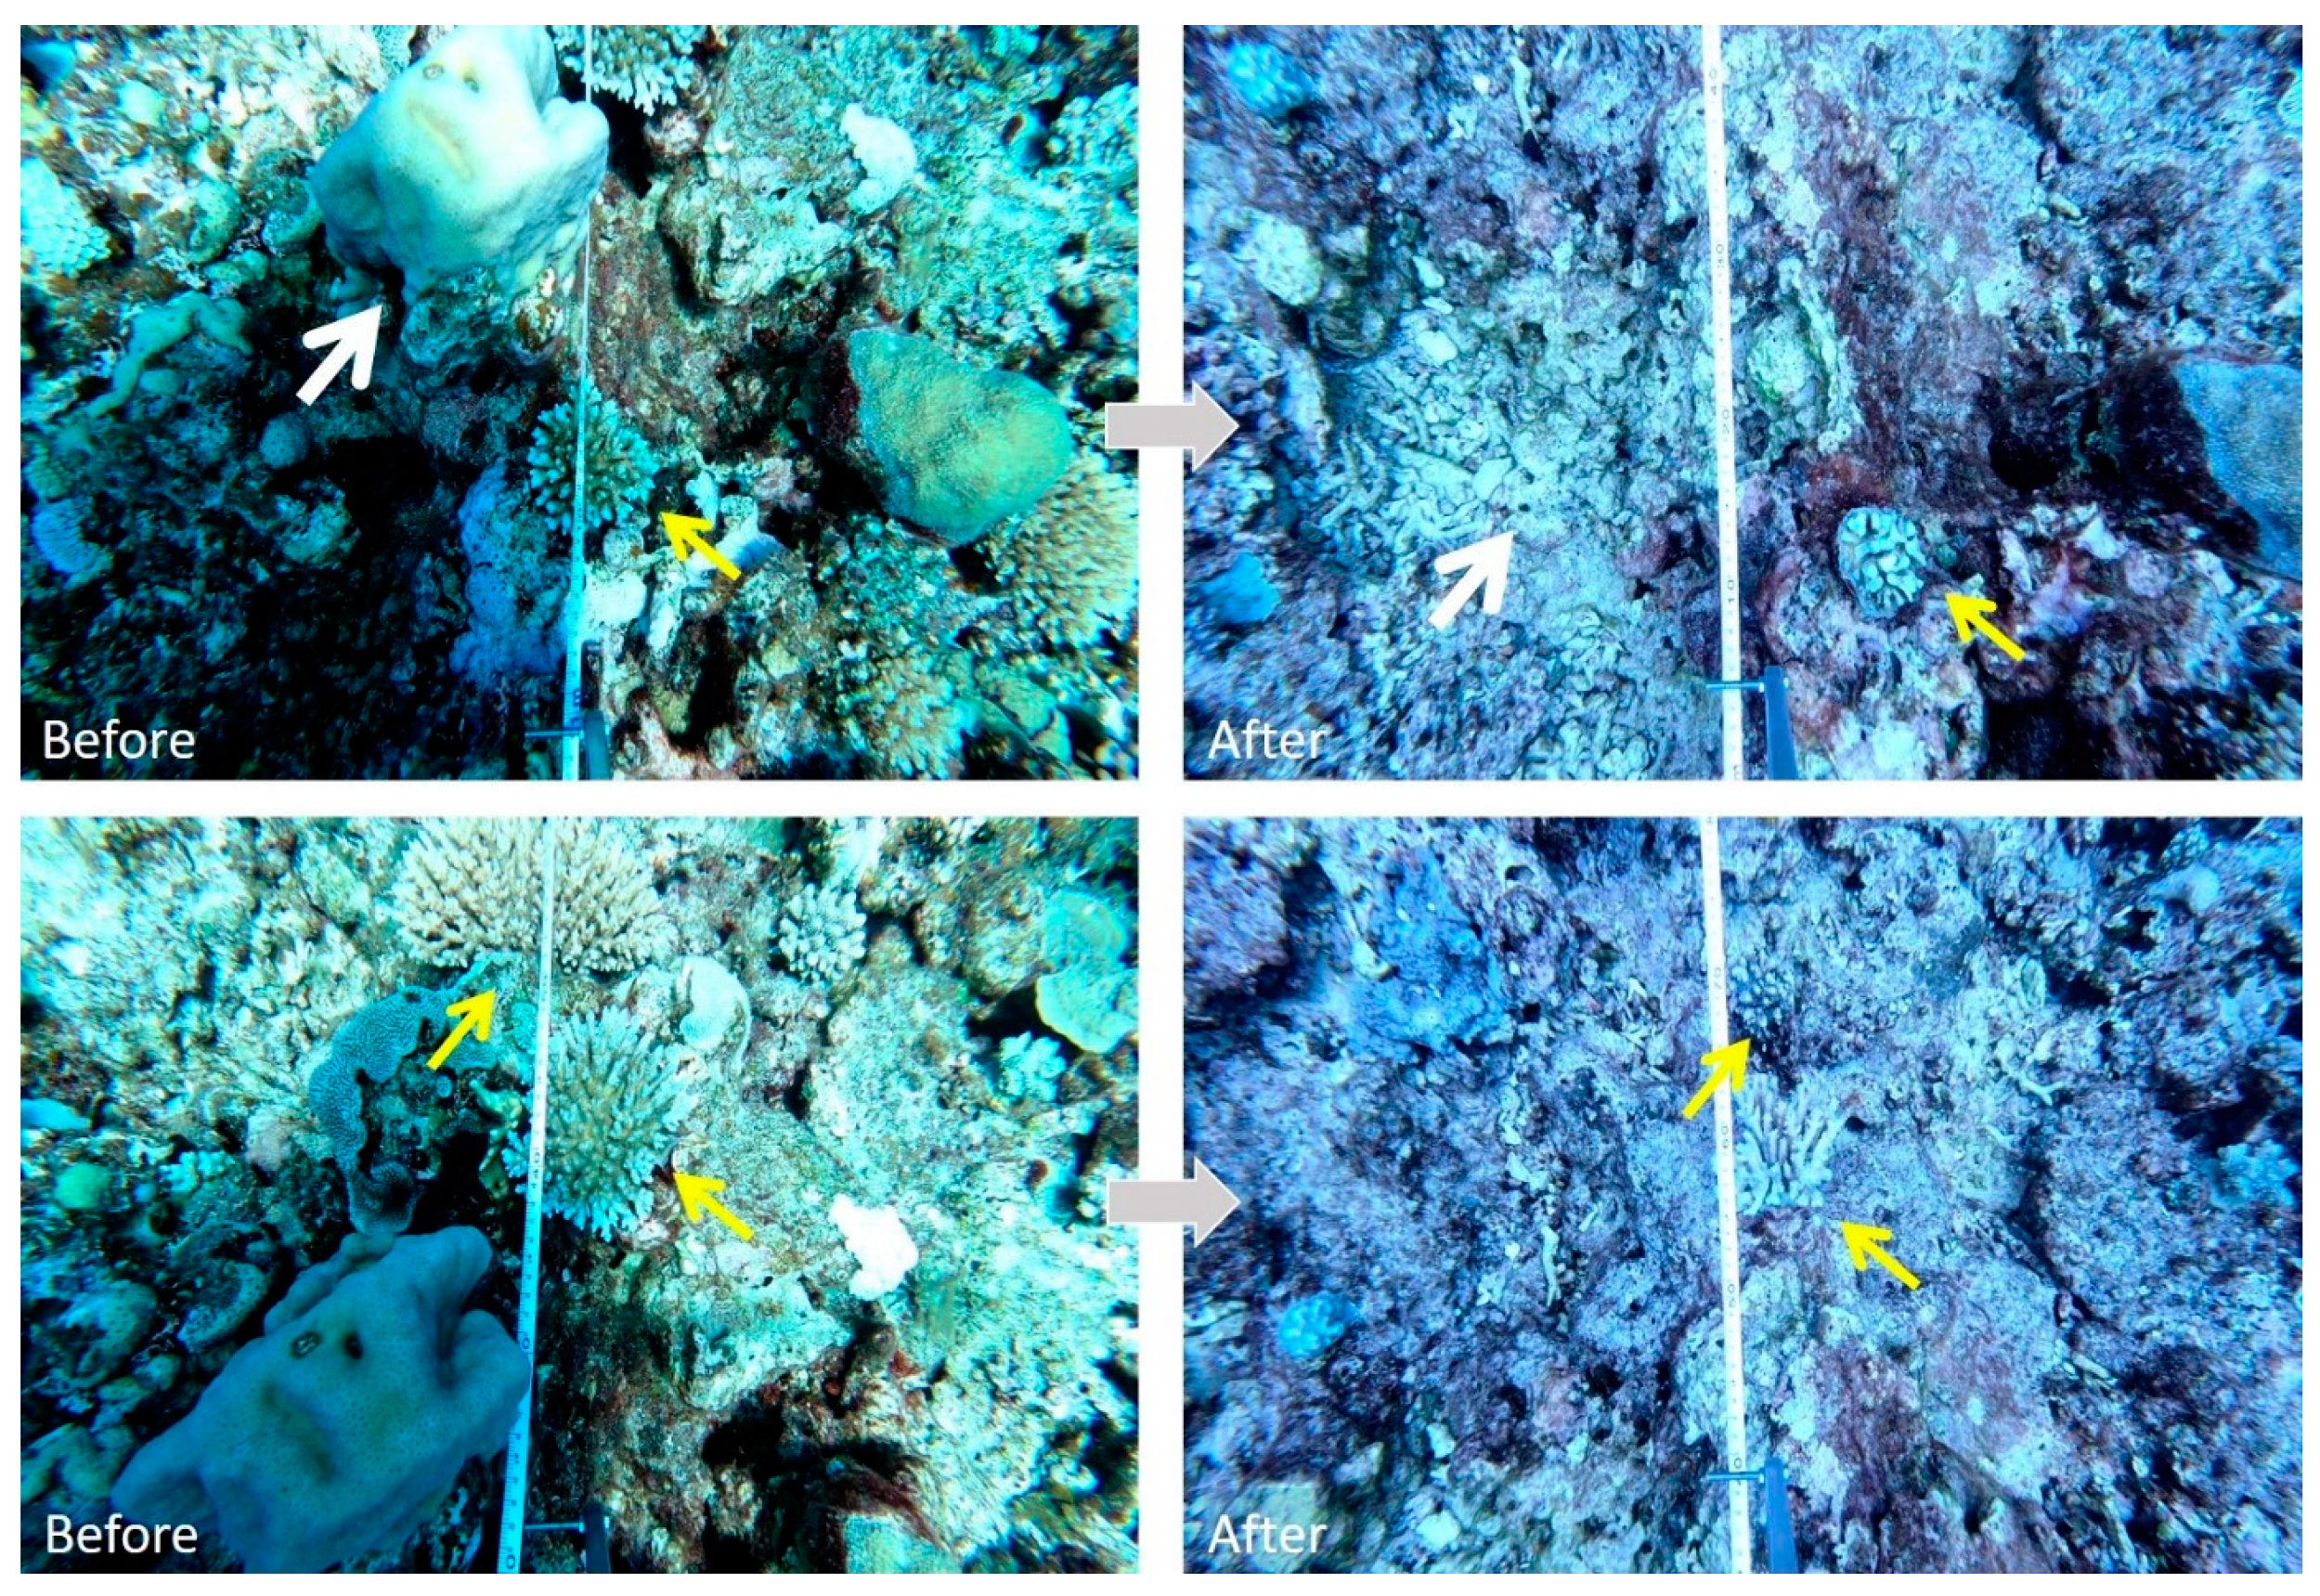
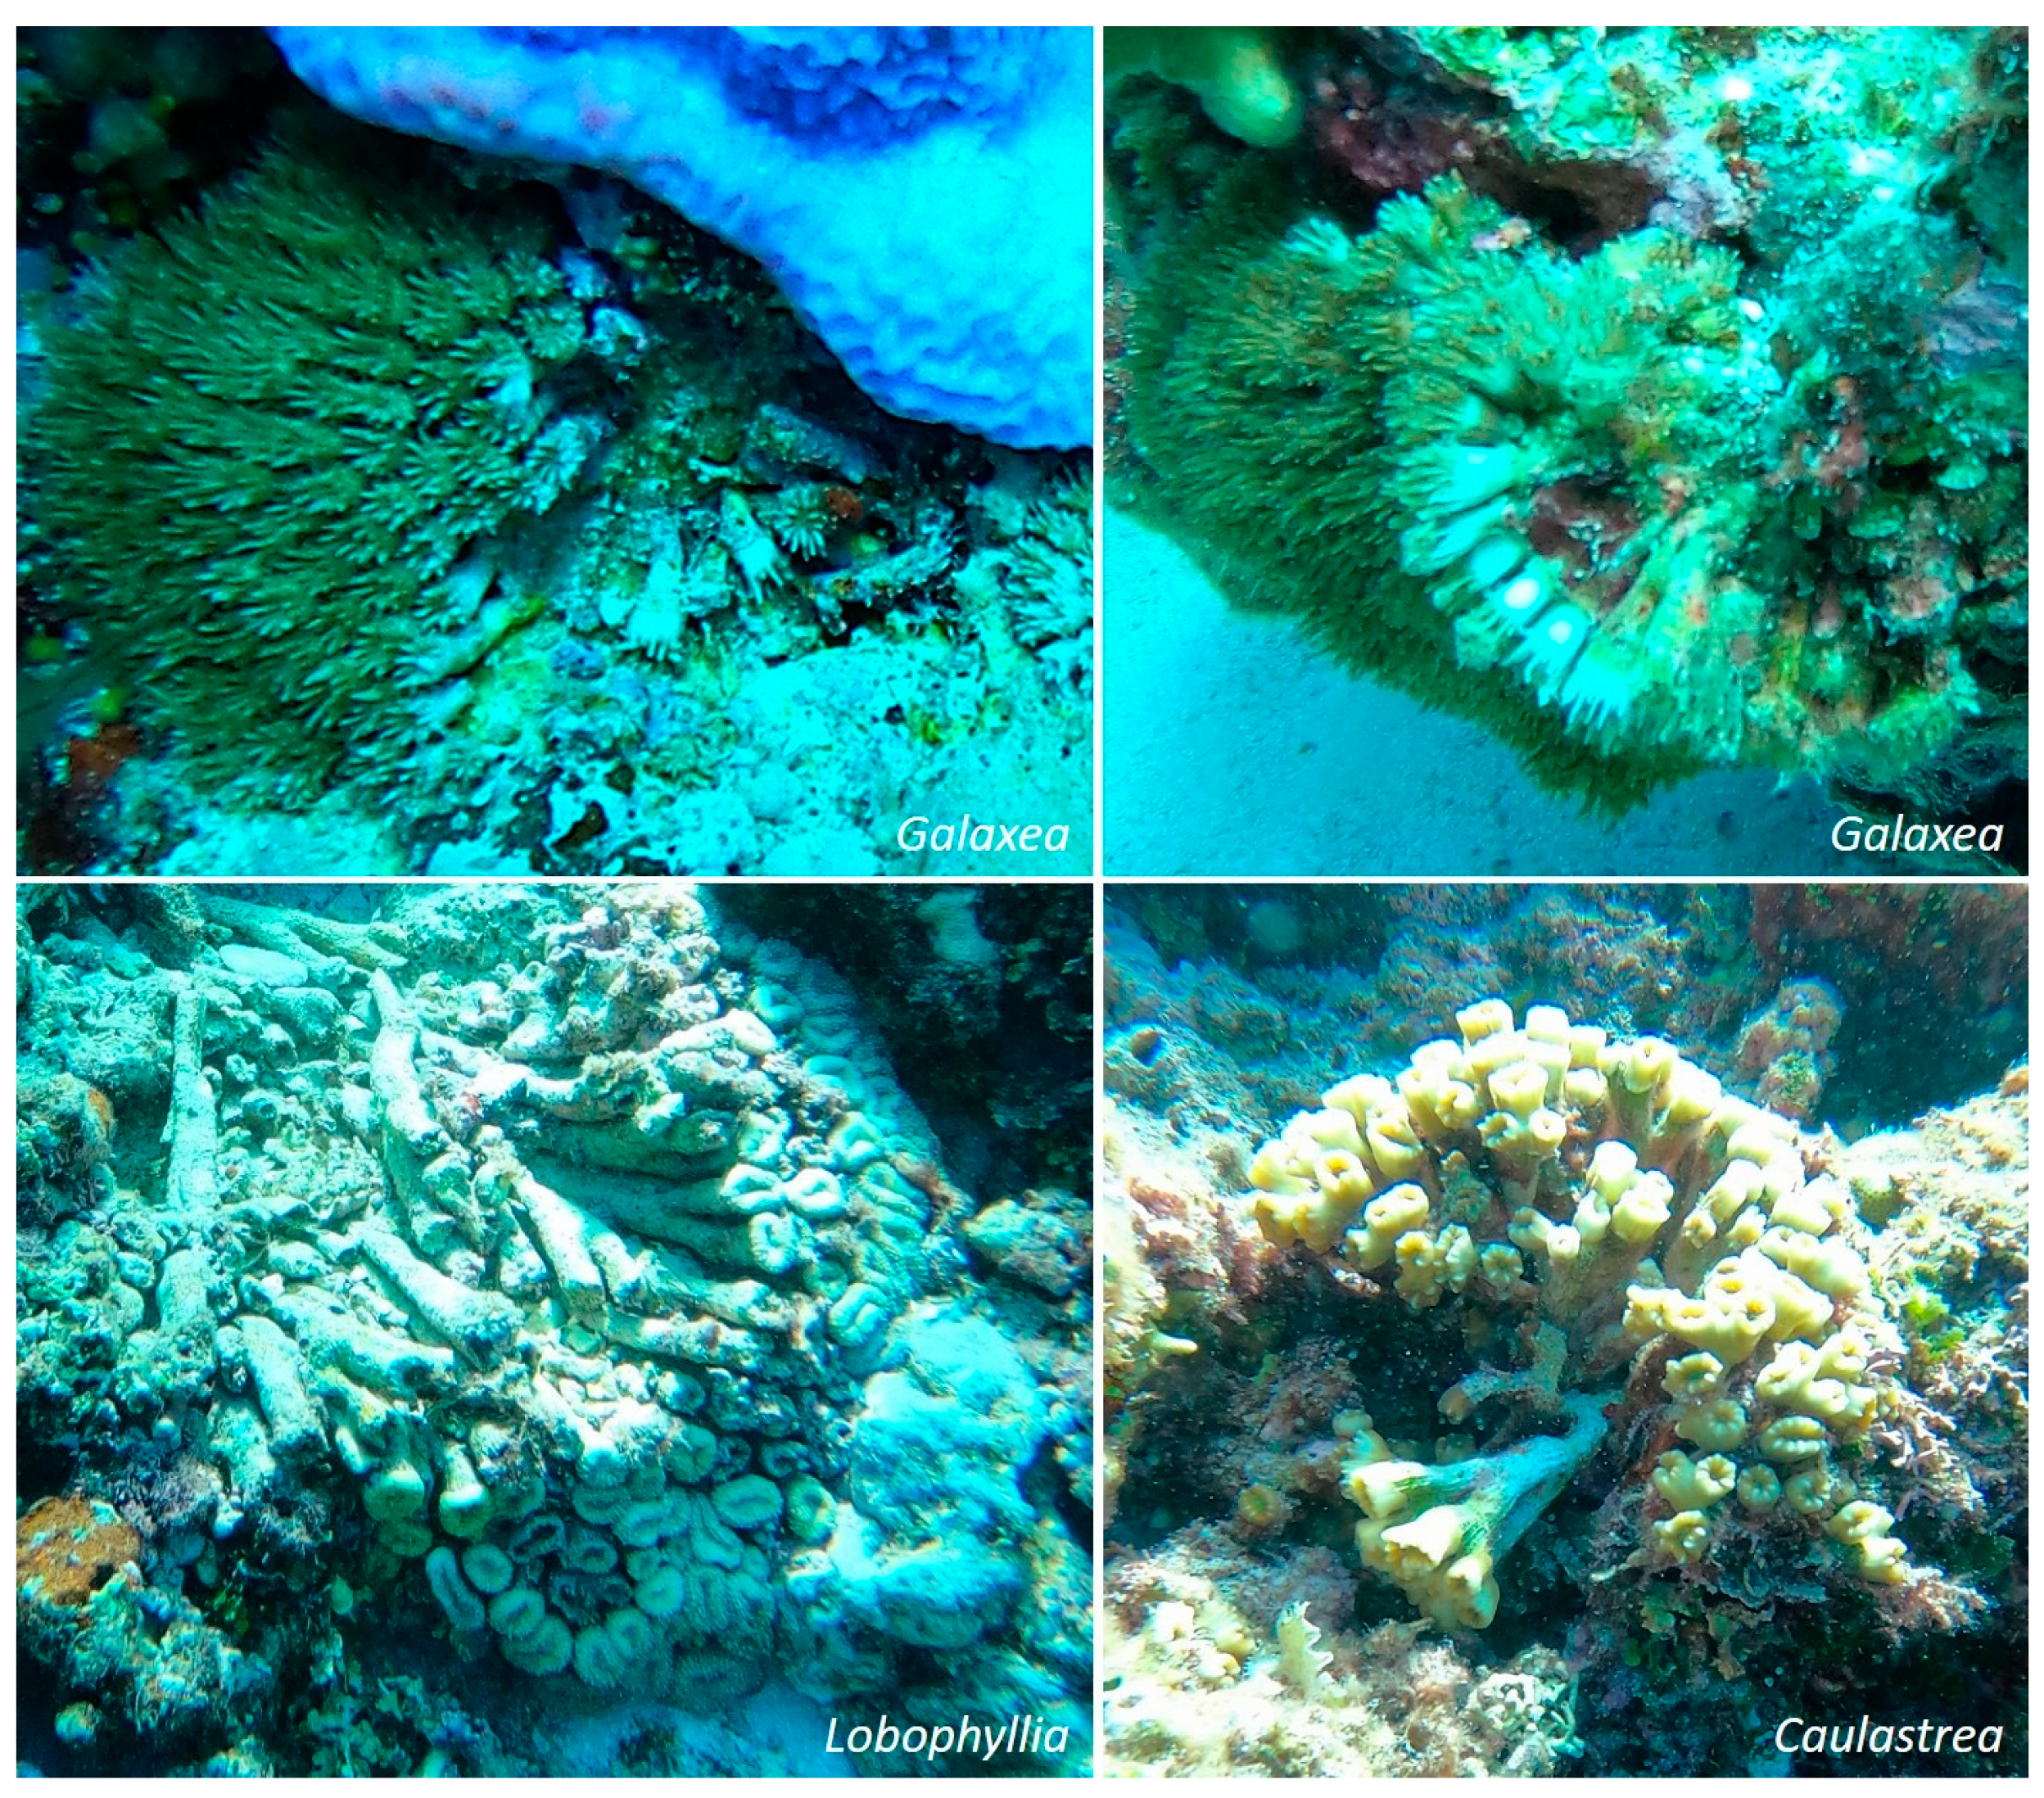
Many corals exhibited colony shrinkage rather than growth. Like other coral reefs in the South Pacific, every year our study site on the outer reef slope is subject to several occurrences of strong south-west storm swells breaking apart coral colonies and occasionally chunks of the reef substrate (Figure 6). While recurrent hydrodynamic stress clearly appears as a limiting factor for coral development on these outer reef slope sites, further investigation remains necessary to evaluate the degree to which intrinsic species’ life history traits, and extrinsic abiotic and biotic environmental conditions in concert, drive coral community dynamics. Prior studies have highlighted the taxonomic differences in coral vulnerability to physical dislodgement and fragmentation [12,19], with some taxa using fragmentation as a strategy for asexual propagation. This is the case for Acropora, Galaxea, and Millepora, the three genera showing the highest recruitment rates on our study site, recurrently impacted by strong waves. Characterized by digitated growth forms (Figure 6), Acropora branches break relatively easily into loose fragments that show a high capacity to survive and reattach to the substrate [12]. Similarly, Galaxea colonies often split into detached individual polyps (Figure 7), and Millepora pieces into free branches and columns that are dispersed by waves [32]. Nevertheless, recent investigations in our study system indicate that the outer reef receives lower rates of larval settlement than nearby lagoon sites, and that several coral taxa exhibit lower competitive performances there as compared to other reef environments [25,31]. Expanding coral demographic surveys in time and space, and complementing statistical analyses with simulation-based modeling approaches, will help identify key processes controlling coral demographic success, and estimate critical stress thresholds for coral resilience [18,19,20,21]. By improving fieldwork time efficiency and thus the expansion of population and community dynamics studies, our image-based approach to characterizing species’ demographic performances will facilitate this endeavor.

4.2. Accelerating Demographic Investigation Using Imagery

Because data acquisition during field surveys is often restricted by time constraints, imagery-based approaches can greatly optimize data collection and archiving, particularly for extreme and remote environments where immersion is limited. Our digital approach helps address the growing need for managers for accessible ecological diagnostics, including studies that track species’ individual performances in key demographic processes such as survival, growth, reproduction, and migration, to characterize demographic bottlenecks and understand community resilience [5,18,20]. By operationalizing a transition of data acquisition tasks from in situ note taking to imagery-based annotations, our approach complements ongoing technological developments that rely on the digitalization of the natural world, such as photogrammetry [10,11], and the automatization of data acquisition and treatment, such as artificial intelligence [9,33]. We particularly advocate for their application in the preservation of declining key ecological communities threatened by near-future collapse, such as reef-building corals [34].

Supplementary Materials

The following supporting information can be downloaded at https://www.mdpi.com/article/10.3390/coasts3040022/s1. Figure S1: location of our study site at an outer reef slope in New Caledonia; Figure S2: size distributions of populations of the six dominant coral genera in 2021 and 2022; Material S1: python code for mapping and measuring corals in video transects; Table S1: population abundances (n per 4 m2) and relative genera contributions (%) in our surveys of coral communities in 2021 and 2022; Table S2: Kolmogorov–Smirnov test results comparing size distributions of the six dominant coral genera in 2021 and 2022.

Author Contributions

Conceptualization, M.K.; formal analysis, E.M.; funding acquisition, M.K. and J.B.; investigation, M.K. and E.M.; methodology, E.M.; project administration, M.K.; resources, M.K.; software, E.M.; supervision, M.K.; validation, M.K. and J.B.; visualization, M.K., E.M. and J.B.; writing—original draft, M.K. and E.M.; writing—review and editing, J.B. All authors have read and agreed to the published version of the manuscript.

Funding

This study is part of the Track Changes project [35], which was supported by the French Laboratory of Excellency CORAIL through a starting grant and a graduate student stipend, and the French Ministry of Foreign Affairs through the regional cooperation grant Fonds Pacifique.

Institutional Review Board Statement

Not applicable.

Informed Consent Statement

Not applicable.

Data Availability Statement

An example set of the video-transects and data presented in this study is available on request from the corresponding author. The entire dataset is not publicly available at this stage and will be published with further research. The code used to generate the data is available in Supplementary Material S1.

Acknowledgments

We thank Yassine Majoul for help with computer coding, and staff from the Institute of Research for Development for their assistance with boating and diving.

Conflicts of Interest

The authors declare no conflict of interest.

References

  1. Halpern, B.S.; Frazier, M.; Afflerbach, J.; Lowndes, J.S.; Micheli, F.; O’Hara, C.; Scarborough, C.; Selkoe, K.A. Recent pace of change in human impact on the world’s ocean. Sci. Rep. 2019, 9, 11609. [Google Scholar] [CrossRef]
  2. Weiskopf, S.R.; Rubenstein, M.A.; Crozier, L.G.; Gaichas, S.; Griffis, R.; Halofsky, J.E.; Hyde, K.J.W.; Morelli, T.L.; Morisette, J.T.; Muñoz, R.C.; et al. Climate change effects on biodiversity, ecosystems, ecosystem services, and natural resource management in the United States. Sci. Total Environ. 2020, 733, 137782. [Google Scholar] [CrossRef]
  3. Condie, S.A.; Anthony, K.R.; Babcock, R.C.; Baird, M.E.; Beeden, R.; Fletcher, C.S.; Gorton, R.; Harrison, D.; Hobday, A.J.; Plagányi, E.E.; et al. Large-scale interventions may delay decline of the Great Barrier Reef. R. Soc. Open Sci. 2021, 8, 201296. [Google Scholar] [CrossRef]
  4. Andrello, M.; Darling, E.S.; Wenger, A.; Suárez-Castro, A.F.; Gelfand, S.; Ahmadia, G.N. A global map of human pressures on tropical coral reefs. Conserv. Lett. 2022, 15, e12858. [Google Scholar] [CrossRef]
  5. Ellner, S.P.; Childs, D.Z.; Rees, M. Data-Driven Modelling of Structured Populations: A Practical Guide to the Integral Projection Model; Springer International Publishing: New York, NY, USA, 2016. [Google Scholar] [CrossRef]
  6. Kohler, K.E.; Gill, S.M. Coral Point Count with Excel extensions (CPCe): A Visual Basic program for the determination of coral and substrate coverage using random point count methodology. Comput. Geosci. 2006, 32, 1259–1269. [Google Scholar] [CrossRef]
  7. Dumas, P.; Bertaud, A.; Peignon, C.; Leopold, M.; Pelletier, D.A. “Quick and clean” photographic method for the description of coral reef habitats. J. Exp. Mar. Biol. Ecol. 2009, 368, 161–168. [Google Scholar] [CrossRef]
  8. Heudier, M.; Mouillot, D.; Mannocci, L. Assessing the effects of coral reef habitat and marine protected areas on threatened megafauna using aerial surveys. Aquat. Conserv. Mar. Freshw. 2023, 33, 286–297. [Google Scholar] [CrossRef]
  9. González-Rivero, M.; Beijbom, O.; Rodriguez-Ramirez, A.; Bryant, D.E.P.; Ganase, A.; Gonzalez-Marrero, Y.; Kennedy, E.V.; Kim, C.J.S.; Lopez-Marcano, S.; Markey, K.; et al. Monitoring of coral reefs using artificial intelligence: A feasible and cost-effective approach. Remote Sens. 2020, 12, 489. [Google Scholar] [CrossRef]
  10. Urbina-Barreto, I.; Chiroleu, F.; Pinel, R.; Fréchon, L.; Mahamadaly, V.; Elise, S.; Kulbicki, M.; Quod, J.-P.; Dutrieux, E.; Garnier, R.; et al. Quantifying the shelter capacity of coral reefs using photogrammetric 3D modeling: From colonies to reefscapes. Ecol. Indic. 2021, 121, 107151. [Google Scholar] [CrossRef]
  11. Donovan, M.K.; Alves, C.; Burns, J.; Drury, C.; Meier, O.W.; Ritson-Williams, R.; Cunning, R.; Dunn, R.P.; Goodbody-Gringley, G.; Henderson, L.M.; et al. From polyps to pixels: Understanding coral reef resilience to local and global change across scales. Landsc. Ecol. 2023, 38, 737–752. [Google Scholar] [CrossRef]
  12. Kayal, M.; Vercelloni, J.; Wand, M.P.; Adjeroud, M. Searching for the best bet in life-strategy: A quantitative approach to individual performance and population dynamics in reef-building corals. Ecol. Complex. 2015, 23, 73–84. [Google Scholar] [CrossRef]
  13. Darling, E.S.; McClanahan, T.R.; Maina, J.; Gurney, G.G.; Graham, N.A.J.; Januchowski-Hartley, F.; Cinner, J.E.; Mora, C.; Hicks, C.C.; Maire, E.; et al. Social-environmental drivers inform strategic management of coral reefs in the Anthropocene. Nat. Ecol. Evol. 2019, 3, 1341–1350. [Google Scholar] [CrossRef]
  14. Hughes, T.P.; Kerry, J.T.; Baird, A.H.; Connolly, S.R.; Chase, T.J.; Dietzel, A.; Hill, T.; Hoey, A.S.; Hoogenboom, M.O.; Jacobson, M.; et al. Global warming impairs stock–recruitment dynamics of corals. Nature 2019, 568, 387–390. [Google Scholar] [CrossRef]
  15. Hoegh-Guldberg, O.; Pendleton, L.; Kaup, A. People and the changing nature of coral reefs. Reg. Stud. Mar. Sci. 2019, 30, 100699. [Google Scholar] [CrossRef]
  16. Eddy, T.D.; Lam, V.W.; Reygondeau, G.; Cisneros-Montemayor, A.M.; Greer, K.; Palomares, M.L.D.; Bruno, J.F.; Ota, Y.; Cheung, W.W.L. Global decline in capacity of coral reefs to provide ecosystem services. One Earth 2021, 4, 1278–1285. [Google Scholar] [CrossRef]
  17. Carlot, J.; Vousdoukas, M.; Rovere, A.; Karambas, T.; Lenihan, H.S.; Kayal, M.; Adjeroud, M.; Pérez-Rosales, G.; Hedouin, L.; Parravicini, V. Coral reef structural complexity loss exposes coastlines to waves. Sci. Rep. 2023, 13, 1683. [Google Scholar] [CrossRef] [PubMed]
  18. Kayal, M.; Lenihan, H.S.; Brooks, A.J.; Holbrook, S.J.; Schmitt, R.J.; Kendall, B.E. Predicting coral community recovery using multi-species population dynamics models. Ecol. Lett. 2018, 21, 1790–1799. [Google Scholar] [CrossRef] [PubMed]
  19. Madin, J.S.; Baird, A.H.; Dornelas, M.; Connolly, S.R. Mechanical vulnerability explains size-dependent mortality of reef corals. Ecol. Lett. 2014, 17, 1008–1015. [Google Scholar] [CrossRef]
  20. Riegl, B.; Johnston, M.; Purkis, S.; Howells, E.; Burt, J.; Steiner, S.C.C.; Sheppard, C.R.C.; Bauman, A. Population collapse dynamics in Acropora downingi, an Arabian/Persian Gulf ecosystem-engineering coral, linked to rising temperature. Glob. Chang. Biol. 2018, 24, 2447–2462. [Google Scholar] [CrossRef] [PubMed]
  21. Carlot, J.; Kayal, M.; Lenihan, H.S.; Brandl, S.J.; Casey, J.M.; Adjeroud, M.; Cardini, U.; Mercière, A.; Espiau, B.; Barneche, D.R.; et al. Juvenile corals underpin coral reef carbonate production after disturbance. Glob. Chang. Biol. 2021, 27, 2623–2632. [Google Scholar] [CrossRef]
  22. Fenner, D.; Muir, P. Reef Corals of the Northwestern Lagoon of Grande-Terre, New Caledonia. In A Rapid Marine Biodiversity Assessment of the Coral Reefs of the Northwest Lagoon, between Koumac and Yandé, Province Nord, New Caledonia; Conservation International: Arlington, TX, USA, 2008. [Google Scholar] [CrossRef]
  23. Andréfouët, S.; Cabioch, G.; Flamand, B.; Pelletier, B. A reappraisal of the diversity of geomorphological and genetic processes of New Caledonian coral reefs: A synthesis from optical remote sensing, coring and acoustic multibeam observations. Coral Reefs 2009, 28, 691–707. [Google Scholar] [CrossRef]
  24. Adjeroud, M.; Poisson, E.; Peignon, C.; Penin, L.; Kayal, M. Spatial patterns and short-term changes of coral assemblages along a cross-shelf gradient in the southwestern lagoon of New Caledonia. Diversity 2019, 11, 21. [Google Scholar] [CrossRef]
  25. Kayal, M.; Adjeroud, M. The war of corals: Patterns, drivers, and implications of changing coral competitive performances across reef environments. R. Soc. Open Sci. 2022, 9, 220003. [Google Scholar] [CrossRef]
  26. Pinheiro, J.; Bates, D.; R Core Team. nlme: Linear and Nonlinear Mixed Effects Models, R Package Version 3.1-162. 2023. Available online: https://CRAN.R-project.org/package=nlme (accessed on 14 February 2023).
  27. Adjeroud, M.; Kayal, M.; Iborra-Cantonnet, C.; Vercelloni, J.; Bosserelle, P.; Liao, V.; Chancerelle, Y.; Claudet, J.; Penin, L. Recovery of coral assemblages despite acute and recurrent disturbances on a South Central Pacific reef. Sci. Rep. 2018, 8, 9680. [Google Scholar] [CrossRef] [PubMed]
  28. Dietzel, A.; Bode, M.; Connolly, S.R.; Hughes, T.P. The population sizes and global extinction risk of reef-building coral species at biogeographic scales. Nat. Ecol. Evol. 2021, 5, 663–669. [Google Scholar] [CrossRef] [PubMed]
  29. Tokeshi, M. Species Coexistence: Ecological and Evolutionary Perspectives; John Wiley & Sons: Hoboken, NJ, USA, 2009. [Google Scholar]
  30. Holt, R.D. Species Coexistence. In Reference Module in Life Sciences; Elsevier: Amsterdam, Netherlands, 2017. [Google Scholar] [CrossRef]
  31. Adjeroud, M.; Peignon, C.; Gauliard, C.; Penin, L.; Kayal, M. Extremely high but localized pulses of coral recruitment in the southwestern lagoon of New Caledonia and implications for conservation. Mar. Ecol. Prog. Ser. 2022, 692, 67–79. [Google Scholar] [CrossRef]
  32. Dubé, C.E.; Ziegler, M.; Mercière, A.; Boissin, E.; Planes, S.; Bourmaud, C.F.; Voolstra, C.R. Naturally occurring fire coral clones demonstrate a genetic and environmental basis of microbiome composition. Nat. Commun. 2021, 12, 6402. [Google Scholar] [CrossRef]
  33. Jamil, S.; Rahman, M.; Haider, A. Bag of features (BoF) based deep learning framework for bleached corals detection. Big Data Cogn. Comput. 2021, 5, 53. [Google Scholar] [CrossRef]
  34. Dietzel, A.; Bode, M.; Connolly, S.R.; Hughes, T.P. Long-term shifts in the colony size structure of coral populations along the Great Barrier Reef. Proc. R. Soc. B Biol. Sci. 2020, 287, 20201432. [Google Scholar] [CrossRef] [PubMed]
  35. Track Changes: Coastal Marine Ecosystem Transformation in the Face of Environmental Changes. Available online: https://umr-entropie.ird.nc/index.php/home-en/home/research/portfolio/ongoing-projects/projet-track-changes (accessed on 14 February 2023).
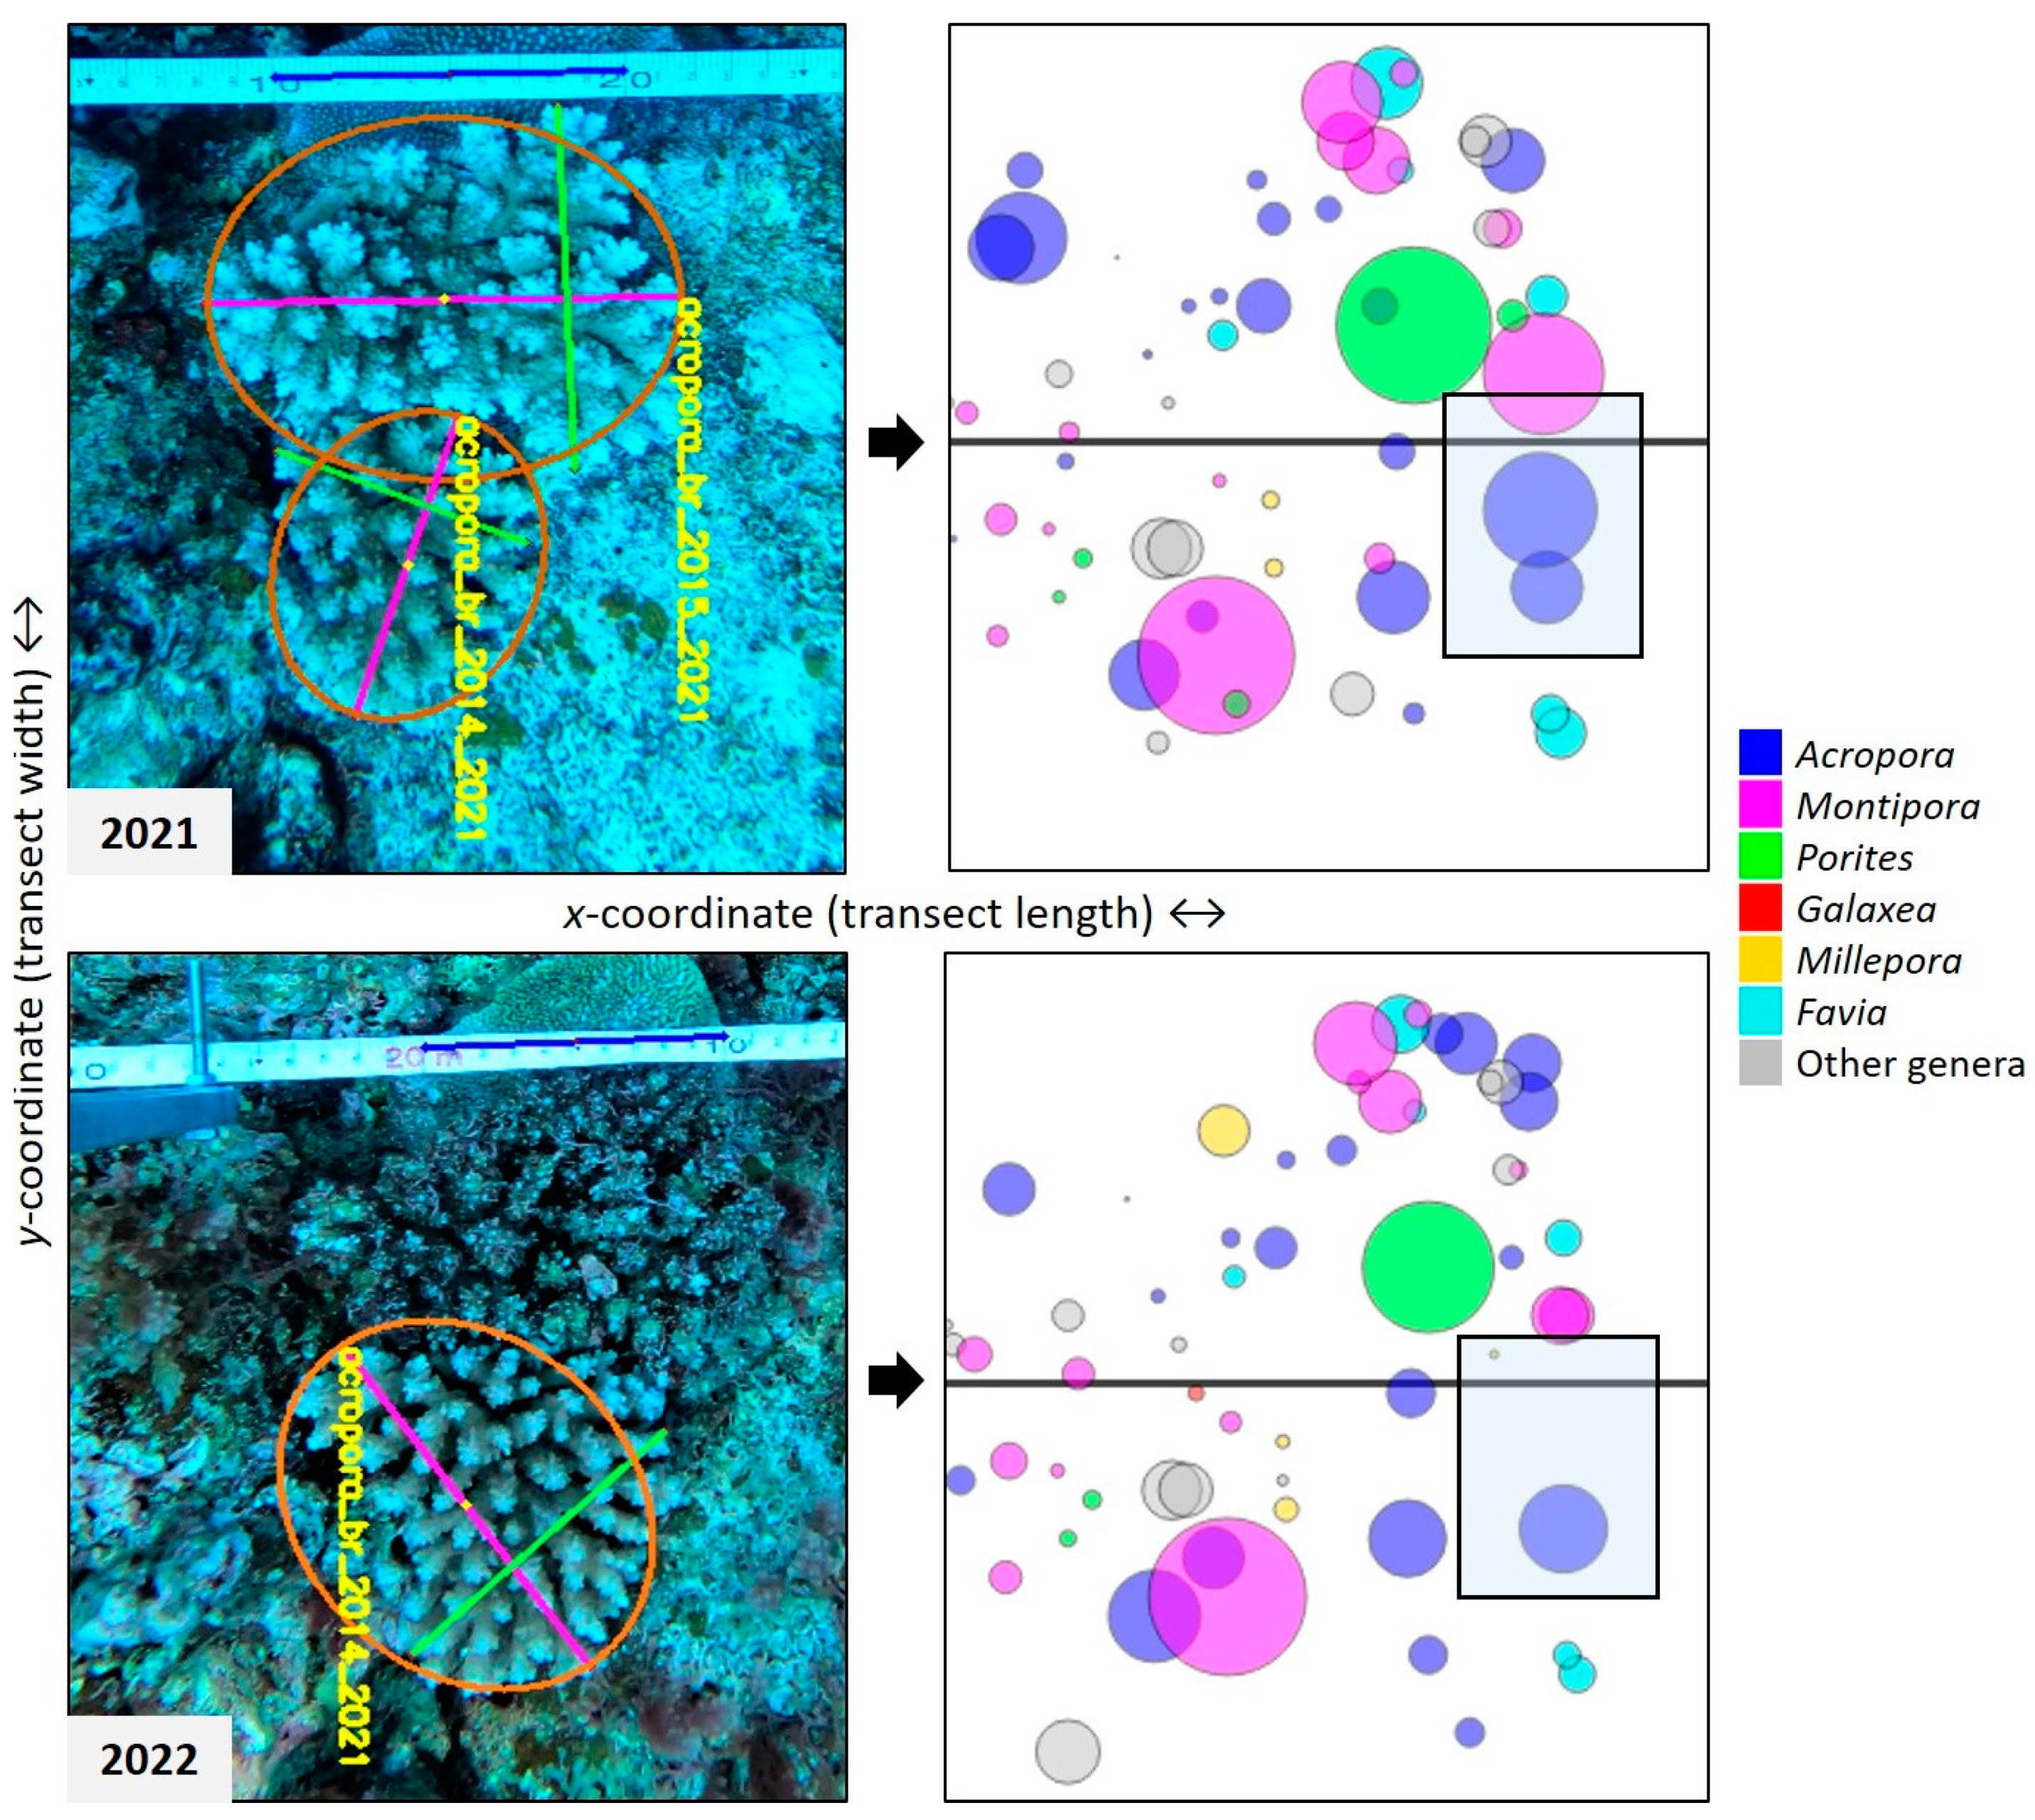
Figure 1. A portion of the video transects recorded in 2021 and 2022, illustrating our coral mapping and size measurement approach (pictures) and the resulting visualization (plots). Each coral is identified by genus and morphotype and given a unique identification code (yellow text) made of genus, morphotype, x-coordinate, and year of first observation. Colony size is estimated by measuring length (pink line) and width (green line) in pixels and converting to centimeters using a 10 cm reference distance along the transect tape (blue line). The mean coral diameter = (length + width)/2 and is then referred to as coral size. The position of the centroid of each colony (yellow dot) is mapped along the length (x-coordinate) and width (y-coordinate) of the transect. Plots are visualizations of coral distribution (circle location), size (circle size), and composition (color code) along the transect. This example shows the dynamics of two branching Acropora colonies between 2021 and 2022, one growing and the other one dying.
Coasts 03 00022 g001
Figure 2. Coral spatial distribution, size, and taxonomic composition along the studied 30 m stretch of the reef substrate in 2021 and 2022. Each circle represents a coral with dimensions that are proportional to mean colony size. Color code distinguishes the six dominant genera.
Coasts 03 00022 g002
Figure 3. Coral population abundances (mean ± standard deviation) per 4 m2 transect by genus in 2021 and 2022. Color code distinguishes the six dominant genera. See Table S1 for details.
Coasts 03 00022 g003
Figure 4. Size distributions of populations of the six dominant coral genera in 2021 and 2022. See Figure S2 for inter-annual differences in size distributions.
Coasts 03 00022 g004
Figure 5. Individual coral performances in survival (A), growth (B), and recruitment (C) for the six dominant genera, and combined (D). Survival and growth rates are expressed as a function of colony sizes (mean coral diameter), with points representing individual observations, and curves representing estimated patterns from generalized linear mixed-effect models. Gray line in survival plot (A) indicates the 50% survival threshold. Note that data points in (A) were jittered around 1 (i.e., survival) and 0 (i.e., mortality) to ease visual distinction of individual observation points. Grey line in growth plot (B) indicates the identity threshold (Size2022 = Size2021), values above the line indicate positive growth, and below, coral shrinkage. Recruit abundances are expressed as mean ± standard deviation. The three-dimensional plot (D) combines mean coral genera survival, growth, and recruitment performances information per transect into a three-dimensional space for a visualization of differences in coral life history. To ease readability, vertical lines are projections of recruitment data points onto the survival-growth two-dimensional plan. Survival and recruitment rates in (D) are in the same units as in (A,C), whereas mean coral relative growth (i.e., ratio Size2022/Size2021) is calculated from data points illustrated in (B).
Coasts 03 00022 g005
Figure 6. Photographs showing two portions of the reef impacted by strong waves. Yellow arrows indicate branching Acropora colonies shrinking in size due to fragmentation (i.e., broken branch tips following high hydrodynamic stress). White arrows indicate the position of a massive Favia colony that was blasted away along with a chunk of the reef substrate.
Coasts 03 00022 g006
Figure 7. Photographs showing asexual propagation of loose polyps of massive Galaxea and other coral genera.
Coasts 03 00022 g007
Disclaimer/Publisher’s Note: The statements, opinions and data contained in all publications are solely those of the individual author(s) and contributor(s) and not of MDPI and/or the editor(s). MDPI and/or the editor(s) disclaim responsibility for any injury to people or property resulting from any ideas, methods, instructions or products referred to in the content.