Article

Resolution of Creatinine Interference in Dexamethasone Sodium Phosphate Injectable Preparations: A Validated First-Order Derivative Spectrophotometric Method Using Matrix Matching and Zero-Crossing Point Interpolation


by
Daniela-Mădălina Anghel
1,*,
Anne-Marie Ciobanu
1,
Daniela-Luiza Baconi
2,
Mircea Bogdan Măciuceanu Zărnescu
3 and
George Traian Alexandru Burcea-Dragomiroiu
1
1
Department of Drug Analysis, Carol Davila University of Medicine and Pharmacy, 37 Dionisie Lupu Street, Sector 2, 20021 Bucharest, Romania
2
Department of Toxicology, Carol Davila University of Medicine and Pharmacy, 37 Dionisie Lupu Street, Sector 2, 20021 Bucharest, Romania
3
Department of Plastic, Aesthetic and Reconstructive Microsurgery, Carol Davila University of Medicine and Pharmacy, 37 Dionisie Lupu Street, Sector 2, 20021 Bucharest, Romania
*
Author to whom correspondence should be addressed.
AppliedChem 2026, 6(2), 23; https://doi.org/10.3390/appliedchem6020023
Submission received: 29 January 2026 / Revised: 9 March 2026 / Accepted: 24 March 2026 / Published: 2 April 2026

Abstract

Background: The quantification of Dexamethasone Sodium Phosphate (DSP) in injectable formulations is significantly hindered by the spectral overlap of the stabilizer creatinine within the UV region. This study aims to develop a green first-order derivative (D1) spectrophotometric method to resolve this analytical challenge. Methods: Distilled water was utilized as a sustainable solvent, aligning with green chemistry principles. To ensure high specificity, a matrix-matching calibration strategy with a constant 1:2 (w/w) DSP:creatinine mass ratio across the entire concentration range was employed. DSP was determined using the zero-crossing technique, measuring the D1 amplitude at λZC ≅ 231.3 nm, where the creatinine contribution is nullified. Results: Linearity was established for DSP concentrations between 4.0–16.0 μg/mL (R2 > 0.99). Method validation, as per ICH Q2 (R1) guidelines (International Council for Harmonisation of Technical Requirements for Pharmaceuticals for Human Use), demonstrated excellent accuracy (mean recovery of 99.85%) and precision (RSD < 2%). Conclusions: The proposed method offers a rapid, cost-effective, and eco-friendly alternative for the routine quality control of DSP injectables, eliminating the necessity for complex chromatographic separation techniques.

1. Introduction

Dexamethasone Sodium Phosphate (DSP) is a potent synthetic water-soluble glucocorticoid used for its anti-inflammatory and immunosuppressive properties [1]. Due to its rapid onset of action, it is widely administered via injection for the treatment of severe allergic reactions, cerebral edema, and endocrine disorders [2]. Furthermore, it serves as a primary agent in antiemetic regimens to prevent chemotherapy-induced nausea and vomiting [1].
In many commercial injectable formulations, creatinine (CRE) is added as an essential excipient to enhance the stability of the steroid in aqueous solution [3,4]. However, the presence of creatinine in high concentrations carries both clinical and analytical implications.
From a clinical perspective, recent case reports have highlighted the occurrence of “spurious” or falsely elevated serum creatinine levels in patients receiving intravenous DSP [3,4]. This phenomenon occurs when blood samples are drawn too close to the injection site or shortly after administration, leading to potential diagnostic errors regarding the patient’s renal function. Consequently, the precise monitoring of the DSP-to-CRE ratio in pharmaceutical products is vital for both quality control and therapeutic safety.
Analytically, the determination of DSP in these formulations by classical zero-order (D0) spectrophotometry is hindered by the intense spectral interference of creatinine. Both substances exhibit strong absorption in the same ultraviolet region (230–260 nm), resulting in a total overlap that precludes direct quantification [5]. This overlap necessitates either a time-consuming extraction step or the use of advanced chromatographic techniques like High-Performance Liquid Chromatography (HPLC). While advanced techniques such as HLPC are effective, they are often expensive, time-consuming, and involve the use of hazardous organic solvents. A significant step forward was the use of multivariate calibration models, such as Partial Least Squares (PLS-1), to resolve this mixture [5]. However, while accurate, PLS models require specialized statistical software and complex mathematical processing, creating a need for more accessible, yet equally robust, analytical alternatives [5].
Derivative spectrophotometry offers a powerful, rapid, and cost-effective tool for the resolution of such mixtures without the need for prior separation [6]. This technique enhances the detectability of minor spectral properties, removes the influence of the sample matrix, and provides adequate resolution for complex systems. The versatility of this approach is evidenced by its successful application in the analysis of various active substances such as spironolactone [7], sildenafil [8,9], bisoprolol fumarate and telmisartan [10], chloramphenicol and prednisolone [11], or bisphosphonates [12].
Spironolactone. A recent research successfully implemented zero-order and first-derivative spectrophotometric approaches for the quantification of spironolactone, a potassium-sparing diuretic, in pharmaceutical tablets [7]. While zero-order spectra were evaluated at λ = 239 nm, first-derivative values were measured at λ = 250.4 nm. The derivative transformation utilized a wavelength interval of Δλ = 2 nm and a scaling factor of 30. This technique efficiently eliminated matrix effects and interferences caused by sample turbidity or excipients found in commercial formulations, such as ALDACTONE®-A 25 mg, while effectively suppressing instrumental noise peaks. The method demonstrated excellent linearity and yielded highly precise results, with mean recoveries ranging from 99.40% to 99.77%. It proved to be a faster and more economical alternative to tedious chromatographic or capillary electrophoresis procedures [7].
Sildenafil. In the forensic investigation of counterfeit pharmaceuticals, sildenafil, a phosphodiesterase-5 inhibitor used for erectile dysfunction [9], is frequently found to be adulterated with substances such as paracetamol, metronidazole, or glyburide [8]. These adulterants are often introduced to alter the drug’s profile, but they pose significant safety risks, including potential hepatotoxicity from paracetamol or life-threatening hypoglycemia in the case of glyburide. Analytically, quantifying sildenafil in these preparations is challenging because the zero-order UV spectra of the drug and its common adulterants overlap considerably. To resolve these mixtures without the need for expensive, time-consuming chromatographic techniques like HPLC, Mabrouk et al. developed and validated specialized spectrophotometric methods [8]. For mixtures containing paracetamol or metronidazole, first-derivative spectrophotometry was employed. This technique identifies “zero-crossing” points, specific wavelengths where the derivative signal of the interferent is zero, allowing for the selective measurement of the target analyte. Sildenafil was successfully quantified at λ = 311.8 nm when mixed with paracetamol and at λ = 319.5 nm in the presence of metronidazole. Conversely, the adulterants themselves were measured at their respective sildenafil zero-crossing points (265.8 nm for paracetamol and 291.8 nm for metronidazole). In cases involving glyburide, where simple derivative methods were insufficient, a first-derivative of ratio spectra (1DD) approach was used at 316.3 nm, utilizing sildenafil as a divisor to achieve resolution [9]. These methods were validated according to ICH guidelines (International Council for Harmonisation of Technical Requirements for Pharmaceuticals for Human Use), demonstrating high accuracy and precision. By eliminating the need for chemical extraction, this approach offers a rapid, cost-effective, and eco-friendly alternative for the routine quality control and surveillance of counterfeit sildenafil products [9].
Bisoprolol Fumarate and Telmisartan. These antihypertensive agents exhibit significant spectral overlap, making their simultaneous determination via classical methods extremely challenging. By applying the first derivative of the ratio spectra, researchers succeeded in the simultaneous determination without interference. In this method, the zero-order spectrum of each drug is divided by an optimal “divisor” spectrum of the other, 16 μg/mL of telmisartan for bisoprolol, and 10 μg/mL of bisoprolol for telmisartan. The derivative signals were selectively isolated at 232 nm for bisoprolol and 243 nm for telmisartan. This quantification employed a wavelength interval of Δλ = 4 nm and a scaling factor of 10. The method was validated according to ICH criteria and received a high Analytical Greenness (AGREE) score of 0.84. This result is attributed to the use of water as a solvent, replacing more harmful organic alternatives [10].
Chloramphenicol and Prednisolone. This combination is common in ophthalmic preparations where spectra overlap partially. Similar derivative approaches have been employed to resolve these mixtures, where the technique effectively suppresses broad absorption bands of secondary active ingredients to isolate the target analyte [11].
Bisphosphonates (e.g., Alendronate, Clodronate). As these compounds lack a strong natural UV chromophore, they are analyzed via complexation with Cu(II) ions. By forming complexes with Cu(II) ions and applying derivative spectrophotometry, background interference from tablet excipients was successfully eliminated [12].
Building upon these principles and taking into account that by transforming the zero-order spectrum into its first derivative (D1), the specific signals of DSP can be isolated at “zero-crossing” points of the interferent, this work aims to establish a simplified, eco-friendly, and validated first-order derivative spectrophotometric method for the routine quality control of DSP injectables. By using water as a solvent and employing matrix matching combined with zero-crossing point interpolation, the proposed method effectively overcomes the spectral interference of creatinine. This approach provides a more accessible and practical alternative to the PLS models described by Collado et al. (2001) [5], ensuring high analytical performance and adherence to Green Analytical Chemistry principles while remaining suitable for laboratories with standard instrumentation.

2. Materials and Methods

2.1. Apparatus and Software

UV-Shimadzu 1900 double beam spectrophotometer with UV probe software version 2.70 and Quartz cells (1 cm) were used for all measurements.

2.2. Materials and Reagents

The following materials and reagents were used as received:
  • Dexamethasone Sodium Phosphate: reference standard, purity 99.9%, procured from RomPharm Company, Otopeni, Romania;
  • Creatinine: United States Pharmacopeia (USP) Reference Standard, purchased from Aldrich (Steinheim, Germany);
  • Distilled water: solvent;
  • Na2HPO4∙2H2O (≥99.0%) and NaH2PO4∙2H2O (≥99.0%), purchased from Aldrich (Steinheim, Germany);
  • HCl: 37%, ACS reagent, Merck, Germany;
  • NaOH: reagent grade, ≥98%, pellets (anhydrous), purchased from Aldrich (Steinheim, Germany);
  • Samples: Dexamethasone 4 mg/mL solution for injection, Rompharm Company, Otopeni, Romania (batch: 2504981, serial number: 9K3T0D7VBMK5F9, expiration date: April 2028).

2.3. Solvent Selection and Spectral Investigation

Previous research suggests that the absorbance of DSP is maximized at a pH of 6.0, exhibiting an absorption peak at λ = 242.5 nm [13]. To verify the influence of the solvent on the spectral profile under our experimental conditions, a pH 6.0 phosphate buffer was prepared for comparative analysis. The phosphate buffer was prepared by dissolving 0.0116 mol of disodium hydrogen phosphate dihydrate (Na2HPO4∙2H2O) and 0.0588 mol of sodium dihydrogen phosphate dihydrate (NaH2PO4∙2H2O) in 100 mL of distilled water and diluting to 500.0 mL with the solvent. The final pH was precisely adjusted using 0.1 M HCl and 0.1 M NaOH solutions, respectively, in accordance with the protocols outlined in the Reagents section of the Romanian Pharmacopoeia, 10th Edition [14].
To evaluate the potential influence of the solvent on the spectral profile of DSP, working solutions with a concentration of 40 μg DSP/mL were prepared as follows:
  • Dilute 10.0 mL of standard stock solution A (Section 2.4.1) to 100.0 mL with distilled water;
  • Dilute 10.0 mL of standard stock solution A (Section 2.4.1) to 100.0 mL with phosphate buffer (pH 6.0).
The resulting solutions were utilized for comparative spectral analysis to ensure the stability of the absorption maximum across different media.
The UV spectra of the standard solutions were recorded across the range of 200–400 nm using a Shimadzu UV-1900 spectrophotometer, purchased from Shimadzu Handels GmbH. Korneuburg, Bucharest, Romania. Distilled water and the pH 6.0 phosphate buffer were utilized as solvents to investigate potential solvent-induced spectral shifts.

2.4. Standard Solutions and Samples

High concentrations of the stock solutions were chosen to allow for the handling of precise pipettable volumes. This minimizes relative measurement errors and ensures the complete solubility and stability of the reference standards in the aqueous medium. Successive dilutions were implemented to ensure that the primary absorbance values remained within the optimal linear range of the spectrophotometer (typically between 0.2 and 1.0 AU). In this way, we avoided excessive amplitudes that could lead to detector saturation or stray light interference. In derivative spectrophotometry, high zero-order signals can amplify instrumental noise, which would otherwise compromise the precision and reproducibility of the zero-crossing point interpolation [15].

2.4.1. Stock A—Dexamethasone Sodium Phosphate Standard Solutions (400 μg/mL)

Standard stock solution A. Dissolve 100.0 mg of DSP reference standard in 100 mL of distilled water and dilute to 250.0 mL with the solvent.

2.4.2. Stock B—Creatinine Standard Solution (800 μg/mL)

Standard stock solution B. Dissolve 200.0 mg of creatinine reference standard in 100 mL of distilled water and dilute to 250.0 mL with the solvent.

2.4.3. Stock Mix S1—DSP 20 μg/mL + CRE 40 μg/mL

Due to the lack of access to the quantitative composition of the analyzed drug product, we simulated the potential effect of creatinine on spectrophotometric determination by preparing a mixed standard solution containing DSP and creatinine (CRE) standards in a 1:2 ratio. Given that the exact quantitative composition of commercial products may vary, the 1:2 ratio of DSP to creatinine was utilized to simulate a “worst-case” spectral interference scenario.
Standard stock mix S1. Dilute 2.5 mL of standard stock solution A and 2.5 mL of standard stock solution B to 50.0 mL with distilled water.
For validation purposes, three concentration levels (80%—L4, 100%—L5, and 120%—L6) relative to the target concentration of 10 μg DSP/mL were prepared, each in triplicate (Table 3).

2.4.4. Stock Sample P1—DSP 20 μg/mL + CRE 40 μg/mL

Dexamethasone 4 mg/mL solution for injection (Rompharm Company) for analysis was purchased from the Romanian pharmaceutical market.
Standard sample stock (P1). Dilute 1.25 mL of the analyzed ampoules (Dexamethasone 4 mg/mL solution for injection, Rompharm Company) to 250.0 mL with distilled water. To ensure high pipetting accuracy and minimize volumetric errors, a calibrated precision micropipette (±0.005 mL accuracy) was used for the 1.25 mL aliquot. The final 10 μg DSP/mL sample for analysis was prepared in triplicate (Table 5) by diluting 5.0 mL of standard sample stock solution P1 to 10 mL with solvent. Each replicate was prepared through independent dilution steps to evaluate the total analytical procedure’s repeatability.

2.5. Construction of Calibration Curve

The standard stock mix solution (S1) was used to ensure that each calibration point maintains a 1:2 ratio of DSP to creatinine. Synthesized preparation protocol for the calibration curve (D1, 2–16 μg/mL) is included in Table 1. All points were prepared in 10 mL volumetric flasks using the standard stock mix solution S1. The calibration curve was constructed by plotting the derivative amplitude versus the corresponding concentrations.

2.6. First-Derivative (D1) Spectrophotometric Method

The zero-order spectra were recorded (D0) by setting the wavelength range from 300 to 200 nm, a medium scan speed, and a sampling interval of 0.1 nm. The spectra were then mathematically transformed into first-order derivative spectra (D1). The amplitude of the D1 signal for all analyzed solutions was measured at the λ (nm) where creatinine crosses the zero line.
Initial measurements revealed a spectral resolution dependency of the zero-crossing point. Consequently, the method was optimized by increasing the sampling resolution to 0.05 nm. The optimization of derivative parameters was performed to maximize the signal-to-noise ratio while maintaining spectral resolution.
A smoothing window (Δλ) of 4 nm was selected as it provided a stable and reproducible zero-crossing point for creatinine without inducing peak distortion. A scaling factor (SF) of 100 was applied to all derivative spectra to enhance the numerical readability of the D1 amplitudes and data processing, without affecting the analytical proportionality or the accuracy of the method, ensuring consistent quantification across all experimental series. The derivative parameters were established during the preliminary screening stage. We evaluated smoothing windows ranging from 2 to 8 nm. At 2 nm, the spectra exhibited significant instrumental noise, leading to poor reproducibility of the zero-crossing point for creatinine. Conversely, windows of 8 nm induced noticeable peak distortion and a decrease in sensitivity (blunting of the derivative signal). The 4 nm window provided the optimal balance, ensuring a high signal-to-noise ratio and a stable zero-crossing point while preserving the analytical integrity of the DSP peak. A 4 nm smoothing window was selected as the optimal setting based on the visual assessment of signal clarity and zero-crossing stability, although a detailed comparative analysis across all tested intervals was not formally documented.
The zero-crossing point was determined at 231.325 nm. To ensure internal consistency and minimize instrumental bias during the validation phase, all experimental series were conducted using the same spectrophotometer. Due to the instrument’s display resolution, amplitudes were calculated via linear interpolation between the 231.3 and 231.4 nm data points to ensure absolute elimination of creatinine interference.

2.7. Data Analysis

To ensure analytical accuracy, the derivative amplitude of all analyzed solutions was calculated via linear interpolation between the nearest measured coordinates [16]. This mathematical correction eliminates the quantization error associated with the fixed wavelength increments of the instrument. The first-derivative amplitude at the precise zero-crossing wavelength (λZC = 231.325 nm) was determined by linear interpolation between the two adjacent discrete data points, λ1 = 231.3 nm and λ2 = 231.4 nm, using the following equation:
D λ Z C 1 = D λ 1 1 + D λ 2 1 D λ 1 1 λ 2 λ 1 · ( λ z c   λ 1 )
where
  • D λ Z C 1 is the interpolated first-derivative amplitude at the zero-crossing point;
  • D λ 1 1 and D λ 2 1 are the derivative values recorded at the experimental wavelengths λ1 and λ2, respectively;
  • λZC: is the target zero-crossing wavelength (231.325 nm);
  • λ1λ2: represents the sampling interval (step size) of the spectrophotometer.

2.8. Generative Artificial Intelligence Assistance

Data processing and visualization were supported by generative AI tools. Specifically, Gemini AI was utilized to perform the numerical processing of amplitudes recorded at the two primary wavelengths and to calculate the resultant amplitude at the zero-crossing point (λZC) through linear interpolation. Furthermore, Gemini Nano Banana Pro was employed to generate diagnostic figures, using raw experimental data and literature as the foundational input for these visualizations (see Acknowledgments).

3. Results

3.1. Solvent Selection and Spectral Investigation

3.1.1. Solvent Selection

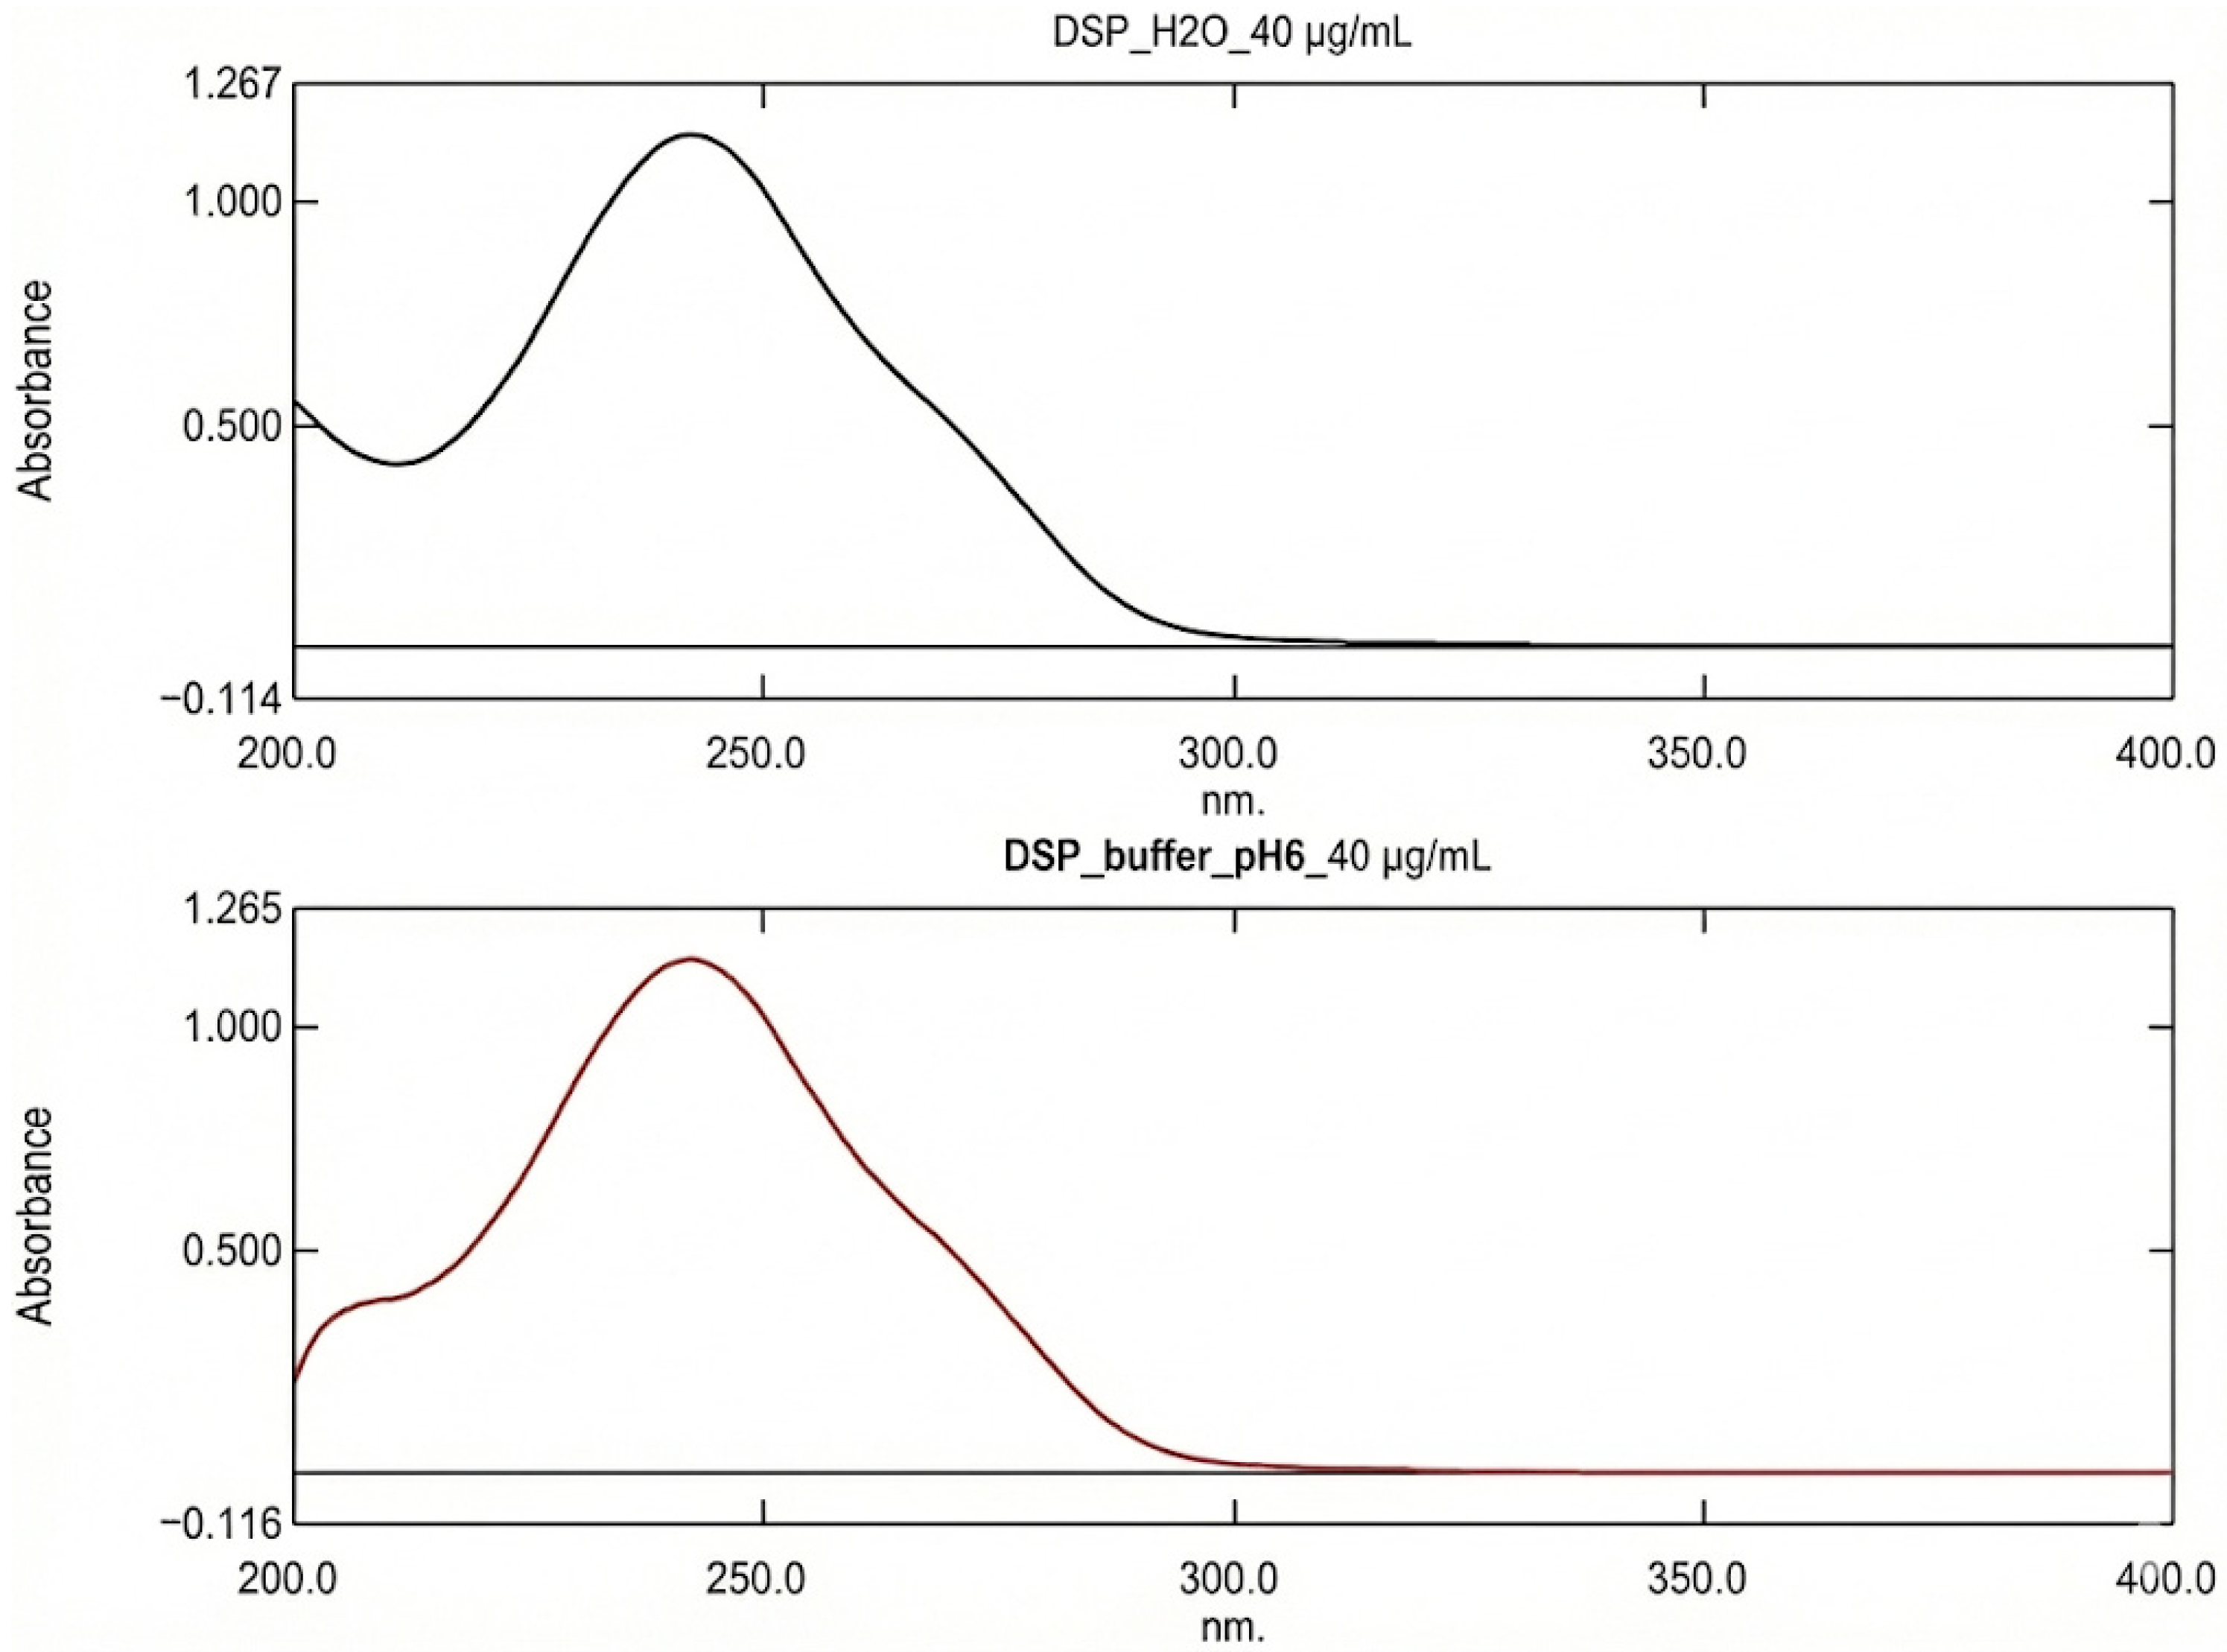
The comparative analysis of DSP in water and phosphate buffer revealed no discernible differences in peak position or absorbance intensity between the DSP spectra obtained in distilled water and those in the phosphate buffer (Figure 1). Therefore, the additional complexity of buffer preparation does not provide an analytical advantage for this specific determination. Consequently, in our study, distilled water was adopted as the primary solvent for the subsequent analysis of DSP injectable solutions, providing a simplified, cost-effective, and eco-friendly analytical approach.

3.1.2. Spectral Investigation

Zero-Order UV Spectra (D0) Analysis
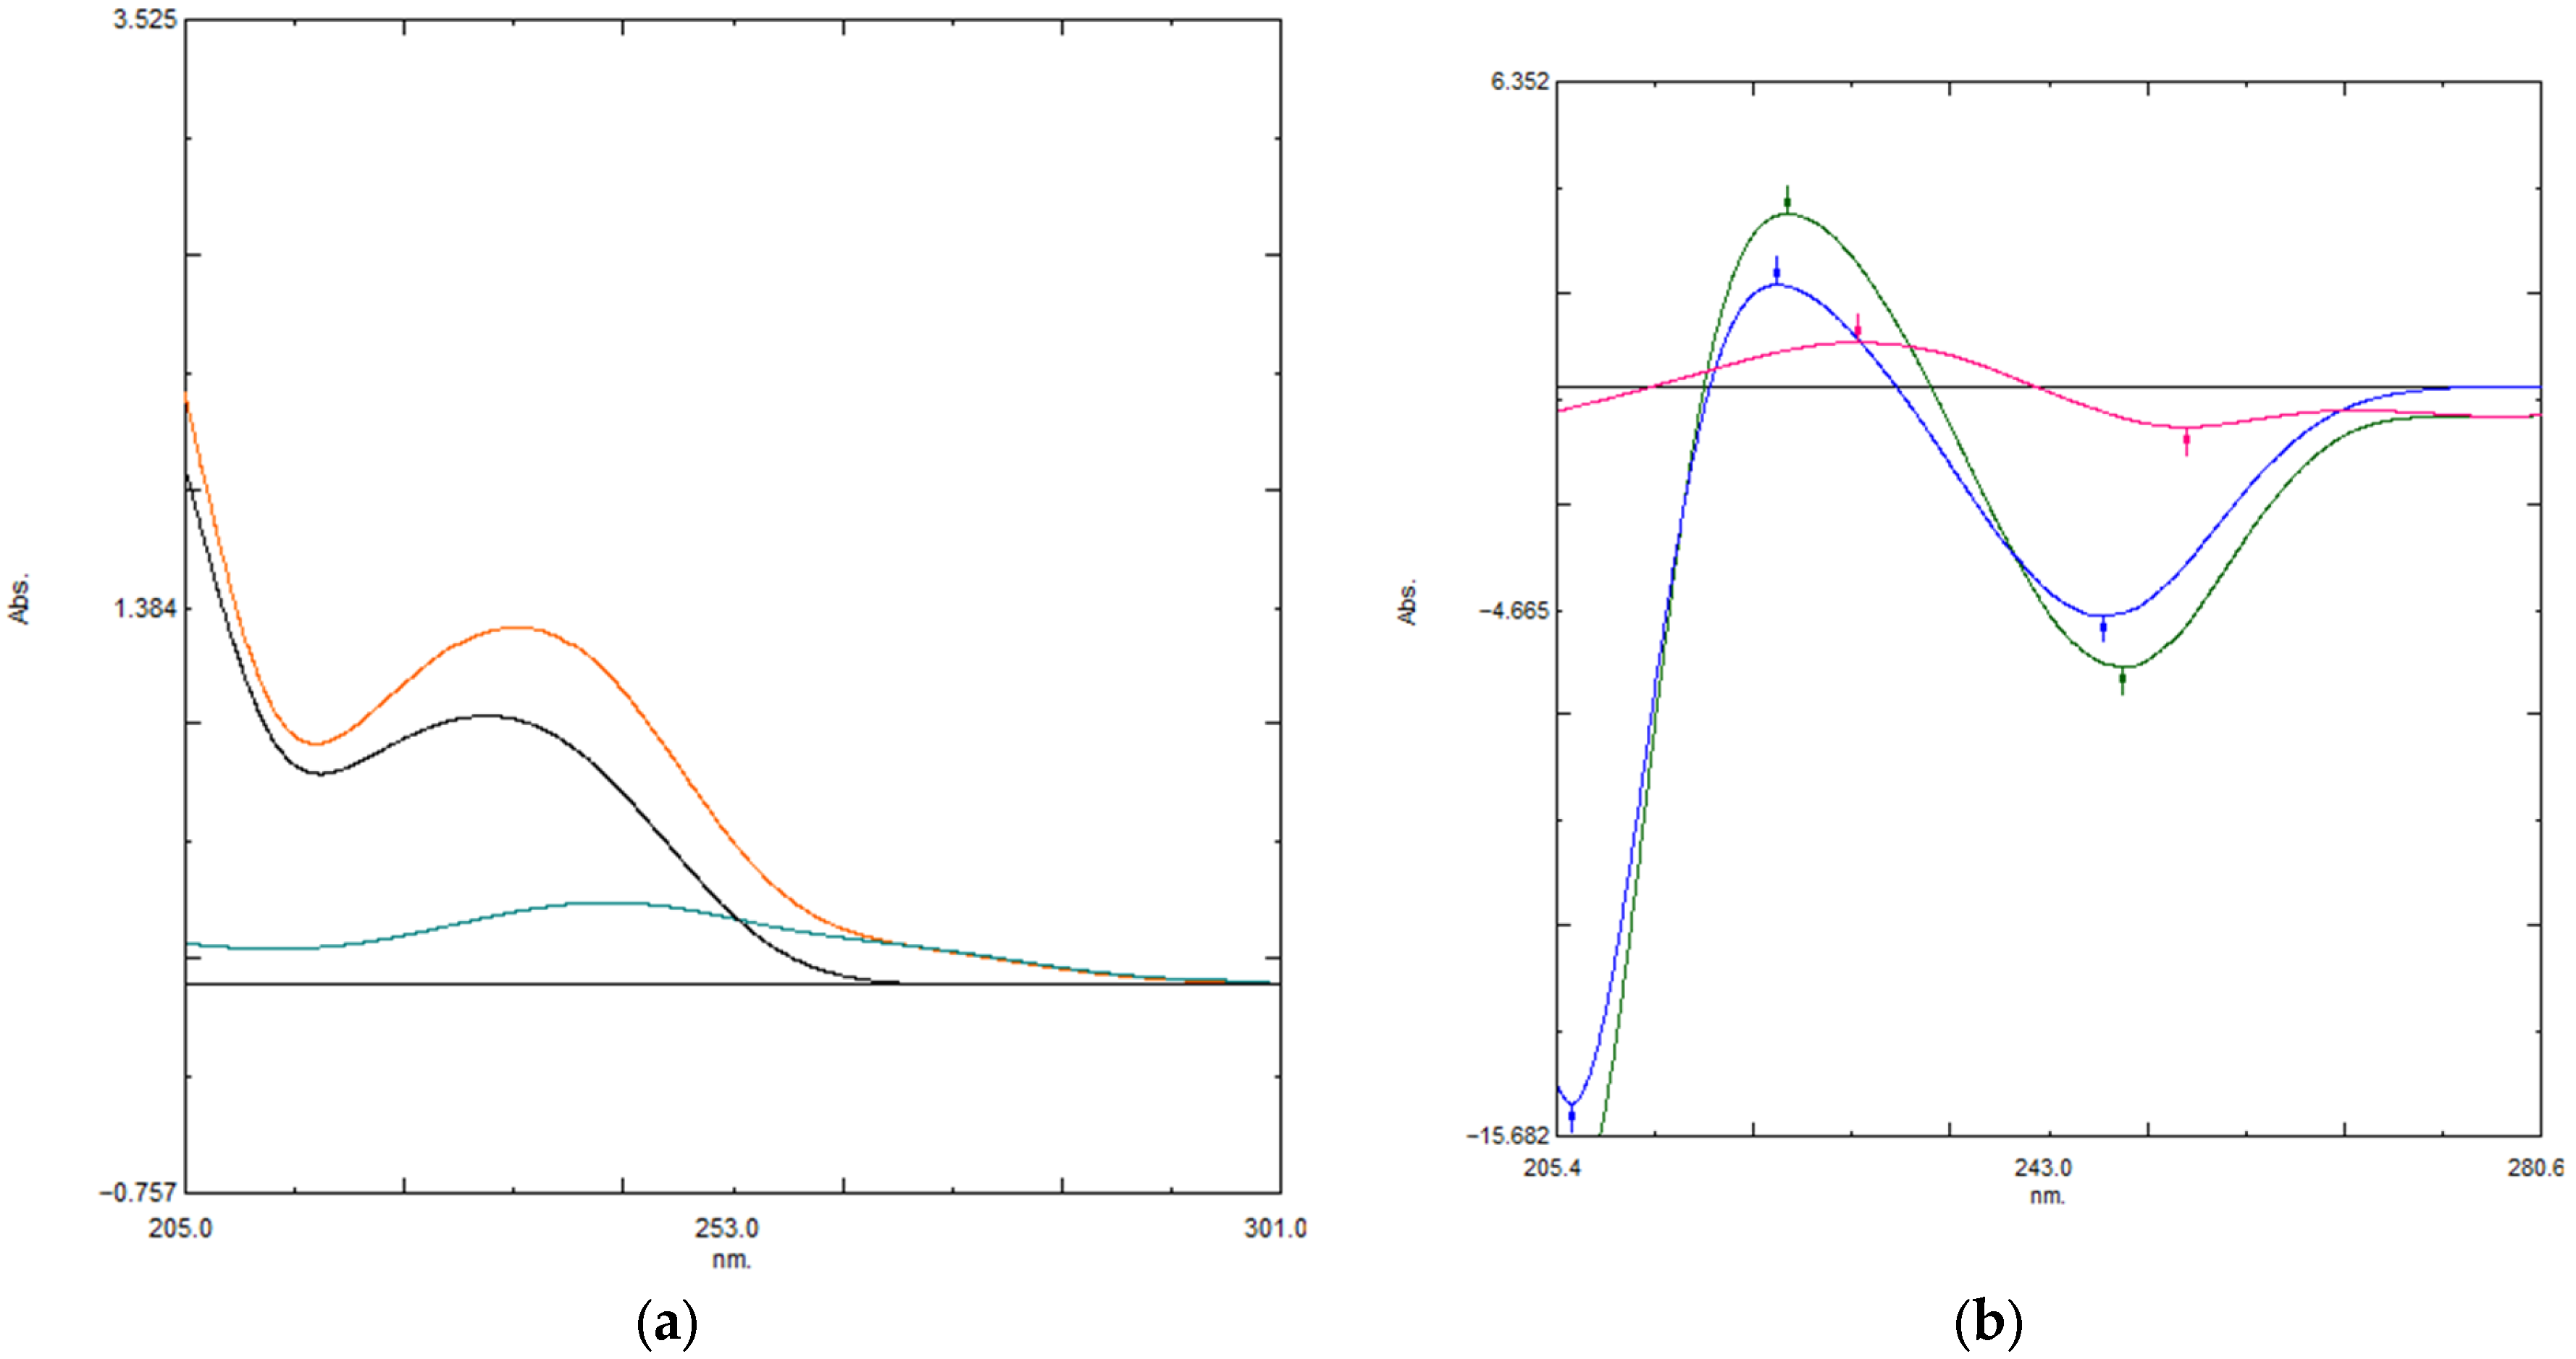
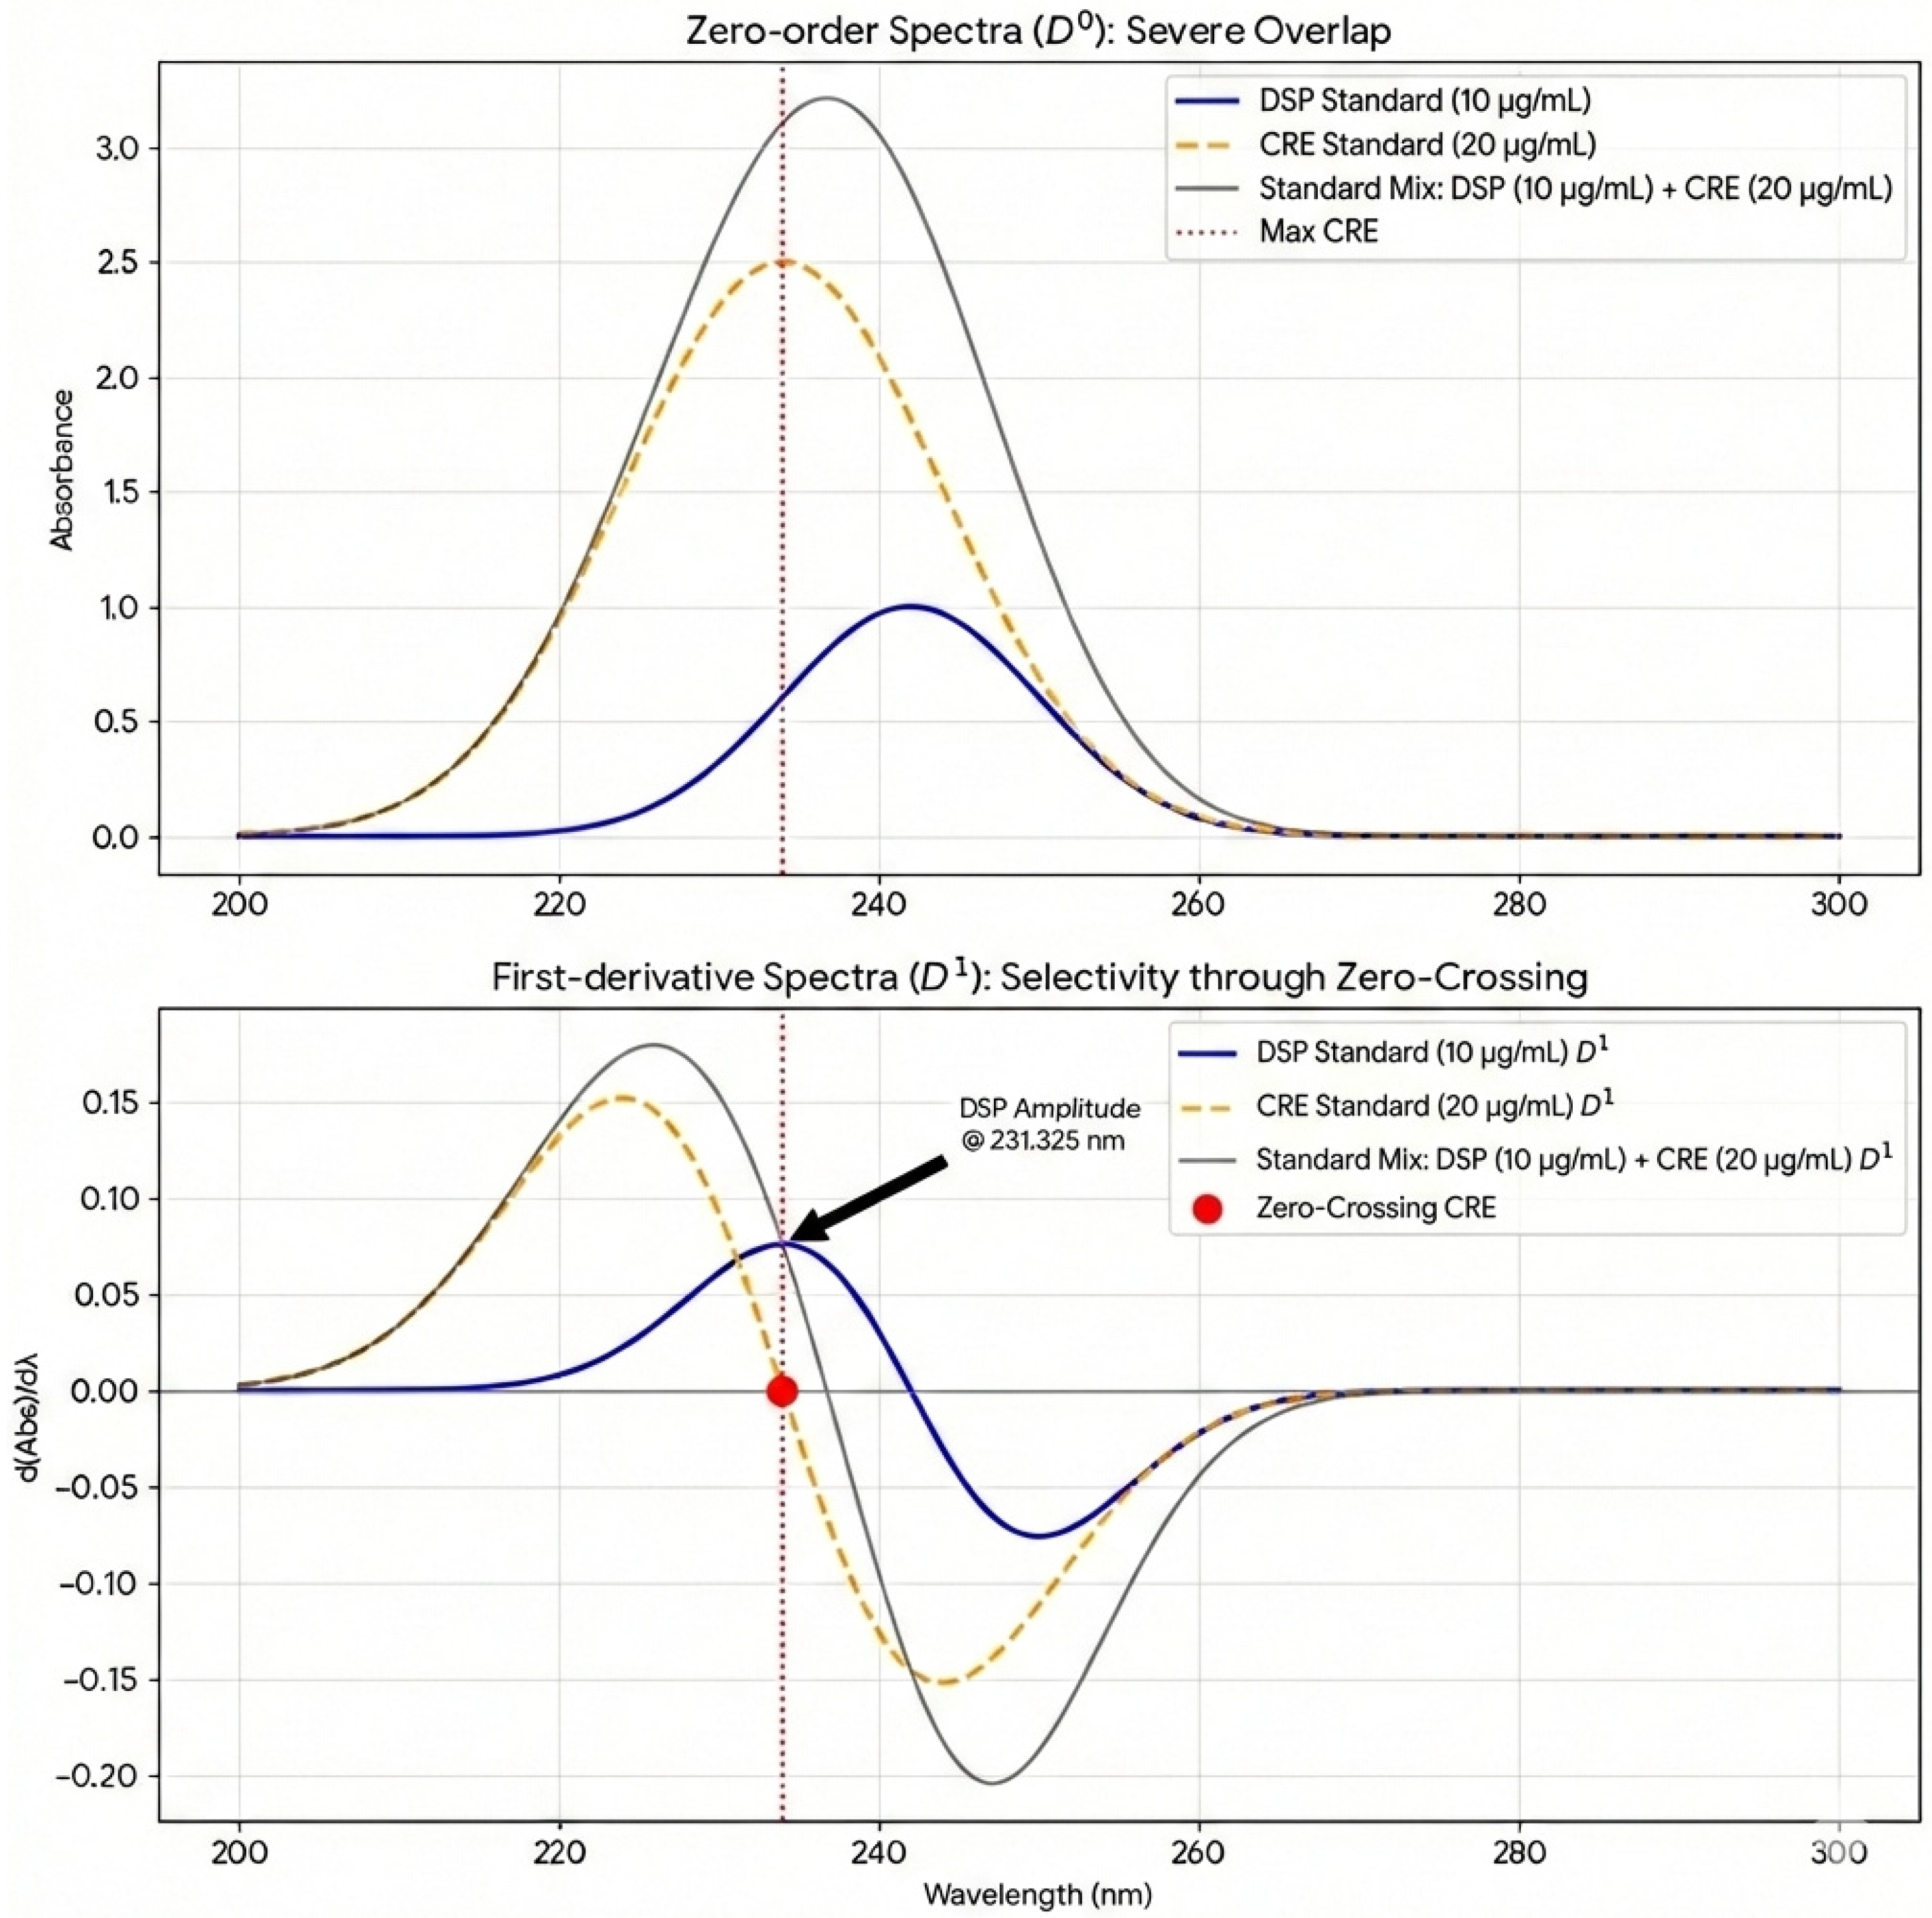
The overlay of zero-order UV spectra (D0) of DSP standard solution, CRE standard solution, and the mixture of DSP and CRE standard solutions showed substantial overlap, making direct spectrophotometric determination inaccurate (Figure 2—upper panel; Figure A1a). The dexamethasone sodium phosphate reference standard solution (10 μg/mL) exhibited a maximum of absorption at λ = 242.1 nm. The creatinine standard solution (20 μg/mL) exhibited a maximum of absorption at λ = 231.5 nm, while the mixture of DSP (10 μg/mL) and CRE (20 μg/mL) standards, exhibited a maximum of absorption at λ = 234 nm, revealing a hypsochromic shift from 242.1 nm to 234 nm, accompanied by a hyperchromic effect (increased absorbance).
Determination of Zero-Crossing Point for CRE
The zero-crossing point was determined at 231.325 nm. Due to the instrument’s display resolution, amplitudes were calculated via linear interpolation between the 231.3 and 231.4 nm data points to ensure absolute elimination of creatinine interference.
First-Order UV Spectra (D1) Analysis
The overlay of first-order UV spectra (D1) of DSP standard solution, CRE standard solution and the mixture of DSP and CRE standard solutions (Figure 2—lower panel; Figure A1b) showed that at the zero-crossing wavelength of creatinine (λ = 231.325 nm), the creatinine signal is nullified, allowing for the selective measurement of DSP and the successful resolution of the spectral overlap inherent in the binary mixture. Due to the 0.1 nm sampling constraint of the spectrophotometer, the amplitude at the exact zero-crossing wavelength (λZC) was determined via linear interpolation between 231.3 nm and 231.4 nm. This mathematical adjustment ensures that the derivative signal is captured at the precise coordinate where the interferent’s contribution is null.
However, our results showed a residual amplitude of the excipient at the selected zero-crossing wavelength, which was found to be less than 0.5% of the analyte’s signal. This was considered negligible for the intended purpose. A slight matrix effect was observed, characterized by a shift in the derivative amplitude of DSP in the presence of creatinine. Consequently, to ensure accuracy, the method was validated using matrix-matched standards (DSP spiked with creatinine in a 1:2 ratio).

3.2. First-Derivative (D1) Spectrophotometric Method

3.2.1. Optimization of Derivative Parameters

To address the significant spectral interference that precludes accurate direct spectrophotometric quantification, first-order derivative (D1) spectra were generated to enhance analytical resolution. The selection of the differentiation interval (Δλ) and the scaling factor (SF) was optimized to ensure the best signal-to-noise ratio and spectral resolution. For Δλ selection, various intervals were tested. It was found that Δλ = 4 nm provided sharp derivative peaks and well-defined zero-crossing points, whereas smaller intervals increased electronic noise and larger intervals resulted in a loss of spectral detail. A scaling factor of 100 was applied to the D1 spectra to amplify the derivative signals, making the amplitudes easily measurable for precise quantification.

3.2.2. Selection of Analytical Wavelength

The D1 spectra of DSP and creatinine were overlaid to identify the “zero-crossing” points. It was found that at λ = 231.325 nm, the D1 amplitude of creatinine is zero, while DSP exhibits a significant and reproducible derivative signal. This wavelength was chosen for the selective determination of DSP without any interference from the excipient creatinine.

3.3. Linearity and Calibration Curve (D1 Spectrophotometry)

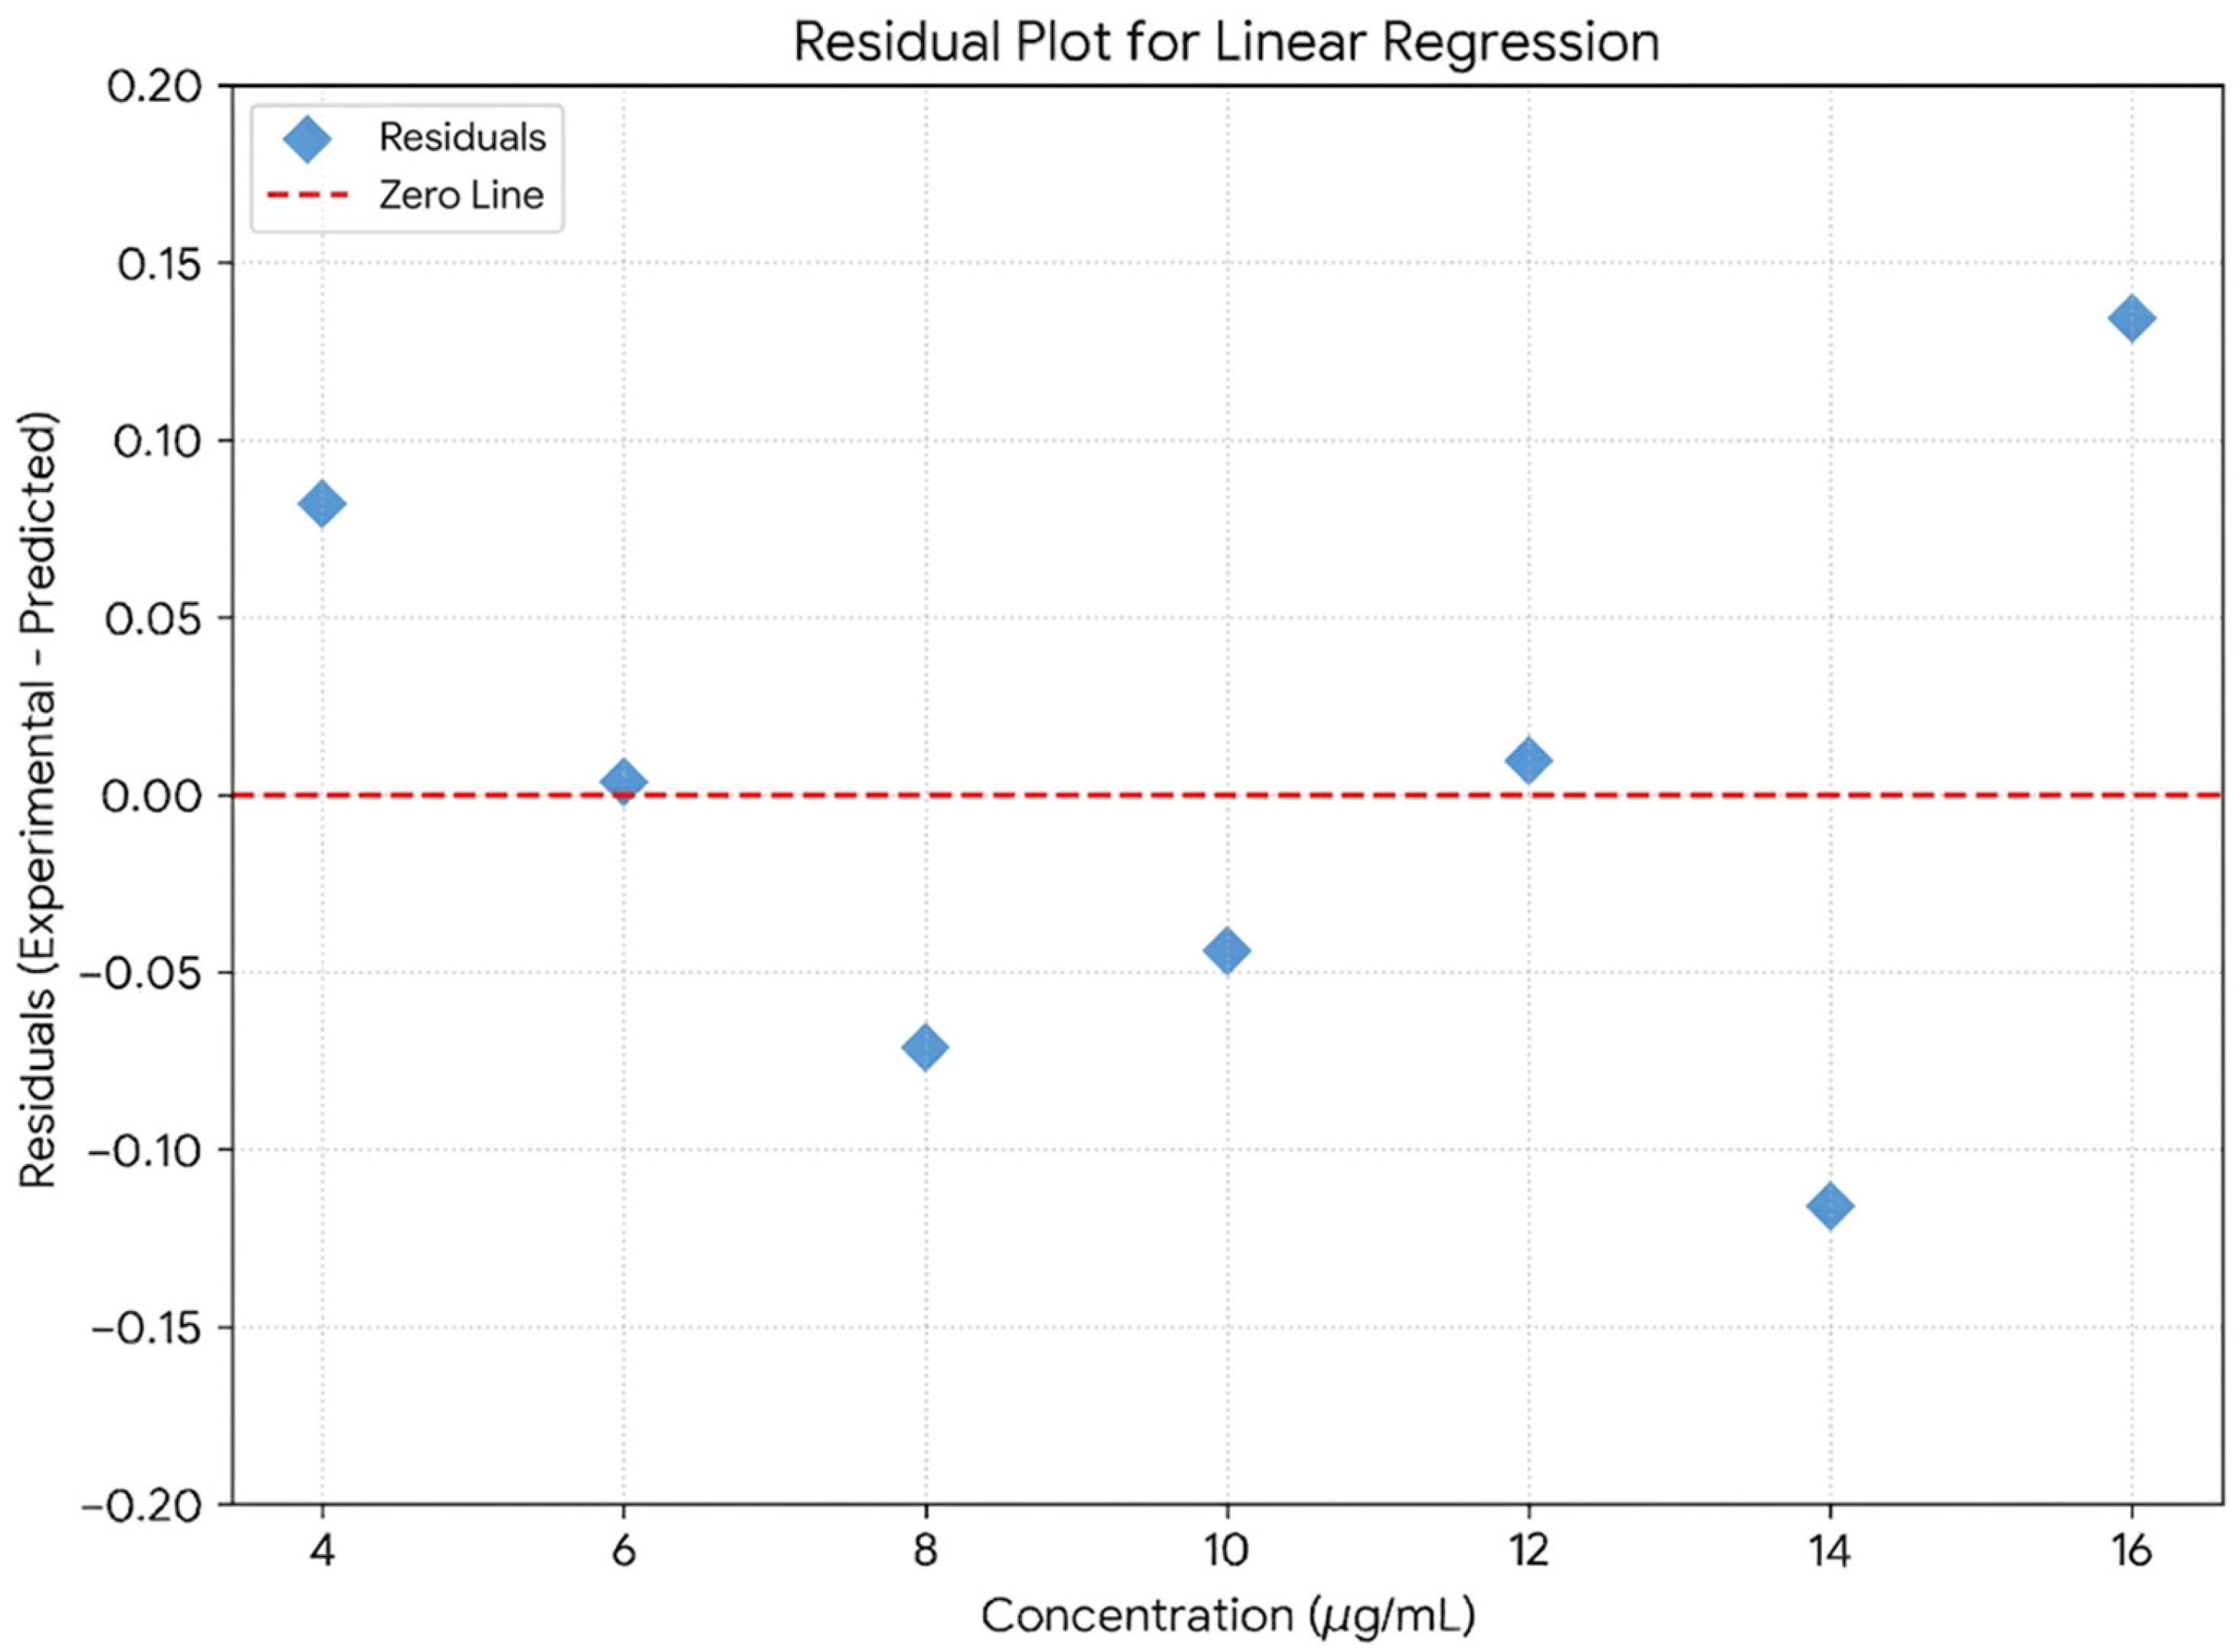
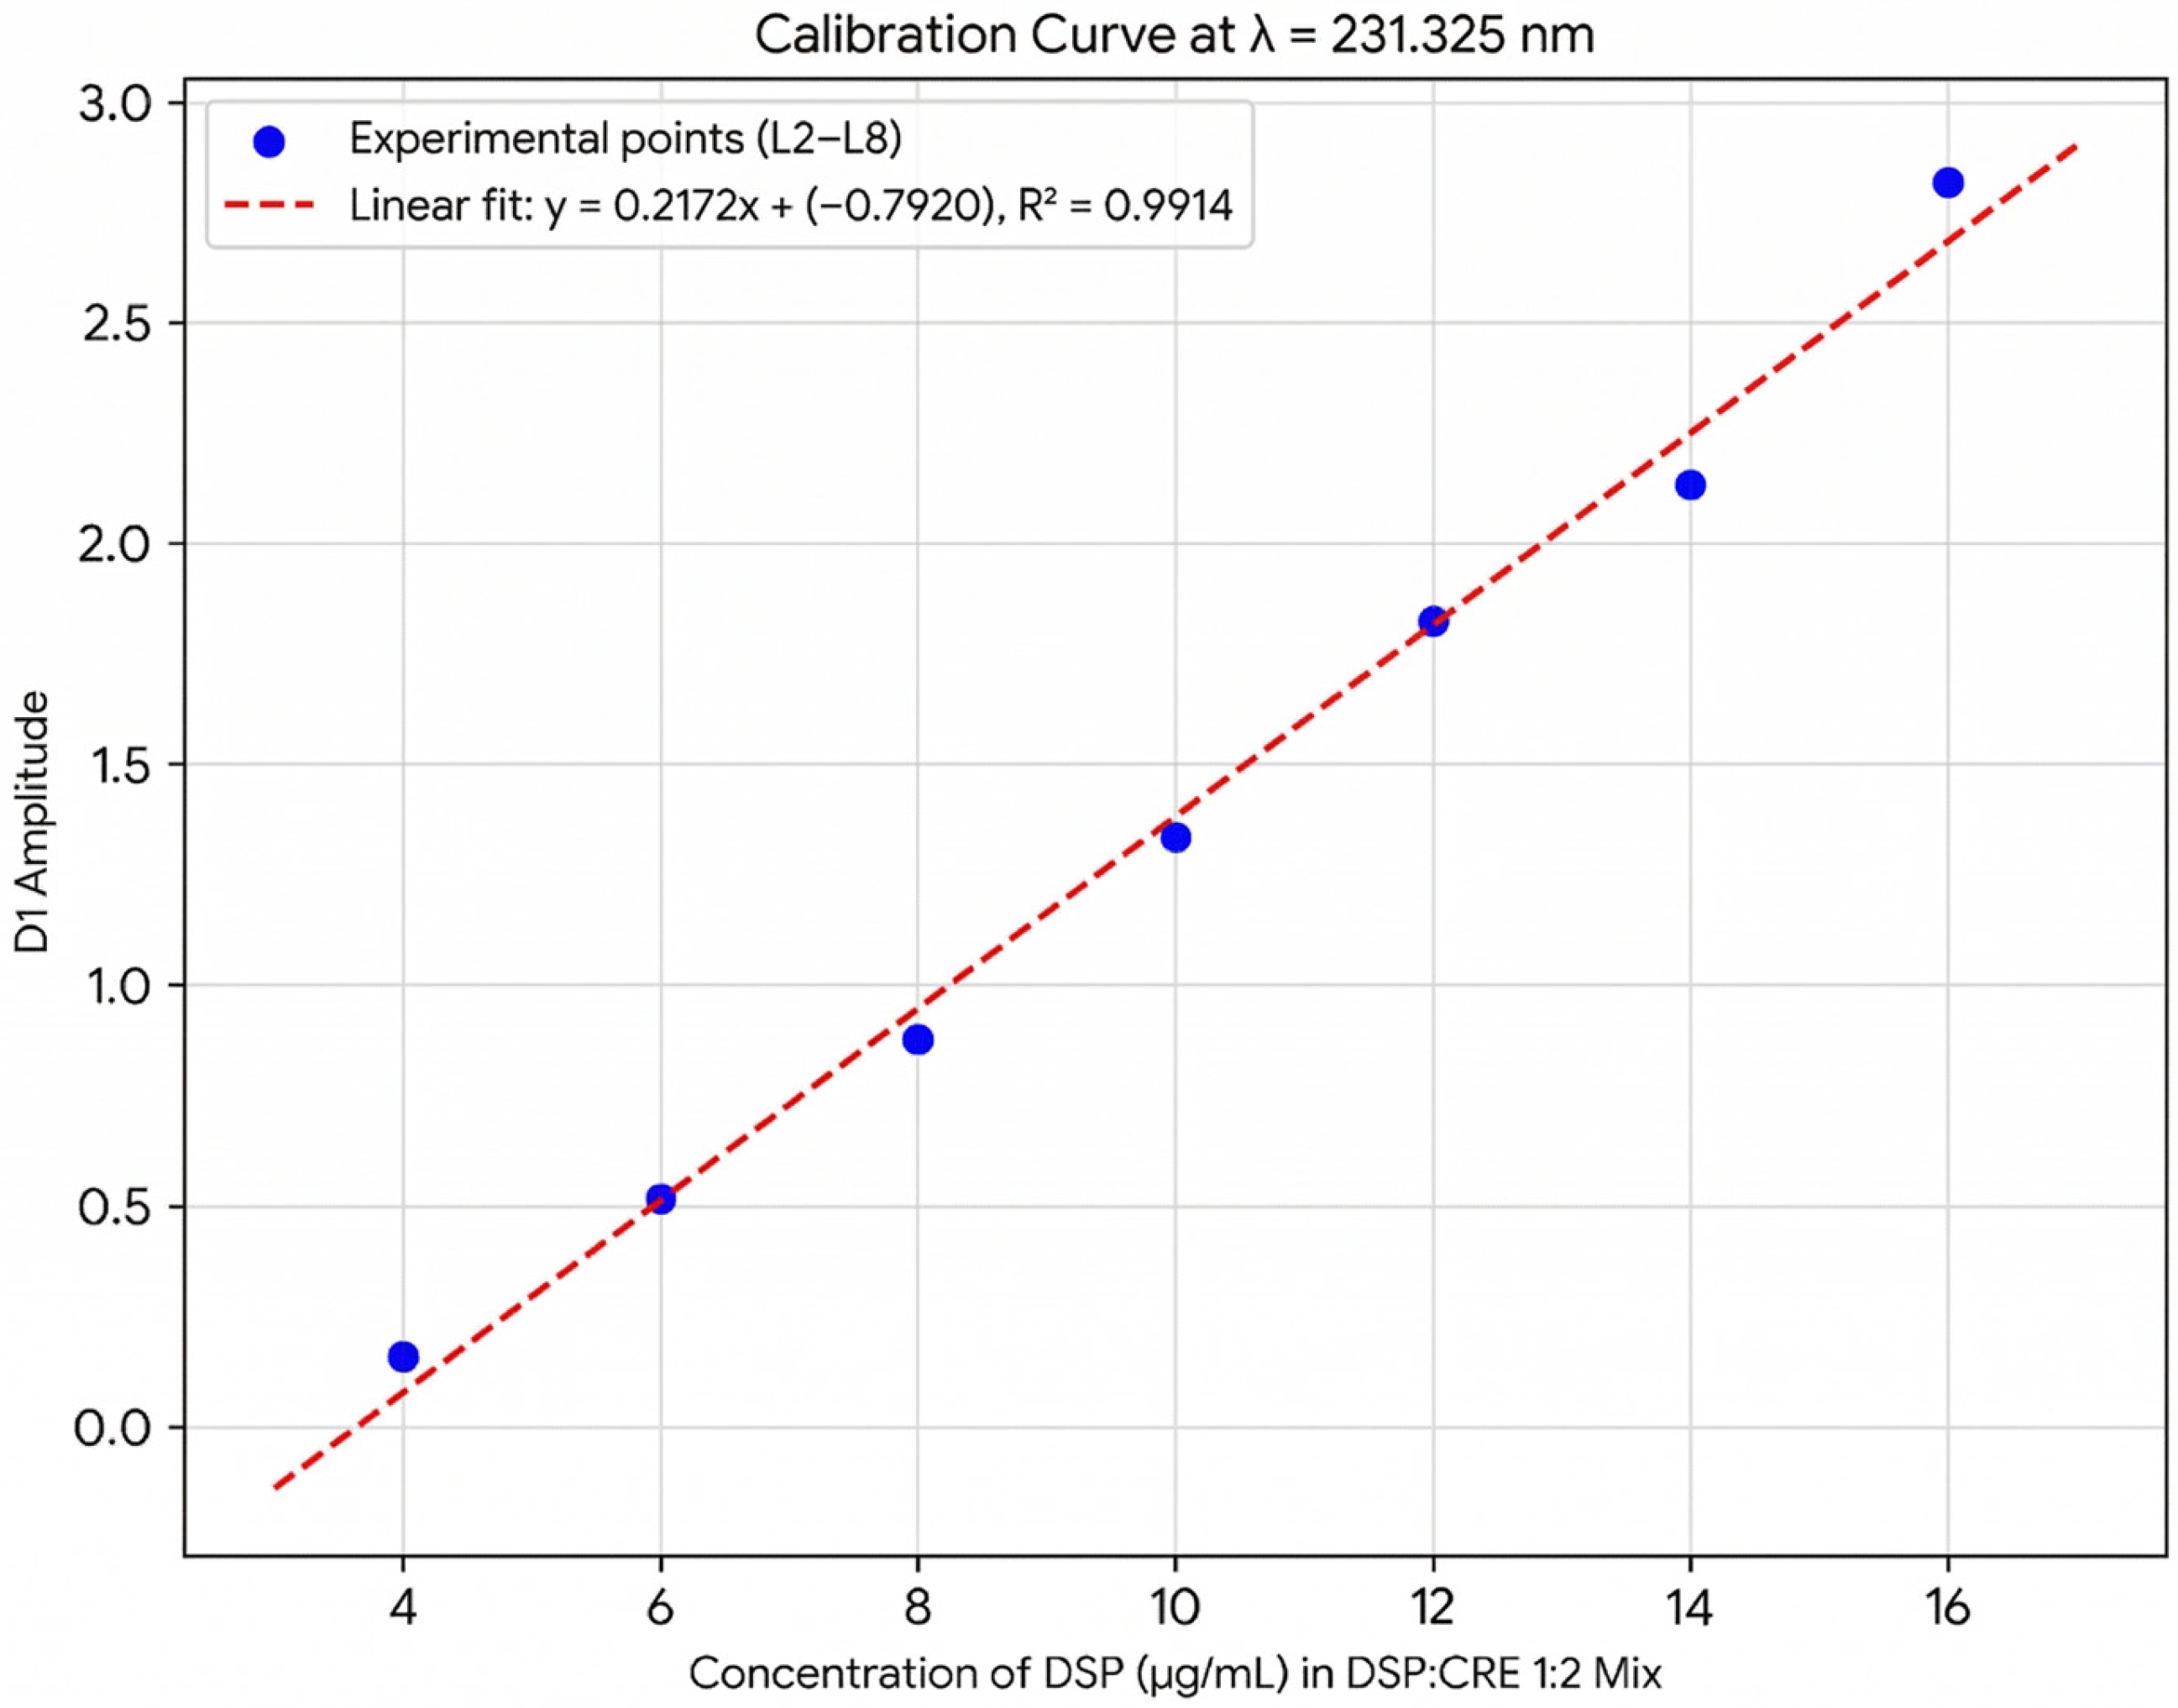
The zero-order (D0) UV absorption spectra were recorded across the spectral range of 200–300 nm for the serial dilutions of standard stock mix S1 (Table 4) containing DSP and CRE standards in a 1:2 ratio, within the concentration range of 2–16 μg DSP/mL. The first-order (D1) calibration curve was constructed by plotting the derivative amplitude versus the corresponding concentrations. The linearity range was established between 4.0 and 16.0 µg/mL, demonstrating excellent linearity (Figure A2, Table 2). The concentration point of 2.0 µg/mL was excluded from the final regression as it fell below the statistically calculated Limit of Quantification (LOQ = 4.39 µg/mL), ensuring a superior correlation coefficient (R2 > 0.99) and higher predictive accuracy for the pharmaceutical samples. Additional statistical analysis to strengthen the validation of the method’s linear range (4–16 μg/mL) was performed. A residual plot for the linear regression was generated and included in the Appendix A (Figure A3) to further support the validity of the model.

3.4. First-Derivative (D1) Spectrophotometric Method Validation

The method was validated as per ICH guidelines [17].
Linearity was demonstrated for binary mixtures of DSP and CRE (1:2 ratio) within the concentration range of 4.0–16.0 μg/mL for the active ingredient (R2 > 0.99). The limit of detection (LOD) and limit of quantification (LOQ) were calculated based on the standard deviation of the intercept and the slope (Table 2).
The accuracy was confirmed by analyzing synthetic mixtures of DSP and creatinine, yielding recoveries between 98–102%. Maximum accuracy was achieved at the 120% level (working concentration), where the mean recovery was 100.3%, aligning perfectly with validation criteria. All RSD (Relative Standard Deviation) values are below 2%, demonstrating that the method is highly precise and reproducible (Table 3).
The precision of the spectrophotometric method was assessed by analyzing 3 independent series of synthetic mixtures of DSP and creatinine (1:2, w/w) at three concentration levels (8 μg DSP/mL, 10 μg DSP/mL, and 12 μg DSP/mL), which were selected to fall within the linearity range presented in Table 4, each in triplicate. The results are expressed as mean ± standard deviation (SD), as shown in Table 3. Intraday and inter-day precision were evaluated by calculating the % RSD, which was found to be less than 2%, demonstrating the precision of the method. The relative standard deviation (RSD%) ranged from 0.28% to 1.89%, demonstrating excellent instrumental and procedural consistency.
Table 3. Evaluation of accuracy and precision (repeatability) of the proposed D1 spectrophotometric method.
Level
(%)
Nominal Conc. (Cn, μg DSP/mL)Measured
Amplitude (A)
Found Conc. (Cf, μg DSP/mL) a
(Mean ± SD)
Recovery (R, %) b
(Mean ± SD)
RSD c
Level 1 (80%)8.0P1: 0.9698.1085101.351.89%
P2: 0.9718.1177101.47
P3: 0.9137.850698.13
(8.03 ± 0.15)(100.32 ± 1.89)
Level 2 (100%)10.0P1: 1.33659.800698.001.04%
P2: 1.35389.880398.80
P3: 1.381010.01100.05
(9.90 ± 0.11)(98.95 ± 1.03)
Level 3 (120%)12.0P1: 1.824512.0477100.390.28%
P2: 1.82812.0637100.53
P3: 1.81411.999399.99
(12.04 ±0.03)(100.30 ± 0.28)
a Found Concentration (Cf) = (A − n)/m, where n = −0.792000, and m = 0.217179; b R = (Cf/Cn) × 100; c RSD = (SD/Mean) × 100.
Table 4. Linearity protocol (amplitudes at λ = 231.325 nm) for the proposed D1 spectrophotometric method.
PointNominal Concentration
DSP (μg/mL)
Nominal Concentration
CRE (μg/mL)
Calculated Amplitude ( D λ Z C 1 )
D λ Z C 1 = D λ 1 1 + D λ 2 1 D λ 1 1 λ 2 λ 1 · ( λ z c   λ 1 )
L12.04.00.0082
L24.08.00.1592
L36.012.00.5152
L48.016.00.8747
L510.020.01.3365
L612.024.01.8245
L714.028.02.1332
L816.032.02.8180

3.5. Sample Analysis

Dexamethasone 4 mg/mL solution for injection (Rompharm Company) was analyzed at a target analytical concentration of 10 μg DSP/mL (based on the labeled claim), in triplicate (Table 5).
Table 5. Determination of Dexamethasone (4 mg/mL) in pharmaceutical dosage forms (solution for injection) via D1 spectrophotometry at the creatinine zero-crossing point.
Target Conc.
(Cn, μg DSP/mL)
Measured Amplitude
(A)
Conc. Found
(Cf, μg DSP/mL) a
Assay
(%) b
Mean
(%)
10.0P1: 1.36039.910099.1098.41%
P2: 1.34139.822698.23
P3: 1.33409.789297.89
a Found Concentration (Cf) = (A − n)/m, where n = −0.792000, and m = 0.217179; b (Cf/Cn) × 100.
The quantitative determination of the active substance yielded values within the admissibility limits specified in the European Pharmacopoeia, [95.0–105.0%].

4. Discussion

4.1. Solvent Selection and Spectral Investigation

4.1.1. Solvent Selection

Opposed to the results of similar research, which investigated injectable products containing dexamethasone sodium phosphate from China, India, Germany, Syria, and Cyprus [13], our results indicate that the spectral characteristics of DSP remain stable in an aqueous medium without the necessity of pH regulation. The discrepancies observed between different formulations and the reference standard are attributed to matrix effects, specifically the manner in which manufacturer-dependent excipients interact with the analytical signal at the working pH, as well as the inherent precision of the industrial manufacturing and dosage processes. We recommend distilled water as the optimal solvent for similar spectrophotometric determinations of DSP, as it ensures both analytical reliability and adherence to sustainable laboratory practices. Modern trends in pharmaceutical analysis strongly favor the use of non-toxic, readily available solvents. For instance, Sattar et al. (2024) successfully utilized double-distilled water as a solvent for the simultaneous determination of bisoprolol and telmisartan, achieving a high Analytical Greenness (AGREE) score [10]. Similarly, Mabrouk et al. (2021) employed distilled water for the analysis of sildenafil and paracetamol mixtures [8]. Using water significantly reduces the cost of routine quality control and eliminates the potential for salt precipitation in the instrumentation, which can occur with high-molarity buffers. While some studies, such as Üçer et al. (2025), use methanol for substances with lower water solubility like spironolactone, the high water solubility of DSP makes distilled water the most efficient and eco-friendly choice [7].

4.1.2. Spectral Investigation

Zero-Order UV Spectra (D0) Analysis
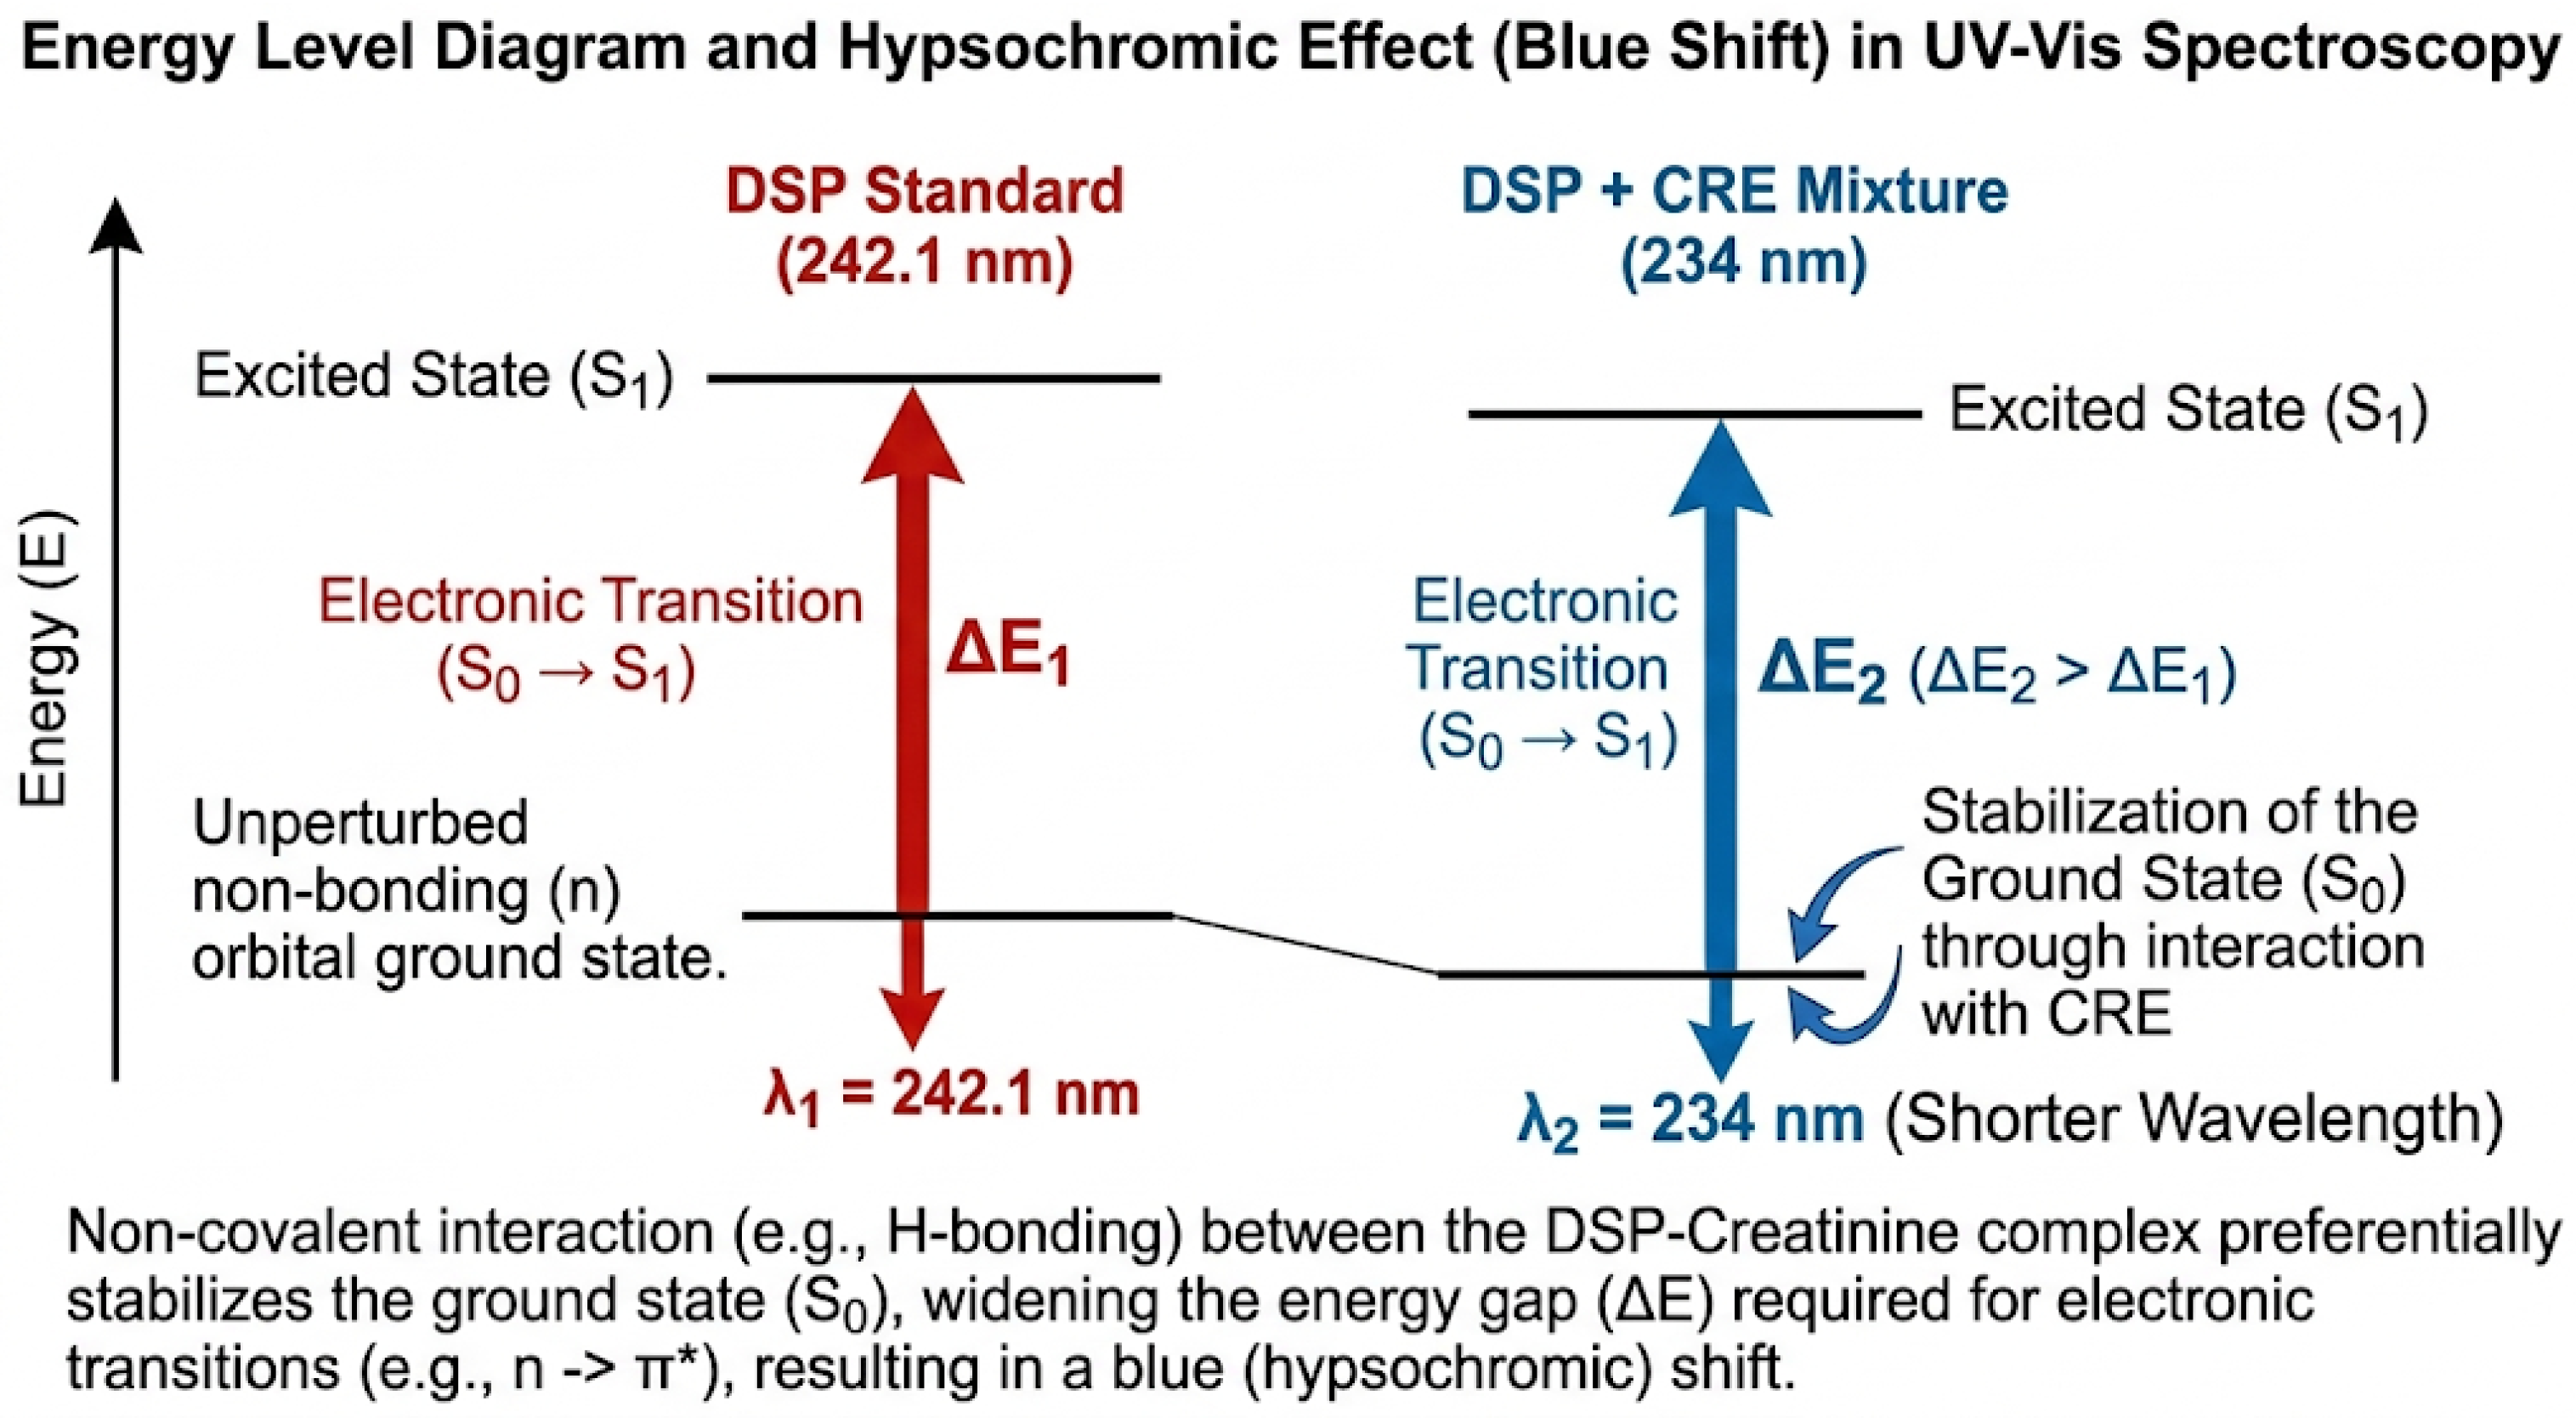
Our results are in accordance with the findings of other studies that tested DSP in distilled water, where DSP exhibited a maximum absorbance at λ = 241.79 nm [18], and CRE with a maximum peak around 230 nm [5,19]. Prathyusha’s study [18] concluded that there was no interference due to excipients used in formulation. However, excipients’ interference is not to be overlooked, as it directly impacts the spectral integrity and the subsequent accuracy of the analyte quantification. The core of DSP is a corticosteroid with a conjugated diene-one system (the “A-ring”). This system of alternating double bonds is the primary chromophore responsible for the absorption of near 242 nm. Creatinine contains a cyclic guanidine group and a carbonyl group. Its λmax at 231.5 nm is also due to electronic transitions within this polar, nitrogen-rich ring. The spectrophotometric analysis of the binary mixture revealed a notable hypsochromic shift (blue shift) in the maximum absorption of DSP, which migrated from 242.1 nm to 234 nm upon the addition of creatinine. According to the Planck-Einstein relation, this transition toward shorter wavelengths signifies a measurable increase in the energy gap (ΔE) required for electronic excitation within the DSP chromophore. This shift is likely driven by a significant alteration in the micro-environmental polarity and the formation of a non-covalent molecular association between the two species. DSP, as an anionic phosphate ester, possesses carbonyl groups with non-bonding (n) electrons that are highly sensitive to their surroundings. The introduction of creatinine, a molecule rich in hydrogen-bonding donors and acceptors, facilitates an interaction that preferentially stabilizes the ground state of these n electrons. By “pinning” these electrons through hydrogen bonding or electrostatic attraction, the transition to the excited π* state becomes energetically more demanding, effectively pushing the absorption maximum to a higher frequency. Furthermore, the observed hyperchromic effect (the increase in total absorbance) provides further evidence of a specific molecular interaction. This enhancement suggests that the formation of a DSP-CRE complex modifies the molecular geometry or electronic symmetry of the chromophore, thereby increasing its molar absorptivity. Rather than a simple additive effect of two independent solutes, the data points toward a synergistic electronic coupling, where the structural alignment of the complex increases the probability of light absorption compared to the isolated molecules. The energy level diagram illustrating the hypsochromic shift and ground-state stabilization in the DSP-CRE mixture is illustrated in Figure 3.
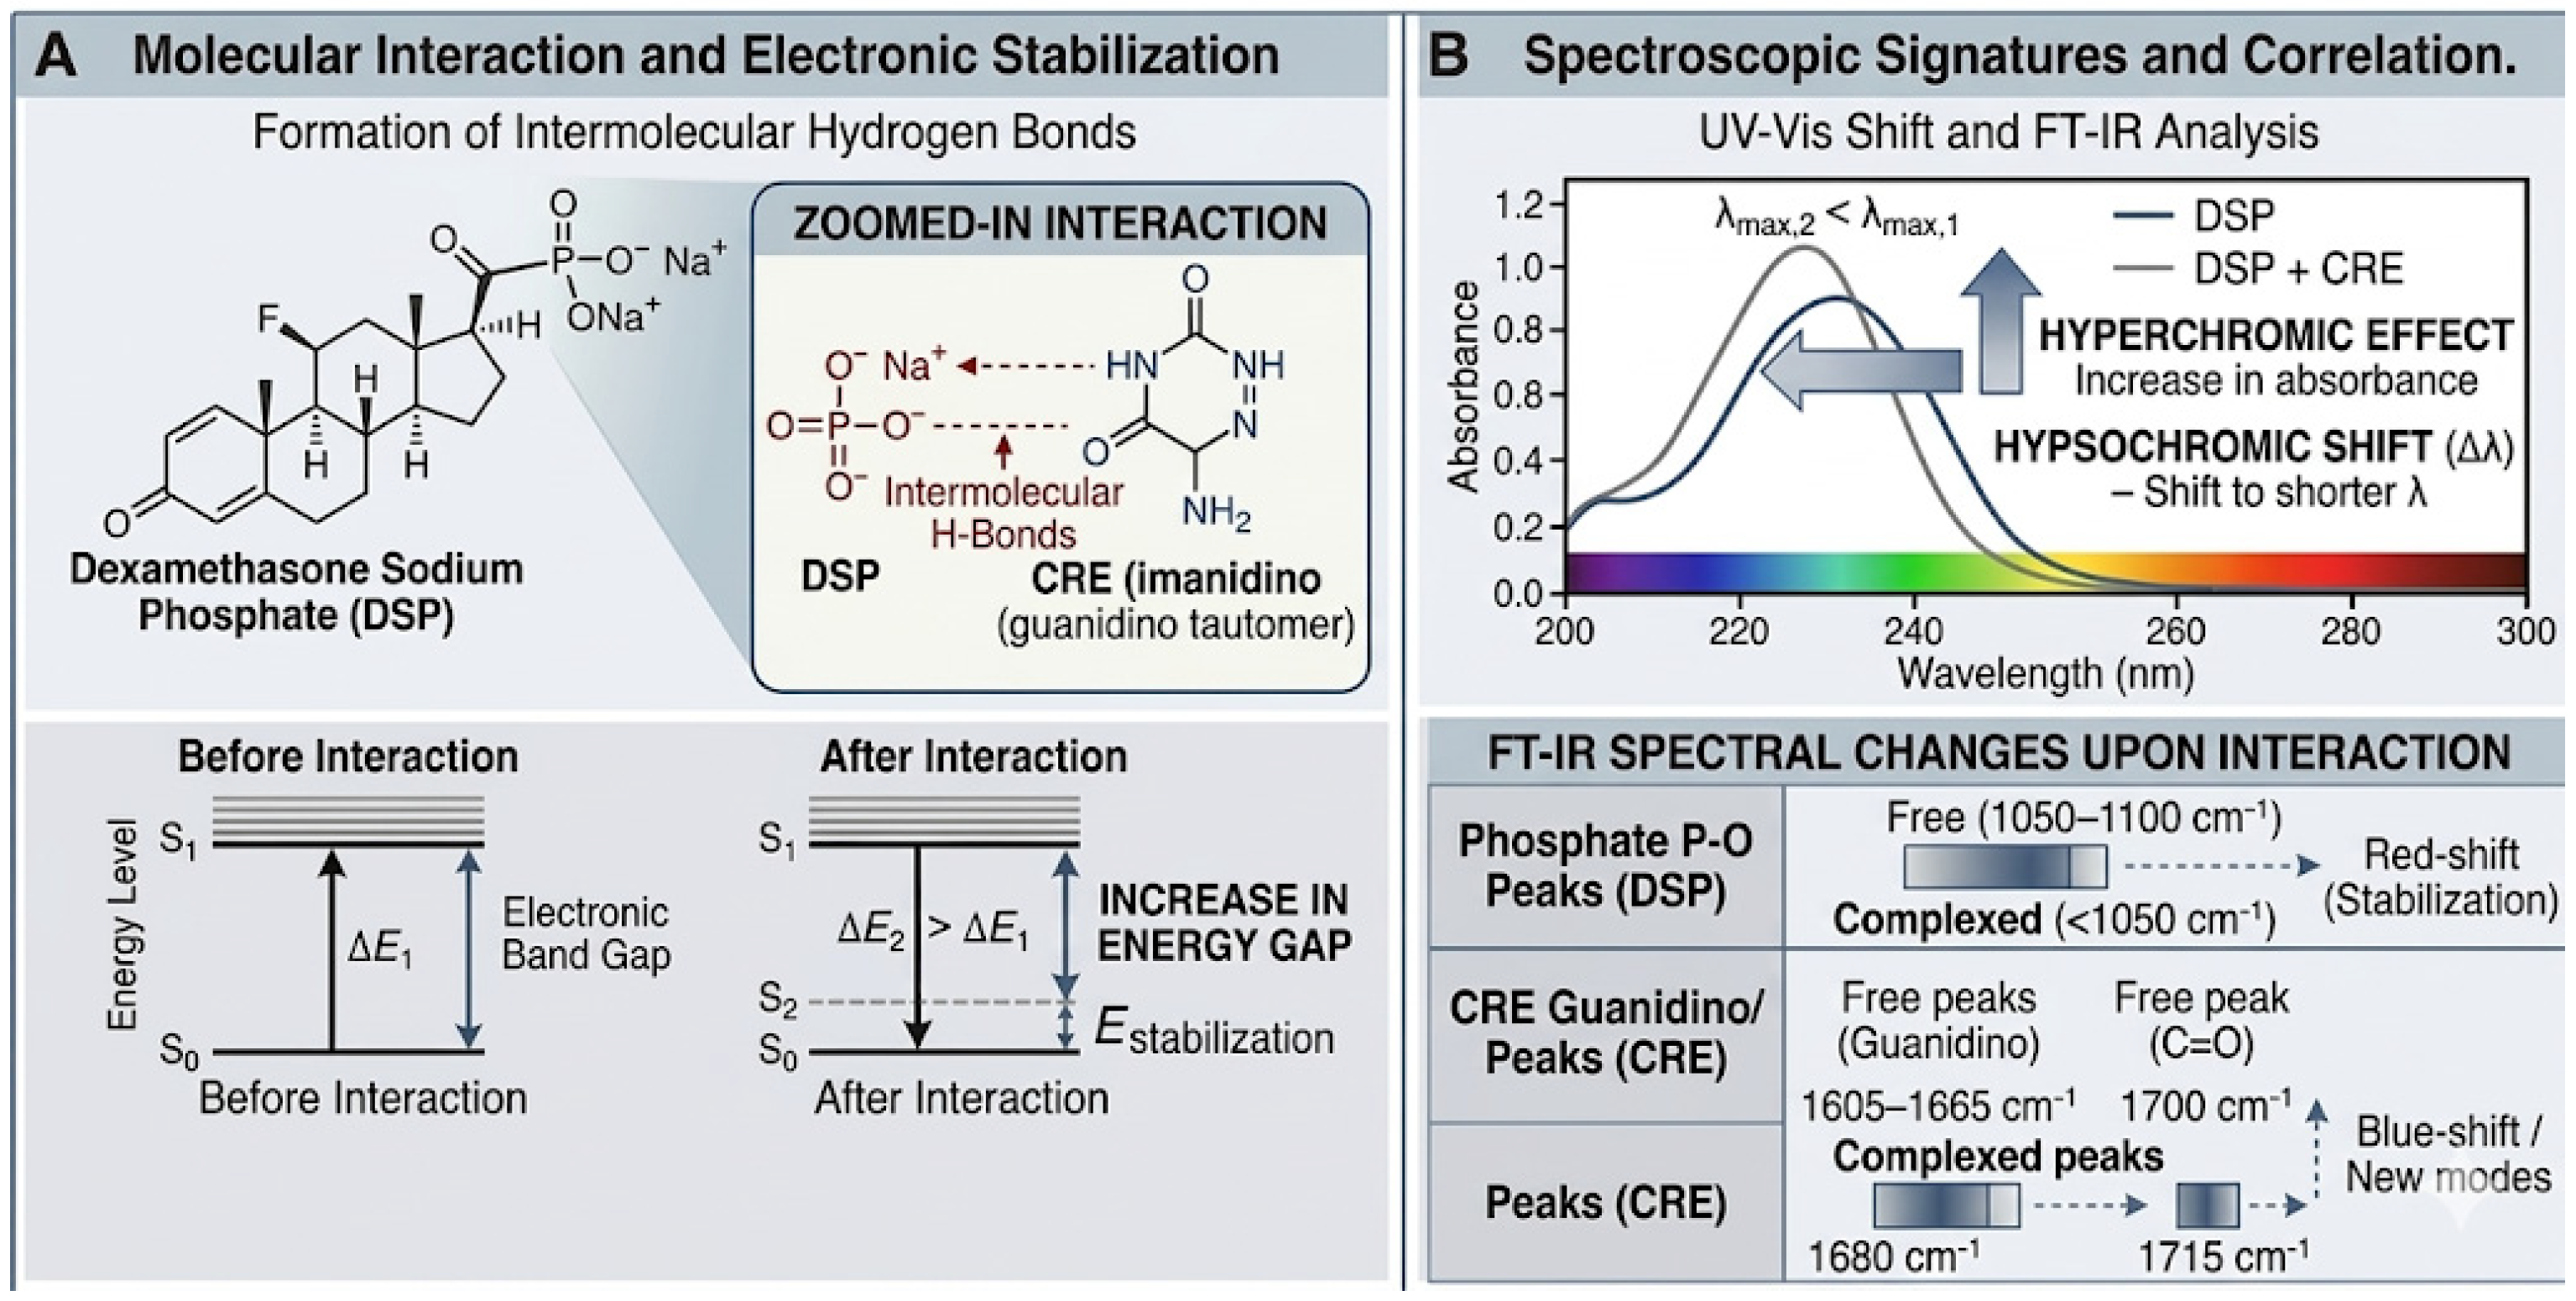
Although direct FT-IR measurements were not performed in this study, the observed UV-Vis hypsochromic shift is consistent with vibrational data reported in the literature for corticosteroid-organic base interactions. The FT-IR spectrum of DSP is characterized by intense bands at 1660–1665 cm−1 (C=O stretching in the conjugated system) and 1050–1100 cm−1 (P-O stretching of the phosphate group). The interaction with nitrogen-containing molecules like creatinine, which exhibits a characteristic carbonyl peak at 1700 cm−1 and C=N stretching at 1605 cm−1, typically induces a shift in these frequencies [20,21,22]. Specifically, the formation of intermolecular hydrogen bonds between the phosphate oxygens of DSP and the amino/imino groups of CRE stabilizes the ground state. This phenomenon correlates with the electronic energy gap increase observed in our spectrophotometric data. A synthesized explanation of the mechanism by which intermolecular hydrogen bonding between DSP and CRE modifies the electronic and vibrational characteristics of the formed complex is illustrated in Figure 4.
Regardless of the analytical framework employed, be it colorimetric [23] or spectrophotometric [5,24], the potential interference from excipients is a critical factor that must be systematically addressed. In this context, numerous studies on DSP quantification have demonstrated that derivative spectrophotometry exhibits superior selectivity over conventional zero-order methods, particularly in overcoming the spectral overlap induced by formulation excipients. This is particularly relevant for creatinine, whose intense UV absorption frequently compromises the reliability of zero-order DSP determination [5]. In addition, in a related analytical context involving neomycin sulfate as a co-formulated active ingredient rather than an excipient, [24] demonstrated that the third-order derivative spectrophotometric method offered superior resolution and was thus the preferred approach for multicomponent analysis.
Similar results to ours were also obtained in the study conducted by Collado et al. [5], which focused on the simultaneous determination of dexamethasone and common excipients (creatinine and propylparaben) in injection formulations using UV-spectroscopy combined with multivariate calibration. The results obtained highlighted severe spectral overlap between dexamethasone and its excipients, which makes traditional zero-order spectrophotometry difficult for direct quantification. In their study [5], Partial Least-Squares (PLS-1) regression was preferred because it effectively resolves the “severe spectral overlap” between dexamethasone and its excipients (creatinine and propylparaben) without requiring any prior chemical separation. While derivative spectrophotometry could have been utilized for signal resolution, the authors prioritized Partial Least-Squares (PLS-1) regression due to its superior precision in resolving three-component mixtures. This multivariate approach yielded analytical accuracy comparable to the standard HPLC pharmacopeial method [5]. Although chemometric approaches such as Partial Least Squares (PLS) offer advanced capabilities for resolving overlapping signals, the first-derivative zero-crossing method was preferred for this study. The primary rationale lies in its simplicity and cost-effectiveness, as it eliminates the need for extensive training sets and complex multivariate software required by PLS. Given that the derivative approach successfully resolved the DSP-creatinine interference with high accuracy and precision, it represents a more practical and accessible tool for routine pharmaceutical analysis, adhering to the principle of using the simplest effective analytical solution.
Determination of Zero-Crossing Point for CRE
The wavelength of 231.325 nm represents the Zero-Crossing Point (ZCP) for creatinine in the first-order derivative spectrum (D1). This point is technically significant for the following reasons:
  • Signal Nullification of the Interferent: At this specific coordinate, the first-order derivative of the creatinine absorption spectrum intersects the zero baseline. Consequently, the derivative amplitude of creatinine becomes null, effectively “canceling out” its spectral contribution regardless of its concentration;
  • Selective Quantification of DSP: While the creatinine signal is zero, DSP retains a significant and measurable derivative amplitude at the same wavelength. This allows for the selective determination of DSP without the need for prior physical separation of the components;
  • Mathematical Masking of Matrix Effects: In the zero-order spectrum (D0), the creatinine signal is dominant and overlaps the DSP peaks. By transitioning to the D1 mode and utilizing the ZCP, the complex matrix effect is mathematically eliminated, ensuring that the total recorded absorbance of the mixture at 231.325 nm is directly proportional only to the DSP concentration;
  • Analytical Reliability: This methodological approach explains the high accuracy achieved in our results (99.85% mean recovery—Table 3). It provides a robust alternative to more expensive techniques, such as HPLC, for the analysis of pharmaceutical formulations containing high-concentration excipients or interfering active ingredients.
While the precise zero-crossing wavelength and optimal sampling interval may vary slightly depending on the specific optical bandwidth and digital resolution of different instruments, the fundamental procedure, identifying the creatinine zero-crossing and applying derivative transformation, remains universally applicable. For inter-laboratory transfer, it is recommended that the zero-crossing point be re-verified on the local instrument during the initial method setup to account for these minor hardware-specific variations.
Consistent with a broader body of literature focusing on multi-component resolution, the use of ZCP in derivative spectrophotometry remains a preferred modality for analyzing binary mixtures. This approach validates the reliability of determining an analyte’s concentration based on amplitudes recorded at the zero-crossing coordinates of the co-existing substance, a strategy widely adopted to circumvent significant spectral overlap [11,24,25,26].

4.2. First-Derivative (D1) Spectrophotometric Method

The basis for selecting the 4–16 μg/mL linear range was established considering both ICH validation requirements and the specific constraints of derivative spectrophotometry. Excessive zero-order signals can degrade the signal-to-noise ratio, an effect further amplified by differentiation, which would otherwise compromise the precision and reproducibility of zero-crossing point determination [15]. Firstly, the lower limit of 4 μg/mL was determined by the sensitivity of the first-derivative signal. Below this threshold, the signal-to-noise ratio decreased, affecting the reproducibility of the zero-crossing point. Secondly, the upper limit of 16 μg/mL was selected to maintain total spectral absorbance below 1.5 AU, ensuring strict adherence to the Beer–Lambert law even in the presence of the interfering matrix (creatinine). Lastly, the target sample concentration was set at 10 μg/mL to ensure that the primary absorbance remains within the optimal photometric range (0.2–0.9 AU), where instrumental deviation is minimized. This range (representing 40% to 160% of the nominal concentration) provides a robust framework for quantifying DSP in various pharmaceutical scenarios.
Regarding the statistical validation of linearity, the 95% confidence interval (CI) for the regression coefficient (slope) was calculated and was found to be [0.1940, 0.2403]. This narrow interval indicates a high degree of precision in the method’s sensitivity. The precision of the model is further evidenced by a standard error of the slope of 0.0090 and a sum of squared residuals of 0.0453. Furthermore, the analysis of residuals was performed. The generated residual plot (Figure A3) shows a random distribution of data points around the zero line, with no observable systematic patterns. The residuals range from −0.1157 to +0.1347, confirming the homoscedasticity of the data. The observed dispersion of data points is attributable to random instrumental fluctuations typical of derivative transformations, rather than a lack of linearity. This statistical evidence validates the appropriateness of the linear model for the target concentration range (4–16 μg/mL).
The first-order derivative method was essential because the mixture exhibits a complex matrix effect that cannot be corrected by conventional methods. By utilizing the zero-crossing point combined with matrix-matched standards, we successfully eliminated systematic error, achieving recoveries in the 98–102% range.
Our experimental results are in close agreement with the literature, confirming that the optimal concentration range for the spectrophotometric analysis of DSP using distilled water extends up to 25 μg DSP/mL [18], while when using ethanol, linearity was demonstrated up to 80 μg DSP/mL [24]. Beyond this threshold, deviations from the Beer–Lambert law may occur due to molecular interactions in the aqueous matrix. When compared to the findings reported by Prathyusha et al. [18], our method exhibits higher Limit of Detection (LOD) and Limit of Quantification (LOQ) values. This discrepancy is analytically relevant and stems from the matrix-matching strategy adopted in our research. While the reference study analyzed DSP in a relatively pure state or simple dosage forms [18], our calibration was conducted using a binary mixture of DSP and creatinine (1:2 ratio). The presence of creatinine, even when measured at the zero-crossing point, introduces a significant residual matrix effect and increases the spectral background noise in the first-derivative (D1) domain. This elevated baseline fluctuation leads to a higher standard deviation of the intercept (σ), which mathematically results in increased LOD and LOQ values. However, this trade-off is necessary to ensure the specificity and accuracy of the method when analyzing commercial injectable formulations where creatinine is an omnipresent stabilizer. Our relative standard deviation (RSD%) ranged from 0.28% to 1.89%, demonstrating excellent instrumental and procedural consistency. These findings are in strong agreement with the precision levels reported by Collado et al. [5], where multivariate calibration allowed for high precision (RSD values below 1.5% for matrix components), further validating the reliability of the current UV-spectrophotometric approach for routine pharmaceutical control.
The specificity of the method was rigorously evaluated by analyzing the commercial dosage form, which contains a complex matrix of excipients such as sodium metabisulfite and disodium edetate, alongside the primary interferent, creatinine. The successful recovery of DSP (98.95–100.32%) from the pharmaceutical formulation indicates that the excipient matrix does not compromise the analytical signal. This is due to the inherent ability of the first-derivative zero-crossing technique to resolve the analyte’s peak from overlapping background signals of the formulation components. While further degradation studies could be conducted, the current data confirms that the method is fully applicable for the quality control of commercial DSP injections without interference from standard pharmaceutical additives.
The versatility of the first-derivative zero-crossing method suggests its potential applicability beyond the binary DSP-creatinine system. In pharmaceutical formulations, the method is expected to maintain its specificity in the presence of common excipients, as most do not possess chromophores that interfere with the steroid’s derivative signal. Additionally, the technique could be adapted to monitor drug stability by resolving DSP from its degradation products, which often show slight spectral shifts amenable to derivative separation. However, extending the method to complex biological matrices, such as plasma or urine, would require additional validation. In such cases, matrix-specific optimization and sample pre-treatment (e.g., deproteinization or extraction) would be mandatory to ensure that endogenous components do not mask the target zero-crossing points.
  • Strengths and Comparative Performance
Compared to established techniques like HPLC, the proposed first-derivative method stands out for its simplicity and alignment with Green Analytical Chemistry principles. While HPLC remains the gold standard for high-resolution separation, it involves high costs, time-consuming sample preparation, and the use of hazardous organic solvents. Our method, operating in a purely aqueous medium, provides comparable accuracy for the DSP-creatinine system without the associated environmental footprint. Similarly, while PLS can resolve more complex spectral overlaps, it necessitates extensive calibration matrices and specialized software. The derivative approach offers a more transparent and accessible alternative for routine quality control where binary interferences are the primary concern.
The environmental superiority of the proposed method is evidenced by a direct comparison with the official European Pharmacopoeia (EP) HPLC assay for Dexamethasone Sodium Phosphate (07/2021:0549) [27]. The EP method utilizes a mobile phase composed of a mixture of water, methanol, and tetrahydrofuran (THF), adjusted to pH 2.6 with phosphoric acid and sodium hydroxide. Methanol and THF are significant contributors to laboratory waste toxicity and require stringent disposal protocols. Furthermore, based on the EP parameters, a flow rate of 1.5 mL/min and a run time of approximately 24 min (3 times the retention time of about 8 min), each analysis generates roughly 36 mL of organic-aqueous hazardous waste [27]. In contrast, our first-derivative spectrophotometric approach utilizes distilled water as the sole solvent, producing minimal, non-toxic waste. This transition to a 100% aqueous system significantly improves the Analytical Eco-Scale score of the procedure by eliminating toxic reagents and reducing the energy consumption associated with high-pressure chromatographic systems.
The validated method offers significant advantages across several scientific disciplines. In pharmaceutical analysis, its robustness is particularly valuable for addressing the challenge of spectral overlap between the active pharmaceutical ingredient (DSP) and common excipients (creatinine) or preservatives, ensuring accurate quantification without complex separation steps. In biomedical research, while direct clinical monitoring in complex matrices remains a challenge for simple aqueous methods, this approach provides a reliable tool for in vitro interaction studies between drugs and endogenous metabolites (such as creatinine) under controlled physiological-like conditions. For materials science, the method is ideally suited for characterizing the in vitro release kinetics of DSP from hydrophilic polymer matrices or hydrogels (e.g., the ophthalmic gel), where the use of an aqueous medium directly mimics the initial stages of drug dissolution and diffusion.
  • Limitations of the Proposed Method
Despite its analytical advantages, certain constraints of the proposed method must be addressed. First, the practical implementation involves a reliance on the instrument’s derivative capabilities, particularly regarding the digital sampling interval and the specific algorithms used for spectral transformation. Variations in wavelength resolution across different spectrophotometer models may necessitate a local verification of the zero-crossing point to ensure consistent results during method transfer. Second, while highly effective for the DSP-creatinine binary system, the method’s selectivity is primarily optimized for simple mixtures. In the presence of multi-component interferences or unknown degradation products with highly similar spectral profiles, the resolution of a first-order derivative may reach its limit, potentially requiring the transition to higher-order derivatives or hyphenated chromatographic techniques. It is important to note that the developed first-derivative spectrophotometric method was optimized for a fixed DSP:CRE ratio (1:2), reflecting the standard composition of commercial injectable dosage forms. A significant change in the relative concentration of creatinine or the introduction of different excipients (with highly similar spectral profiles) might alter the spectral overlap, potentially necessitating a re-evaluation of the zero-crossing wavelength. This reliance on a fixed ratio represents a limitation of the current study, and future research should focus on assessing the method’s robustness across wider concentration ranges and diverse pharmaceutical matrices to ensure its broader applicability.

5. Conclusions

The recovery of dexamethasone sodium phosphate from pharmaceutical formulations was evaluated using the first-derivative (D1) method to mitigate the impact of the excipient matrix. Due to the substantial spectral overlap between DSP and creatinine, zero-order (D0) measurements yield overestimated results. By applying the D1 method at the creatinine zero-crossing point, accurate recoveries were obtained, demonstrating the method’s high accuracy and lack of bias.
By measuring the D1 amplitude at the zero-crossing point of creatinine (231.325 nm), the influence of the excipient was mathematically suppressed, allowing for the accurate quantification of DSP even in complex multi-component mixtures, consistent with the previous findings in the literature.
The proposed first-derivative spectrophotometric method successfully resolved the spectral interference of creatinine in the determination of DSP. The method is simple, rapid, and does not require complex separation techniques or organic solvents. It provides a cost-effective and eco-friendly alternative to HPLC for the routine analysis of DSP in injectable dosage forms.
The novelty of this research is the introduction of a computational framework that circumvents instrumental resolution limitations. Specifically, the method provides a robust solution for intercepting the exact zero-crossing wavelength through mathematical interpolation, ensuring analytical reliability even when the spectrophotometer lacks the hardware capability to select the precise theoretical coordinates.
Consequently, the implementation of first-derivative spectrophotometry is recommended for routine quality control, providing a robust analytical tool that ensures the accurate quantification of dexamethasone without the need for prior chemical separation.
In conclusion, the proposed method provides a rapid and “green” alternative for the routine quality control of standard DSP injections. While the method is highly reliable for the ~1:2 DSP:CRE ratio found in common commercial products, its performance in formulations with significantly different ratios remains a subject for further investigation. Future studies will aim to enhance the method’s versatility by exploring its application to a wider variety of pharmaceutical dosage forms and multi-component systems.

Author Contributions

Conceptualization, D.-M.A.; methodology, D.-M.A.; software, D.-M.A.; validation, D.-M.A., A.-M.C. and D.-L.B.; formal analysis, D.-M.A.; data curation, D.-M.A. and A.-M.C.; writing—original draft preparation, D.-M.A.; writing—review and editing, A.-M.C. and G.T.A.B.-D.; visualization, M.B.M.Z.; supervision, G.T.A.B.-D. All authors have read and agreed to the published version of the manuscript.

Funding

This research received no external funding.

Institutional Review Board Statement

Not applicable.

Informed Consent Statement

Not applicable.

Data Availability Statement

The data presented in this study are available on request from the corresponding author.

Acknowledgments

During the preparation of this manuscript, the authors used the Gemini AI version 3 Flash to perform the numerical processing of amplitudes recorded at the two primary wavelengths and to calculate the resultant amplitude at the zero-crossing point (λZC) through linear interpolation. Gemini Nano Banana Pro was used to generate diagnostic figures: Figure 2 (using raw experimental data: Figure A1a,b), Figure A2 and Figure A3 (using raw experimental data: Table 4), and Figure 3 and Figure 4 (using literature data, References [20,21,22]) as the foundational input for these visualizations. The authors have reviewed and edited the output and take full responsibility for the content of this publication.

Conflicts of Interest

The authors declare no conflicts of interest.

Abbreviations

The following abbreviations are used in this manuscript:
CRECreatinine
DSPDexamethasone Sodium Phosphate
D0Zero-order spectrophotometry
D1First-order derivative
1DDFirst-derivative ratio spectra
EPEuropean Pharmacopoeia
ICHInternational Council for Harmonisation
HPLCHigh-Performance Liquid Chromatography
LODLimit of detection
LOQLimit of Quantification
PLSPartial Least-Squares
THFTetrahydrofuran
ZCPZero-Crossing Point

Appendix A

Figure A1. (a) Zero-order (D0) profiles of DSP standard (10 μg/mL, green line), CRE standard (20 μg/mL, black line), and standard mixture DSP (10 μg/mL) + CRE (20 μg/mL, red line); (b) First-order (D1) spectrophotometric profiles of DSP standard (10 μg/mL, pink line), CRE standard (20 μg/mL, blue line), and standard mixture DSP (10 μg/mL) + CRE (20 μg/mL, green line); λZC = 231.325 nm.
Appliedchem 06 00023 g0a1
Figure A2. First-order derivative (D1) calibration curve for DSP in matrix-matched standards (DSP:CRE 1:2 mass ratio) at the creatinine zero-crossing wavelength (λ = 231.325 nm).
Appliedchem 06 00023 g0a2
Figure A3. Residual plot for the linear regression analysis of DSP first-order derivative (D1) amplitudes (4–16 μg/mL) at the zero-crossing wavelength (λ = 231.325 nm). The points represent the deviation of experimental first-derivative amplitudes from the theoretical values predicted by the calibration model. The random distribution of residuals confirms the appropriateness of the linear regression for the concentration range.
Appliedchem 06 00023 g0a3

References

  1. Buga, I.; Uzoma, J.I.; Reindel, K.; Rashid, K.; Diep, T.; McCartan, P.; Zhao, F. Physical and Chemical Stability of Dexamethasone Sodium Phosphate in Intravenous Admixtures Used to Prevent Chemotherapy-Induced Nausea and Vomiting. Hosp. Pharm. 2021, 56, 215–220. [Google Scholar] [CrossRef]
  2. Johnson, D.B.; Lopez, M.J.; Kelley, B. Dexamethasone. In StatPearls [Internet]; StatPearls Publishing: Treasure Island, FL, USA, 2023. Available online: https://www.ncbi.nlm.nih.gov/books/NBK482130/ (accessed on 15 January 2026).
  3. Pereira, J.; Leão, A.; Araújo, L.; Gonçalves, N.; Martins, G. High serum creatinine after intravenous dexamethasone administration. Rev. Med. Lab. 2022, 3, 85–86. [Google Scholar] [CrossRef]
  4. Darby, D.; So, J.; Russell, J.; Monaghan, P.J. Spuriously raised serum creatinine associated with an excipient present in an intravenous dexamethasone formulation. Ann. Clin. Biochem. 2012, 49, 292–294. [Google Scholar] [CrossRef]
  5. Collado, M.S.; Robles, J.C.; De Zan, M.; Cámara, M.S.; Mantovani, V.E.; Goicoechea, H.C. Determination of dexamethasone and two excipients (creatinine and propylparaben) in injections by using UV-spectroscopy and multivariate calibrations. Int. J. Pharm. 2001, 229, 205–211. [Google Scholar] [CrossRef] [PubMed]
  6. Magdy, R.; Hemdan, A.; Fares, N.; Farouk, M. Simultaneous spectrophotometric determination of drugs lacking peak maxima in their zero-order profiles by graphical or statistical representation of data. Eur. J. Chem. 2018, 9, 194–201. [Google Scholar] [CrossRef]
  7. Üçer, A.; Başaran, N.; Dinç, E.; Üstündağ, Ö. Zero-order and first-derivative spectrophotometry for the determination of spironolactone in pharmaceutical tablets. J. Fac. Pharm. Ank. Univ. 2025, 49, 672–680. [Google Scholar] [CrossRef]
  8. Mabrouk, M.; Hammad, S.; Soliman, B.; Kamal, A. Analysis of counterfeit sildenafil by validated UV spectrophotometric methods. J. Adv. Med. Pharm. Res. 2021, 2, 52–59. [Google Scholar] [CrossRef]
  9. Gheorghiu, O.R.C.; Ciobanu, A.M.; Guțu, C.M.; Chițescu, C.L.; Costea, G.V.; Anghel, D.M.; Vlasceanu, A.M.; Baconi, D.L. Determination of Phosphodiesterase Type-5 Inhibitors (PDE-5) in Dietary Supplements. Molecules 2023, 28, 4116. [Google Scholar] [CrossRef]
  10. Sattar, O.I.A.; Abuseada, H.H.M.; Ramzy, S.; Abuelwafa, M.M. Three spectrophotometric quantitative analysis of bisoprolol fumarate and telmisartan in fixed-dose combination utilizing ratio spectra manipulation methods. Sci. Rep. 2024, 14, 22899. [Google Scholar] [CrossRef]
  11. Lotfy, H.M.; Hegazy, M.A.; Rezk, M.R.; Omran, Y.R. Comparative study of novel versus conventional two-wavelength spectrophotometric methods for analysis of spectrally overlapping binary mixture. Spectrochim. Acta A Mol. Biomol. Spectrosc. 2015, 148, 328–337. [Google Scholar] [CrossRef]
  12. Koba, M.; Koba, K.; Przyborowski, L. Application of UV-derivative spectrophotometry for determination of some bisphosphonates drugs in pharmaceutical formulations. Acta Pol. Pharm. 2008, 65, 289–294. [Google Scholar] [PubMed]
  13. Al-Owaidi, M.F.; Alkhafaji, S.L.; Mahood, A.M. Quantitative determination of dexamethasone sodium phosphate in bulk and pharmaceuticals at suitable pH values using the spectrophotometric method. J. Adv. Pharm. Technol. Res. 2021, 12, 378–383. [Google Scholar] [CrossRef] [PubMed]
  14. Ministerul Sănătății. Reactivi, Soluții-tampon. In Farmacopeea Română, 10th ed.; Editura Medicală: București, România, 1993; pp. 1221–1222. [Google Scholar]
  15. Karpińska, J. Derivative spectrophotometry—Recent applications and directions of developments. Talanta 2004, 64, 801–822. [Google Scholar] [CrossRef] [PubMed]
  16. Dubrovkin, J. Derivative Spectroscopy; Cambridge Scholars Publishing: Newcastle upon Tyne, UK, 2021. [Google Scholar]
  17. International Council for Harmonisation of Technical Requirements for Pharmaceuticals for Human Use. Validation of Analytical Procedures: Text and Methodology Q2(R1). 2021. Available online: https://www.ema.europa.eu/en/documents/scientific-guideline/ich-guideline-q2r1-validation-analytical-procedures-text-methodology-step-5-first-version_en.pdf (accessed on 15 January 2026).
  18. Prathyusha, V.; Devi, S.; Devi, P. Development and validation of UV-spectrophotometric method for the estimation of dexamethasone sodium phosphate in bulk and pharmaceutical dosage form. J. Pharm. Sci. Res. 2013, 13, 39–44. [Google Scholar]
  19. Werle, J.; Buresova, K.; Cepova, J.; Bjørklund, G.; Fortova, M.; Prusa, R.; Fernandez, C.; Dunovska, K.; Klapkova, E.; Kizek, R.; et al. Spectrophotometric and chromatographic analysis of creatine:creatinine crystals in urine. Spectrochim. Acta A Mol. Biomol. Spectrosc. 2024, 322, 124689. [Google Scholar] [CrossRef]
  20. Moffat, A.C.; Osselton, M.D.; Widdop, B. Clarke’s Analysis of Drugs and Poisons, 4th ed.; Pharmaceutical Press: London, UK, 2011. [Google Scholar]
  21. Dwivedi, S.D.; Singh, D.; Singh, M.R. Engineering and Optimization of Biogenic Silver Nanoparticles: A Multimodal Approach to Glucocorticoid-Based Rheumatoid Arthritis Management. BioNanoScience 2025, 15, 83. [Google Scholar] [CrossRef]
  22. Tiboni, M.; Astolfi, P.; Verboni, M.; Benedetti, S.; Giorgini, E.; Notarstefano, V.; Vita, F.; Ranieri, S.; Duranti, A.; Lucarini, S.; et al. The influence of mannose-based esters on the mesophase behaviour of lyotropic liquid crystalline nanosystems as drug delivery vectors. Colloids Surf. B Biointerfaces 2023, 232, 113596. [Google Scholar] [CrossRef]
  23. Al-Janabi, K.; Mahmood, A.; Luaibi, H. Development of a simple colorimetric determination of dexamethasone. Int. J. Drug Deliv. Technol. 2020, 10, 255–258. [Google Scholar] [CrossRef]
  24. Ahmed, M.; Patil, L.M.P.; Shetty, S.A.; Kumar, S.M. Development and validation of UV spectrophotometric methods for the simultaneous estimation of dexamethasone and neomycin sulphate in bulk drug and pharmaceutical formulations. Int. J. Pharm. Anal. Res. 2020, 9, 115–123. [Google Scholar]
  25. Lotfy, H.; Saleh, S.; Elgizawy, S.; Hassan, N. A comparative study of the novel ratio difference method versus conventional spectrophotometric techniques for the analysis of binary mixture with overlapped spectra. Am. J. Anal. Chem. 2012, 3, 761–769. [Google Scholar] [CrossRef]
  26. Akshatha, K.; Babu, J.; Sversuta, R.A. Analytical method development and validation of dexamethasone: Review. World J. Pharm. Res. 2019, 8, 540–554. [Google Scholar]
  27. European Directorate for the Quality of Medicines & HealthCare. Dexamethasone sodium phosphate (Monograph 0549). In European Pharmacopoeia, 12th ed.; Council of Europe: Strasbourg, France, 2026. [Google Scholar]
Figure 1. Stacked zero-order UV spectra of 40 μg/mL DSP in distilled water (black line) and phosphate buffer pH 6.0 (red line).
Appliedchem 06 00023 g001
Figure 2. Zero-order (D0) and first-order (D1) spectrophotometric profiles of DSP standard (10 μg/mL), CRE standard (20 μg/mL), and standard mixture DSP (10 μg/mL) + CRE (20 μg/mL); λZC = 231.325 nm. The vertical dashed line indicates the zero-crossing point for creatinine on the x-axis, corresponding to the wavelength used for DSP amplitude measurement (diagnostic figure generated with Gemini Nano Banana Pro based on raw data in Appendix A).
Appliedchem 06 00023 g002
Figure 3. Energy level diagram illustrating the hypsochromic shift and ground-state stabilization in the DSP-CRE mixture (figure generated with Gemini Nano Banana Pro based on raw data of the study).
Appliedchem 06 00023 g003
Figure 4. Spectroscopic characterization of the intermolecular interaction and electronic stabilization in DSP-CRE complex (figure generated with Gemini Nano Banana Pro based on raw data of the study and literature [20,21,22]).
Appliedchem 06 00023 g004
Table 1. Calibration curve preparation protocol (D1 spectrophotometric method, 2–16 μg/mL).
PointS1 Volume (Vi, mL)Final Volume (Vf, mL)DSP Conc. (μg/mL)CRE Conc. (μg/mL)
L11.010.02.04.0
L22.010.04.08.0
L33.010.06.012.0
L44.010.08.016.0
L55.010.010.020.0
L66.010.012.024.0
L77.010.014.028.0
L88.010.016.032.0
Table 2. Linearity parameters of the proposed D1 spectrophotometric method.
ParameterUnitValue/Formula
Linearity rangeμg/mL4–16 DSP (in matrix-matched standards DSP:CRE, 1:2 mass ratio)
Regression equation-y = 0.217179x − 0.792000
Slope (m)mL/μgΔy/Δx = 0.217179
Intercept (n)-y (for x = 0) = −0.792000
Correlation coefficient (R2)-0.9914 (R2 ≥ 0.99)
Limit of Detection (LOD)μg/mL3.3 σ/m = 1.4514
Limit of Quantification (LOQ)μg/mL10 σ/m = 4.3982
Disclaimer/Publisher’s Note: The statements, opinions and data contained in all publications are solely those of the individual author(s) and contributor(s) and not of MDPI and/or the editor(s). MDPI and/or the editor(s) disclaim responsibility for any injury to people or property resulting from any ideas, methods, instructions or products referred to in the content.