Article

Kinetic Modeling, Comparative Investigations, and a New Approach to Quantifying the Global Extraction Yield of Algerian Pomegranate Peel Phenolic Compounds

1
Laboratory of Biomaterials and Transport Phenomena (LBMPT), Medea University, Medea 26000, Algeria
2
Laboratory of Research on Bio-Active Products and Valorization of Biomass, Higher Normal School, Old-Kouba, Algiers 16050, Algeria
3
Laboratoire d’Analyse Organique Fonctionnelle, Faculté de Chimie, USTHB, B.P. 32, El Alia, Bab Ezzouar, Alger 16111, Algeria
4
Ecole Nationale Supérieure de Chimie de Rennes, University Rennes, CNRS, ISCR—UMR6226, F-35000 Rennes, France
5
Laboratoire de Gestion et Valorisation des Ressources Naturelles et Assurance Qualité, Faculté SNVST, Université de Bouira, Bouira 10000, Algeria
*
Author to whom correspondence should be addressed.
AppliedChem 2025, 5(2), 11; https://doi.org/10.3390/appliedchem5020011
Submission received: 29 March 2025 / Revised: 13 May 2025 / Accepted: 27 May 2025 / Published: 28 May 2025

Abstract

:
The aim of this study was to quantify the total extraction yield (GEY) of polyphenols from pomegranate peels using a solid–liquid extraction process without evaporation but with UV-Vis spectrophotometry. Extraction kinetics models were tested to evaluate the extract yield (GEY), total phenolic compounds (TPCs), total flavonoids (TFCs), and condensed tannins (CTCs). The results showed maximum values of 45% for GEY, 97.560 mg EAG/g db for TPC, 4.416 mg EQ/g db for TFC, and 0.412 mg EC/g db for CTC, obtained with a methanol/water mixture (75/25, v/v) for 24 h. Spectrophotometry proved to be a reliable method for quantifying the total extraction yield, with a correlation of 99.79% compared to the conventional method. The second-order kinetic model accurately described the mass transfer mechanisms of the bioactive compounds studied. This study provides important insights into the mass transfer mechanisms during the extraction of bioactive compounds, facilitating the design, optimization, and control of large-scale processes for the recovery of pomegranate waste.

1. Introduction

Phenolic compounds are important secondary metabolites produced by plants [1], with over 10,000 different types found in different plant species worldwide [2]. These compounds are present in a wide range of plant foods, including fruits, vegetables, and grains. Phenolic compounds are biosynthetically derived from two primary pathways: the shikimate pathway and the acetate pathway. Based on their structural characteristics, they can be divided into several subgroups, the most important being phenolic acids, flavonoids, and tannins. Each subgroup is defined by the arrangement of the benzene rings and the presence of hydroxyl groups [3]. Phenolic acids typically have a simple structure consisting of a single benzene ring attached to a carboxylic acid group. This structure allows phenolic acids to perform various functions in plants, such as protecting them from pests and diseases [4,5]. Flavonoids, on the other hand, have a more complex structure.
They generally have multiple benzene rings and can be divided into subgroups such as flavonols, flavones, and isoflavones [6]. The structural diversity of these compounds contributes to a wide range of functions, including antioxidant activity and potential benefits for human health [7]. Tannins, another subgroup, are characterized by larger and more complex structures, often consisting of several linked phenolic units [8]. Known for their ability to bind proteins, tannins serve as a natural defense mechanism for plants against herbivores [9].
The pomegranate (Punica granatum L.) is a fruit known for its many health benefits. It is commonly eaten fresh or in juice form. Research shows that pomegranates and their peel have powerful antioxidant properties. These properties can help reduce blood lipid and cholesterol levels and lower blood pressure, making pomegranates a valuable dietary component in the management of hypertension [10]. In addition, pomegranates have anti-inflammatory properties that can reduce the inflammation associated with chronic diseases [11,12]. These health benefits are largely attributed to its rich content of phytochemicals, particularly polyphenols such as hydrolysable tannins and anthocyanins, underlying their importance as part of a healthy diet [13,14].
There are many important steps in the process of obtaining bioactive compounds. First, the solvent is carefully mixed with the finely ground solid material, allowing the solvent to effectively penetrate the matrix of the sample. As this happens, the dissolved substances gradually migrate into the solvent, enriching the solution with the desired components. It is vital that each stage of this complex process is carefully monitored, as it has a major impact on the final quality of the extraction [15]. In addition, the interplay between several factors contributes significantly to improving the transport and solubility of the mass within the sample. Factors such as temperature control, stirring efficiency, and the selection of an appropriate solvent all play a vital role in accelerating the extraction process and ensuring the maximum yield of bioactive compounds [16]. By optimizing these elements, the overall efficiency of the extraction process is maximized, resulting in the more potent and concentrated extraction of bioactive compounds from the sample material [17].
Among the various extraction methods used to recover polyphenols from organic materials, solid–liquid extraction, microwave-assisted extraction, pressurized liquid extraction, ultrasonic extraction, electric field-assisted extraction, and supercritical fluid extraction can be mentioned [18].
Solid–liquid extraction is the most popular extraction technique, using solvents such as ethanol, methanol, acetone, and their mixtures with water, which are known for their high extraction efficiency in recovering a variety of polyphenols with different structures and for being less costly than other methods [19]. In addition to a thorough understanding of the underlying mechanisms and how operating conditions affect extraction yield, duration, and extract quality, this method offers reasonable extraction rates and yields by optimizing process conditions [20].
Maceration is a valuable extraction method that can yield a wide range of phytochemicals, which are essential bioactive compounds found in plants. These phytochemicals include polyphenols, flavonoids, alkaloids, tannins, coumarins, terpenoids, polypeptides, glycosides, steroids, quinones, and saponins [21]. The choice of solvent in the maceration process plays a crucial role in determining the specific bioactive components extracted from the plant materials. For example, the use of ethanol as a solvent can result in the extraction of glycosides, alkaloids, glycosides, and carbohydrates. On the other hand, water as a solvent can yield terpenoids, alkaloids, glycosides, and carbohydrates. Meanwhile, methanol extraction is known to yield phenolic compounds, flavonoids, tannins, glycosides, and amino acids [22].
Kinetic modeling, which is a critical tool in the extraction of phenolic compounds, serves as an invaluable resource that enhances our understanding of the underlying extraction mechanisms, especially during the scale-up process for industrial applications. By delving into the complexities of the extraction process, kinetic modeling not only improves our understanding but also paves the way for more efficient design strategies in the future. This, in turn, leads to significant benefits such as energy savings, reduced processing times, and the minimized use of chemical reagents. The application of kinetic modeling to extraction processes is essential for optimizing operational efficiency and ensuring sustainable practices in various industries. Through the meticulous analysis of extraction kinetics, researchers and engineers can fine-tune extraction parameters, predict results with greater accuracy, and ultimately improve the overall performance of the extraction process [23,24,25].
The solid–liquid extraction process operates in a way that can be thought of as the opposite of how adsorption works [26]. In adsorption, materials adhere to a solid surface, while in solid–liquid extraction, substances move from a solid into a liquid. This fundamental difference means we can use the same mathematical frameworks that apply to adsorption when analyzing solid–liquid extraction [27,28,29]. This means we can study the extraction process using equations that describe how quickly substances are adsorbed, which helps us to understand how long the extraction takes and how saturation levels are reached. In particular, the second-order rate law stands out as a useful tool. It allows us to measure both the rate at which extraction occurs and the concentration at which the process stabilizes. This law has been found to be a good fit for the solid–liquid extraction process, making it a reliable model for evaluating how effective extraction is under various conditions [23,30,31].
The current research has identified six different types of linear forms that relate to the PSO (pseudo-second-order) kinetic model. Each of these types has unique characteristics and applications. However, among these six types, Type 5 and Type 6 have been cited less frequently in scholarly work. Types 1 to 4 often demonstrate better fit scores, leading researchers to prefer them over the less frequently used Types 5 and 6 [32,33,34].
The quantification of chemical compounds using UV and visible light is a common practice in scientific analysis. Phenolic compounds, known for their distinctive biochemical and molecular properties, are particularly well suited for quantification by UV–visible light methods [35], primarily due to the phenolic ring’s unique ability to absorb UV light, making it an ideal target for such analysis. In addition, the presence of colored phenolic compounds, such as red anthocyanins and yellow flavonols, allows the use of visible light to provide valuable information during quantification [36,37]. The use of UV and visible light for the quantification of phenolic compounds provides a comprehensive and reliable approach that has been extensively used in various scientific fields. By exploiting the unique absorption behavior of phenolic compounds in response to different wavelengths of light, researchers can gain valuable insight into the chemical composition and concentration of these compounds with precision and accuracy [35,38].
In this study, our goal was to apply a new method for measuring the overall extraction yield of phenolic compounds. We used solvent solid–liquid extraction combined with a spectrophotometry technique, which does not involve any evaporation of the solvent. This approach allows for a more direct measurement of the compounds in question. The results obtained from this new method were then compared to those generated by the conventional extraction calculation to determine the effectiveness and accuracy of our new procedure in quantifying phenolic compounds. On the other hand, we aimed to assess the kinetic study extraction process of the global extraction yield (GEY), total phenolic compounds (TPCs), total flavonoids compounds (TFCs), and condensed tannins compounds (CTCs) extracted from Algerian pomegranate (Punica granatum L.) fruit peels and to test the suitability of the kinetic model for GEY, TPC, TFC, and CTC compared to different models to understand the mass transfer mechanism involved in this bioactive compounds’ extraction process.

2. Materials and Methods

2.1. Materials

To estimate the absorption edge of the extracted sample, UV–visible diffuse absorption measurements were performed using a spectrophotometer SHIMADZU UV-1800, (Kyoto, Japan). Evaporation was performed using a BUCHI Rotavapor R-300 (BÜCHI, Flawil, Switzerland). Reagents and chemicals used in this study included gallic acid (≥99%), quercetin (≥95%), catechin (≥98%), Folin–Ciocalteu (2N); methanol (HPLC grade, 99.9%), vanillin (99%), sodium hydroxide reagent grade (NaOH, ≥98%), aluminum chloride (AlCl3-6H2O, 99%), and sodium nitrite ACS reagent (NaNO2, ≥97.0%), which were purchased from Sigma-Aldrich (St. Louis, MO, USA). The hydrochloric acid ACS reagent (HCl), ACS reagent, and anhydrous sodium carbonate (NaO3, ≥99.5%) were purchased from Honeywell Fluka (Charlotte, NC, USA).

2.2. Bioactive Extraction of Pomegranate Peel

Pomegranate fruit peels were gathered from the region of Medea in Algeria. The peels were cleaned to remove dirt and impurities. They were then washed using distilled water to ensure any remaining contaminants were eliminated. The peels were cut into small pieces to facilitate the drying process. These small pieces were allowed to air-dry at room temperature (20 ± 0.5) °C up to a constant weight until they were fully dried. After, the peels were ground into a fine powder form.
The extracts were prepared by dissolving 2 g of the powder in 10 mL of solvent (methanol/water) (75/25) (v/v) with stirring continuously at room temperature (20 ± 0.5) °C for different times varying from 15 to 30 days to determine the kinetic extraction yield. Each extract was filtered using Whatman filter paper No. 1; the filtrate was centrifuged at 4500 rpm for 5 min and evaporated to dryness under a vacuum. Each time, the resulting extracts were kept in a sealed dark glass bottle and stored at −20 °C until further use.

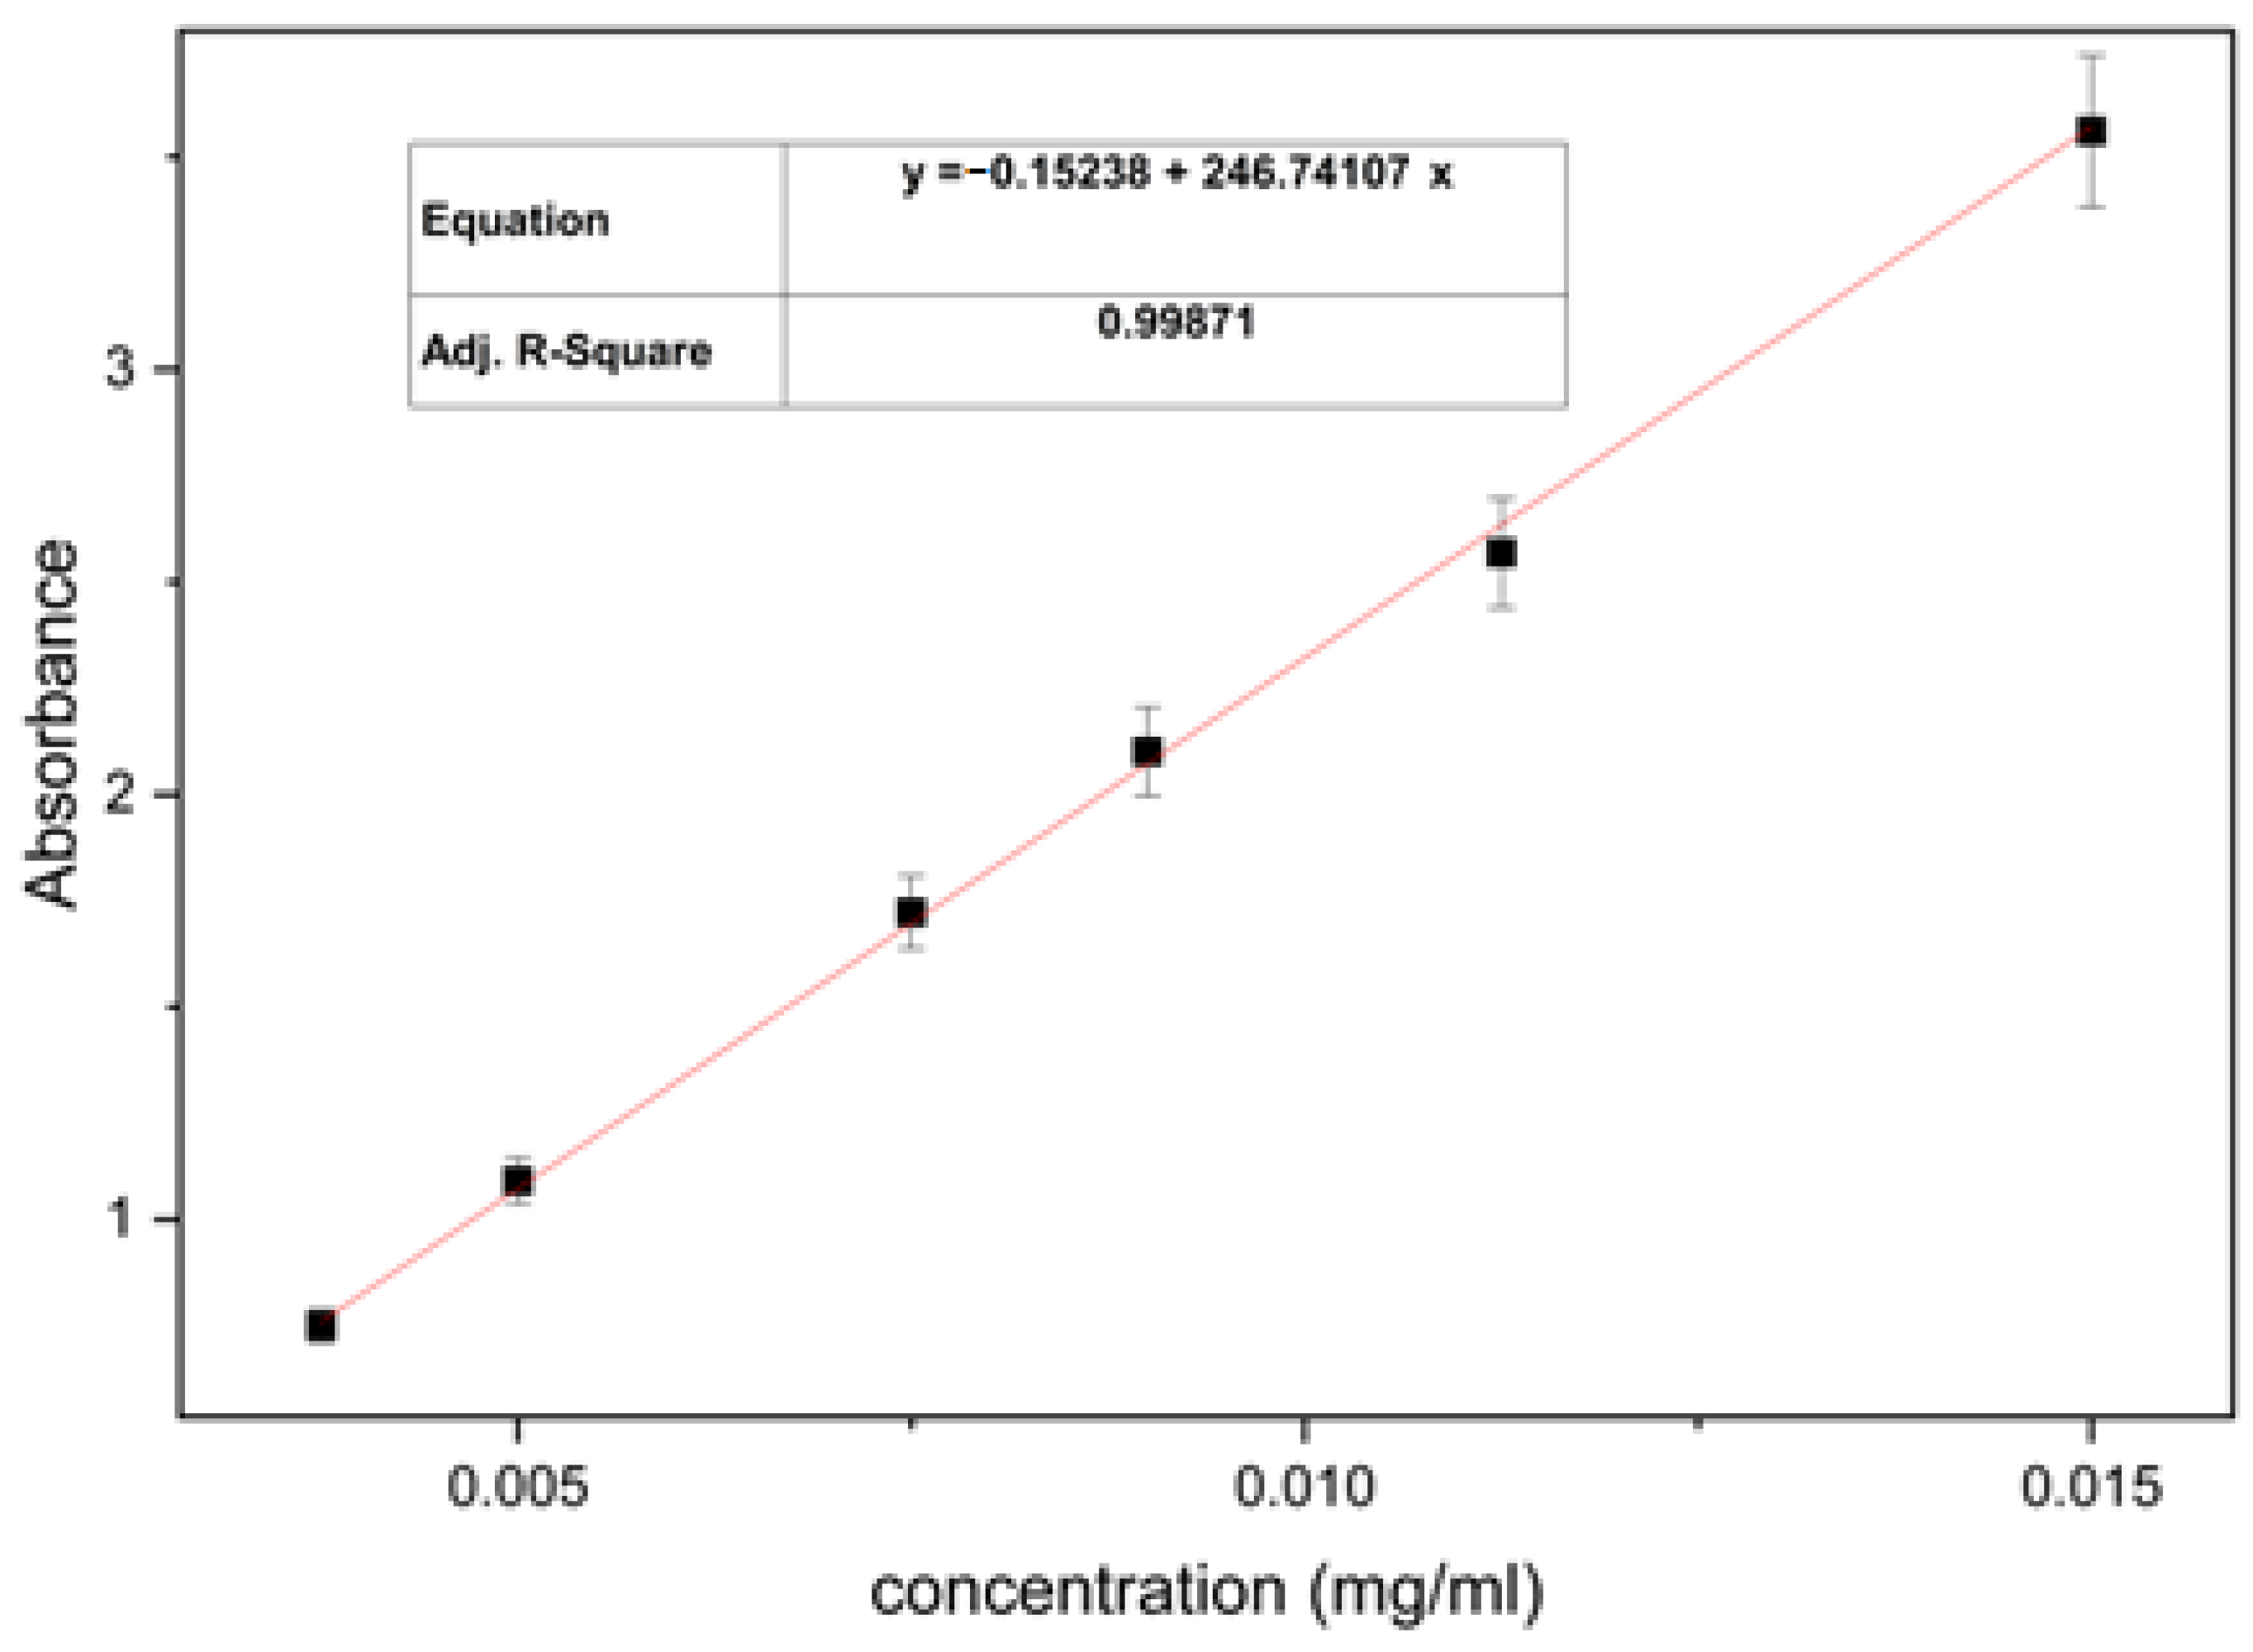
2.3. Quantification of Global Extraction Yield Without Evaporation by Spectrophotometry

The extracted sample was dissolved in 10 mL of a (methanol/water) solvent at (75/25) (v/v); then, the UV–visible diffuse absorbance of the solution was recorded in the 250 to 800 nm range to determine the characteristic peaks of the extracted sample.
To calculate the global yield of each extract, a calibration curve was performed with an optimal extract (24 h) at different concentrations, and then the absorbance was read.
To confirm the results obtained, the yield of dry extract was determined by calculating the ratio between the weight of the dry extract (powder) and the weight of the plant material used for the extraction (conventional method) according to Equation (1) and the results obtained were compared to those obtained by the new method. All measurements were performed in triplicate, and the results are presented as mean values with standard deviations.
Yield (%) = [W1/W2] × 100
  • W1: weight of sample extraction.
  • W2: initial weight of plant material.

2.4. Quantification of the Total Phenolic Compounds

The content of total phenolic compounds was determined by spectrophotometry according to the colorimetric method using the Folin–Ciocalteu reagent; this assay is based on the quantification of the total concentration of hydroxyl groups present in the extract. A volume of 200 μL of each extract was added to a mixture of 1 mL of a 2N Folin–Ciocalteu reagent, diluted 10 times with distilled water (to control its reactivity, avoid optical interferences, and ensure the accurate and linear measurement of phenolic compounds by UV-Vis spectroscopy), and 800 μL of a 7.5% sodium carbonate solution (w/v). The mixture was shaken and kept for 30 min. Then, the absorbance was read at 765 nm [39], and a calibration curve was established with gallic acid at different concentrations; all measurements were performed in triplicate, and the results were presented as mean values with standard deviations.

2.5. The Quantification of the Total Flavonoid Compounds

The quantification of the total flavonoids contained in the extract was calculated by referring to a calibration from a curve obtained using quercetin as a standard. The quantification of TFC was carried out according to a method based on the formation of a very stable complex between aluminum chloride and the oxygen atoms present on carbons 4 and 5 of the flavonoids [40]. A volume of 400 µL of the extract was added to 120 µL of the 5% NaNO2 (w/v) solution. After 5 min, 120 µL of an AlCl3 aqueous solution at 10% (w/v) was added, and the medium was thoroughly mixed. After 6 min, a volume of 800 µL NaOH (1M) was added in the center. The absorbance was read immediately at 510 nm against a blank. A quercetin standard solution was prepared, and daughter solutions, prepared from the stock solution at different concentrations between 0 and 1000 µg/mL, allowed the calibration curve to be traced; all measurements were performed in triplicate, and the results were presented as mean values with standard deviations.

2.6. Quantification of Condensed Tannin Compounds

The content of condensed tannins was determined by the vanillin method described by Julkunen. A volume of 50 μL of each extract was added to 1500 μL of the vanillin in a methanol/water, 80/20 (v/v) solution at 4%, and then mixed vigorously. Next, a volume of 750 μL of concentrated hydrochloric acid (HCl) was then added. The mixture obtained was left to react for 20 min at room temperature [41]. The absorbance was measured at 550 nm against a blank; different concentrations between 0 and 1000 µg/mL, prepared from a stock solution of the catechin, allowing the calibration curve to be plotted; all measurements were performed in triplicate, and results were presented as mean values with standard deviations.

2.7. Statistical Analysis

Statistical analysis of all the results was performed using one-way ANOVA followed by Tukey’s multiple comparison test. Differences were considered statistically significant at p < 0.05. All experiments were conducted in triplicate.

3. Results and Discussion

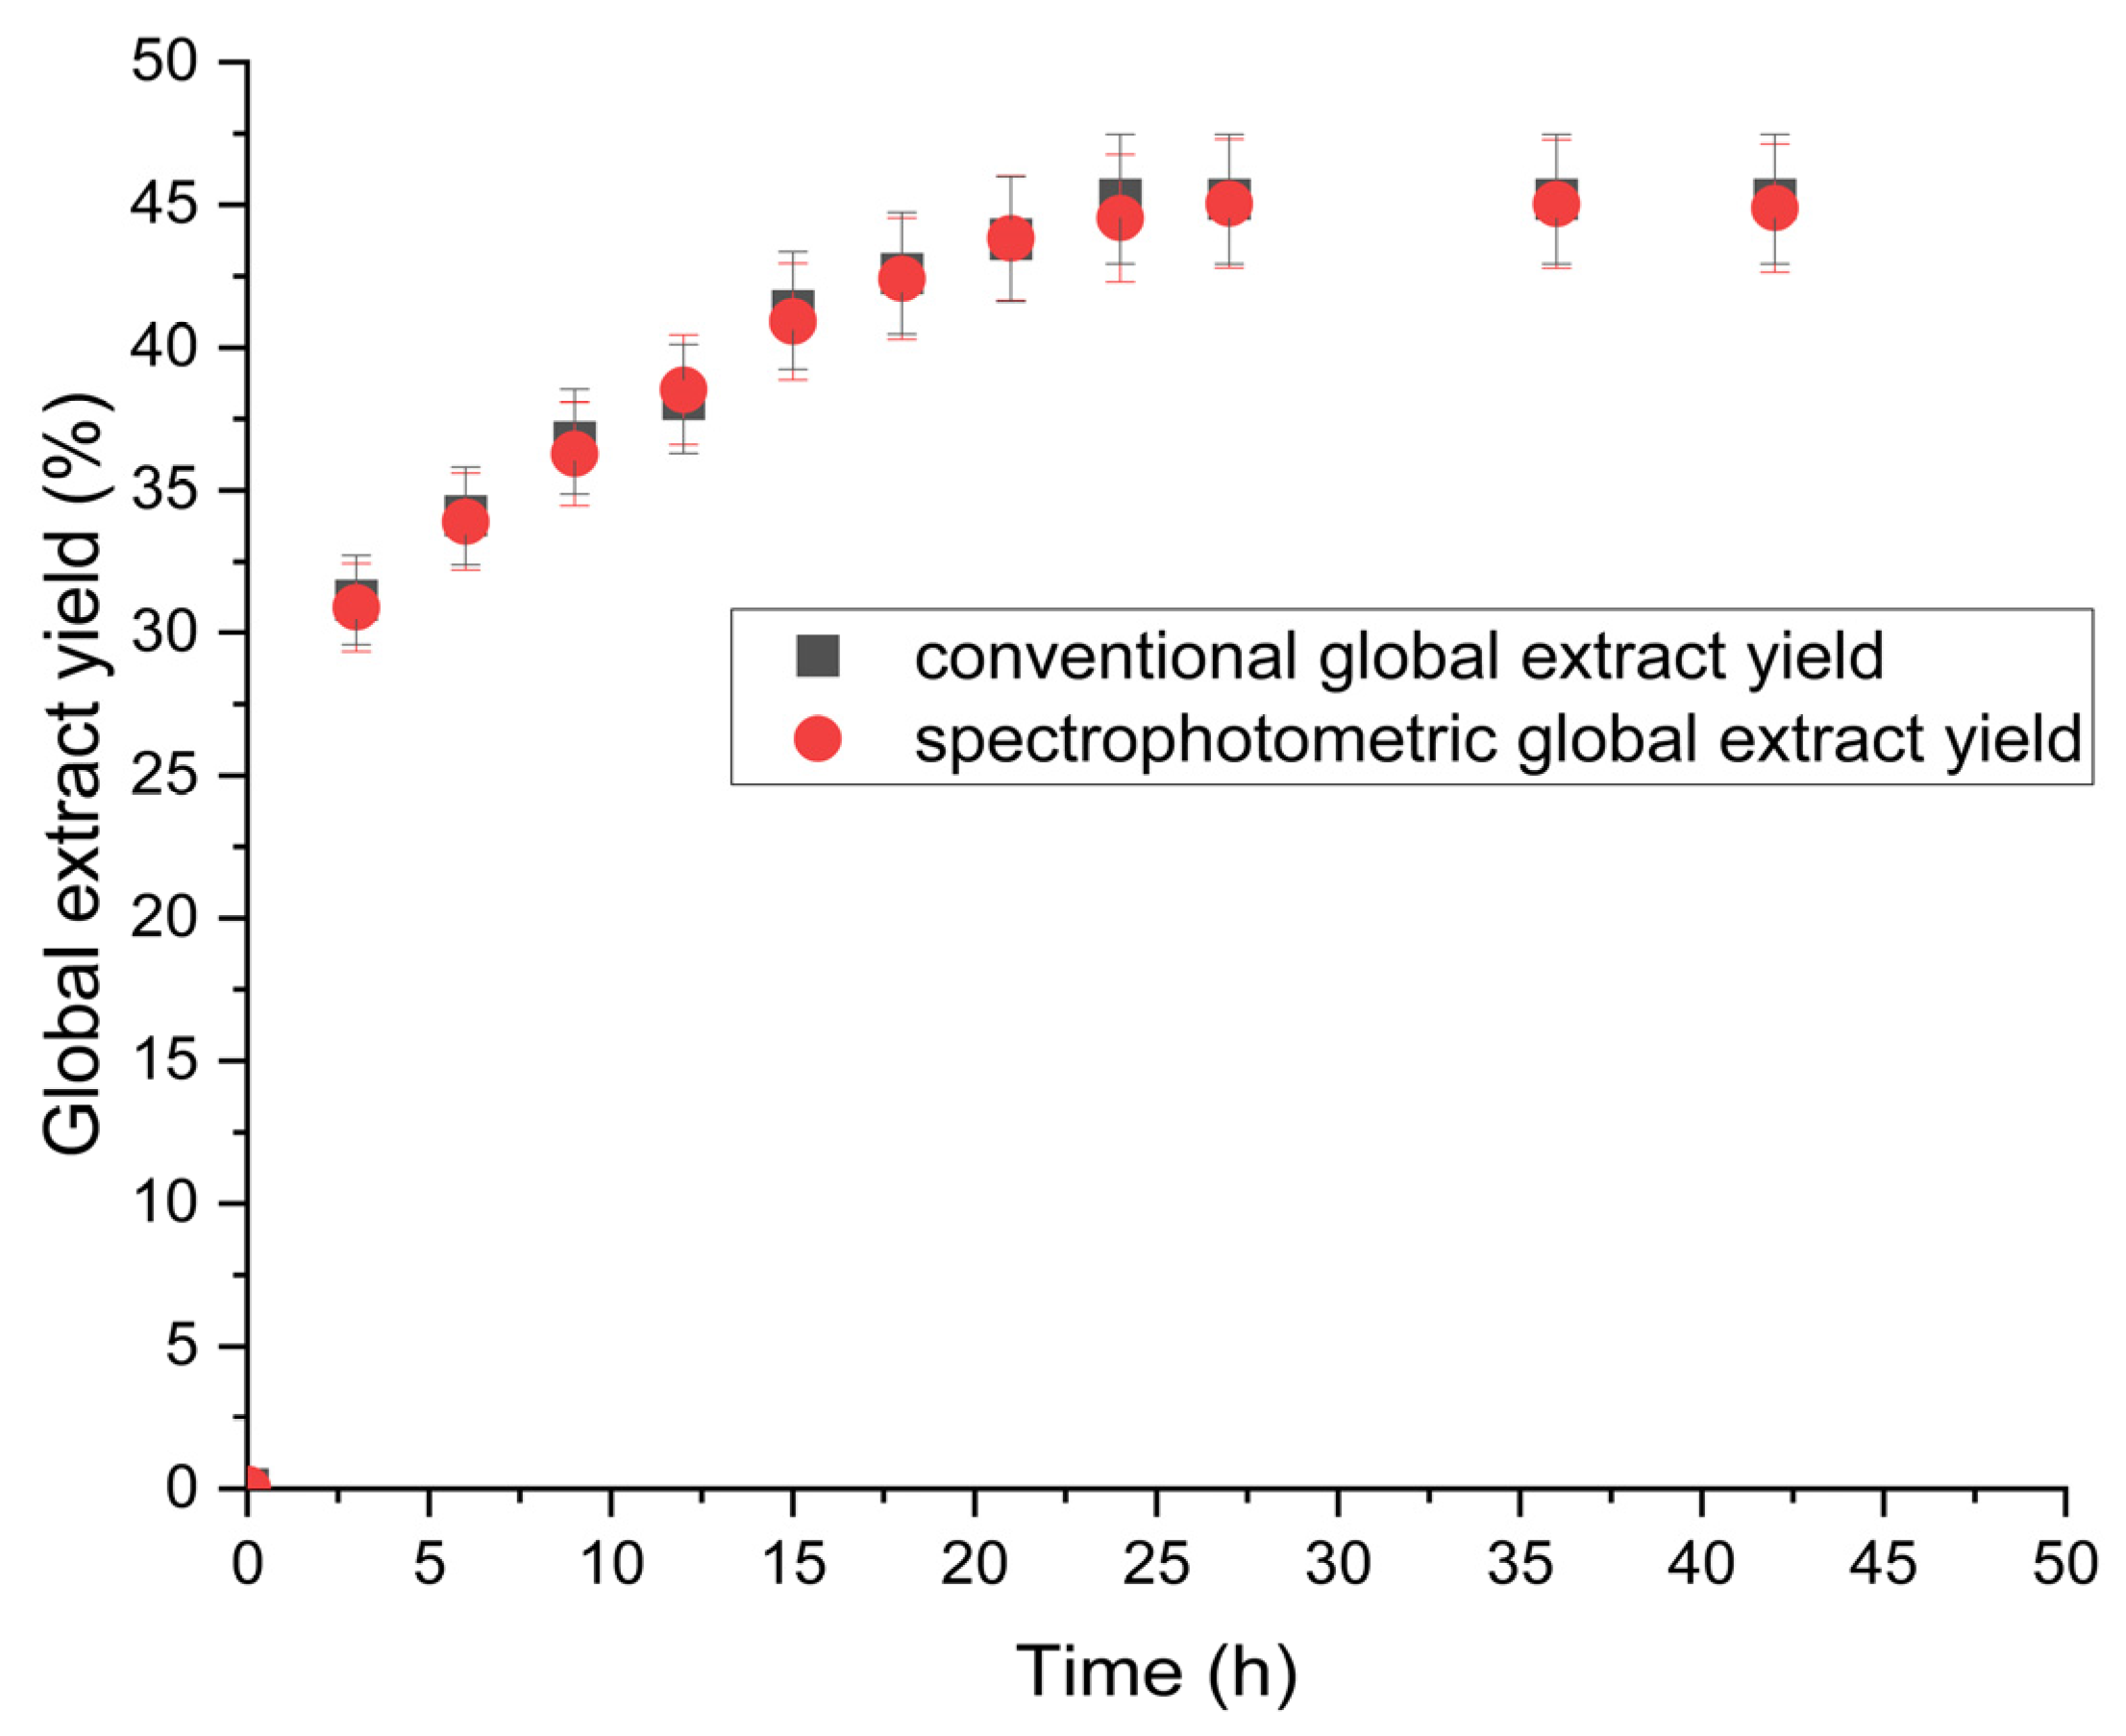
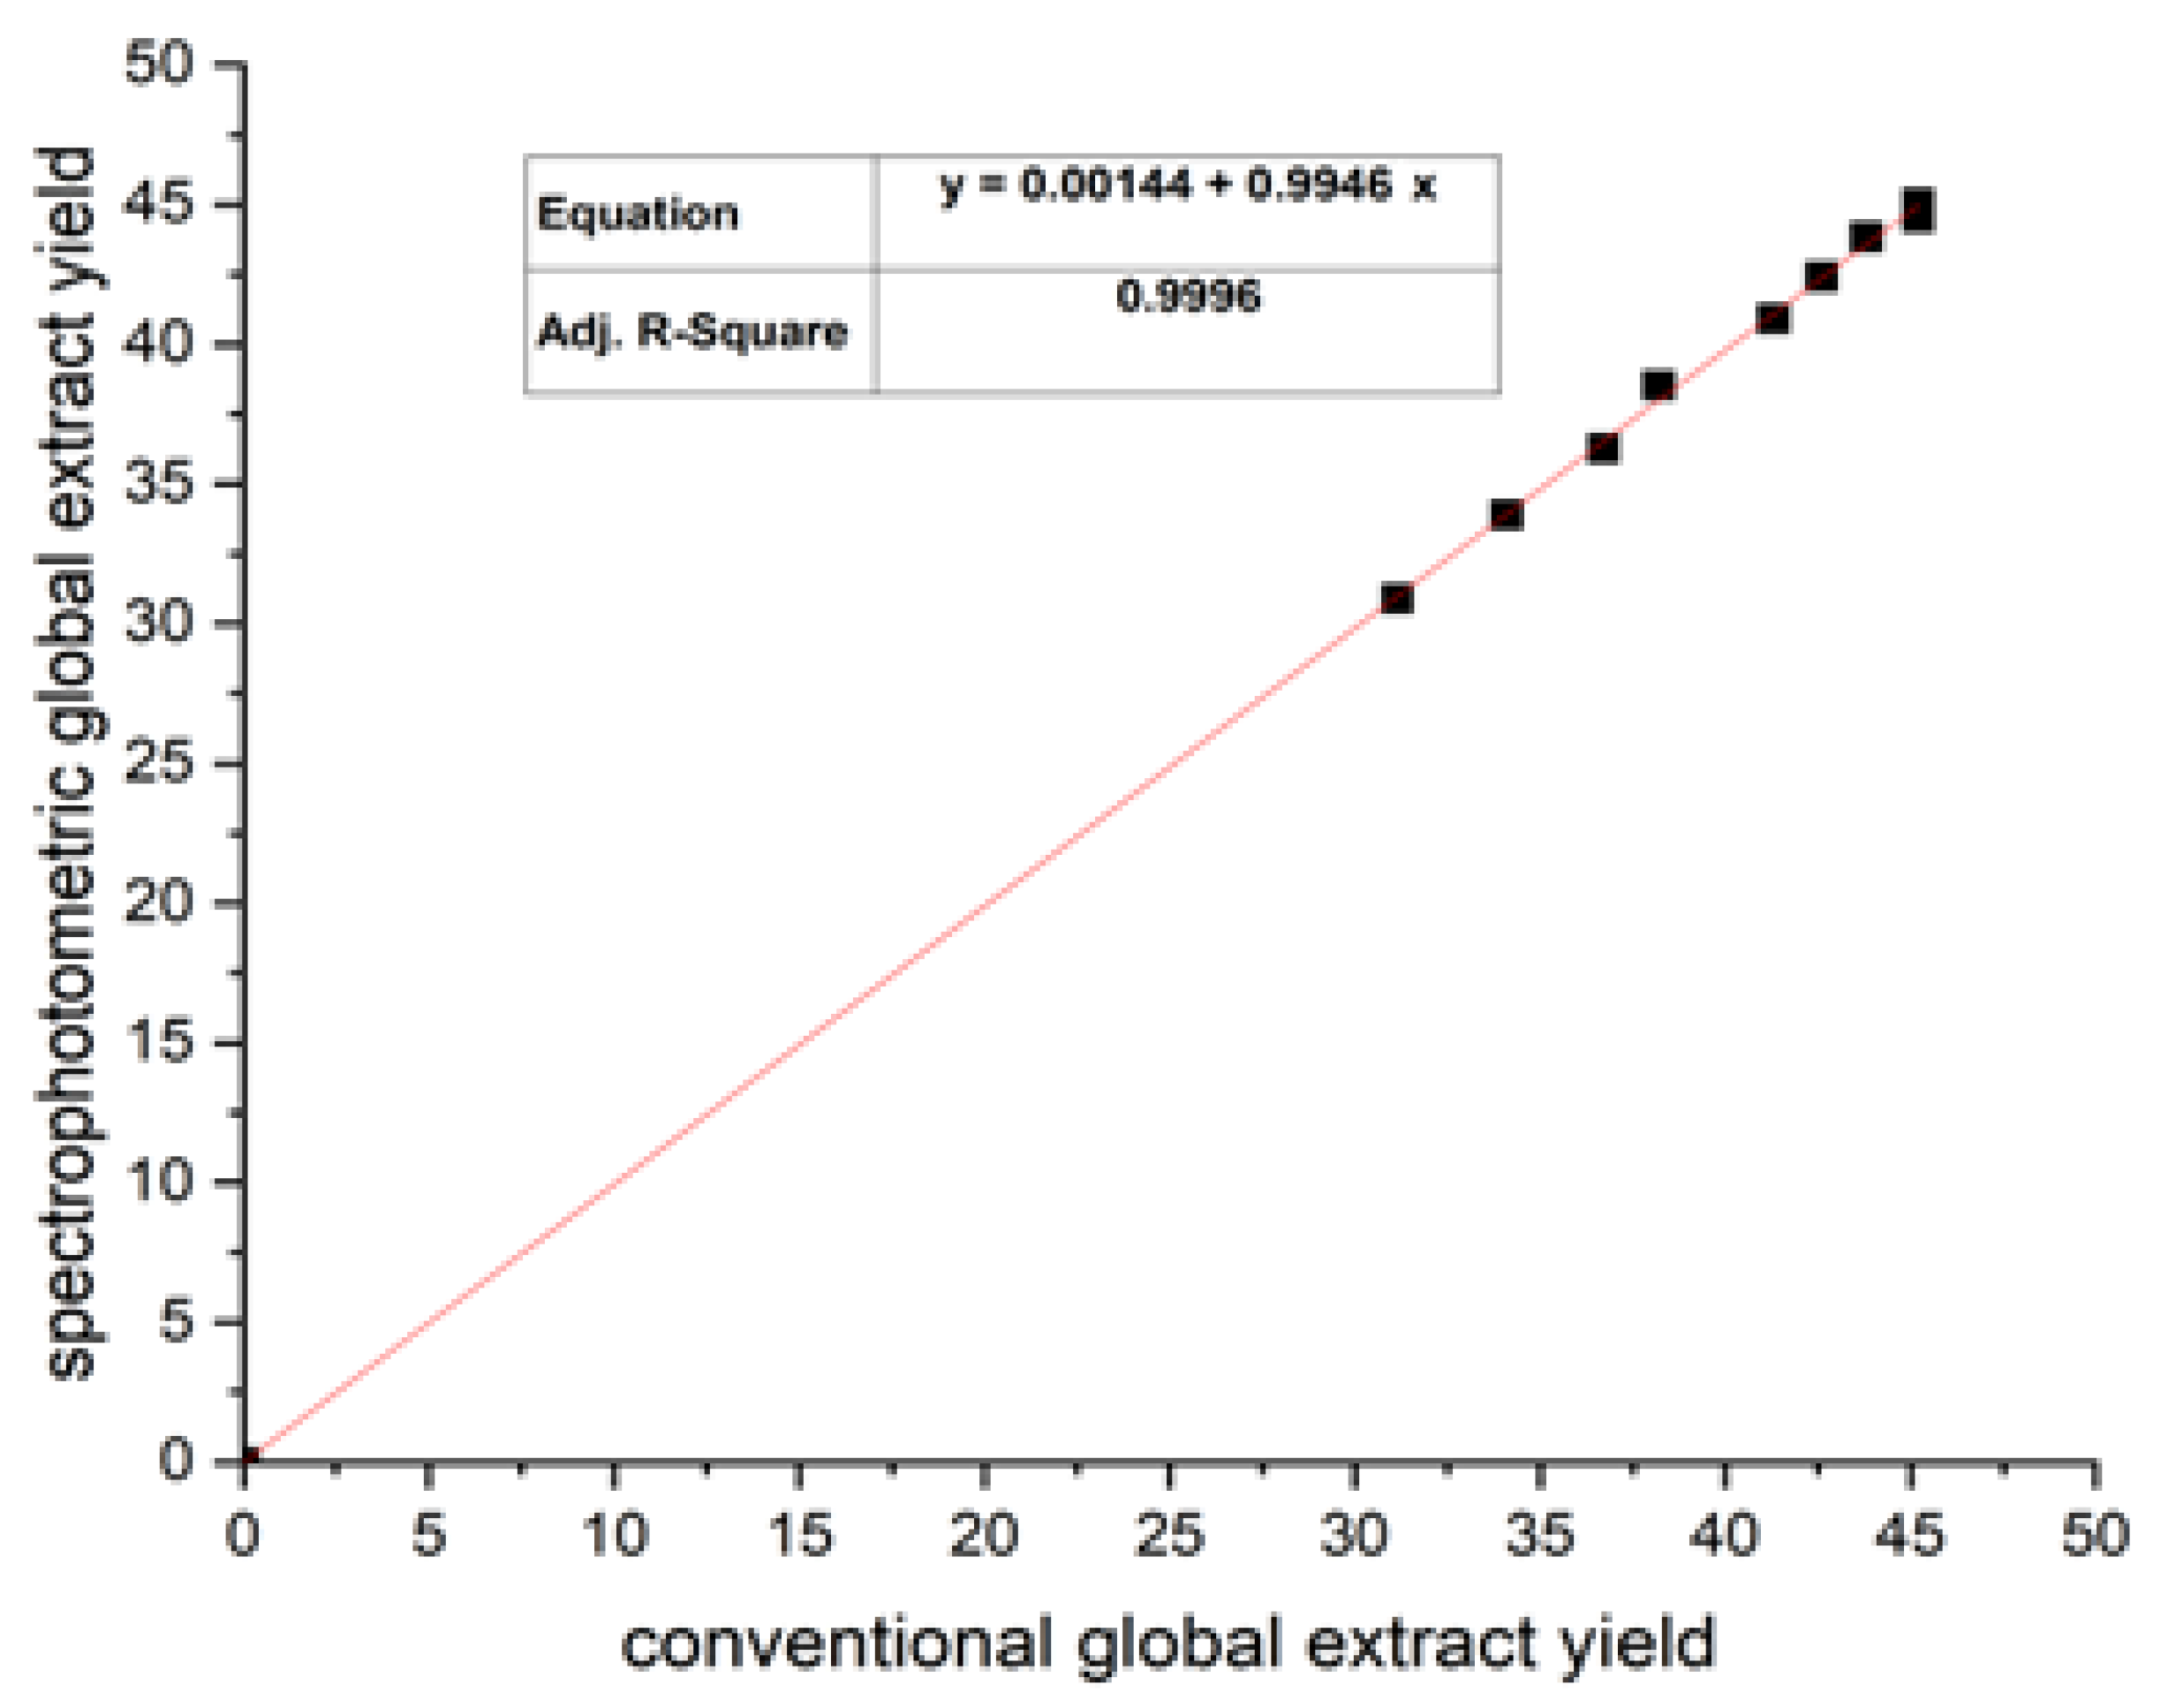
3.1. Quantification of Global Extract Yield Using the Spectrophotometry Method

The results obtained from the spectral analysis of the pomegranate peel extracts over a period of 36 h and after dilution showed that all the spectra have the same shape and contain two types of absorption, one at 365 nm and the second at 307 nm, which is the maximum absorption. At this value of the wavelength (307 nm), the absorbance of all the samples was measured; the different dilutions of the spectra enabled the calibration curve of the absorption to be plotted, as shown in Figure 1.
From the results presented, the correlation between the absorbance and concentration was more than 99%, which translates to the good linearity of the Beer–Lambert law, and this indicates that the use of the UV method is adequate to calculate the concentration of peel extract from pomegranate peel in the solvent [42]. The calibration curve of the absorbance of the peel extract at 24 h, presented in Figure 1, was used to calculate the global extraction yield at different times by measuring the absorbance at a dilution of 1:100 for each extract.
The non-evaporation extraction of bioactive compounds is a process that avoids exposing the sample to high temperatures for a prolonged period of time. This method protects the sample from the potential thermal destruction of unstable and thermally degradable compounds [43]. It is important to note that the therapeutic efficacy of medicinal plant extracts can be significantly affected by evaporation [44]. Some studies have found that the extraction process without evaporation results in lower yields and reduced levels of total polyphenols, total flavonoids, and total condensed tannins. In addition, the antioxidant activity of the extract is reduced when evaporation is used [45]. Therefore, choosing to extract without evaporation not only preserves the integrity of the bioactive compounds but also plays an important role in maintaining the overall quality and efficacy of medicinal plant extracts.
Figure 2 shows the global extraction yield of pomegranate peel at different times using spectrophotometric methods and conventional methods over time, including a methanol/water (75/25) (v/v) solvent with continuous stripping and centrifugation at 4500 rpm for five minutes.
From the curve obtained in Figure 2, the GEY values of pomegranate peels calculated by the spectrophotometric and conventional methods revealed two distinct stages of extraction for the different operating conditions studied. In the first stage, which lasted from 0 to 18 h, the increase in extract yield was rapid. This indicates that during the early hours of the process, the extraction of the material was fast and efficient. After the initial 18 h, the extraction process showed a slower, more gradual increase in yield. The yield increased rapidly over time during the first 18 h to 42.6% at 18 h and then tended to stay at a constant value after the maximum extraction yield of 45.2% at 24 h; these results were approximately similar to those obtained by Zaki et al. where the yield was 48.2% at 24 h [7].
Other studies have shown that the methanolic extract represents the global yield ranging from 31.5 to 48.2% [7,46,47]. However, other work used an extraction process with methanol/water (50:50 v/v) for 48 h and found a value of 18.9% for the global extract yield [48]. The differences in phenolic yield can be explained by a couple of key factors. One important factor is the amount of water in the solvent system. When the proportion of water changes, it can directly influence the yield of phenolic compounds [49]. Another factor to consider is the climate of the area where the plants are grown. Different climates can have a big impact on the growth and health of the plants, which can, in turn, affect the number of phenolic compounds produced. For instance, areas with more sunlight might lead to higher yields compared to regions with less sunlight. Temperature and humidity are also important. Plants grown in ideal conditions tend to produce more phenolic compounds [50].
It can be seen that the spectrophotometric experiment results were very close to the conventional results. This is confirmed in Figure 3, which displays the comparison between the results of GEY using the conventional method and GEY using the spectrophotometry method over time, with a correlation of 99.96% between the values given by the two methods (p < 0.05). This result confirms the accuracy of the spectrophotometric method in quantifying the global extract yield, especially when compared to the conventional mode of measurement.

3.2. Quantification of Total Phenolic Compounds, Total Flavonoids, and Condensed Tannins

The results for the TPCs, TFCs, and CTCs of pomegranate peel extract using solvent methanol/water (75/25) (v/v) under continuous stripping and centrifugation at 4500 rpm for 5 min show that after 21 h of extraction time, a maximum value of 97.17 mg/g md was obtained for TPC, a maximum value of 4.115 mg was obtained for TFC, and a maximum value of 411.75 µg was obtained EC/for CTC. The evaluation of the results obtained were compared with other regions and other conditions using the same solid–liquid extraction, as presented in Table 1, where the contents of TPCs, TFCs, and CTCs were found to vary according to the region, the type of solvent, the proportion of solvent, and the extraction time. We noted that all the works cited in comparison quantified the global extraction yield using evaporation.

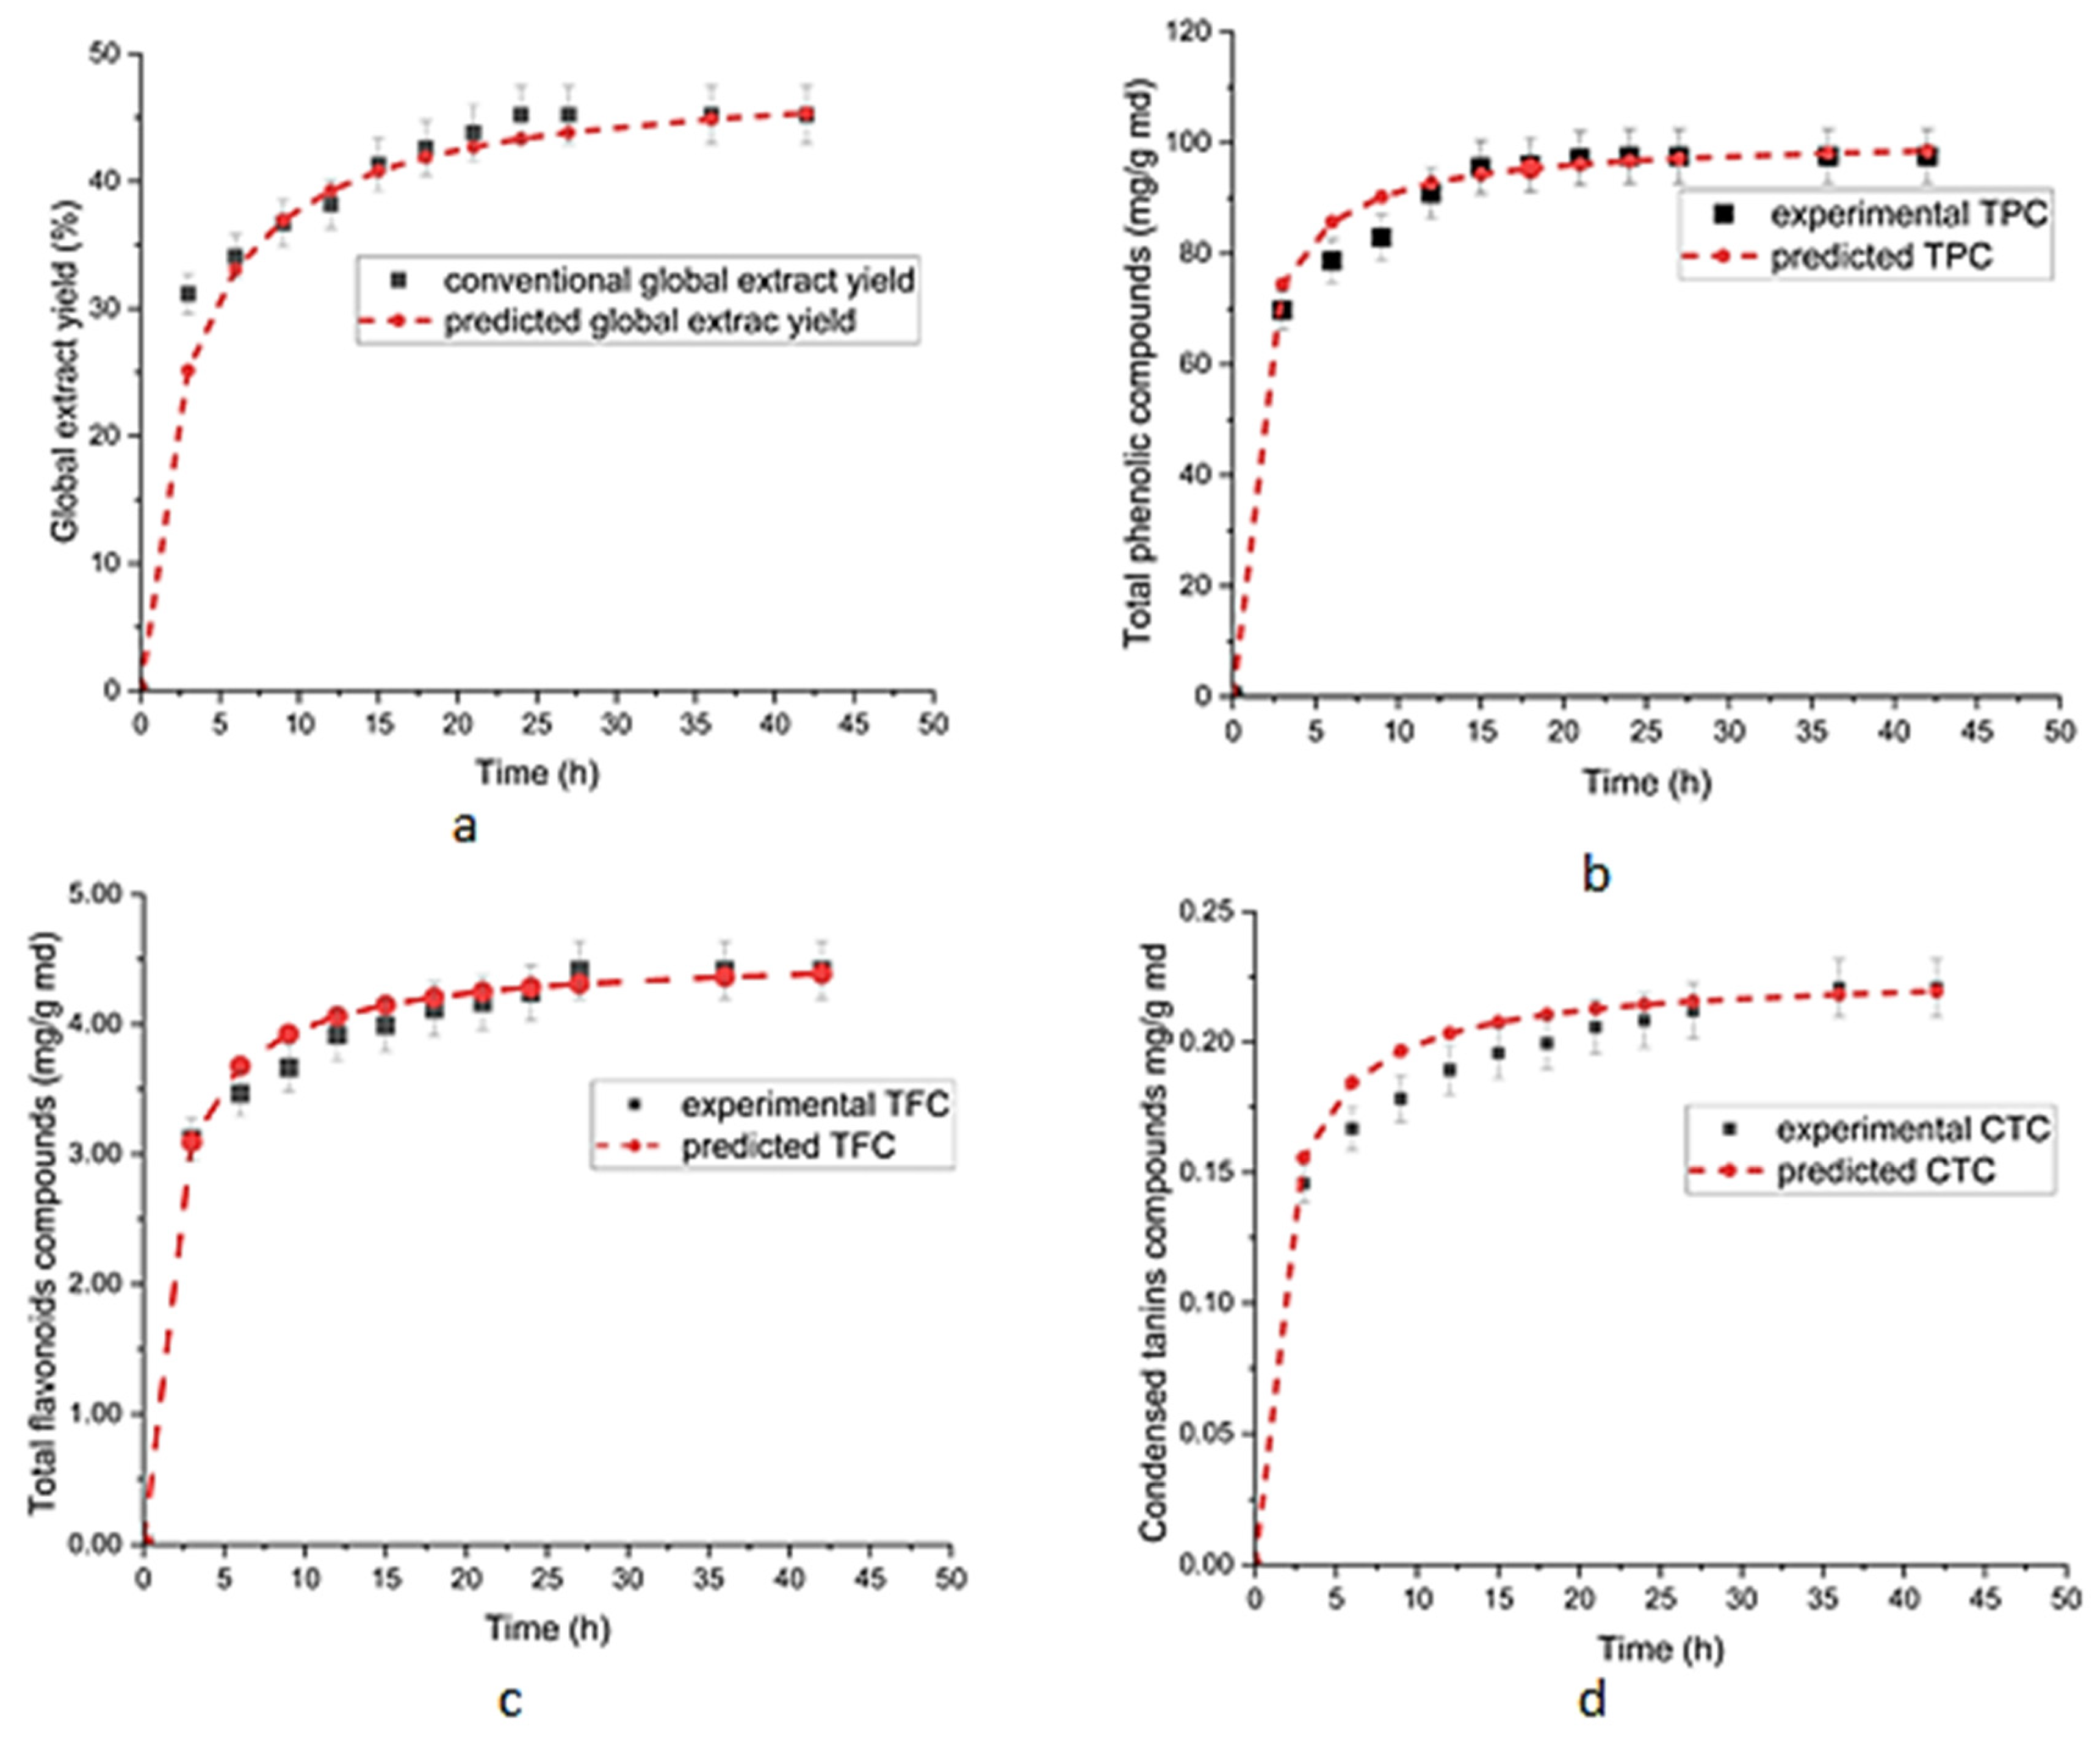
3.3. Kinetic Study of TPC, TFC and CTC Contents

The kinetic study of TPCs, TFCs, and CTCs under the operating conditions selected in this study is reported in Figure 4. The curves showing the TPC, TFC, and CTC contents exhibit a similar pattern to those observed in conventional extraction from plant materials [57,58,59,60,61]. By analyzing the extraction curves for all compounds, two periods of extraction could be easily observed in TPC, TFC, and CTC. In particular, a rapid increase in the concentrations of the TPC, TFC, and CTC contents was observed at the beginning of the process, and a gradual increase was observed as the extraction progressed (p < 0.05). As for the global extraction yield (Figure 2), TPC, TFC, and CTC increased rapidly with time during the first 18 h and then tended to reach a constant value (p < 0.05) after 24 h.
The typical extraction kinetics observed here follow a two-step process. First, there is a rapid washing step, driven primarily by solute partitioning, due to the presence of free phenolic compounds on the surface of the peel that rapidly interact with the solvent [24]. Following this efficient initial step, there is a gradual transition to a slower diffusion-controlled phase [57], where the movement of the solutes is influenced by the process of solute diffusion within the solid matrix. This sequential process mirrors the patterns commonly seen in solid–liquid extractions. Understanding the mechanism and kinetics governing the extraction of phenolic compounds is not only beneficial but essential to ensure the success and efficiency of extraction operations. Such knowledge provides the basis for fine-tuning extraction protocols, improving the yield and quality of extracted compounds and ultimately contributing to the overall success of the extraction process [26,58].

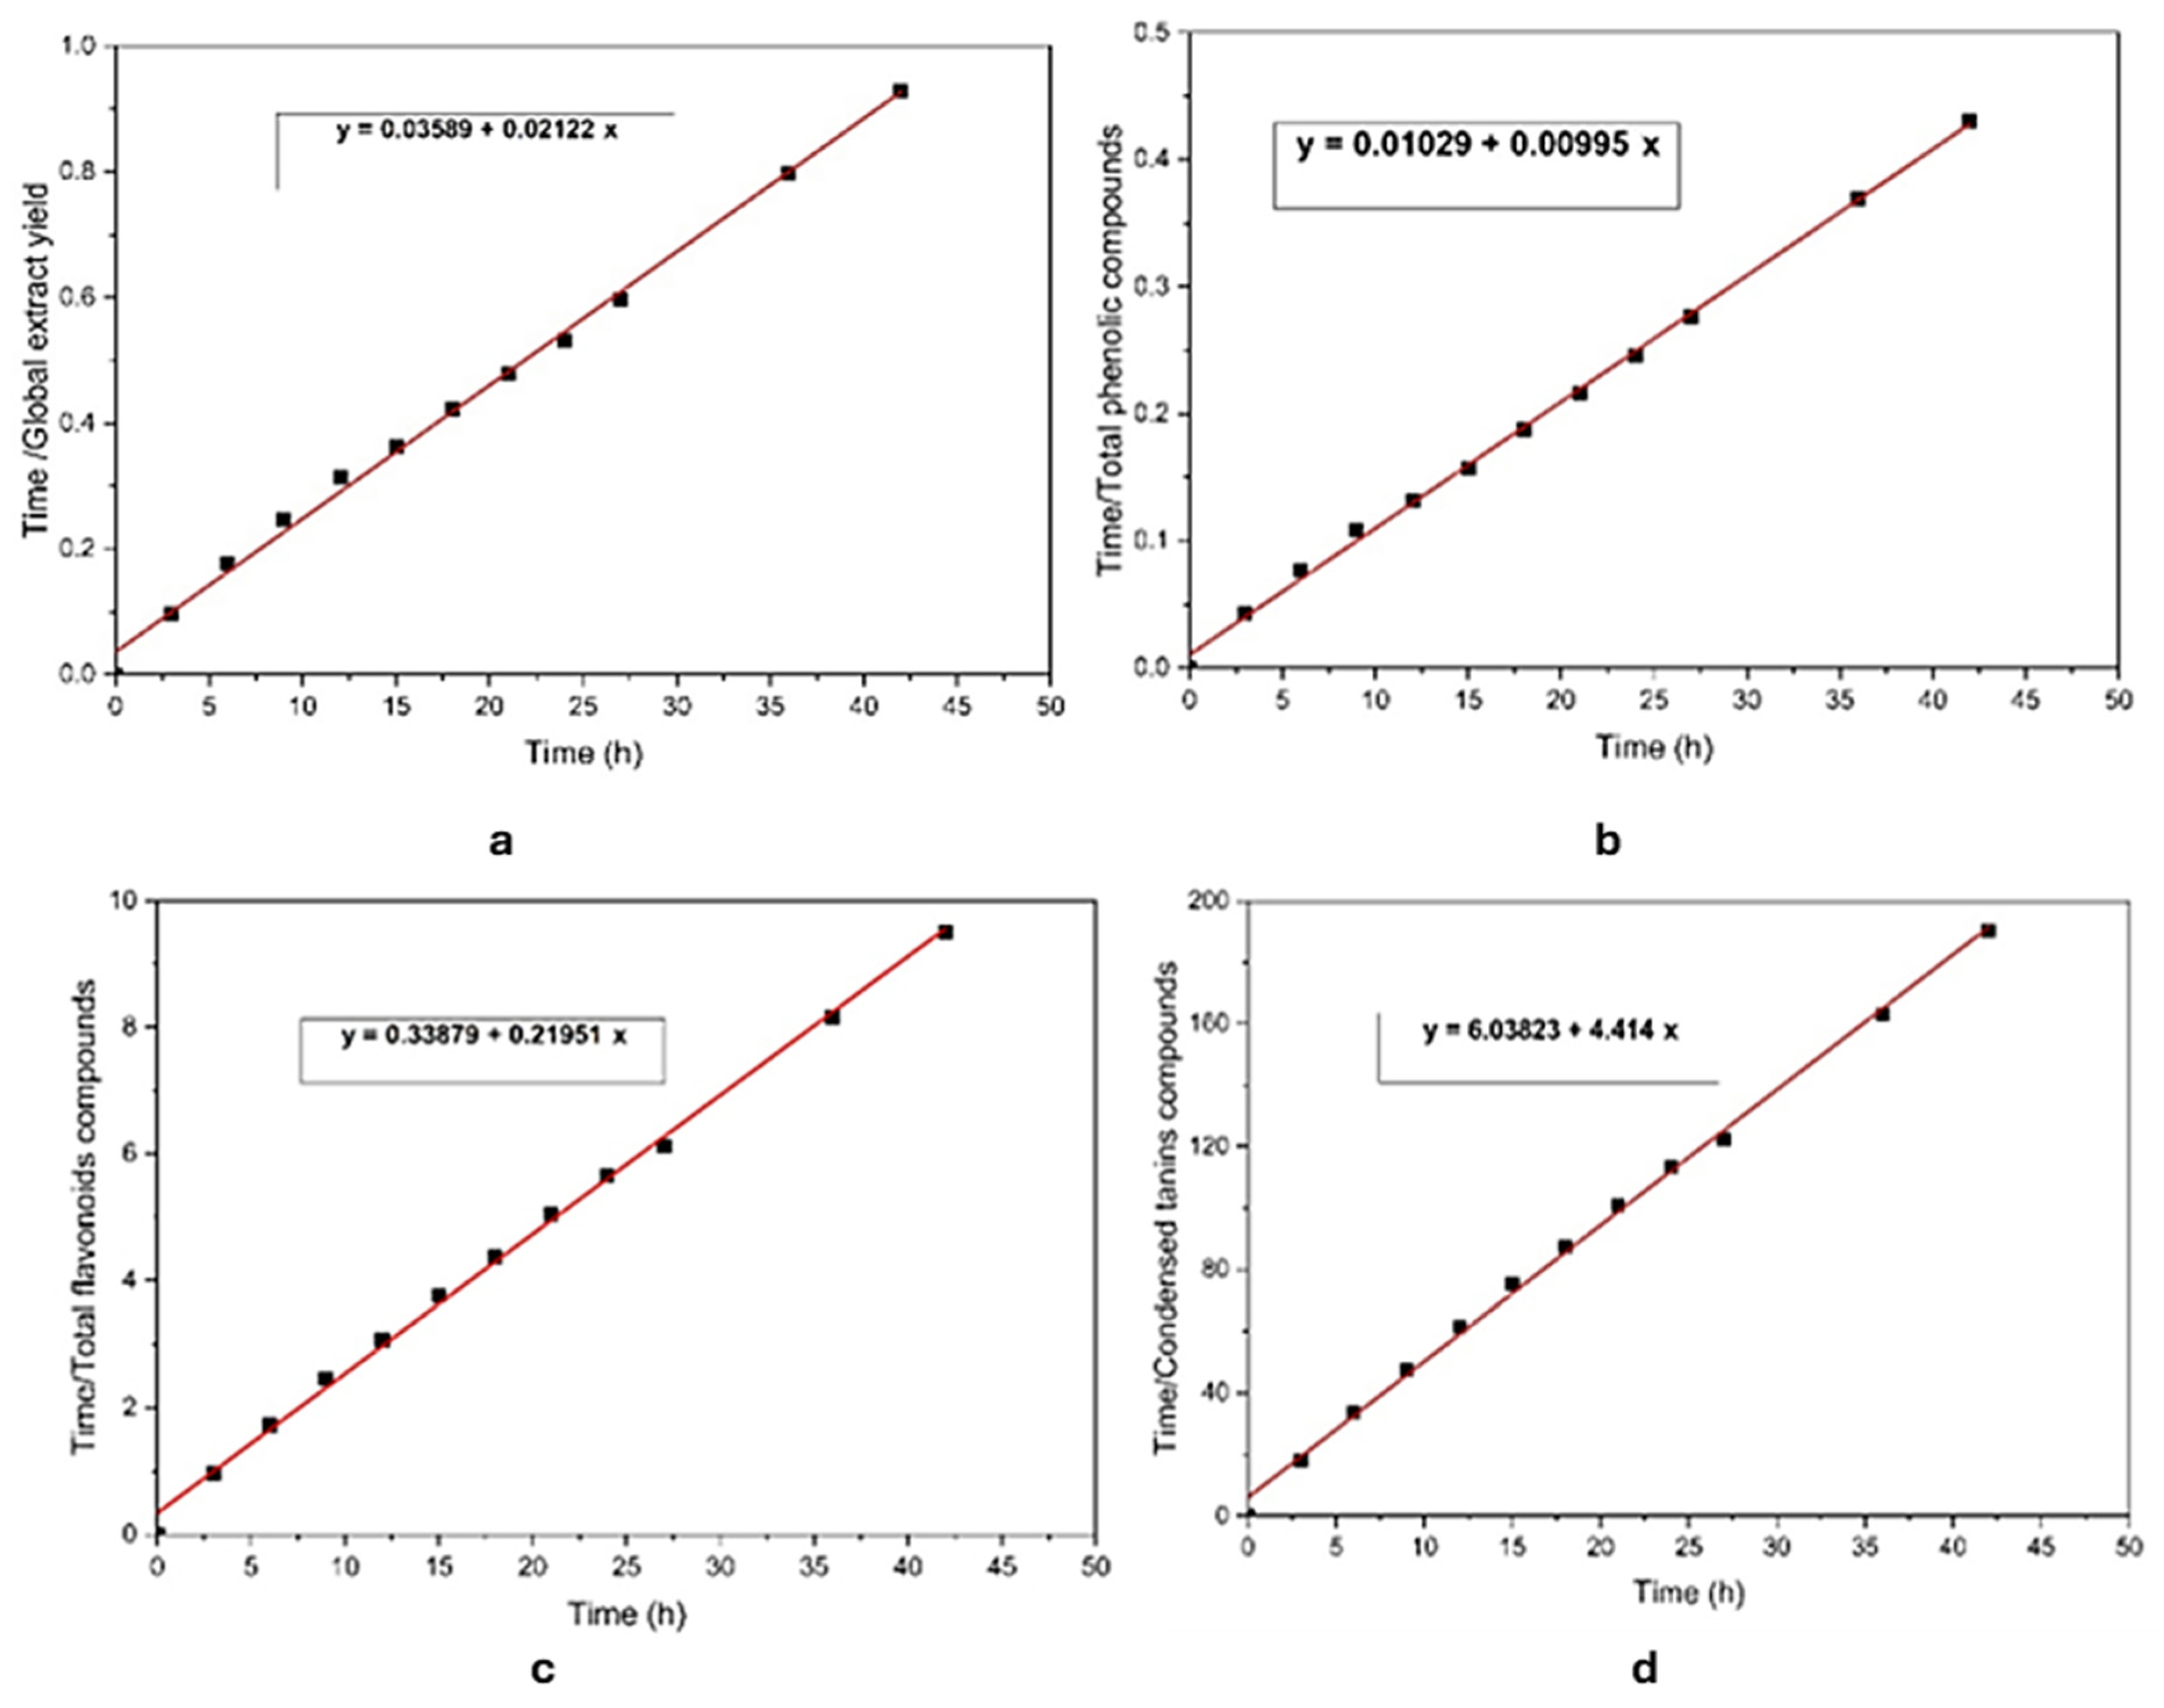
3.4. Kinetic Modeling Study of GEY, TPCs, TFCs, and CTCs

Based on the two-step mechanism, the kinetics of the GEY, TPC, TFC, and CTC extraction from pomegranate peels were modeled by the pseudo-second-order model and its linearized form; by plotting the different forms of the kinetic models, the values of the coefficient of determination (R2) were determined. The most accurate fit was obtained by means of the second-order kinetic model.
The second-order kinetic was examined by plotting t/Ct against time (t) (type 1), as presented in Figure 5; the values of R2 obtained for the linearized form of the pseudo-second-order equation for the GEY, TPC, TFC, and CTC contents were 99.66%, 99.91%, 99.76%, and 99.78%, respectively, namely close to one.
The comparison between the predicted model data obtained under the modeling of the pseudo-second-order model type and the experimental data of GEY, TPC, TFC, and CTC contents indicated that the predicted kinetic curves of GEY, TPC, TFC, and CTC were very close to the experimental data curve, as mentioned in Figure 4. These findings suggest that the extraction of bioactive compounds from pomegranate peels follows a pseudo-second-order kinetic model. The adequacy of the pseudo-second-order model for the extraction of bioactive compounds using solid–liquid extraction has also been reported by other researchers [23,24,29,59,60,61].

4. Conclusions

In the present work, the quantification of the global extraction yield, total phenolic compounds, total flavonoid compounds, and condensed tannin compounds from pomegranate peels in solid–liquid extraction (maceration) was identified, followed by a kinetic study under operating conditions during the first 36 h. A new spectrophotometric method was used to quantify the global extraction yield without evaporation, and this was confirmed by a comparison with the conventional method.
The comparison indicated that the spectrophotometric method is a good method with which to calculate the global extraction yield without evaporation of the extract with a correlation of more than 99%.
The kinetic extraction study of GEY, TPCs, TFCs, and CTCs from pomegranate peels demonstrated that the variation in the content of these compounds over time has the same shape in progression compared to the contents obtained after 21 h of extraction time with a maximum value of 45% for CEY, 97.17 mg/g md for TPC, 4.115 mg for TFC, and 411.75 µg EC/for CTC. The kinetic modeling of these results indicates that the second-order kinetic model was sufficient to describe the extraction mechanism of bioactive compounds from pomegranate fruit peels with correlations of 99.66%, 99.91%, 99,76%, and 99.78% for GEY, TPC, TFC, and CTC, respectively. This study provides an understanding of the mass transfer mechanism involved in the extraction process of bioactive compounds. The kinetic modeling of the extraction process is necessary to aid future process design by saving energy, time, and chemical reagent consumption to valorize pomegranate waste.

Author Contributions

Conceptualization, D.G., F.B., S.I., S.L., M.M.Y., L.M. and A.A., Methodology, D.G., F.B., S.I., S.L., M.M.Y., L.M. and A.A., Software, D.G., F.B., S.I., S.L., M.M.Y., L.M. and A.A.; Validation, D.G., F.B., S.I., S.L., M.M.Y., L.M. and A.A.; Formal analysis, D.G., F.B., S.I., S.L., M.M.Y., L.M. and A.A.; Investigation, D.G., F.B., S.I., S.L., M.M.Y., L.M. and A.A.; Resources, D.G., F.B., S.I., S.L., M.M.Y., L.M. and A.A.; Data curation, D.G., F.B., S.I., S.L., M.M.Y., L.M. and A.A.; Writing—original draft, D.G., F.B. and S.I.; Writing—review and editing, D.G., F.B., S.I., S.L., M.M.Y., L.M. and A.A.; Visualization, D.G., F.B., S.I., S.L., M.M.Y., L.M. and A.A.; Supervision, S.L., L.M. and A.A., Project administration, S.L., L.M., and A.A. All authors have read and agreed to the published version of the manuscript.

Funding

This research received no external funding.

Institutional Review Board Statement

Not applicable.

Informed Consent Statement

Not applicable.

Data Availability Statement

The data are available on request.

Acknowledgments

The authors are grateful to the Algerian direction of research and technology (DGRSDT).

Conflicts of Interest

The authors declare no conflict of interest.

References

  1. Luna-Guevara, M.L.; Luna-Guevara, J.J.; Hernández-Carranza, P.; Ruíz-Espinosa, H.; Ochoa-Velasco, C.E. Chapter 3—Phenolic Compounds: A Good Choice Against Chronic Degenerative Diseases. In Studies in Natural Products Chemistry; Atta-ur-Rahman, F.R.S., Ed.; Elsevier: Amsterdam, The Netherlands, 2018; Volume 59, pp. 79–108. [Google Scholar]
  2. Teterovska, R.; Sile, I.; Paulausks, A.; Kovalcuka, L.; Koka, R.; Mauriņa, B.; Bandere, D. The Antioxidant Activity of Wild-Growing Plants Containing Phenolic Compounds in Latvia. Plants 2023, 12, 4108. [Google Scholar] [CrossRef] [PubMed]
  3. Zhang, Y.; Cai, P.; Cheng, G.; Zhang, Y. A Brief Review of Phenolic Compounds Identified from Plants: Their Extraction, Analysis, and Biological Activity. Nat. Prod. Commun. 2022, 17, 1934578X211069721. [Google Scholar] [CrossRef]
  4. Saini, N.; Anmol, A.; Kumar, S.; Wani, A.W.; Bakshi, M.; Dhiman, Z. Exploring Phenolic Compounds as Natural Stress Alleviators in Plants—A Comprehensive Review. Physiol. Mol. Plant Pathol. 2024, 133, 102383. [Google Scholar] [CrossRef]
  5. Kumar, N.; Goel, N. Phenolic Acids: Natural Versatile Molecules with Promising Therapeutic Applications. Biotechnol. Rep. 2019, 24, e00370. [Google Scholar] [CrossRef]
  6. Ku, Y.-S.; Ng, M.-S.; Cheng, S.-S.; Lo, A.W.-Y.; Xiao, Z.; Shin, T.-S.; Chung, G.; Lam, H.-M. Understanding the Composition, Biosynthesis, Accumulation and Transport of Flavonoids in Crops for the Promotion of Crops as Healthy Sources of Flavonoids for Human Consumption. Nutrients 2020, 12, 1717. [Google Scholar] [CrossRef]
  7. Zaki, S.A.; Abdelatif, S.H.; Abdelmohsen, N.R.; Ismail, F.A. Phenolic Compounds and Antioxidant Activities of Pomegranate Peels. ETP Int. J. Food Eng. 2015, 1, 73–76. [Google Scholar] [CrossRef]
  8. Molino, S.; Pilar Francino, M.; Ángel Rufián Henares, J. Why Is It Important to Understand the Nature and Chemistry of Tannins to Exploit Their Potential as Nutraceuticals? Food Res. Int. 2023, 173, 113329. [Google Scholar] [CrossRef]
  9. De Melo, L.F.M.; Aquino-Martins, V.G.d.Q.; da Silva, A.P.; Oliveira Rocha, H.A.; Scortecci, K.C. Biological and Pharmacological Aspects of Tannins and Potential Biotechnological Applications. Food Chem. 2023, 414, 135645. [Google Scholar] [CrossRef]
  10. Moradnia, M.; Mohammadkhani, N.; Azizi, B.; Mohammadi, M.; Ebrahimpour, S.; Tabatabaei-Malazy, O.; Mirsadeghi, S.; Ale-Ebrahim, M. The Power of Punica granatum: A Natural Remedy for Oxidative Stress and Inflammation; a Narrative Review. J. Ethnopharmacol. 2024, 330, 118243. [Google Scholar] [CrossRef]
  11. Asgary, S.; Keshvari, M.; Sahebkar, A.; Sarrafzadegan, N. Pomegranate Consumption and Blood Pressure: A Review. Curr. Pharm. Des. 2017, 23, 1042–1050. [Google Scholar] [CrossRef]
  12. Cordiano, R.; Gammeri, L.; Di Salvo, E.; Gangemi, S.; Minciullo, P.L. Pomegranate (Punica granatum L.) Extract Effects on Inflammaging. Molecules 2024, 29, 4174. [Google Scholar] [CrossRef] [PubMed]
  13. Sorrenti, V.; Burò, I.; Consoli, V.; Vanella, L. Recent Advances in Health Benefits of Bioactive Compounds from Food Wastes and By-Products: Biochemical Aspects. Int. J. Mol. Sci. 2023, 24, 2019. [Google Scholar] [CrossRef] [PubMed]
  14. Toledo-Merma, P.R.; Cornejo-Figueroa, M.H.; Crisosto-Fuster, A.d.R.; Strieder, M.M.; Chañi-Paucar, L.O.; Náthia-Neves, G.; Rodríguez-Papuico, H.; Rostagno, M.A.; Meireles, M.A.A.; Alcázar-Alay, S.C. Phenolic Compounds Recovery from Pomegranate (Punica granatum L.) By-Products of Pressurized Liquid Extraction. Foods 2022, 11, 1070. [Google Scholar] [CrossRef] [PubMed]
  15. Mungwari, C.P.; King’ondu, C.K.; Sigauke, P.; Obadele, B.A. Conventional and Modern Techniques for Bioactive Compounds Recovery from Plants: Review. Sci. Afr. 2025, 27, e02509. [Google Scholar] [CrossRef]
  16. Mao, Y.; Robinson, J.; Binner, E. Understanding Heat and Mass Transfer Processes during Microwave-Assisted and Conventional Solvent Extraction. Chem. Eng. Sci. 2021, 233, 116418. [Google Scholar] [CrossRef]
  17. Moussa, H.; Dahmoune, F.; Hentabli, M.; Remini, H.; Mouni, L. Optimization of ultrasound-assisted extraction of phenolic-saponin content from Carthamus caeruleus L. rhizome and predictive model based on support vector regression optimized by dragonfly algorithm. Chemom. Intell. Lab. Syst. 2022, 222, 104493. [Google Scholar] [CrossRef]
  18. Lemes, A.C.; Egea, M.B.; de Oliveira Filho, J.G.; Gautério, G.V.; Ribeiro, B.D.; Coelho, M.A.Z. Biological Approaches for Extraction of Bioactive Compounds From Agro-Industrial By-Products: A Review. Front. Bioeng. Biotechnol. 2022, 9, 802543. [Google Scholar] [CrossRef]
  19. Quitério, E.; Grosso, C.; Ferraz, R.; Delerue-Matos, C.; Soares, C. A Critical Comparison of the Advanced Extraction Techniques Applied to Obtain Health-Promoting Compounds from Seaweeds. Mar. Drugs 2022, 20, 677. [Google Scholar] [CrossRef]
  20. Bitwell, C.; Indra, S.S.; Luke, C.; Kakoma, M.K. A Review of Modern and Conventional Extraction Techniques and Their Applications for Extracting Phytochemicals from Plants. Sci. Afr. 2023, 19, e01585. [Google Scholar] [CrossRef]
  21. Kumar, A.; P, N.; Kumar, M.; Jose, A.; Tomer, V.; Oz, E.; Proestos, C.; Zeng, M.; Elobeid, T.; K, S.; et al. Major Phytochemicals: Recent Advances in Health Benefits and Extraction Method. Molecules 2023, 28, 887. [Google Scholar] [CrossRef]
  22. Abubakar, A.R.; Haque, M. Preparation of Medicinal Plants: Basic Extraction and Fractionation Procedures for Experimental Purposes. J. Pharm. Bioallied Sci. 2020, 12, 1–10. [Google Scholar] [CrossRef] [PubMed]
  23. Hobbi, P.; Okoro, O.V.; Delporte, C.; Alimoradi, H.; Podstawczyk, D.; Nie, L.; Bernaerts, K.V.; Shavandi, A. Kinetic Modelling of the Solid–Liquid Extraction Process of Polyphenolic Compounds from Apple Pomace: Influence of Solvent Composition and Temperature. Bioresour. Bioprocess. 2021, 8, 114. [Google Scholar] [CrossRef] [PubMed]
  24. Galgano, F.; Tolve, R.; Scarpa, T.; Caruso, M.C.; Lucini, L.; Senizza, B.; Condelli, N. Extraction Kinetics of Total Polyphenols, Flavonoids, and Condensed Tannins of Lentil Seed Coat: Comparison of Solvent and Extraction Methods. Foods 2021, 10, 1810. [Google Scholar] [CrossRef]
  25. Villamil-Galindo, E.; Piagentini, A.M. Kinetic Modeling of Valuable Phenolic Compounds Extraction from Strawberry and Apple Agro-Industrial by-Products. J. Food Process Eng. 2024, 47, e14573. [Google Scholar] [CrossRef]
  26. Naviglio, D.; Scarano, P.; Ciaravolo, M.; Gallo, M. Rapid Solid-Liquid Dynamic Extraction (RSLDE): A Powerful and Greener Alternative to the Latest Solid-Liquid Extraction Techniques. Foods 2019, 8, 245. [Google Scholar] [CrossRef]
  27. Susanti, D.Y.; Sediawan, W.B.; Fahrurrozi, M.; Hidayat, M. A Mechanistic Model of Mass Transfer in the Extraction of Bioactive Compounds from Intact Sorghum Pericarp. Processes 2019, 7, 837. [Google Scholar] [CrossRef]
  28. Pourhakkak, P.; Taghizadeh, A.; Taghizadeh, M.; Ghaedi, M.; Haghdoust, S. Chapter 1—Fundamentals of Adsorption Technology. In Interface Science and Technology; Ghaedi, M., Ed.; Adsorption: Fundamental Processes and Applications; Elsevier: Amsterdam, The Netherlands, 2021; Volume 33, pp. 1–70. [Google Scholar]
  29. Sridhar, A.; Ponnuchamy, M.; Kumar, P.S.; Kapoor, A.; Vo, D.-V.N.; Prabhakar, S. Techniques and Modeling of Polyphenol Extraction from Food: A Review. Environ. Chem. Lett. 2021, 19, 3409–3443. [Google Scholar] [CrossRef]
  30. Xu, H.; Fei, Q.; Manickam, S.; Li, D.; Xiao, H.; Han, Y.; Show, P.L.; Zhang, G.; Tao, Y. Mechanistic Study of the Solid-Liquid Extraction of Phenolics from Walnut Pellicle Fibers Enhanced by Ultrasound, Microwave and Mechanical Agitation Forces. Chemosphere 2022, 309, 136451. [Google Scholar] [CrossRef]
  31. Shen, Z.; Ji, X.; Yao, S.; Zhang, H.; Xiong, L.; Li, H.; Chen, X.; Chen, X. Solid-Liquid Extraction of Chlorogenic Acid from Eucommia Ulmoides Oliver Leaves: Kinetic and Mass Transfer Studies. Ind. Crops Prod. 2023, 205, 117544. [Google Scholar] [CrossRef]
  32. Tran, H.N. Applying Linear Forms of Pseudo-Second-Order Kinetic Model for Feasibly Identifying Errors in the Initial Periods of Time-Dependent Adsorption Datasets. Water 2023, 15, 1231. [Google Scholar] [CrossRef]
  33. Kostoglou, M.; Karapantsios, T.D. Why Is the Linearized Form of Pseudo-Second Order Adsorption Kinetic Model So Successful in Fitting Batch Adsorption Experimental Data? Colloids Interfaces 2022, 6, 55. [Google Scholar] [CrossRef]
  34. Moussout, H.; Ahlafi, H.; Aazza, M.; Maghat, H. Critical of Linear and Nonlinear Equations of Pseudo-First Order and Pseudo-Second Order Kinetic Models. Karbala Int. J. Mod. Sci. 2018, 4, 244–254. [Google Scholar] [CrossRef]
  35. Aleixandre-Tudo, J.L.; du Toit, W. The Role of UV-Visible Spectroscopy for Phenolic Compounds Quantification in Winemaking. In Frontiers and New Trends in the Science of Fermented Food and Beverages; IntechOpen: London, UK, 2018; ISBN 978-1-78985-496-1. [Google Scholar]
  36. Mihaly Cozmuta, A.; Peter, A.; Nicula, C.; Jastrzębska, A.; Jakubczak, M.; Purbayanto, M.A.K.; Bunea, A.; Bora, F.; Uivarasan, A.; Szakács, Z.; et al. The Impact of Visible Light Component Bands on Polyphenols from Red Grape Seed Extract Powder Encapsulated in Alginate–Whey Protein Matrix. Food Chem. X 2024, 23, 101758. [Google Scholar] [CrossRef]
  37. Enaru, B.; Drețcanu, G.; Pop, T.D.; Stănilă, A.; Diaconeasa, Z. Anthocyanins: Factors Affecting Their Stability and Degradation. Antioxidants 2021, 10, 1967. [Google Scholar] [CrossRef]
  38. Tian, W.; Chen, G.; Gui, Y.; Zhang, G.; Li, Y. Rapid Quantification of Total Phenolics and Ferulic Acid in Whole Wheat Using UV–Vis Spectrophotometry. Food Control 2021, 123, 107691. [Google Scholar] [CrossRef]
  39. Lamuela-Raventós, R.M. Folin–Ciocalteu Method for the Measurement of Total Phenolic Content and Antioxidant Capacity. In Measurement of Antioxidant Activity & Capacity; John Wiley & Sons, Ltd.: Hoboken, NJ, USA, 2018; pp. 107–115. ISBN 978-1-119-13538-8. [Google Scholar]
  40. Ali-Rachedi, F.; Meraghni, S.; Touaibia, N.; Mesbah, S. Analyse quantitative des composés phénoliques d’une endémique algérienne Scabiosa Atropurpurea sub. Maritima L. Bull. Soc. R. Sci. Liège 2018, 87, 13–21. [Google Scholar] [CrossRef]
  41. Thitz, P.; Mehtätalo, L.; Välimäki, P.; Randriamanana, T.; Lännenpää, M.; Hagerman, A.E.; Andersson, T.; Julkunen-Tiitto, R.; Nyman, T. Phytochemical Shift from Condensed Tannins to Flavonoids in Transgenic Betula Pendula Decreases Consumption and Growth but Improves Growth Efficiency of Epirrita Autumnata Larvae. J. Chem. Ecol. 2020, 46, 217–231. [Google Scholar] [CrossRef]
  42. Bergamin, E.; Fabris, G.; Neffat, M.; Toaldo, P.B.; Luchi, D.D.; Bonomi, R. Multiple Solid–Liquid Extraction: Determination of Extraction Yield through UV–Vis Spectroscopy. J. Chem. Educ. 2023, 100, 875–879. [Google Scholar] [CrossRef]
  43. Gil-Martín, E.; Forbes-Hernández, T.; Romero, A.; Cianciosi, D.; Giampieri, F.; Battino, M. Influence of the Extraction Method on the Recovery of Bioactive Phenolic Compounds from Food Industry By-Products. Food Chem. 2022, 378, 131918. [Google Scholar] [CrossRef]
  44. Ramesh, M.M.; Shankar, N.S.; Venkatappa, A.H. Driving/Critical Factors Considered During Extraction to Obtain Bioactive Enriched Extracts. Pharmacogn. Rev. 2024, 18, 68–81. [Google Scholar] [CrossRef]
  45. Bennour, N.; Mighri, H.; Eljani, H.; Zammouri, T.; Akrout, A. Effect of Solvent Evaporation Method on Phenolic Compounds and the Antioxidant Activity of Moringa Oleifera Cultivated in Southern Tunisia. S. Afr. J. Bot. 2020, 129, 181–190. [Google Scholar] [CrossRef]
  46. Lin, D.; Xiao, M.; Zhao, J.; Li, Z.; Xing, B.; Li, X.; Kong, M.; Li, L.; Zhang, Q.; Liu, Y.; et al. An Overview of Plant Phenolic Compounds and Their Importance in Human Nutrition and Management of Type 2 Diabetes. Molecules 2016, 21, 1374. [Google Scholar] [CrossRef] [PubMed]
  47. Benguiar, R.; Yahla, I.; Benaraba, R.; Bouamar, S.; Riazi, A. Phytochemical Analysis, Antibacterial and Antioxidant Activities of Pomegranate (Punica granatum L.) Peel Extracts. Int. J. Biosci. IJB 2020, 16, 35–44. [Google Scholar] [CrossRef]
  48. Ghasemi, R.; Akrami Mohajeri, F.; Heydari, A.; Yasini, S.A.; Dehghani Tafti, A.; Khalili Sadrabad, E. Application of Pomegranate Peel Extract, a Waste Agricultural Product, as a Natural Preservative in Tahini. Int. J. Food Sci. 2023, 2023, e8860476. [Google Scholar] [CrossRef]
  49. Hadjadj, S.; Benyahkem, M.; Lamri, K.; Ould El Hadj-Khelil, A. Potential Assessment of Pomegranate (Punica granatum L.) Fruit Peels as A Source of Natural Antioxidants. Pharmacophore 2018, 9, 29–34. [Google Scholar]
  50. Hasnaoui, N.; Wathelet, B.; Jiménez-Araujo, A. Valorization of Pomegranate Peel from 12 Cultivars: Dietary Fibre Composition, Antioxidant Capacity and Functional Properties. Food Chem. 2014, 160, 196–203. [Google Scholar] [CrossRef]
  51. Sabraoui, T.; Khider, T.; Nasser, B.; Eddoha, R.; Moujahid, A.; Benbachir, M.; Essamadi, A. Determination of Punicalagins Content, Metal Chelating, and Antioxidant Properties of Edible Pomegranate (Punica granatum L) Peels and Seeds Grown in Morocco. Int. J. Food Sci. 2020, 2020, 8885889. [Google Scholar] [CrossRef]
  52. Chaabna, N.; Naili, O.; Ziane, N.; Bensouici, C.; Dahamna, S.; Harzallah, D. In Vitro Antioxidant, Anti-Alzheimer and Antibacterial Activities of Ethyl Acetate and n-Butanol Fractions of Punica granatum Peel from Algeria. J. Nat. Prod. Res. TJNPR 2023, 7, 3470–3477. [Google Scholar] [CrossRef]
  53. Salim, A.; Deiana, P.; Fancello, F.; Molinu, M.G.; Santona, M.; Zara, S. Antimicrobial and Antibiofilm Activities of Pomegranate Peel Phenolic Compounds: Varietal Screening through a Multivariate Approach. J. Bioresour. Bioprod. 2023, 8, 146–161. [Google Scholar] [CrossRef]
  54. Abid, M.; Yaich, H.; Cheikhrouhou, S.; Khemakhem, I.; Bouaziz, M.; Attia, H.; Ayadi, M.A. Antioxidant Properties and Phenolic Profile Characterization by LC-MS/MS of Selected Tunisian Pomegranate Peels. J. Food Sci. Technol. 2017, 54, 2890–2901. [Google Scholar] [CrossRef]
  55. Derakhshan, Z.; Ferrante, M.; Tadi, M.; Ansari, F.; Heydari, A.; Hosseini, M.S.; Conti, G.O.; Sadrabad, E.K. Antioxidant Activity and Total Phenolic Content of Ethanolic Extract of Pomegranate Peels, Juice and Seeds. Food Chem. Toxicol. Int. J. Publ. Br. Ind. Biol. Res. Assoc. 2018, 114, 108–111. [Google Scholar] [CrossRef] [PubMed]
  56. Hlima, H.B.; Bohli, T.; Kraiem, M.; Ouederni, A.; Mellouli, L.; Michaud, P.; Abdelkafi, S.; Smaoui, S. Combined Effect of Spirulina Platensis and Punica granatum Peel Extacts: Phytochemical Content and Antiphytophatogenic Activity. Appl. Sci. 2019, 9, 5475. [Google Scholar] [CrossRef]
  57. Mirzaeva, S.U.; Muxamadiev, B.T.; Mirzaeva, S.U.; Muxamadiev, B.T. Perspective Chapter: Theoretical Foundations of the Extraction Process; IntechOpen: London, UK, 2024; ISBN 978-0-8a5466-739-0. [Google Scholar]
  58. Ponphaiboon, J.; Krongrawa, W.; Aung, W.W.; Chinatangkul, N.; Limmatvapirat, S.; Limmatvapirat, C. Advances in Natural Product Extraction Techniques, Electrospun Fiber Fabrication, and the Integration of Experimental Design: A Comprehensive Review. Molecules 2023, 28, 5163. [Google Scholar] [CrossRef]
  59. Shibasaki-Kitakawa, N.; Iizuka, Y.; Takahashi, A.; Yonemoto, T. A Kinetic Model for Flavonoid Production in Tea Cell Culture. Bioprocess. Biosyst. Eng. 2017, 40, 211–219. [Google Scholar] [CrossRef]
  60. Agu, C.M.; Menkiti, M.C.; Ohale, P.E.; Ugonabo, V.I. Extraction Modeling, Kinetics, and Thermodynamics of Solvent Extraction of Irvingia Gabonensis Kernel Oil, for Possible Industrial Application. Eng. Rep. 2021, 3, e12306. [Google Scholar] [CrossRef]
  61. Alara, O.R.; Abdurahman, N.H. Kinetics Studies on Effects of Extraction Techniques on Bioactive Compounds from Vernonia Cinerea Leaf. J. Food Sci. Technol. 2019, 56, 580–588. [Google Scholar] [CrossRef]
Figure 1. Calibration curve of global extract absorption in (24 h). Data are representative of three independent experiments, and values are expressed in mean ± SD.
Appliedchem 05 00011 g001
Figure 2. Kinetic study of global extraction yields using conventional and spectrophotometric methods. Data are representative of three independent experiments, and values are expressed as mean ± SD.
Appliedchem 05 00011 g002
Figure 3. Comparison between GEYs using conventional and spectrophotometric methods.
Appliedchem 05 00011 g003
Figure 4. Kinetic study of GEY (a), TPC (b), TFC (c), and CTC (d) contents and the experimental and predicted results (solid–liquid extraction used methanol/water (75/25) v/v as solvent). Data are representative of three independent experiments, and values are expressed as mean ± SD.
Appliedchem 05 00011 g004
Figure 5. The linear form of the pseudo-second-order model type one for GEY (a), TPC (b), TFC (c), and CTC (d).
Appliedchem 05 00011 g005
Table 1. Comparative studies for the contents of TPCs, TFCs, and CTCs in pomegranate peel extracts.
CountrySolventExtraction Time (h)TPCTFCCTCReferences
MoroccoMethanol2463.34 (mg GAE/g)2.11 (mg RE/g)NM[51]
AlgeriaEthanol/water
70/30
24677.55 µg GAE/mg93.48 µg QE/mg106.95 (µg TAE/mg)[52]
ItalyUltrapure water4127.0 mg/g20.8 mg/g7.5 (mg/g)[53]
TunisiaAcetone1304.60 mg GAE/g15.46 mg Quer/g292.23 (mg GAE/g)[54]
IranEthanol48276 mg GAE/g36 mg rutin/gNM[55]
TunisiaEthanol24131.14 (mg GAE/g)6.75 (mg QE/g)NM[56]
AlgeriaMethanol/water
75/25
2197.17 mg/g md4.115 mg411.75 µgPresent work
Disclaimer/Publisher’s Note: The statements, opinions and data contained in all publications are solely those of the individual author(s) and contributor(s) and not of MDPI and/or the editor(s). MDPI and/or the editor(s) disclaim responsibility for any injury to people or property resulting from any ideas, methods, instructions or products referred to in the content.

