1. Introduction
Octopus mimus (Gould, 1852), Gould octopus, is a species distributed in intertidal and subtidal rocky habitats along the southeastern Pacific Ocean, ranging from northern Peru to central Chile [
1]. In recent years, its exploitation has increased due to high commercial demand. Combined with overfishing and the impacts of climatic events such as El Niño and La Niña, this has led to a drastic decline in recorded catches [
2]. Under these circumstances, the implementation of sustainable aquaculture strategies has emerged as an alternative to ensure supply without compromising natural populations. One of the main challenges in this process is the domestication of the species, particularly the establishment of a viable broodstock, which requires an understanding of the mechanisms that regulate reproduction, especially the induction of spawning under controlled conditions.
Like other octopods,
O. mimus is a semelparous species, meaning that females undergo a single reproductive event in their lifetime. Following spawning, female octopuses cease feeding and rely on stored energy reserves, triggering a senescence process that culminates in death [
3,
4]. During this period, females exhibit egg-caring behavior, tending to egg clusters until hatching occurs [
1,
3]. The optic gland, a structure present in all cephalopods except for nautiloids, plays a key role in regulating this process and has been functionally compared to the vertebrate pituitary gland [
5]. Accordingly, ablation of the optic gland in
O. vulgaris females suppresses senescent behavior and permits the resumption of feeding, suggesting that this structure is responsible for initiating the terminal phase of the reproductive cycle [
4].
Environmental conditions directly influence cephalopod reproduction [
5]. Factors such as temperature, light, and food availability modulate gonadal maturation and spawning [
1,
6]. In octopods, reproduction has been observed to occur preferentially under semi-dark conditions, while continuous light exposure inhibits these processes [
1,
7]. Thus, reproductive induction is largely mediated by the optic gland, although other structures, such as the subpedunculate lobe, olfactory lobe, and optic lobe, are also involved in regulating the reproductive cycle [
8]. The subpedunculate and olfactory lobes work together to modulate optic gland activity through the release of neuropeptides such as FMRFamide and GnRH [
9,
10]. Studies in
O. vulgaris have shown that the olfactory lobe also regulates optic gland activity, influencing the transition from growth to reproduction [
11]. Additionally, the optic lobes have been reported to release FMRFamide-like neuropeptides that regulate a variety of functions in mollusks, including reproduction [
12]. Furthermore, a correlation between reproductive senescence and cholesterol metabolism has been identified, with genes such as 7DHC and DAF36 implicated in the activation of the optic gland [
12,
13]. The signaling cascade initiated by the optic gland in turn promotes fertilization through the functional activation of the oviducal gland (OG), another key reproductive organ. The production of oct-GnRH may play a role in the optic gland–gonadal axis, analogous to the hypothalamic–pituitary axis in vertebrates [
12,
14].
Following gonadal maturation, the oviducal gland becomes functionally active, facilitating fertilization and oocyte encapsulation. During mating, sperm are stored in the oviducal gland and can remain viable for up to ten months before being reactivated for fertilization [
3,
4]. The oviducal gland also participates in the metabolism and secretion of steroid hormones that coordinate fertilization and oviposition [
15]. Once fertilized, the chorion hardens to prevent polyspermy and to protect the embryo from mechanical damage and bacterial infection [
16,
17]. Finally, the eggs are transported by peristalsis and released in the form of an ovarian string, which the female affixes to a suitable substrate [
17]. Although it has been proposed that structures such as the optic gland, subpedunculate lobe, olfactory lobe, and optic lobe participate in the regulation of the reproductive cycle [
8], a direct relationship between each of these structures and specific environmental factors triggering their activation has yet to be established [
18].
Nevertheless, considering the optic lobe’s specialization in the perception and interpretation of visual stimuli, it is hypothesized that this organ may be involved in the initial detection of photoperiod or light intensity, functioning as a key environmental sensor in reproductive regulation. Indeed, octopods possess an eye structure analogous to that of vertebrates [
19], and extraocular photoreception mediated by skin-expressed opsins has also been demonstrated [
20]. Together, these adaptations underscore the pivotal role of light in their evolutionary and environmental resilience [
21]. Based on this evidence, the present study aims to identify differentially expressed genes in the optic lobe and oviducal gland of
O. mimus females whose spawning induction was inhibited by constant light exposure (24:0), in comparison with a control group maintained under semi-dark conditions and in natural photoperiod (14:10). Given that the onset of spawning involves profound metabolic changes and is associated with self-destructive behavior, we propose that this process relies on the integration of internal and external cues processed by specialized organs. We hypothesize that the optic lobe, by interpreting visual signals such as photoperiod, provides specific input which, in concert with other factors, activates a neuroendocrine cascade involving the optic gland, olfactory gland, and supraesophageal structures, ultimately leading to fertilization, oviposition, and senescence in
O. mimus females.
2. Materials and Methods
2.1. Experimental Design and Sample Collection
Thirty octopus individuals were captured using artisanal fishing techniques off the coast of Vila Vila in southern Peru (−18.1154453, −70.7242811) between October-November 2023. The specimens were transported in two 150 L tanks at a temperature of 15 °C with oxygen saturation to the experimental aquaculture facility in Vila Vila, southern Peru. Upon arrival, the octopuses were anesthetized with 1.5% magnesium chloride for initial weighing and sex determination. They were then distributed into 500 L circular tanks at a female-to-male ratio of 2:1, under a seawater flow-through system maintained in semi-darkness conditions (<100 lx), with a water temperature of 18 ± 1 °C and a salinity of 35 PSU. Each tank contained individual shelters made from PVC tubes (25 × 50 × 20 cm; length × width × diameter). The octopuses were fed ad libitum every two days with crab (Platyxanthus orbigny) and “muy muy” (Emerita analoga).
After 15 days, individuals were separated by sex, forming a total of 10 female-designated tanks, each containing two females along with their respective shelters. During this period, five of the tanks were exposed to artificial illumination using two LED tubes positioned above the water surface, emitting an intensity of 500 lx with a 24:0 (light:dark) photoperiod. The remaining five tanks served as the control group and were maintained under semi-darkness using a shading mesh, ensuring illumination levels remained below 100 lx under a natural photoperiod. Throughout the experiment, feeding procedures and physicochemical parameters remained constant, while monitoring was conducted to observe whether females ceased feeding or initiated spawning. Sampling was performed once, when at least half of the females in the control group had begun spawning, i.e., when egg clusters were present in the shelters [
1,
15].
For sampling, the octopuses were anesthetized in magnesium chloride (1.5% for 10 min and 3.5% for 15 min), after which dissections were conducted using entomological needles (Ento Sphinx inox 0.2 mm, Entomopraxis SCP, Lima, Peru). The optic lobe and oviducal gland were dissected in triplicate under sterile conditions, submerged in RNAlater (Invitrogen, Carlsbad, CA, USA), and stored at −80 °C until RNA extraction.
2.2. RNA Extraction and Sequencing
Total RNA was extracted from each tissue sample using the NZY Total RNA Isolation Kit (NZYtech, Lisbon, Portugal) following the manufacturer’s protocol. RNA concentration was measured with DeNovix DS-11 FS and RNA integrity was checked by running an aliquot of total RNA (~500 ng) on a 1% (w/v) agarose gel stained with GelRed™ nucleic acid stain (Biotium, Hayward, CA, USA). The RNA quality was evaluated by sample absorbance according to the A260/280 and A260/230 ratios using a BiotTek® Synergy HT microplate reader (Synergy HT, BioTek Instruments, Inc., Winooski, VT, USA). Strand-specific libraries were prepared at Novogen Inc. (Novagen, Darmstadt, Germany) using an insert size of 250–300 bp. Sequencing was performed on an Illumina NovaSeq 6000 platform (Illumina, San Diego, CA, USA), generating 150 bp paired-end reads.
2.3. Quality Control and Preprocessing
Raw sequencing reads were assessed for quality using FastQC v0.11.8 [
22]. Illumina adapter sequences and low-quality bases were removed with Trimmomatic v0.38 [
23] using the following parameters: LEADING:5 TRAILING:5 SLIDINGWINDOW:5:20 MINLEN:36. To correct sequencing errors, reads were processed with Rcorrector v1.0.3 [
24]. Clean reads were subsequently re-evaluated using FastQC to ensure quality improvement.
2.4. Genome Annotation and Read Mapping
Since
O. mimus has an available genome in NCBI (Genome assembly ASM2756897v1) but lacks annotation, we performed structural annotation using AUGUSTUS v3.4.0 [
25]. AUGUSTUS was run using default parameters and the generic species model (--species = generic) in ab initio prediction mode, without external evidence such as RNA-Seq hints. Gene predictions were generated based solely on the input genome sequence, and the output was provided in GTF format, including only complete gene structures.
Prior to annotation, the integrity of the genome assembly was assessed with BUSCO v4.1.4, using the “eukaryota_odb9” dataset. The resulting GTF file was then converted to GFF format using AGAT v1.0.0 [
26] for downstream integration and analysis. Then, the annotated genome was indexed with HISAT2 v2.2.1 [
27] for efficient read alignment. Preprocessed RNA-Seq reads were mapped to the indexed genome using HISAT2 v2.2.1 with the following parameters: --max-intronlen 50,000 --rna-strandness RF --dta. Alignment statistics were assessed using SAMtools v1.9 [
28] and read distribution across genomic features was verified.
Functional annotation of the predicted proteins from the genome and annotation datasets was performed using the AGAT toolkit [
26]. General Feature Format (GFF3) files were generated from the initial GFF output files produced by AUGUSTUS, allowing for comprehensive structural analysis and preparation of data for downstream functional analyses. From the
O. mimus genome, features including splice sites (SS), exons, coding sequences (CDS), and transcripts were extracted. To validate the functional annotation and obtain homology-based evidence, sequence similarity searches were conducted using DIAMOND [
29]. Both BLASTp and BLASTn alignments were performed against major curated protein and nucleotide databases, including UniProt, Swiss-Prot (downloaded 18 February 2020; The UniProt Consortium, 2016) and NCBI non-redundant databases (downloaded 10 March 2024). Additionally, nucleotide and amino acid sequences for all genes, transcripts, and proteins were retrieved in FASTA format to facilitate further functional filtering.
2.5. Differential Gene Expression Analysis
Feature counts were generated using StringTie v.2.1.2 [
30], and differential gene expression analysis was conducted using the edgeR package (v.3.26.8) [
31] in R (v.3.6.1) to compare Light and Dark (control) photoperiod conditions in females for both tissues. For normalization across samples, the trimmed mean of M-values (TMM) method [
32] was employed. Genes were retained for differential analysis if they showed at least 1 CPM (counts per million) in at least three biological replicates. Statistical significance for differential expression was determined using a False Discovery Rate (FDR)-adjusted
p-value < 0.05 and a |log2 fold change| ≥ 2. Hierarchical heatmaps were generated using the Heatmapper Expression tool [
33], applying the Average Linkage clustering method with Euclidean distance. Differential expression results were visualized using the EnhancedVolcano R package [
34]. A multidimensional scaling plot (MDS) using the Glimma package and principal component analysis (PCA) using PCAtools [
35] were also implemented to assess sample variance.
Raw sequencing data have been deposited in the NCBI Sequence Read Archive (SRA) under BioProject accession number PRJNA1416070, with individual libraries available under SRA accession numbers SRR37032714–SRR37032725.
2.6. Gene Ontology and KEGG Pathway Enrichment Analysis
For the identification of differentially expressed genes (DEGs) and proteins, filtering was conducted using seqtk subseq based on lists of gene IDs obtained from prior differential expression analyses. This enabled the isolation of sequences specific to each expression group for subsequent enrichment studies. Functional enrichment analysis of DEGs was carried out to identify overrepresented biological processes and metabolic pathways. Gene Ontology (GO) enrichment was performed using the g:GOSt module of the g:Profiler web tool [
36]. The analysis included GO terms associated with biological processes (BP), molecular functions (MF), and cellular components (CC). Statistical significance of GO term enrichment was evaluated using Fisher’s exact test (
p < 0.05) and multiple comparisons were corrected using the Benjamini–Hochberg FDR procedure. GO terms passing the adjusted significance threshold were considered significantly enriched.
For pathway enrichment analysis, DEGs were annotated using the Kyoto Encyclopedia of Genes and Genomes (KEGG) Automatic Annotation Server (KAAS) [
37]. The single-directional best hit (SBH) method was selected for KO (KEGG Orthology) assignment, using the default set of representative eukaryotic species as reference. The resulting KO identifiers were mapped to the Octopus bimaculoides genome to reconstruct species-specific KEGG pathway maps. Visualization and further statistical analysis of KEGG pathway enrichment were performed in R (v4.2.0) using the clusterProfiler [
38] and enrich KEGG functions. Pathways with an adjusted
p-value (FDR < 0.05) were considered significantly enriched.
2.7. Statistical Analysis
To assess whether spawning incidence differed significantly between treatments (constant light vs. natural photoperiod), Fisher’s exact test was applied using R software (version 4.3.1). The test compared the proportion of spawning females between the two experimental conditions, using ten independent females per treatment (N = 20), to determine whether the observed difference was statistically significant (
p < 0.05) [
39].
3. Results
3.1. Experimental Female Induction
The females were maintained for approximately two months in the absence of males, with one group exposed to constant photoperiod (Light) and the control group kept under natural photoperiod conditions (Dark) until the first spawning was detected. A total of 8 out of 10 females (80%) in the control group initiated spawning, whereas none of the females (0%) exposed to continuous photoperiod spawned during the experimental period. This result indicates that the inhibition of spawning under constant photoperiod and light intensity conditions was statistically significant (Fisher’s exact test, p = 0.047, 95% CI = 1.02).
3.2. RNA Sequencing and Data Quality
A total of 63 gigabases (Gb) of sequencing data and approximately 330 million raw reads were generated from all samples derived from the optic lobe and oviducal gland of
O. mimus. After quality control and preprocessing, a total of 59 gigabases (Gb) and approximately 320 million high-quality reads were retained. Over 97% of bases had a Phred score above Q30, indicating high sequencing accuracy (
Table S1). Adapter trimming and error correction substantially enhanced read quality, as assessed by FastQC reports.
3.3. Genome Annotation and Read Mapping Outcomes
The BUSCO analysis of the Octopus mimus genome (Genome assembly ASM2756897v1) provided crucial insights into assembly completeness by assessing the presence of universal orthologous genes. The results indicated that 32.2% of the expected genes were identified as complete, all of which appeared as single-copy sequences with no duplicated genes detected. However, 36.1% of the genes were only partially present, appearing as fragmented sequences. Additionally, 31.7% of the expected genes were absent from the assembly, indicating that a substantial portion of the genetic information was not properly captured. The analysis encompassed a total of 255 BUSCO groups, representing the complete set of expected orthologous genes in eukaryotic genomes, based on the reference dataset rojecti_odb9.
In addition to the genome completeness assessment, the annotation process identified a total of 16,724 genes, out of approximately 23,000 genes expected based on related octopus species (O. vulgaris, O. bimaculoides), each with the same number of corresponding transcripts, reflecting an average of one transcript per gene. The genomic annotation revealed a total of 75,525 exons, of which 72,588 were located within coding sequences (CDS), 1216 were mapped to 5′ untranslated regions (5′ UTR), and 1105 to 3′ untranslated regions (3′ UTR). Regarding intronic regions, 55,864 introns were identified within CDS regions, while the total number of introns present across exonic regions reached 58,801.
Read alignment to the annotated genome yielded an average mapping rate of 65 ± 10% across all samples. This variation may be affected by factors such as differences in sequencing depth of 34–42 million raw reads, variable trimming losses (4–8%), GC content bias (37–45%) among tissues (
Table S1). Structural annotation covered 39.9% of the genome by gene and transcript features. Coding sequences (CDS) and exons represented 0.7% and 0.8% of the genome, respectively. The longest predicted gene and transcript measured 1,052,705 bp, with the longest CDS spanning 47,952 bp.
3.4. Differential Gene Expression Analysis Identified
The expression patterns observed across the sample set demonstrated a strong clustering effect based on treatment conditions, with the highest degree of integration detected in tissues from females exposed to constant light (
Figure S1). Furthermore, principal component analysis (PCA) of log-CPM values showed they were strictly clustered by tissue type and treatment, with no evidence of batch-based clustering (
Figure S2).
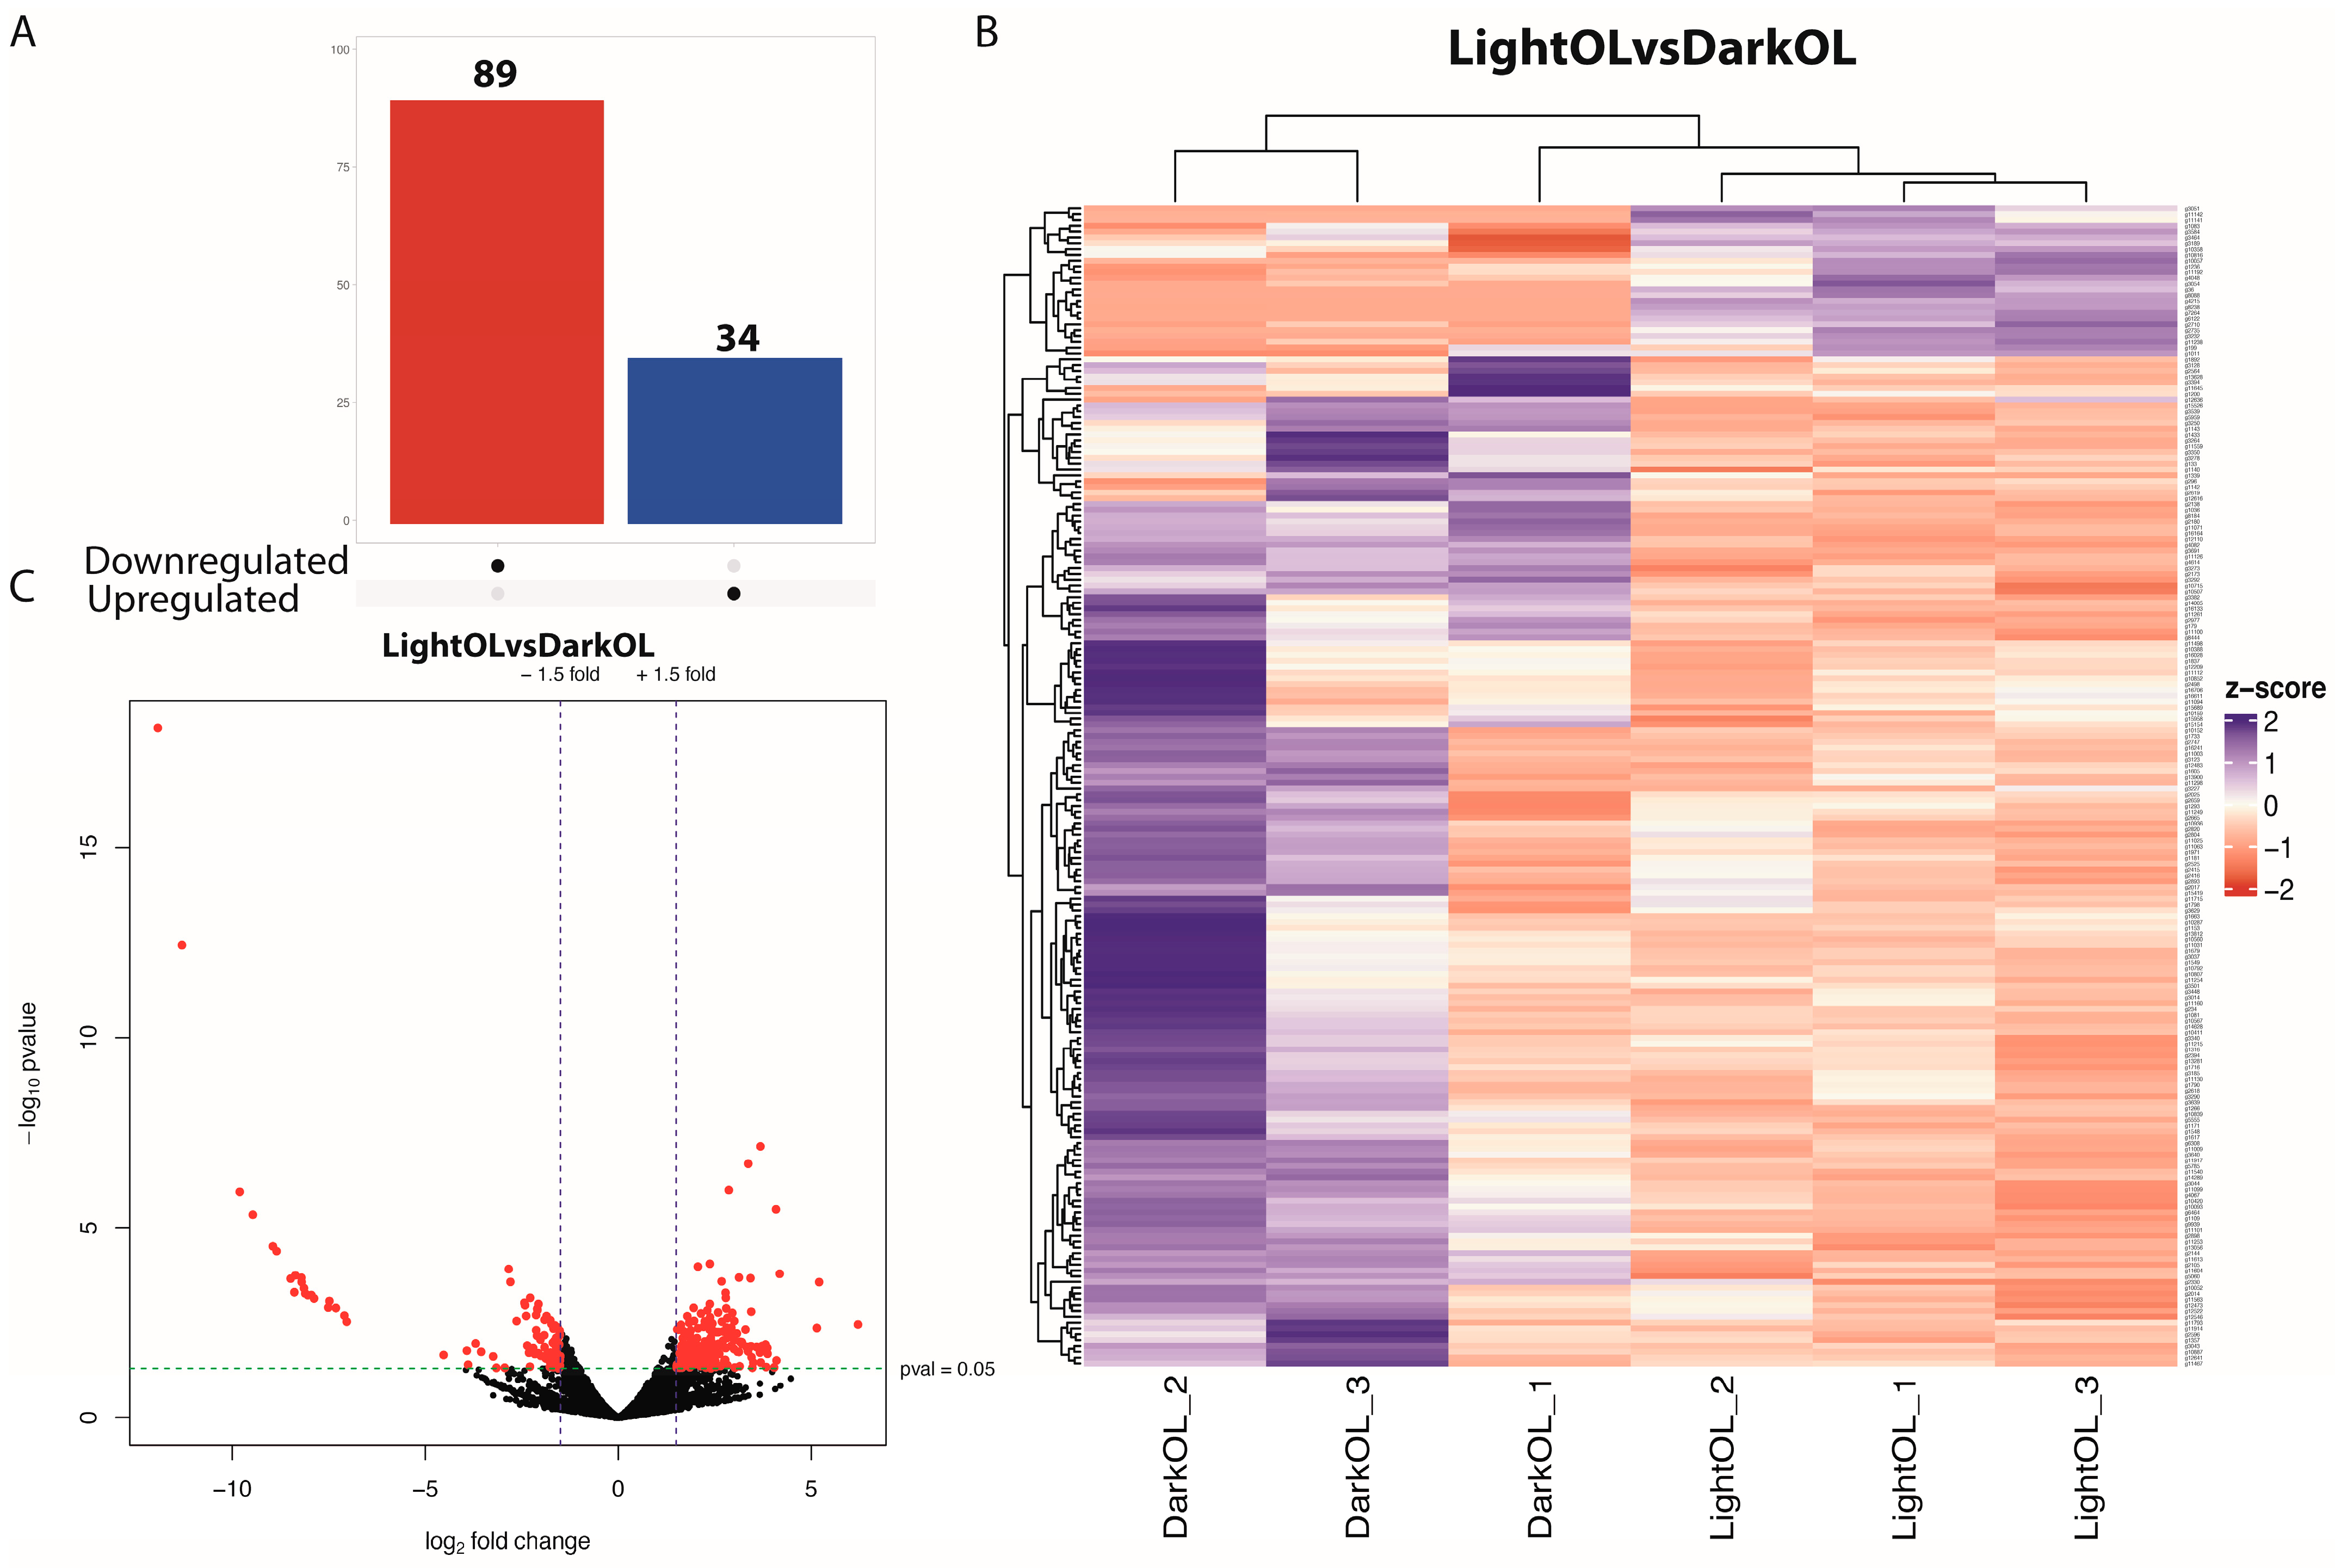
Of the 6578 genes that passed the threshold, differential gene expression (DGE) analysis in the optic lobe (OL) revealed 89 downregulated and 34 upregulated genes (adjusted
p-value < 0.05, |log2FC| > 2;
Figure 1A,B) in females exposed to a constant photoperiod compared to controls. The hierarchical clustering heat map analysis of OL DEGs was shown in
Figure 1C. Hierarchical clustering revealed an over-representation of downregulated genes associated with control-related functions.
The predominance of downregulated genes suggests that light exposure Inhibits the molecular signaling cascade responsible for spawning induction. Genes associated with cholinergic neurons specific to the optic lobes were detected, such as cholinergic receptor nicotinic alpha 7 subunit (CHRNA7). Expression of FMRFamide receptor (FMRFaR), FMR1 autosomal homolog 1 (Fxr1), and hydroxysteroid (17-beta) dehydrogenase 4 (HSD17B4) were identified as upregulated and associated with reproduction in OL. Upregulated genes related to vision in orcokinin and octopaminergic neurons were identified, including rojectingn 5A (Sema5a) and protocadherins. Among the key downregulated genes were the transcription factor SRY-box 30 (SOX30) and beta-tubulin (SP-beta1), whereas upregulated genes included forkhead box P1 (FOXP1) and the hormone-inducible receptor Hr38.
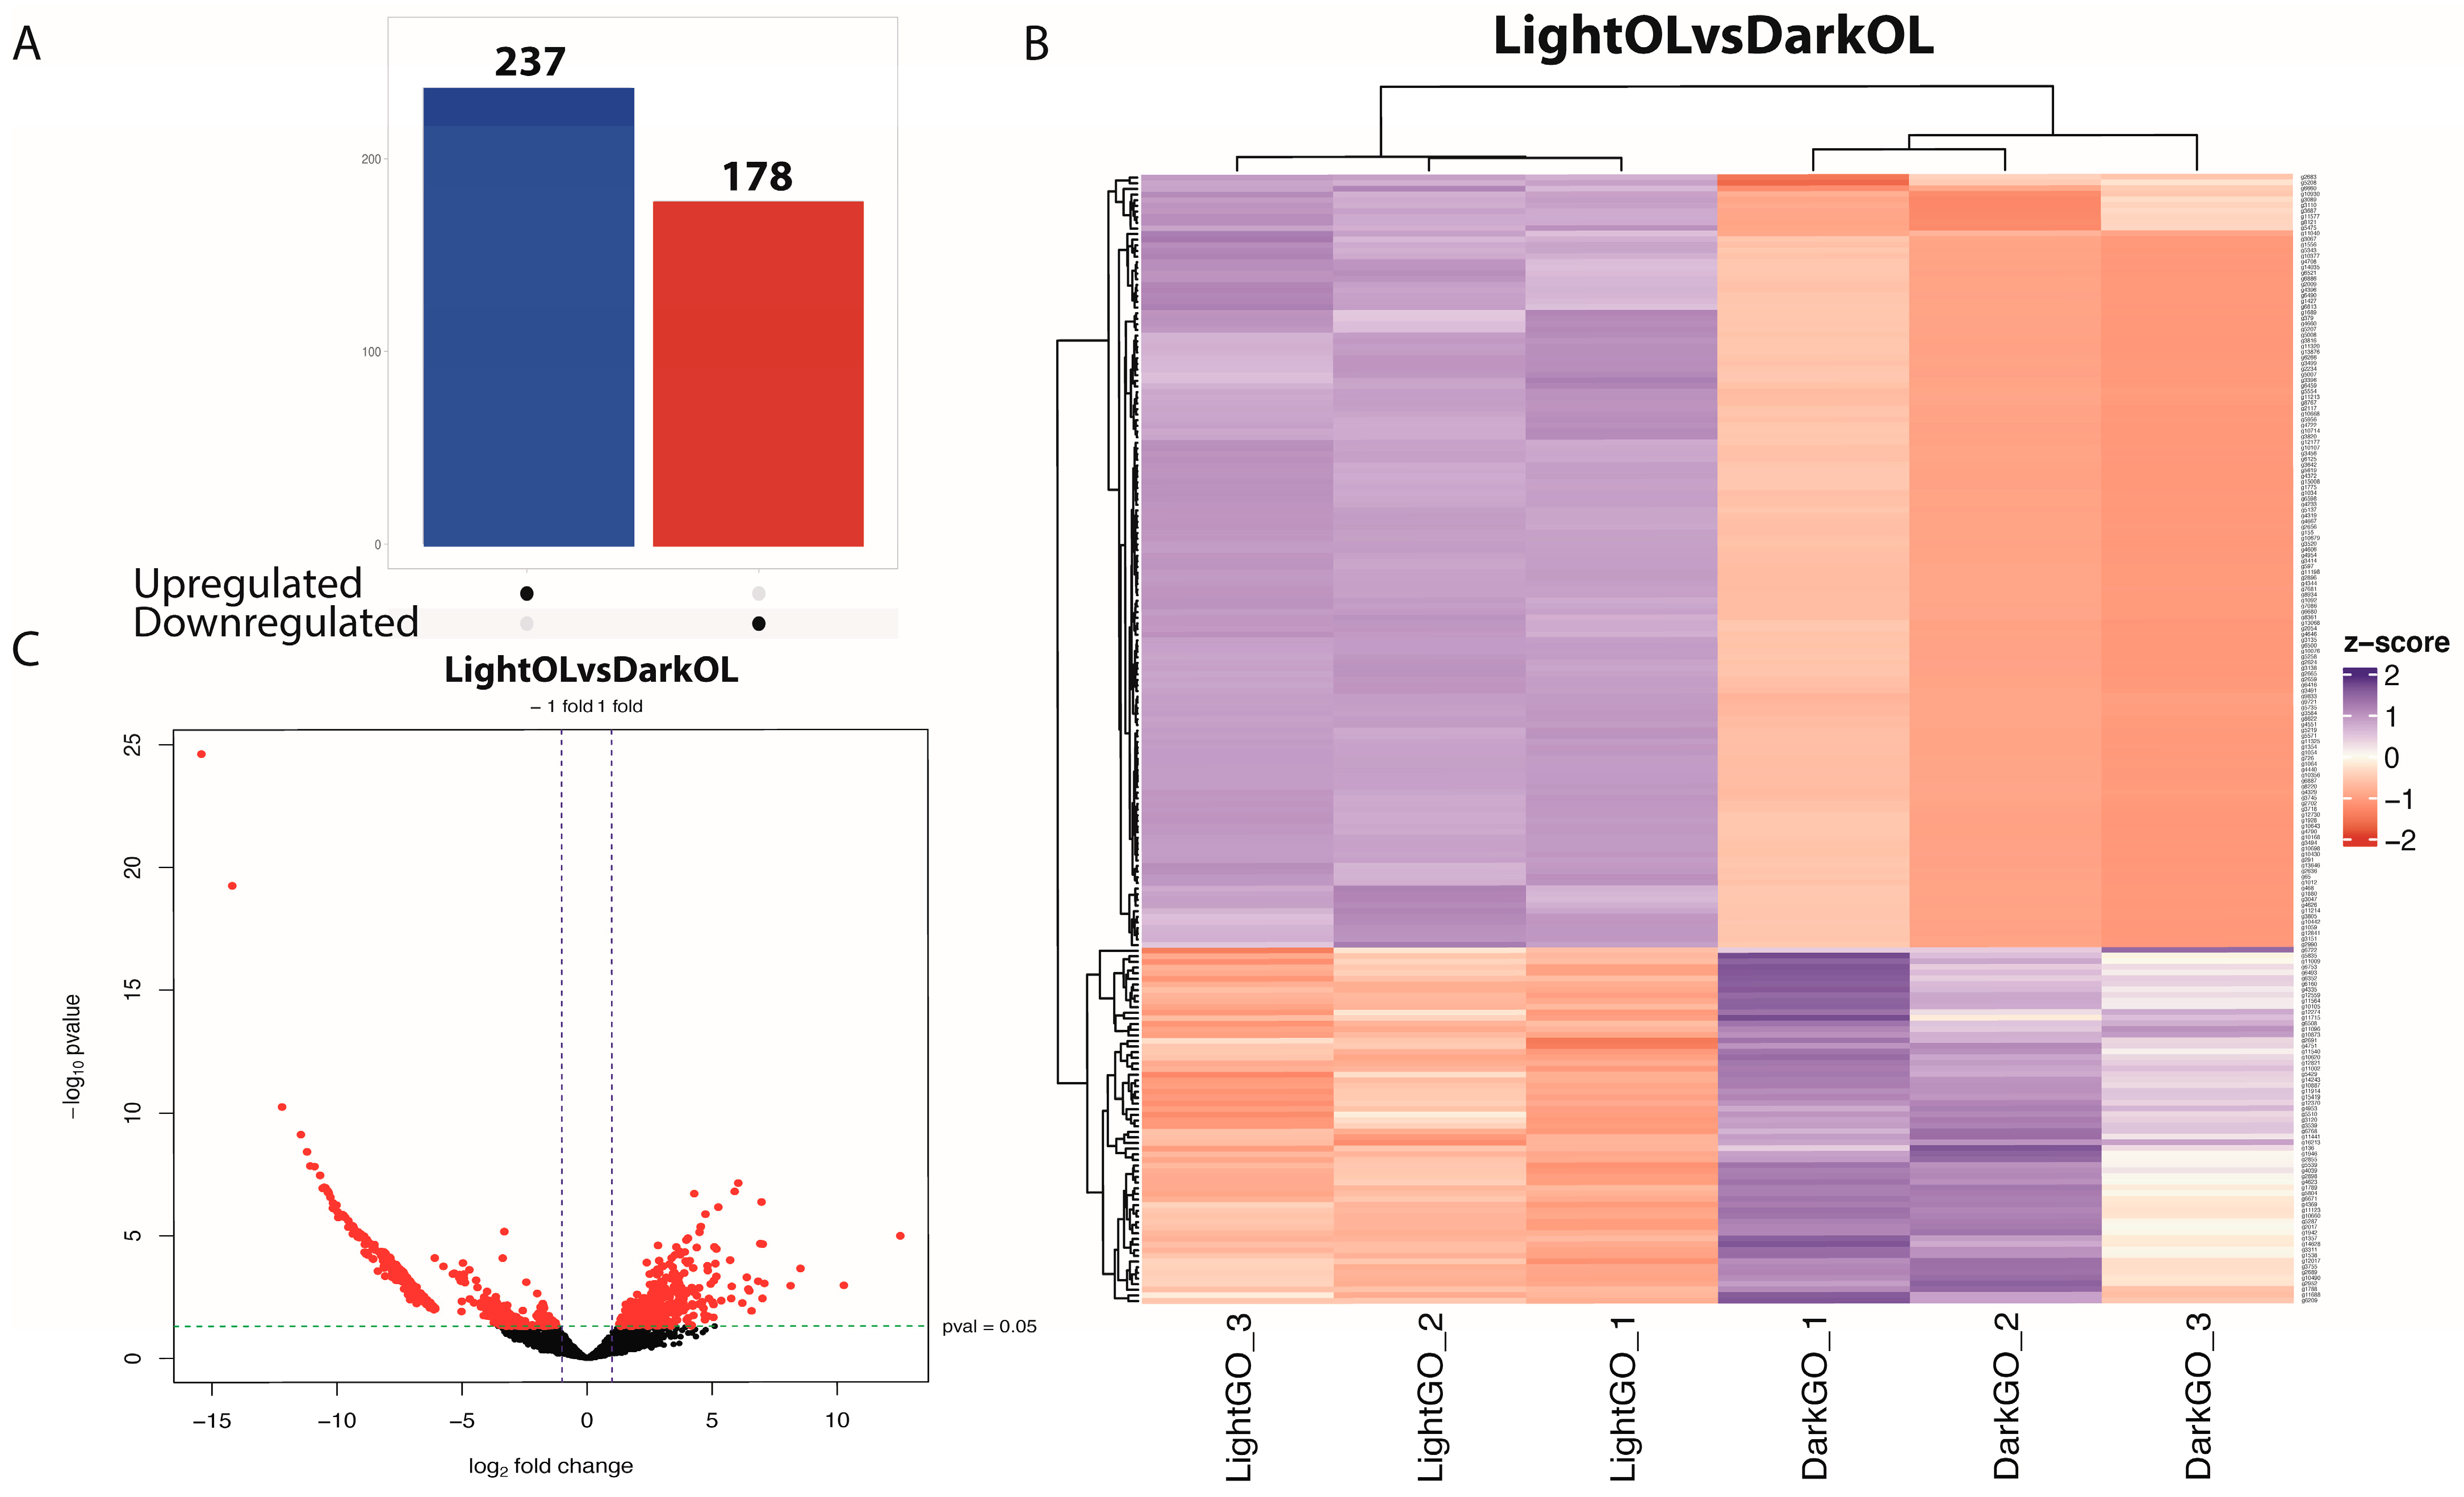
Of the 8025 genes that passed the initial filtering criteria, a total of 415 genes were identified as differentially expressed in the oviducal gland (adjusted
p-value < 0.05, |log2FC| ≥ 2). Among these, 178 genes were downregulated and 237 were upregulated (
Figure 2A,B). The remaining genes were excluded from downstream DEG-focused analyses. Key downregulated genes included forkhead box N3 (FOXN3) and TGFB-induced factor homeobox 2 (TGIF2), both associated with maturation induction. In contrast, overexpressed genes such as hormone-inducible receptor 39 (Hr39) and thyroid hormone receptor interactor 12 (TRIP12) were involved in hormonal regulation. Furthermore, stress response-related genes, such as heat shock protein 70 (HSP70) and ICE-like death-related caspase (Drice), were overexpressed in females exposed to constant light. Hierarchical clustering revealed n over-representation of genes downregulated under control conditions (
Figure 2C). Signature genes for the oviducal gland were also detected, such as FMRFamide receptor (FMRFaR) and hydroxysteroid (17-beta) dehydrogenase 8 (HSD17B8), both related to fertilization, which were found in the clustering analysis of expression in spawning females. Other OG-specific genes, such as myomodulin, which function as a neurotransmitter in mollusks, were also identified.
3.5. Functional Enrichment and Pathway Analysis
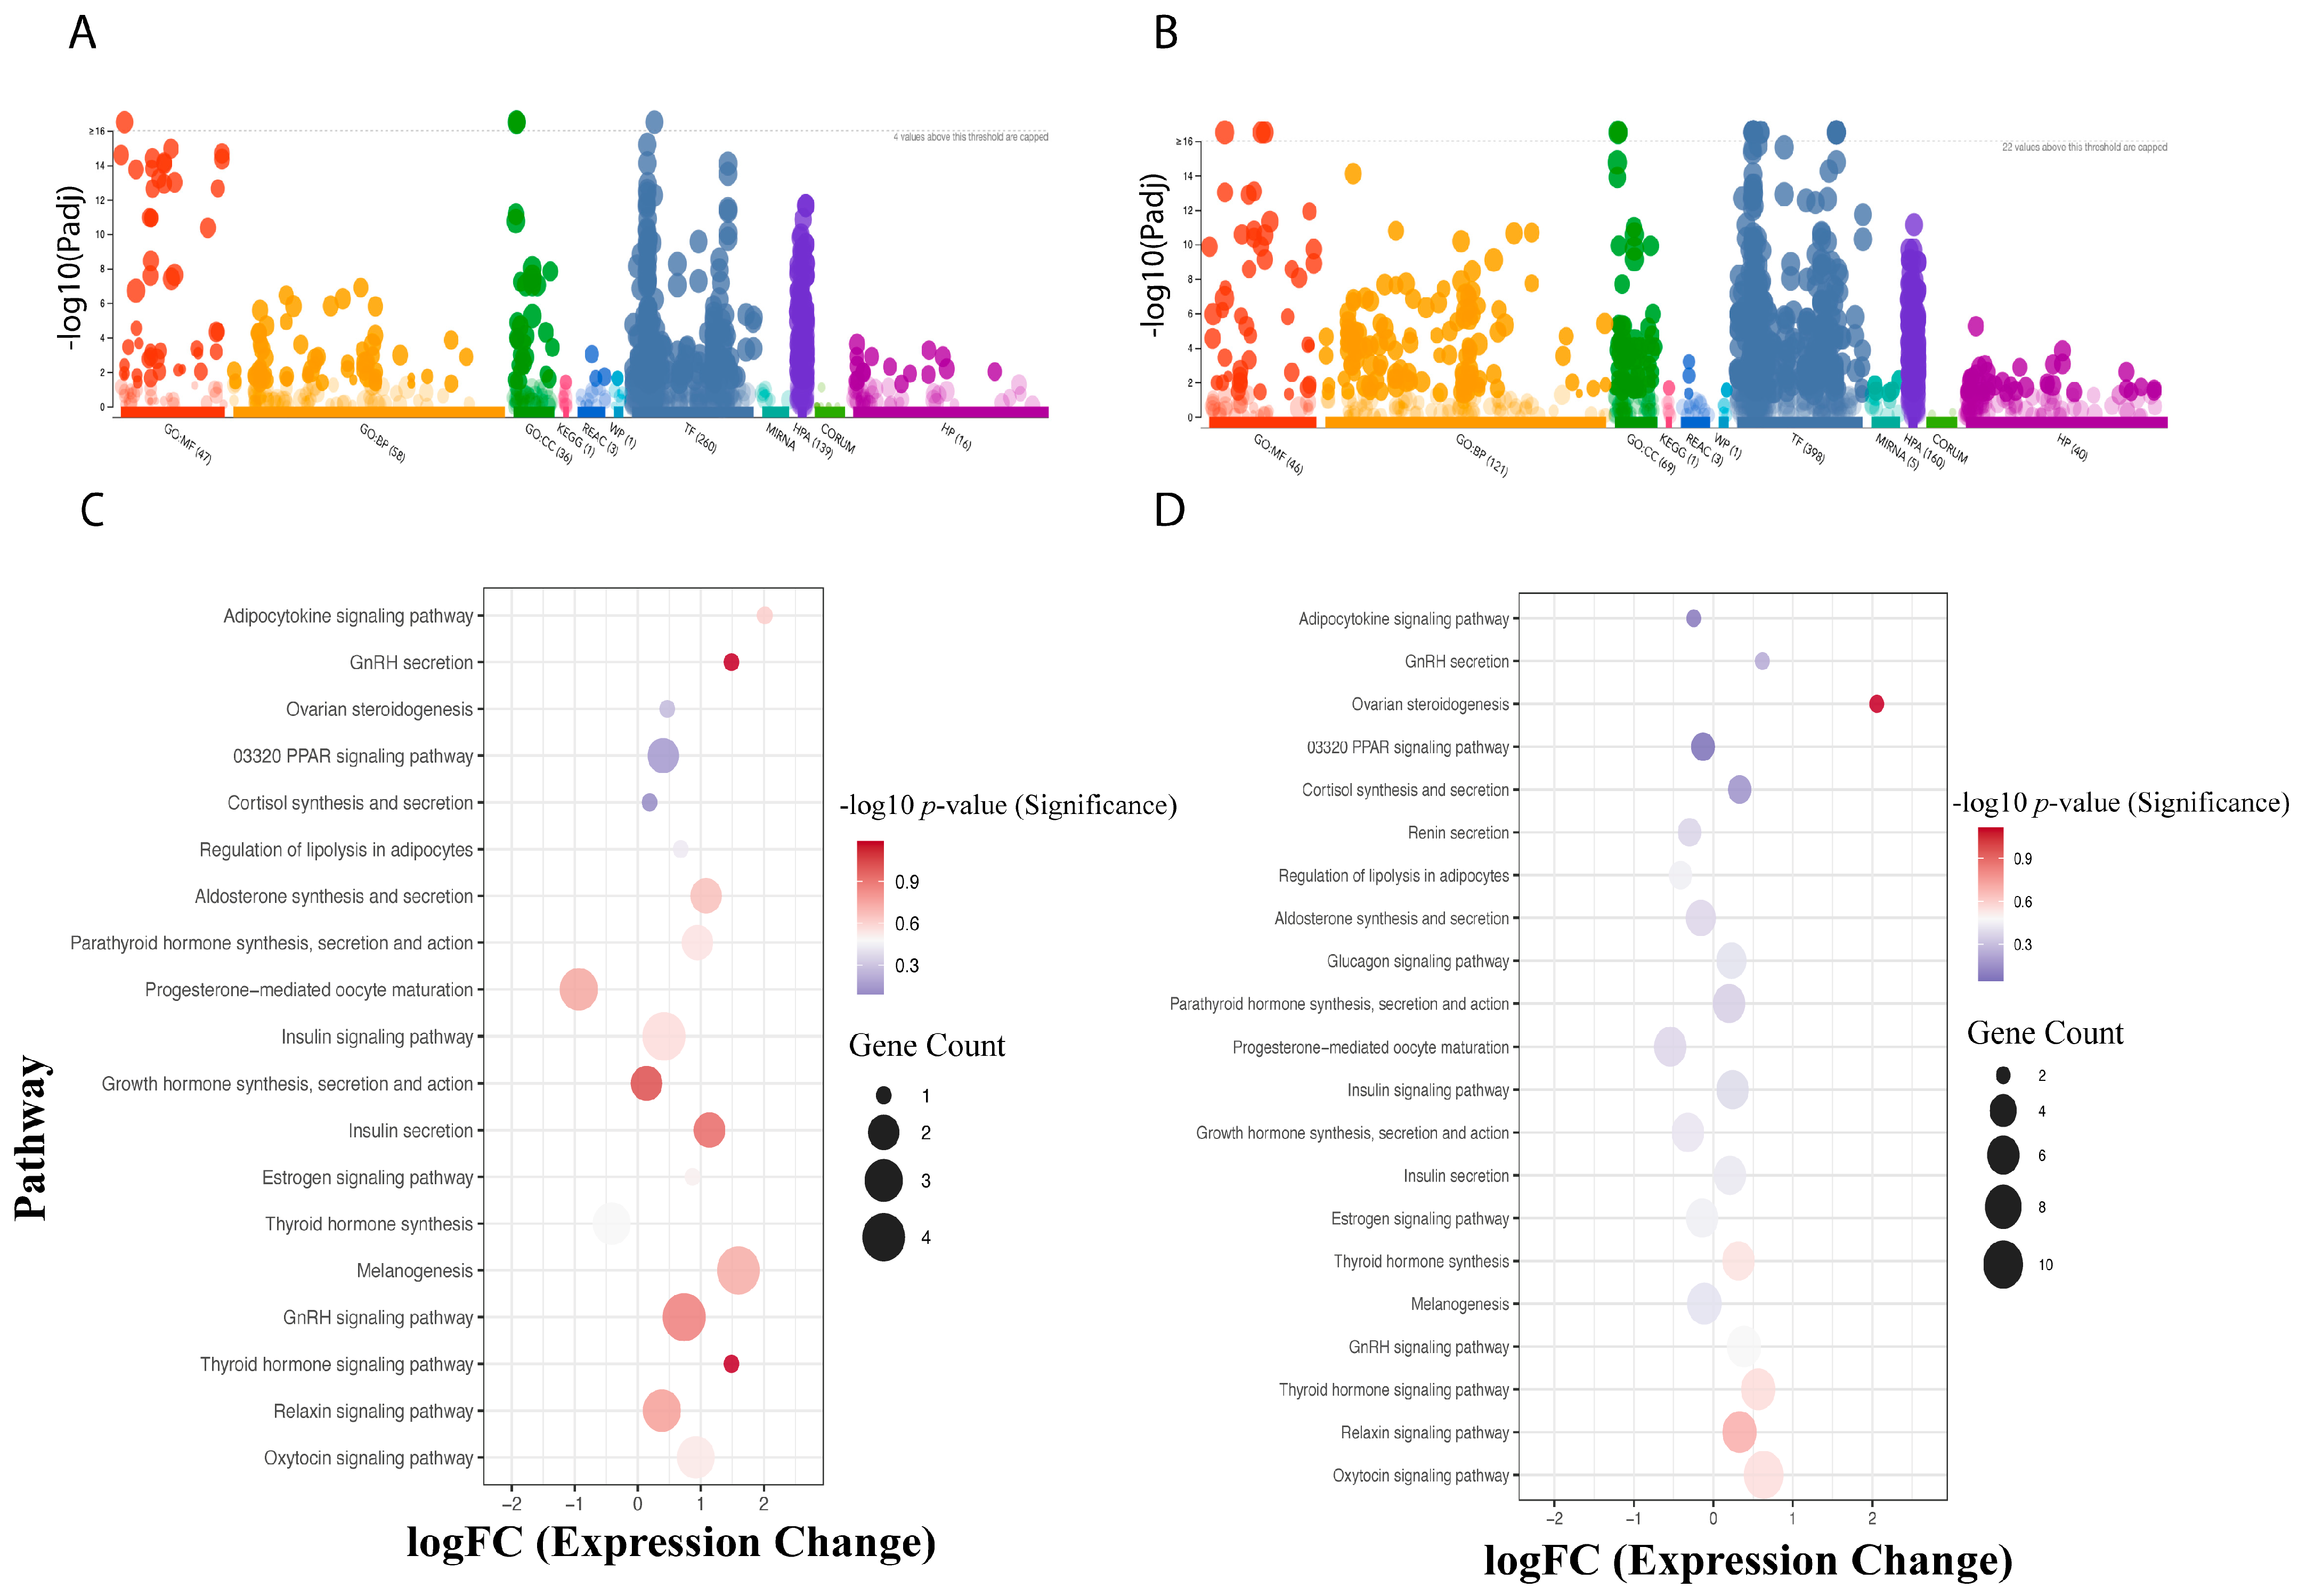
Functional annotation and Gene Ontology (GO) enrichment analysis were first performed for treatments under Light and Dark conditions. Differentially expressed genes (DEGs) were annotated into three primary GO categories: Molecular Function (MF), Biological Process (BP), and Cellular Component (CC). A higher number of DEGs accounted for the differential expression in the oviducal gland compared to the optic lobe (
Figure 3A,B). A significant GO enrichment analysis was conducted across all DEGs, identifying 27 GO terms with significant enrichment, including catalytic activity, nucleoside phosphate binding, and hexosyltransferase activity (
Table S2). Regarding BP, enriched terms included intracellular transport, macromolecule modification, cell cycle process, regulation of TOR signaling, and DNA metabolic process. For CC, significantly enriched terms included catalytic complex, intracellular protein-containing complex, and MutLalpha complex.
The KEGG metabolic pathway database was used to compare and annotate all DEGs, resulting in a total of 336 genes associated with metabolic pathways. The comparison between Light and Control groups revealed that the optic lobe had a lower number of KEGG Orthologs (kOs) than the oviducal gland. However, in the results for endocrine-specific process assignments, gene–pathway coverage was less diverse in the optic lobe than in the oviducal gland (
Figure 3C,D). Moreover, the enrichment analysis for endocrine-related KEGG pathways in the optic lobe was mainly associated with GnRH secretion, Thyroid hormone signaling pathway, GnRH signaling pathway, and Growth hormone synthesis, secretion, and action. In contrast, in the oviducal gland, we found pathways such as Ovarian steroidogenesis and Relaxin signaling pathway to be represented (
Figure 3C,D).
4. Discussion
The results of this study demonstrate that continuous light exposure induces distinct phenotypic and transcriptomic alterations in
Octopus mimus females. Continuous light exposure completely inhibited spawning in
O. mimus females, as none of the individuals under a 24:0 photoperiod spawned, while 80% of females under a 14:10 light:dark regime successfully initiated spawning [
1,
15]. Moreover, the multidimensional scaling (MDS) analysis revealed that transcriptomic profiles of both the optic lobe and the oviducal gland in the constant light group were highly homogeneous, whereas profiles from the control group showed greater dispersion (
Figures S1 and S2). This robust segregation in gene expression suggests that the optic lobe plays a critical role in interpreting photoperiodic signals, as evidenced by the low dispersion in gene expression of among samples exposed to constant photoperiod.
In the optic lobe, differential gene expression analysis revealed a predominance of negatively regulated genes related to general control functions under constant light. However, key genes involved in visual processing and sensory integration, including the alpha-7 subunit of the nicotinic cholinergic receptor (CHRNA7), rojectingn 5A (Sema5a), and several protocadherins, were differentially expressed, confirming that the optic lobe actively participates in processing photic information [
40]. The optic lobe was included as the primary sensory node because it integrates visual input and mediates neuroendocrine signaling in cephalopods, as previously reported in
O. vulgaris [
8,
12]. This role is supported by our transcriptomic data, which reveal differential expression of genes involved in photic perception (e.g., CHRNA7, Sema5a, protocadherins) under constant light conditions (
Figures S1 and S2). We further propose a timing function for the optic lobe, whereby it interprets photoperiodic changes and conveys this information to downstream neuroendocrine centers, including the subesophageal lobe and optic gland, thereby coordinating the onset of spawning. This extends previous models that primarily described the optic lobe as a visual processing center, providing new insights into temporal regulation of reproduction. Differential expression of neuroendocrine-related genes, such as FMRFamide receptors in both the optic and oviducal glands, supports this timing function, indicating that the optic lobe not only senses photoperiod but also initiates downstream reproductive pathways leading to spawning.
Furthermore, we identified the expression of FMRFamide in the optic lobe, which has been implicated in fertilization in
Sepiella japonica [
40] and is also expressed in the optic gland of
O. vulgaris [
8]. Additionally, the expression of FMRFamide, together with dopamine, was verified in the common octopus (
O. vulgaris) as a modulator for retinal light adaptation and an inhibitor of sexual maturation, making it a key gene for the relationship between light and spawning inhibition [
1,
12]. Consistent with this identification, FMRFamide receptors (FMRFaR) were found in the oviducal gland, where their activation in the presence of FMRFamide is linked to the passage of oocytes through the oviducal canal by causing canal contraction [
7,
41]. Furthermore, myomodulin, a neurotransmitter associated with the cephalopod peduncle complex, was differentially expressed in the oviducal gland [
42]. This peduncle complex, located along the optic tract between the optic lobe and the central brain, includes the peduncle lobe (visomotor regulation), the olfactory lobe (olfactory input processing), and the optic gland (sexual maturation and maternal death control) [
12,
13]. Based on our transcriptomic data, we propose a sequential framework in which photic information is first integrated by the optic lobe and then transmitted to downstream neuroendocrine centers, including the peduncle and olfactory lobes, leading to optic gland activation or inhibition. The oviducal gland subsequently acts as the terminal effector coordinating fertilization and oviposition. These results refine current models by defining a functional sequence linking sensory perception, neuroendocrine integration, and reproductive output in female octopuses [
42].
However, although our data support a putative regulatory network linking the optic lobe, optic gland, and oviducal gland, the observed gene expression changes (e.g., in FMRFamide, CHRNA7, and HSD17B8) appear to be functionally related. Nevertheless, the coordinated and tissue-specific regulation of these genes under constant light conditions suggests a structured neuroendocrine response rather than a stochastic transcriptional effect. In particular, the modulation of cholinergic signaling (CHRNA7), neuropeptidergic pathways (FMRFamide), and steroid metabolism (HSD17B8) has been previously implicated in mechanisms controlling reproductive inhibition and maturation in cephalopods [
13,
14,
42]. However, specific functional studies, such as gene knockout or receptor assays, will be required to validate their causal roles in photoperiod-mediated spawning. Moreover, hierarchical clustering of the transcriptomes from the oviducal gland revealed that, in general, the reproductive state of females is reflected at the molecular level. In control females, expression profiles indicated active pathways related to gamete maturation and fertilization, whereas constant light exposure was associated with the suppression of genes involved in these processes. Our results confirm this pattern and provide additional transcriptomic evidence that photoperiod regulates oviducal gland activity. Notably, the differential expression of markers such as the forkhead box N3 (FOXN3), the TGFB-induced homeobox 2 factor (TGIF2), and the hormone-inducible receptor 39 (Hr39) underscores that the activity of the oviducal gland is closely tied to the initiation of spawning in
Octopus sinensis and
Octopus minor, serving as an effective indicator of the overall reproductive response [
43,
44].
Genes identified in both the optic lobe and oviducal gland, such as hydroxysteroid (17-beta) dehydrogenase 8 (HSD17B8), which is involved in steroid formation for reproduction [
12,
45], were also detected in the clustering analysis of expression in reproductive females. Thus, the activity of HSD17B8 in the white body during reproduction in
Octopus maya females [
14] aligns with the activity detected in the optic lobe in this study.
Gene Ontology (GO) enrichment analysis supported the concept of cellular recycling during reproductive inhibition. Genes associated with catalytic activity, apoptosis, and exocytosis were significantly enriched, suggesting a process of reallocation of cellular resources initially destined for gamete production. These findings were complemented by KEGG pathway analysis, which showed enrichment in pathways related to apoptosis, metabolic reprogramming, and autophagy, a pattern that aligns with reports indicating that oocytes and components of accessory glands are reabsorbed under inhibitory conditions [
46,
47]. Our enrichment analysis results show that KEGG pathways involved in female self-destruction [
13], such as apoptosis, autophagy, and necroptosis, are activated, consistent with oocyte resorption and glandular remodeling at the onset of spawning.
According to our findings, endocrine-related KEGG pathways in the optic lobe were mainly associated with GnRH secretion and the GnRH signaling pathway, a reproduction-related pathway linked to the olfactory lobe in the common octopus (
Octopus vulgaris) [
7,
9]. This activity in the optic lobe indicates synergistic interactions between the different lobes and glands coordinating sensory input, neuroendocrine signaling, and reproductive activation, such as octopus reproduction. Additionally, other relevant pathways included the thyroid hormone signaling pathway, identified in the Pacific oyster
Crassostrea gigas and associated with calcium-related developmental and reproductive processes with effects on development and reproduction [
48]. Within the oviducal gland, we detected pathways such as ovarian steroidogenesis, which plays a key role in the conversion of cholesterol into hormones in humans, with evidence in octopuses of steroidogenesis activity in cholesterol metabolism during senescence [
13].
5. Conclusions
Overall, our results illustrate a sophisticated interaction between environmental signals and neuroendocrine regulation in O. mimus. The optic lobe provides strong evidence of acting as a key integrator of photoperiodic information, likely as part of a complex with the optic gland, olfactory lobe, and supraesophageal structures, which were not included in the present analysis. The expression of genes related to image interpretation, retinal modulation, and neurochemical signaling suggests a dual sensory and modulatory function for this structure, which could cooperate with the optic gland, olfactory gland, or subesophageal lobes in the induction or inhibition of spawning onset. Moreover, in the oviducal gland, specific genes and neuropeptide receptors such as FMRFamide and myomodulin, previously described in the pedunculated system, were identified, indicating a potential functional connection between neurosensory centers and effector tissues. Collectively, this study highlights the dual role of the optic lobe in photoperiod interpretation and suggests a mechanism for spawning inhibition through changes in gene expression in the final effector of fertilization, the oviducal gland. The optic lobe becomes a crucial environmental sensor, integrating light signals and initiating a neuroendocrine cascade that culminates in spawning. However, future targeted studies involving other organs, such as the olfactory gland or optic gland, should be conducted at specific times during the pre- and post-spawning phase to assess how captivity conditions, population density, and reproductive behaviors influence these molecular pathways. Additionally, future research should examine how photoperiod and light intensity affect other physiological traits, including stress responses and nutritional status, to provide a more comprehensive understanding of female condition under aquaculture conditions. Yet, our results could be useful for implementing aquaculture for this species and incorporating biomarkers that allow for identifying the maturation periods of females and the start of spawning.




 ,
,