1. Introduction
The rate of cardiovascular disease (CVD) diagnosis has steadily increased over the past century, with one in three adults in the United States treated for cardiovascular risk factors as of 2020. It is currently estimated that the cost to treat CVD and its associated risk factors will triple by 2050, with a projected cost of
$1.34 trillion in medical expenses [
1]. Metabolic syndrome (MetS)—which is characterized as the presence of any three of the following five cardiometabolic abnormalities: hypertension measured as a systolic blood pressure (SBP) greater than or equal to 135 mmHg or diastolic blood pressure (DBP) greater than 85 mmHg, hyperglycemia measured via fasting blood glucose (FBG), central obesity measured through waist circumference (WC) at the iliac crest, elevated triglycerides (TRG), and reduced high-density lipoprotein (HDL) cholesterol [
2]—has long been identified as a predictor for the future development of CVD.
An increased rate of diagnosis of MetS in younger populations has also been observed in recent years [
3]. In young adults aged 20–39, the prevalence of metabolic syndrome increased from 16.2% to 21.3% from 2011 to 2016 [
4]. This alarming trend reinforces the need to identify individuals who are at increased risk for developing MetS earlier in the progression of the underlying risk factors. Apart from more clinical measurements like blood pressure and blood biomarkers, anthropometric measurements such as waist circumference may be more closely linked to an increased risk of developing CVD and type II diabetes than BMI alone [
5]. Identifying the physical characteristics associated with metabolic syndrome may allow for earlier detection using non-invasive measures in both clinical and field-based settings.
The connection between MetS, gait, and functional activities in elderly populations has been well established [
6]. Individuals diagnosed with MetS demonstrate significantly decreased gait velocity, poorer performance on functional tasks such as the 40-foot walk test and sit-to-stand, and lower scores on the Short Physical Performance Battery (SPPB). Additionally, abdominal obesity and low HDL cholesterol have been associated with decreased gait velocity, further highlighting the relationship between cardiometabolic risk factors and mobility impairment [
7].
The biomechanical literature surrounding each of the five risk factors of MetS with functional gait activities varies in concentration, with much of the evidence focusing on diabetic and obese populations. Multiple studies have demonstrated an association between diabetes and reduced functional performance and gait velocity. Decreased gait velocity has been specifically documented in individuals with Type II diabetes [
8,
9,
10,
11]. Manabe et al. [
9] identified kinematic differences between older adults with and without Type II diabetes, reporting shorter step lengths, increased stride and stance times, and decreased cadence in diabetic populations. There is also evidence of decreased muscle strength being associated with hyperglycemia, with a glycosylated hemoglobin (HbA1c) greater than 8.5% found to be correlated with significantly worse lower-extremity muscle strength [
12].
Obesity-related gait velocity changes have also been reported [
13,
14], and there is evidence linking decreased gait endurance to obesity in youth populations [
15,
16]. Additional changes in ground reaction forces (GRFs), joint kinematics, and spatiotemporal measures of gait have been identified in obese populations [
17,
18,
19]. In young adults specifically, there may be an important distinction between overweight and obese individuals as it relates to changes in gait velocity, with Rosso et al. reporting no decrease in gait velocity in overweight individuals despite hip kinematic differences identified [
19].
Because obesity is a central component of metabolic syndrome and has well-established effects on locomotor biomechanics, anthropometric indicators of adiposity may be particularly relevant when examining gait characteristics in this population. Both body mass index (BMI) and waist circumference (WC) are commonly used anthropometric indicators of obesity, but they represent different physiological constructs. BMI reflects overall body size relative to height and is widely used in epidemiological screening for obesity, although it does not distinguish adipose tissue from lean mass and may therefore misclassify individuals with high muscularity or low lean mass [
20]. In contrast, WC reflects central adiposity and is the obesity-related component included in the clinical definition of metabolic syndrome [
21]. Because BMI captures overall body size and mechanical loading demands while WC reflects abdominal adiposity and cardiometabolic risk, the two measures provide complementary information [
5].
Together, these findings suggest that obesity-related characteristics may influence gait mechanics even in younger populations; however, whether these biomechanical alterations are present in young adults with metabolic syndrome remains unclear. Therefore, this study aimed to examine associations between metabolic syndrome and gait biomechanics, functional performance, and muscle strength, and to explore whether these measures can differentiate metabolic syndrome status in young adults.
2. Results
Significant differences in participant demographics and MetS risk factors were found between MetS+ and MetS−. Specifically, MetS+ presented with increased BMI, mass, WC, SBP, DBP, TRG, and FBG and decreased HDL (
Table 1). No significant differences were identified between groups for age or height (
Table 1).
Compared with their healthy MetS− counterparts, MetS+ had reduced gait velocity, increased stance time, and reduced propulsive GRF (
Table 2). No other significant differences were found among the discrete variables of interest (
Table 2).
Multiple linear regression of the MetS risk factors revealed no statistically significant relationships with the overall model (R
2 = 0.230, F(6,17) = 0.846,
p = 0.552), with the model explaining approximately 23% of the variance in gait velocity. The second linear regression model, which incorporated height and mass along with the MetS risk factors, was also not statistically significant (R
2 = 0.412, F(8,15) = 1.316,
p = 0.308), explaining approximately 41% of the variance in gait velocity. Substantial multicollinearity was observed, particularly among anthropometric variables, with VIF values exceeding 15, indicating redundancy among predictors and limiting the interpretability of individual regression coefficients. Complete multiple linear regression analyses are presented in
Table 3.
Results of the binary logistic regression identified the spatiotemporal and GRF models as significant predictors of MetS, correctly identifying 78.3% and 64.6% of cases, respectively. Binary logistic regression performance for each of the four models can be found in
Table 4, and full model performance summaries are presented in
Table 5. Notably, the functional gait model demonstrated 0% sensitivity, indicating that it failed to correctly identify individuals with MetS in this sample.
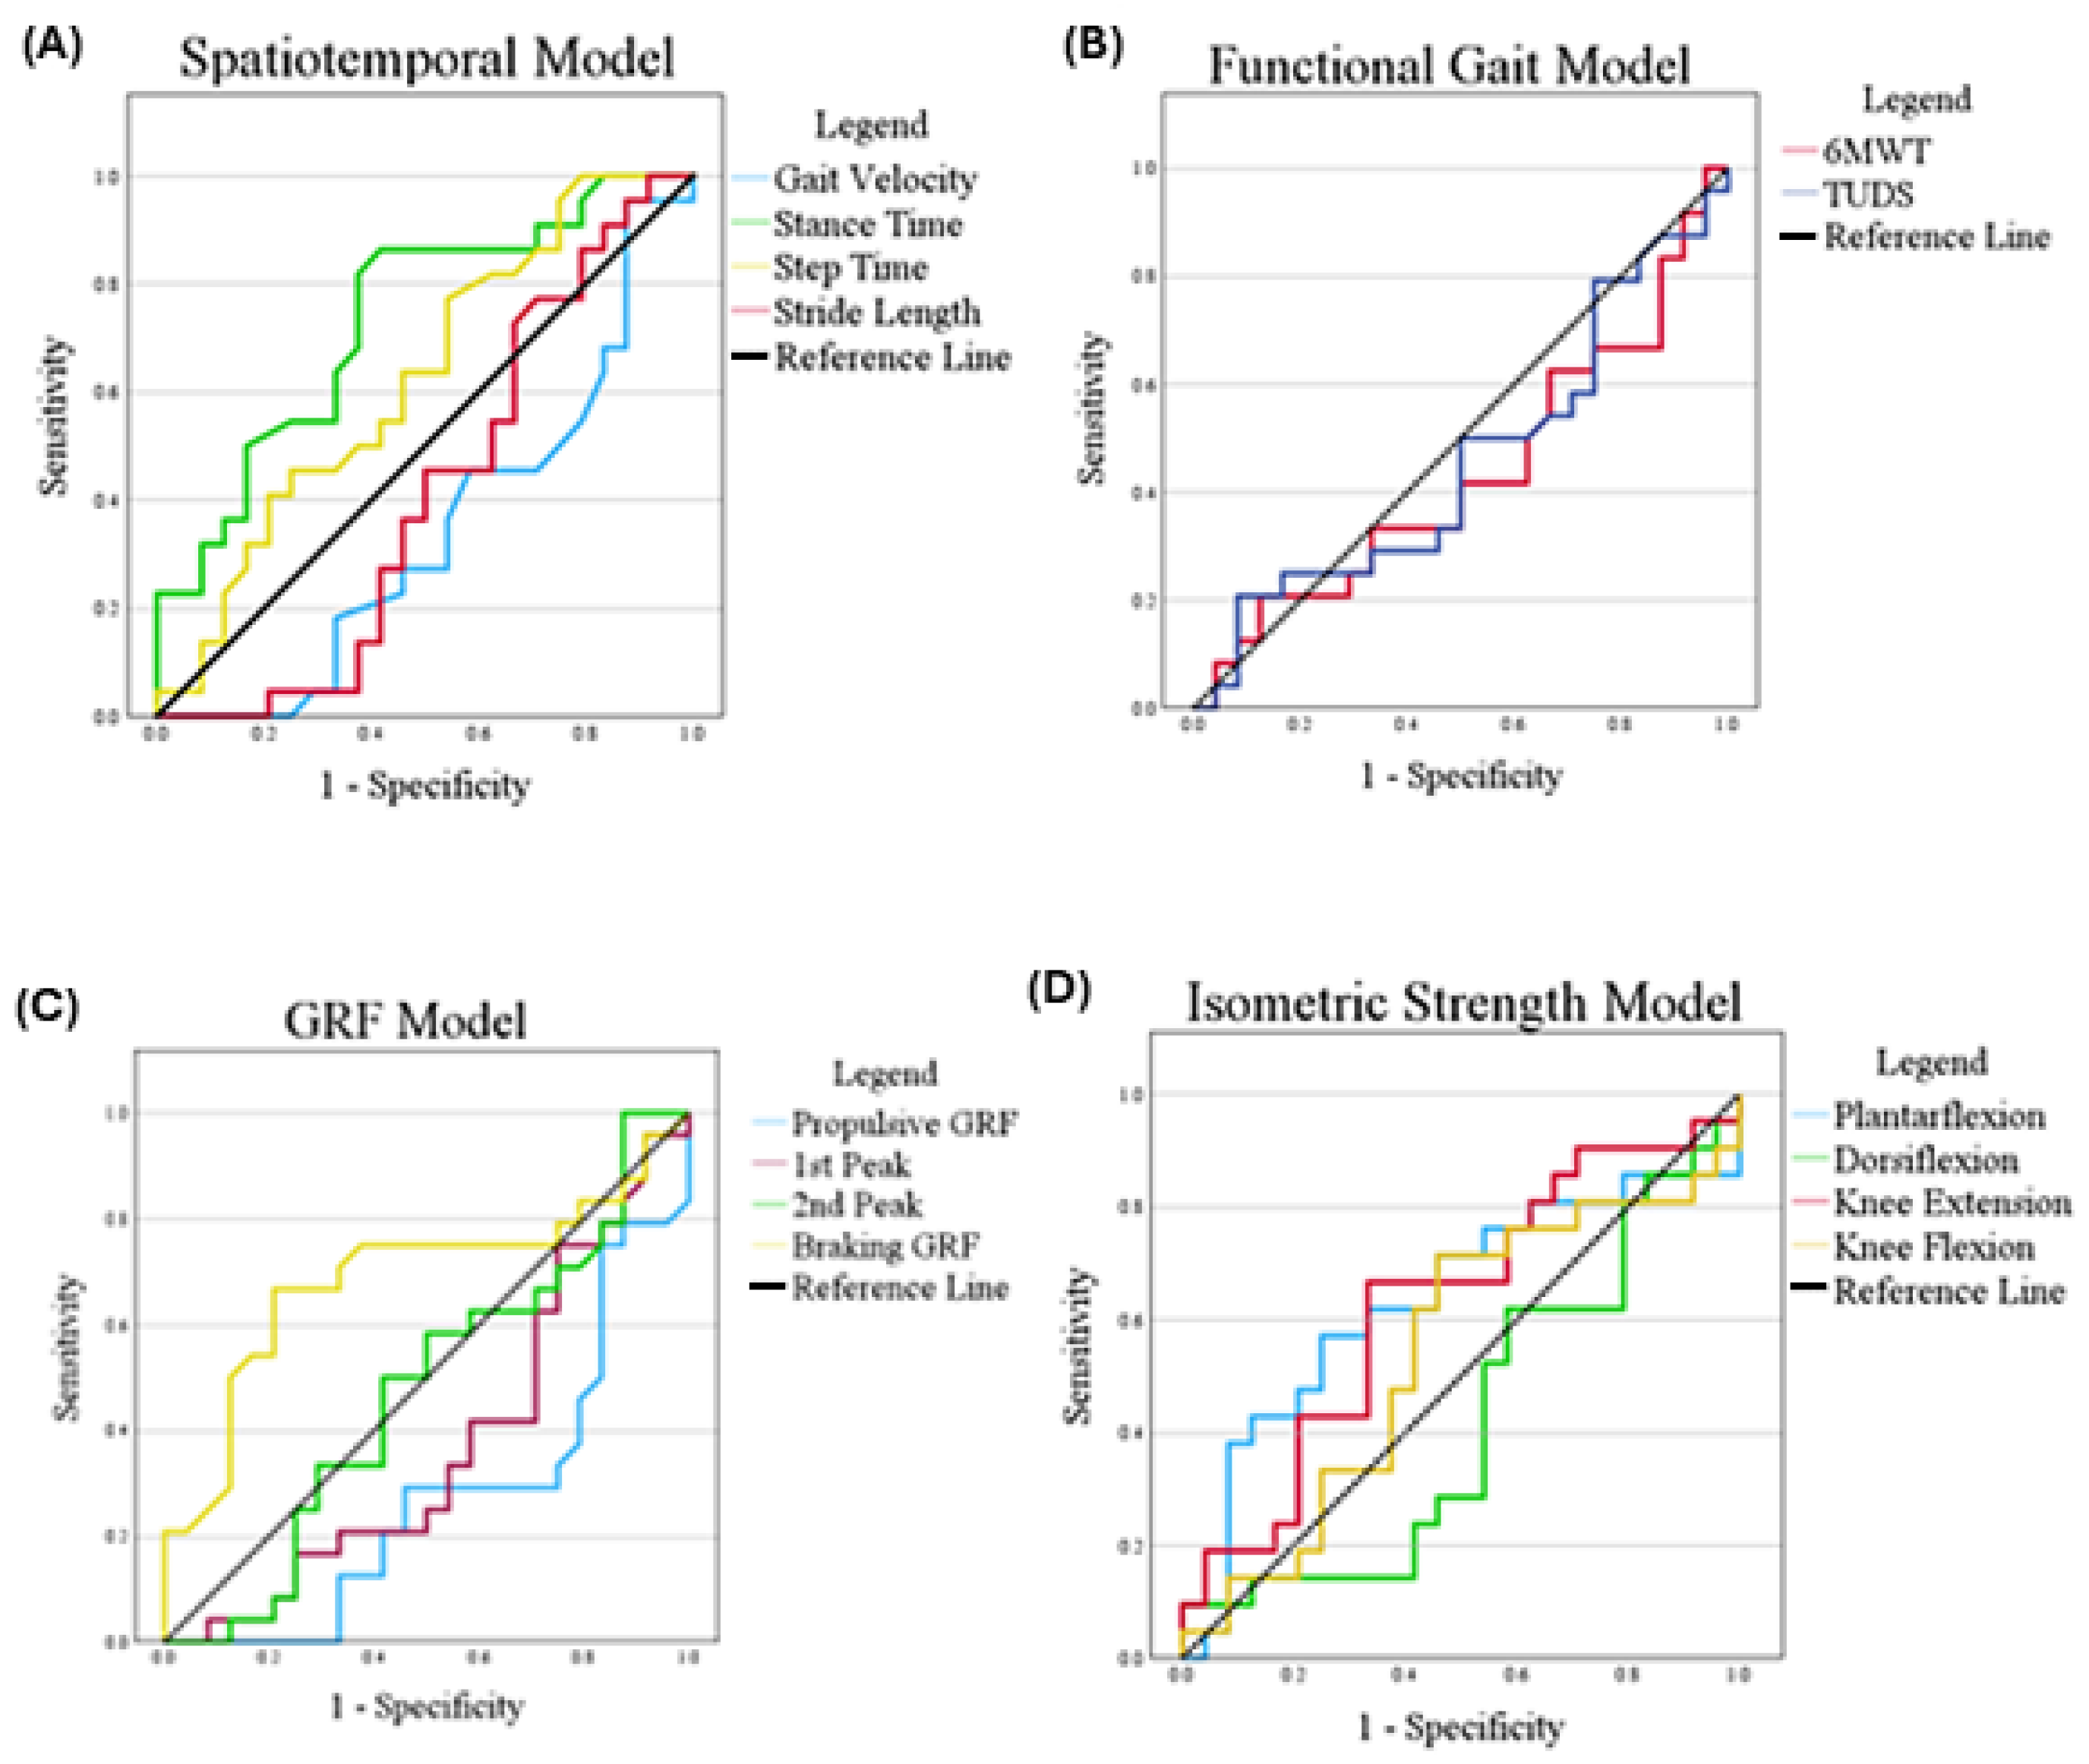
The ROC analysis was used to further characterize the discriminatory performance of variables included within each logistic regression model. Within the spatiotemporal model, stance time demonstrated the strongest discrimination and step time demonstrated fair discriminatory ability for MetS classification (
Table 5,
Figure 1). Within the GRF model, braking GRF demonstrated fair discriminatory ability, whereas within the isometric strength model, plantarflexion and knee extension torque also demonstrated fair discriminatory ability. Despite these findings, the overall predictive performance of the functional gait and strength-related models remained limited, and the observed AUC values should be interpreted cautiously.
3. Discussion
The primary objective of this study was to examine whether gait performance was associated with the cardiometabolic components of metabolic syndrome (MetS) in young adults and whether gait-related measures could differentiate individuals with and without MetS. The results suggest that functional and biomechanical differences exist between MetS+ and MetS− young adults, particularly in gait velocity, stance time, and propulsive ground reaction force. However, the regression models did not identify statistically significant relationships between gait velocity and most MetS risk factors. Among the variables examined, anthropometric measures related to obesity demonstrated the largest effect estimates in relation to gait characteristics, although these relationships should be interpreted cautiously given the lack of statistical significance in the regression models.
However, the presence of substantial multicollinearity among anthropometric variables may have limited the interpretability of individual regression coefficients and obscured potential relationships. Additionally, the relatively small sample size may have limited statistical power to detect significant associations. Potential confounders such as sex differences and physical activity levels were not controlled for and may have influenced both gait performance and metabolic health outcomes. Despite these limitations, this observation aligns with previous literature indicating that excess body mass and central adiposity influence gait mechanics through increased mechanical loading and altered movement strategies.
Contrary to our initial hypothesis, the regression models did not identify statistically significant associations between individual MetS risk factors and gait velocity in this young adult cohort. Although the anthropometric variables related to obesity demonstrated the largest coefficients within the regression models, the overall models were not statistically significant. This finding may reflect, in part, the relatively early stage of cardiometabolic disease progression in this population. Many of the metabolic abnormalities associated with MetS, including dyslipidemia and impaired glucose regulation, typically exert their physiological effects gradually over time and may not yet manifest as measurable functional impairments in younger adults. As a result, gait velocity in this population may be more closely related to general anthropometric characteristics than to the other measured MetS risk factors, although this interpretation should be made cautiously.
Despite the limited explanatory power of the regression models, several biomechanical differences were observed between MetS+ and MetS− participants. Individuals with MetS demonstrated significantly slower gait velocity and longer stance time during the 10MWT. These changes in temporal gait parameters are consistent with previous research indicating that reduced walking speed is often accompanied by increased stance duration and altered step timing as individuals adopt more conservative movement strategies [
9]. Slower gait velocity has been associated with a variety of health outcomes, including increased cardiovascular risk and all-cause mortality [
22]. Although the magnitude of these differences was modest in the present study, they may represent early biomechanical adaptations associated with increased body mass or early metabolic dysfunction in young adults with MetS.
Generally, these findings are consistent with previous literature reporting reduced gait velocity in individuals with metabolic syndrome or related cardiometabolic conditions [
23]. Gait velocity was significantly slower with MetS+ compared to MetS−, and both step time and stance time demonstrated fair but limited predictive ability (0.6 ≤ AUC ≤ 0.7) for MetS classification. This may be explained in part by the relationship between the temporal parameters of gait (e.g., step and stance time) and overall movement velocity. As gait velocity decreases, increased step time, reduced step length and increased stance time are a logical expectation regardless of the age of pathology [
9]; however, robust predictive power was not observed. Notably, the functional gait model demonstrated 0% sensitivity, indicating an inability to correctly identify individuals with metabolic syndrome, which further underscores the limited classification utility of these measures in this cohort. In addition to reduced gait velocity, MetS+ demonstrated 10.5% lower GRF. Peak plantarflexion and dorsiflexion isometric strength also demonstrated fair predictive ability of MetS, even with MetS+ demonstrating increased peak isometric strength compared to MetS−. This observation may be attributable to the significantly increased mass of MetS+, which may influence absolute strength measures [
24]. Considered together, the biomechanical variables associated with gait performance, function, GRF, and strength did not demonstrate strong predictive ability for MetS status.
As the prevalence of MetS continues to rise in younger populations [
4], the need for continued research surrounding MetS in this population is clear. Gait velocity specifically has been linked to all-cause mortality and cardiovascular risk [
22], but research primarily focuses on geriatric populations, which tend to present with greater variability in gait velocity. Though our findings demonstrate significant differences in gait velocity and other functional gait metrics in young adults, the predictive ability of these metrics appears to be limited in this population. Given the temporal dependence of the pathophysiology of MetS, and the presumably short duration of the progression of this disease in this young adult sample, it may require a longer duration of disease exposure for functional impairments to become detectable.
The results of this study should be interpreted in the context of several limitations. First, the sample size of the MetS+ group was relatively small (n = 24), which may have limited statistical power to detect significant relationships between cardiometabolic risk factors and gait performance and increased the potential for Type II error. Second, the cross-sectional design limits the ability to determine causal relationships between metabolic syndrome and changes in gait biomechanics or functional performance. Longitudinal studies are needed to determine how these relationships evolve as cardiometabolic risk factors progress over time. Additionally, several of the anthropometric variables examined in the regression models are inherently related, as BMI is derived from body mass and height, and waist circumference also reflects adiposity. As a result, some degree of multicollinearity between anthropometric predictors is expected and should be considered when interpreting the regression coefficients. Additionally, confidence intervals were not reported for classification performance metrics, which may limit the precision and interpretability of these estimates. Finally, the relatively small sample size limited the number of predictors that could be included simultaneously in the logistic regression models, which may have constrained the predictive performance of the classification analyses. Despite these limitations, this study provides novel insight into the relationship between metabolic syndrome and gait biomechanics in young adults, a population that has received comparatively little attention in existing literature.
This study provides insight into the relationship between metabolic syndrome and gait performance in young adults. Individuals with MetS demonstrated modest differences in several gait-related variables, including reduced gait velocity, increased stance time, and reduced propulsive ground reaction forces compared with matched controls. However, the cardiometabolic risk factors associated with MetS did not demonstrate statistically significant relationships with gait velocity in regression analyses, and the predictive performance of biomechanical, functional, and strength-related measures was limited. These findings suggest that while subtle biomechanical differences may be present in young adults with MetS, the functional consequences of cardiometabolic risk factors may not yet be sufficiently developed to produce measurable gait-related impairments. Future research should examine how these relationships evolve as individuals age and as metabolic risk factors progress over time.
4. Materials and Methods
4.1. Participants
Participants for this analysis were drawn from a larger ongoing study examining cardiometabolic health and physical performance in young adults. Twenty-four participants (M = 10, F = 14) who met the diagnostic criteria for metabolic syndrome (MetS+) were identified and matched with 24 participants (M = 10, F = 14) without MetS (MetS−) based on sex, age, height, and self-reported ethnicity. All participants were between 18 and 39 years of age.
Exclusion criteria consisted of any formal diagnoses related to cardiovascular, metabolic, pulmonary, renal, or neurological disease, excluding hypertension, as well as pregnancy or lactation. Individuals taking medication for any of these conditions were also excluded, as were those with lower-extremity injury that prevented them from performing functional testing. All procedures were approved by the Institutional Review Board of the University of Southern Mississippi, and all participants provided written informed consent prior to participation.
4.2. Cardiometabolic Measurements
Upon enrollment, participants arrived at the laboratory following a minimum 8 h overnight fast from food, beverages, and medications/supplements and a 24+ h abstention from exercise. Height was measured using a stadiometer, and weight was recorded using a calibrated digital scale (SECA, Hamburg, Germany) for each participant. WC was measured using a flexible aluminum tape to measure the iliac crests as landmarks for measurement, as established by the National Cholesterol Education Program (NCEP) Adult Treatment Panel III (ATP-III). Resting blood pressure was collected with patients in a seated position using an automated sphygmomanometer (OMRON Healthcare Inc., Sunrise, FL, USA). FBG, HDL cholesterol, and TRG levels were obtained using a capillary blood analyzer (Cholestech LDX; Abbott Laboratories, Chicago, IL, USA) from 40 µL of capillary blood collected in lithium heparin-lined capillary pipettes via fingerstick.
Participants were classified as MetS+ if they met the National Cholesterol Education Program Adult Treatment Panel III criteria for metabolic syndrome, defined as the presence of three or more cardiometabolic risk factors, including elevated blood pressure, elevated fasting blood glucose, increased waist circumference, elevated triglycerides, or reduced HDL cholesterol. Twenty-four participants meeting these criteria were identified and matched with 24 participants without MetS (MetS−) for biomechanical and functional testing.
4.3. Functional Testing
On a second day, participants returned to the lab and were asked to complete gait analyses and isometric strength testing, including a ten-meter walk test (10MWT) designed to measure gait velocity, a six-minute walk test (6MWT) and a time up and down a single flight of stairs (TUDS) test designed to measure functional gait ability (i.e., endurance and stair negotiation), and knee and ankle isometric strength tests.
4.4. Gait Testing
Participants were then fit with a standard lower extremity marker set used to create a 9-segment kinematic model of the lower body. Lower body gait kinematics were recorded during the 10MWT using a 10-camera motion capture system (240 Hz, Qualisys, Göteborg, Sweden). During the 10MWT, participants were required to walk 10 m over six in-ground force plates, which recorded GRF during overground walking (1200 Hz, American Mechanical Technology Inc., Watertown, MA, USA). Gait velocity was measured from the middle six meters of the 10MWT using two photocell timing gates (Blue, Dashr, Lincoln, NE, USA), with the mean velocity from each of the three trials being used for analysis.
Raw three-dimensional marker trajectories and GRF were imported into the Visual 3D biomechanical analysis suite (version 2025.07, HAS motion, Kingston, ON, Canada) and filtered using a fourth-order zero-lag Butterworth filter with a cut-off frequency of 8 Hz based on prior gait biomechanics literature [
25]. The stance phase of gait was defined between heel-strike and toe-off for the right leg, with heel-strike defined when the vertical GRF exceeded a threshold of 10 N, and toe-off defined when the vertical GRF fell below the 10 N threshold. All GRF variables of interest were then normalized to body weight.
The 6MWT was performed according to standardized procedures. Participants were instructed to walk as far as possible for six minutes along an indoor walkway at a self-selected pace while maintaining continuous forward movement. Total distance covered during the six-minute period was recorded as the measure of walking endurance.
Stair negotiation ability was assessed using a TUDS test. Participants ascended and descended a single flight of 10 stairs as quickly and safely as possible. Timing began with the initiation of participant movement and ended when both feet reached the final step at the completion of the task. Total completion time was recorded as the measure of stair negotiation performance.
4.5. Isometric Strength Testing
Isometric strength (torque) production of the knee and ankle joints was measured using a dynamometer (100 Hz, System 3, Biodex Medical Systems, Inc., Shirley, NY, USA). To measure knee flexion and extension strength, participants were seated on a dynamometer chair, and the chair was adjusted to produce 90° hip flexion. The chair was further adjusted so that the lateral epicondyle of the femur was aligned with the rotational axis of the dynamometer arm. The participant’s shank was firmly secured with a padded Velcro strap, and the knee was positioned to 60° of flexion. Participants performed three maximum voluntary contractions (MVC) of each movement, each five seconds in duration, with 30 s of rest in between each contraction, consistent with recommended procedures for strength assessment [
26]. Following the completion of the knee joint MVCs, the dynamometer attachment was replaced with the ankle joint attachment. The chair was adjusted to align the lateral malleolus of the fibula with the rotational axis of the dynamometer arm, and the ankle was positioned in a neutral (0°) position. The same MVC protocol was then applied for ankle plantarflexion and dorsiflexion. Raw torque data were exported into MATLAB where the peak values of each movement were identified for each trial, and the highest value obtained across the three maximal contractions was used for analysis (v2024a, The MathWorks, Natick, MA, USA).
4.6. Statistical Analysis
Independent samples
t-tests were performed to compare participant characteristics and biomechanical variables between the MetS+ and MetS− groups. Cohen’s d was calculated as a measure of effect size and interpreted according to conventional thresholds (0.20 = small, 0.50 = medium, 0.80 = large) [
27]. Normality of continuous variables was assessed prior to conducting parametric analyses.
Multiple linear regression was used to examine the relationship between gait velocity and the cardiometabolic risk factors associated with metabolic syndrome (SBP, DBP, FBG, WC, TRG, and HDL). This model was intended to determine whether the clinical components used to define MetS were associated with walking performance in young adults diagnosed with the condition.
A secondary exploratory regression model was constructed to examine whether broader anthropometric characteristics related to body size influenced gait velocity. In this model, body mass and height were included alongside the MetS risk factors to represent body-size characteristics underlying BMI. This approach allowed us to evaluate whether general body size, in addition to central adiposity measured by waist circumference, contributed to variation in gait velocity. Prior to conducting regression analyses, standard assumptions of linear regression including normality, linearity, homoscedasticity, independence of errors, and multicollinearity were assessed using residual diagnostics and variance inflation factors (VIF). Evidence of multicollinearity was considered when interpreting regression coefficients.
Binary logistic regression was used to evaluate whether biomechanical, functional, and strength-related variables could differentiate between individuals with and without MetS. Variables were grouped into four domain-specific models to reduce model complexity and mitigate overfitting relative to the available sample size. The spatiotemporal model included gait velocity, stride length, step time, and stance time. The functional gait model included 6MWT distance and TUDS time. The GRF model included peak braking GRF, peak propulsive GRF, and first and second vertical GRF peaks. The isometric strength model included peak ankle plantarflexion, ankle dorsiflexion, knee extension, and knee flexion torque.
Model performance was evaluated using the model chi-square statistic, classification accuracy, sensitivity, and specificity. Receiver operating characteristic (ROC) analysis was used to assess each model’s ability to discriminate MetS status by calculating the area under the curve (AUC) from the predicted probabilities generated by each logistic regression model. AUC values were interpreted as fair (0.60–0.70), acceptable (0.70–0.80), excellent (0.80–0.90), or outstanding (>0.90) [
28].
Independent-samples t-tests were also conducted between MetS+ and MetS− groups for the discrete variables included in each predictive model. Because these analyses were exploratory, no formal correction for multiple comparisons was applied. Statistical significance was accepted at p ≤ 0.05. All statistical analyses were performed using SPSS (version 30.0, IBM Corp., Chicago, IL, USA).




 ,
,