Article

Revealing Interactions between Temperature and Salinity and Their Effects on the Growth of Freshwater Diatoms by Empirical Modelling

1
Department of Aquatic Ecology, Faculty of Biology, University of Duisburg-Essen, D-45141 Essen, Germany
2
Department of Phycology, Faculty of Biology, University of Duisburg-Essen, D-45141 Essen, Germany
3
Department of Biodiversity, Faculty of Biology, University of Duisburg-Essen, D-45141 Essen, Germany
*
Author to whom correspondence should be addressed.
Phycology 2023, 3(4), 413-435; https://doi.org/10.3390/phycology3040028
Submission received: 29 August 2023 / Revised: 15 September 2023 / Accepted: 20 September 2023 / Published: 22 September 2023

Abstract

:
Salinization and warming are of increasing concern for freshwater ecosystems. Interactive effects of stressors are often studied in bifactorial, two-level experimental setups. The shape of environmental reaction norms and the position of the “control” conditions along them, however, can influence the sign and magnitude of individual responses as well as interactive effects. We empirically model binary-stressor effects in the form of three-dimensional reaction norm surfaces. We monitored the growth of clonal cultures of six freshwater diatoms, Cymbella cf. incurvata, Nitzschia linearis, Cyclotella meneghiniana, Melosira varians, Ulnaria acus, and Navicula gregaria at various temperature (up to 28 °C) and salinity (until the growth ceased) shock treatments. Fitting a broad range of models and comparing them using the Akaike information criterion revealed a large heterogeneity of effects. A bell-shaped curve was often observed in the response of the diatoms to temperature changes, while their growth tended to decrease with increasing electrical conductivity. C. meneghiniana was more tolerant to temperature, whilst C. incurvata and C. meneghiniana were the most sensitive to salinity changes. Empirical modelling revealed interactive effects of temperature and salinity on the slope and the breadth of response curves. Contrasting types of interactions indicates uncertainties in the estimation by empirical modelling.

Graphical Abstract

1. Introduction

Given their contribution of up to 20% of the global primary production [1] as well as their role in the global cycling of carbon, nitrogen, phosphorus, and silicon [2,3], diatoms are of high importance in the functioning of aquatic ecosystems. Due to the simplicity of sampling, preparation, and preservation of their silicate shells (frustules), freshwater benthic diatoms are widely used as environmental indicators, both in routine water quality assessment and paleolimnology [4,5]. Information on the ecological profiles of individual taxa is often expressed in terms of specific biotic indices, which summarize information on preference and tolerance ranges in a highly compressed form [6]. Alternatively, individual environmental parameters can be quantitatively linked to diatom community composition quantitatively using transfer functions or machine learning approaches [7,8].
One central topic in the assessment of the effects of multiple environmental variables (stressors) is the presence or absence and nature of interactive effects. Such interactions refer to situations when the combined effects of changes in multiple abiotic factors on organismal viability differ from the summed effects of the individual environmental changes [9,10]. Such interactions can take different forms. For example, at the eco-physiological level, changes in one variable might affect the niche width, the location of the optimum, or the position of the tolerance limits relative to another. In practice, these interactions are often studied in two-level, two-stressor, full-factorial experiments. A classification system has emerged for characterizing multiple stressor effects in this context, differentiating between additive (no-interaction), synergistic, and antagonistic types (and in some cases, more categories are included) [11,12].
One limitation of this approach is that such a stressed-baseline comparison is agnostic of the shape of organismal tolerance profiles, which are nevertheless seen as a fundamental determinant of biological responses [13,14]. In spite of this disadvantage, such a design is still adopted, probably because of the increasing difficulty of statistically modelling ecological profiles in more than one dimension. One aspect of this difficulty is the large number of functional forms proposed to describe ecological reaction norms; for instance, at least a dozen different functional forms have been proposed for temperature [15]. In a more-than-one dimensional setting, different functional forms may apply to the individual abiotic predictors, and possibilities to capture interactive effects contribute further degrees of freedom, leading to an overwhelming variety of possibilities for mathematical-statistical models.
In the present research, we approached this problem by compiling a range of functional forms potentially describing reaction norms, in terms of growth, of freshwater diatoms to salinity and temperature; combining them in additive and interactive forms to depict three-dimensional reaction norm surfaces; and confronting the obtained broad range of possible model forms with data obtained from laboratory experiments. The experiments quantified the growth rate of clonal freshwater diatom cultures under a treatment matrix including several temperature and salinity levels. Compromise between data fit and the number of model parameters was quantified by the Akaike information criterion (AIC). We hypothesized that interactive terms are usually required to capture observed responses to temperature and salinity changes, and that the variability of such interactions would exceed a simple synergism–antagonism dichotomy. Although the effects of temperature [16,17] or salinity [18,19] upon growth were studied repeatedly in marine phytoplankton, such a study has, to our knowledge, never before been published on freshwater phytobenthic diatoms.

2. Materials and Methods

2.1. Organisms and Culture Conditions

The diatom strains were isolated from a single microphytobenthos sample obtained from a flow-through mesocosm ExStream. The mesocosm was supplied from the small stream Boye (without any modification of the water) at its confluence with the Haarbach and Kischemsbach in Gladbeck (51.55° N, 6.95° W, North Rhine-Wesphalia, Germany) in the spring of 2021. Using light (oil immersion optics) and scanning electron microscopy of oxidized frustule preparations, the strains were identified as Cymbella cf. incurvata, Nitzschia linearis, Cyclotella meneghiniana, Melosira varians, Ulnaria acus, and Navicula gregaria. The strains were isolated and maintained in SFM + Si medium (Appendix A Table A1) in PK520 WLED climate chambers (polyKlima GmbH, Freising, Germany) with “True Daylight LED” illumination at 15 °C with a light–dark cycle of 10:14 h and a light intensity of 100 µE/cm2.

2.2. Temperature and Salinity Experiments

Experiments were performed in 24-well cell culture plates (neoLab Migge GmbH, Heidelberg, Germany) in at least 4 replicates, with 2 mL total volume per well. Salinity was manipulated by adding NaCl (Carl Roth GmbH + Co. KG, Roth, Germany) to the basic SFM + Si media to obtain various concentrations up to 3000 mg/L. In addition, pH was kept at 7.0 (±0.1). The conductivity of the media was measured with a PCE-PHD 1 pH-conductivity meter (Meschede, Germany). After calibrating added salinity values against measured conductivity in the used media, conductivity could be calculated as 0.432 + 0.00295 × added salt concentration (the latter expressed as mg/L Cl). For consistency, throughout the rest of the paper, total salinity of media will be expressed as electric conductivity. Initial cell densities were separately adjusted to each strain based on a calibration of in vivo chlorophyll fluorescence values measured with a Tecan Infinite 200 Pro microplate reader (Tecan Group Ltd., Männedorf, Switzerland), similarly to the method applied by Albrecht et al. [20] with the following specifications: bottom reading mode with an excitation wavelength of 450 nm and detection at 680 nm. The plates were cultured in the climate chambers as described above for one week at different temperatures ranging from 5 to 28 °C. In vivo chlorophyll fluorescence was measured with the Tecan Infinite 200 Pro plate reader as described above at the same time of day over the seven days of experiments.

2.3. Calculation of Specific Growth Rate

In cultivation, the growth curve of microalgae usually includes a lag phase [21] at which the growth is delayed because of physiological adjustment and the presence of non-viable cells [22,23]. This was found to be the case in our experiments as well; therefore, the specific growth rate (µ; 1/d) was calculated for the phase where the fluorescence signal increased exponentially (mostly days 3–7) using the following equation:
d N d t = μ × N
where N is the fluorescence on the measuring day [24].

2.4. Empirically Modelling Diatom Growth

2.4.1. Multiplicative and Decoupled Models

The growth rate of diatoms as a function of environmental variables has usually been written as a function of growth-affecting factors representing the stressor [25,26,27,28]. In this method, each factor ranging from 0 to 1 is a multiplier in the growth rate calculation. Considering the influence of temperature and electrical conductivity:
μ = μ m a x × f T × f S
with f S and f T (/) being salinity and temperature factors, respectively; and μ m a x (1/d) being the maximum growth rate. In other words, the effect of each factor is considered multiplicative and decoupled.
As the stress caused by various factors is considered multiplicative and decoupled in this model, the influence of temperature could be integrated as the effects on the maximum growth rate, yielding the temperature-dependent growth rate ( μ T ). Accordingly, the above equation could be modified as:
μ = μ T × f S
A variety of equations have been applied previously to describe the temperature-dependent growth rate (Table S1, Supplementary Material), temperature factor (Table S2, Supplementary Material), and salinity factor (Table S3, Supplementary Material). These equations were combined and modified to consider all possible ways that factors in Equations (1) and (2) might be affected by temperature and/or salinity in a simple multiplicative or interactive manner. The latter can include: (1) the temperature-dependent growth rate is influenced by salinity; (2) the temperature factor is impacted by salinity; (3) the salinity factor is affected by temperature; and (4) the optimum, maximum, or the lower/upper level of one environmental factor is affected by another.

2.4.2. Polynomial Regression Equations

Another common approach to modelling diatom growth in various environmental conditions is to use polynomial regression equations [29,30]. Considering the effects of temperature and salinity, the diatom growth rate can be written as a polynomial equation without (Equation (4)) and with (Equation (5)) interactions:
μ = a + b 1 × S + c 1 × T + b 2 × S 2 + c 2 × T 2
μ = a + b 1 × S + c 1 × T + b 2 × S 2 + c 2 × T 2 + d × S × T
Equations (4) and (5) depict the relationship between the growth rate and two variables (temperature T and salinity S expressed by the electrical conductivity). In these equations, a is the intercept term (i.e., the growth rate at 0 °C and electrical conductivity 0 mS/cm); b 1 and c 1 represent the main effect for each variable; b 2 and c 2 represent square effects; and d stands for the interaction between temperature and electrical conductivity.

2.4.3. Data Fitting

Nonlinear least-square fitting of the growth rate as a function of temperature and electrical conductivity was conducted using SigmaPlot 15.0, providing estimates of the coefficients in the equations as well as statistical parameters (R2, p, and AIC). In the data fitting, only the lowest salinity at which the growth did not take place (zero or negative specific growth rate) was considered in order to reduce uncertainties in the analysis. The scenarios with definite confidence intervals for estimated parameters are given in Tables S4–S9, Supplementary Material. For selecting the best model for each species, we used the Akaike Information Criterion [31] as a metric, aiming to balance model complexity (number of parameters) against model fit. The model with the lowest AIC value was considered to provide the best such compromise, i.e., generalizability.

3. Results and Discussion

3.1. Variations in the Response to Temperature and Salinity among Diatom Species

Among the six strains investigated, C. meneghiniana (Figure S1C) and U. acus (Figure S1E) were least affected by temperature changes (Figure S1, Supplementary material). At the background electrical conductivity level of the culture medium (i.e., NaCl was not added to the culture medium), the growth rate of C. meneghiniana stabilized in the temperature range of up to 25 °C (Figure S1C), indicating a high tolerance of this strain to temperature changes in the investigated range. Given conductivity below 2 mS/cm, U. acus grew at any temperature (Figure S1E). In contrast, C. incurvata was the most strongly affected by temperature changes, with wide variations in its growth rate with varying temperatures (Figure S1A). At 25 °C, the growth of C. incurvata ceased, regardless of salinity.
The growth of C. incurvata, M. varians, U. acus, and N. gregaria followed a typical bell-shaped curve, i.e., below the optimum temperature, the growth rate increased with increasing temperature; above the optimum temperature, the growth rate decreased with increasing temperature (Figure S1). A different pattern was recorded for N. linearis (Figure S1B). At the background electrical conductivity, the growth rate of this strain decreased with increasing temperature up to 20 °C and increased with increasing temperature above 20 °C (Figure S1B). These patterns were altered by the effects of electrical conductivity changes with greater fluctuations in the temperature-growth curve (Figure 1). A bell-shaped temperature-growth curve has been reported previously for diatoms [29,32,33]. Up to the optimum temperature, the increase in the growth rate of phytoplankton with increasing temperature is related to enhanced enzymatic activities, photosynthesis, and nutrient uptake [34]. The sharp decreases in the growth at high temperatures have been ascribed to deactivation of enzymes or modification of proteins [35], which disrupts metabolism and consequently causes mortality of cells [36]. In addition, photosynthetic performance and efficiency of phytoplankton might be inhibited by high temperature due to impairment in the photosynthetic electron transport and carbon fixation [37].
The growth rate of the investigated freshwater diatoms commonly declined with increasing electrical conductivity (Figure S1). For example, the growth rate of C. incurvata and C. meneghiniana decreased with increasing salinity regardless of temperature (Figure S1). For the other strains, their response to salinization was more diverse, sometimes showing a unimodal response (maximal growth rate at intermediate salinity levels). However, an inhibition of the growth rate with increasing electrical conductivity was still dominant (Figure S1). The bell-shaped conductivity-growth curve was only seen at high temperature (25 °C; Figure S1). The growth of N. gregaria was least affected by salinity changes (Figure S1F). Decreases in the growth rate of this diatom were only evident at conductivity above 5 mS/cm (Figure S1F). At temperature below 25 °C, N. gregaria still grew at electrical conductivity above 9.00 mS/cm (Figure S1F). In contrast, C. meneghiniana was among the diatoms most affected by salinization (Figure S1C). Different results have been reported for this diatom. Roubeix and Lancelot [38] revealed a bell-shaped response of C. meneghiniana to salinity changes ranging from 0 to 33‰ with a maximum growth rate at 18‰.
According to Kirst [19], organisms might be affected by changes in salinity for several reasons, including: (1) osmotic stress and subsequent effects on the cellular water potential; (2) ion stress resulting from the uptake or loss of ions; and (3) change of the cellular ionic ratios because of the selective ion permeability of the membrane. Salinity exerts profound effects on the growth of algae by influencing the osmotic pressure, nutrient absorption, and suspension of algae [39]. The growth at low salinity levels may be controlled by the availability of certain ions [40]. At high ion concentrations, the decline in water potential can affect metabolism [41]. In addition, energy requirements of osmoregulation can lead to reduced availability of energy and metabolites for cell growth [41]. These factors might contribute to the decline in growth at extreme salinity levels [41].

3.2. Empirical Modelling of Diatom Growth Considering Temperature and Salinity

Based on the value of AIC, various models were considered the best to describe the growth of various strains at different temperature–salinity conditions (Table 1).

3.2.1. Cymbella cf. incurvata

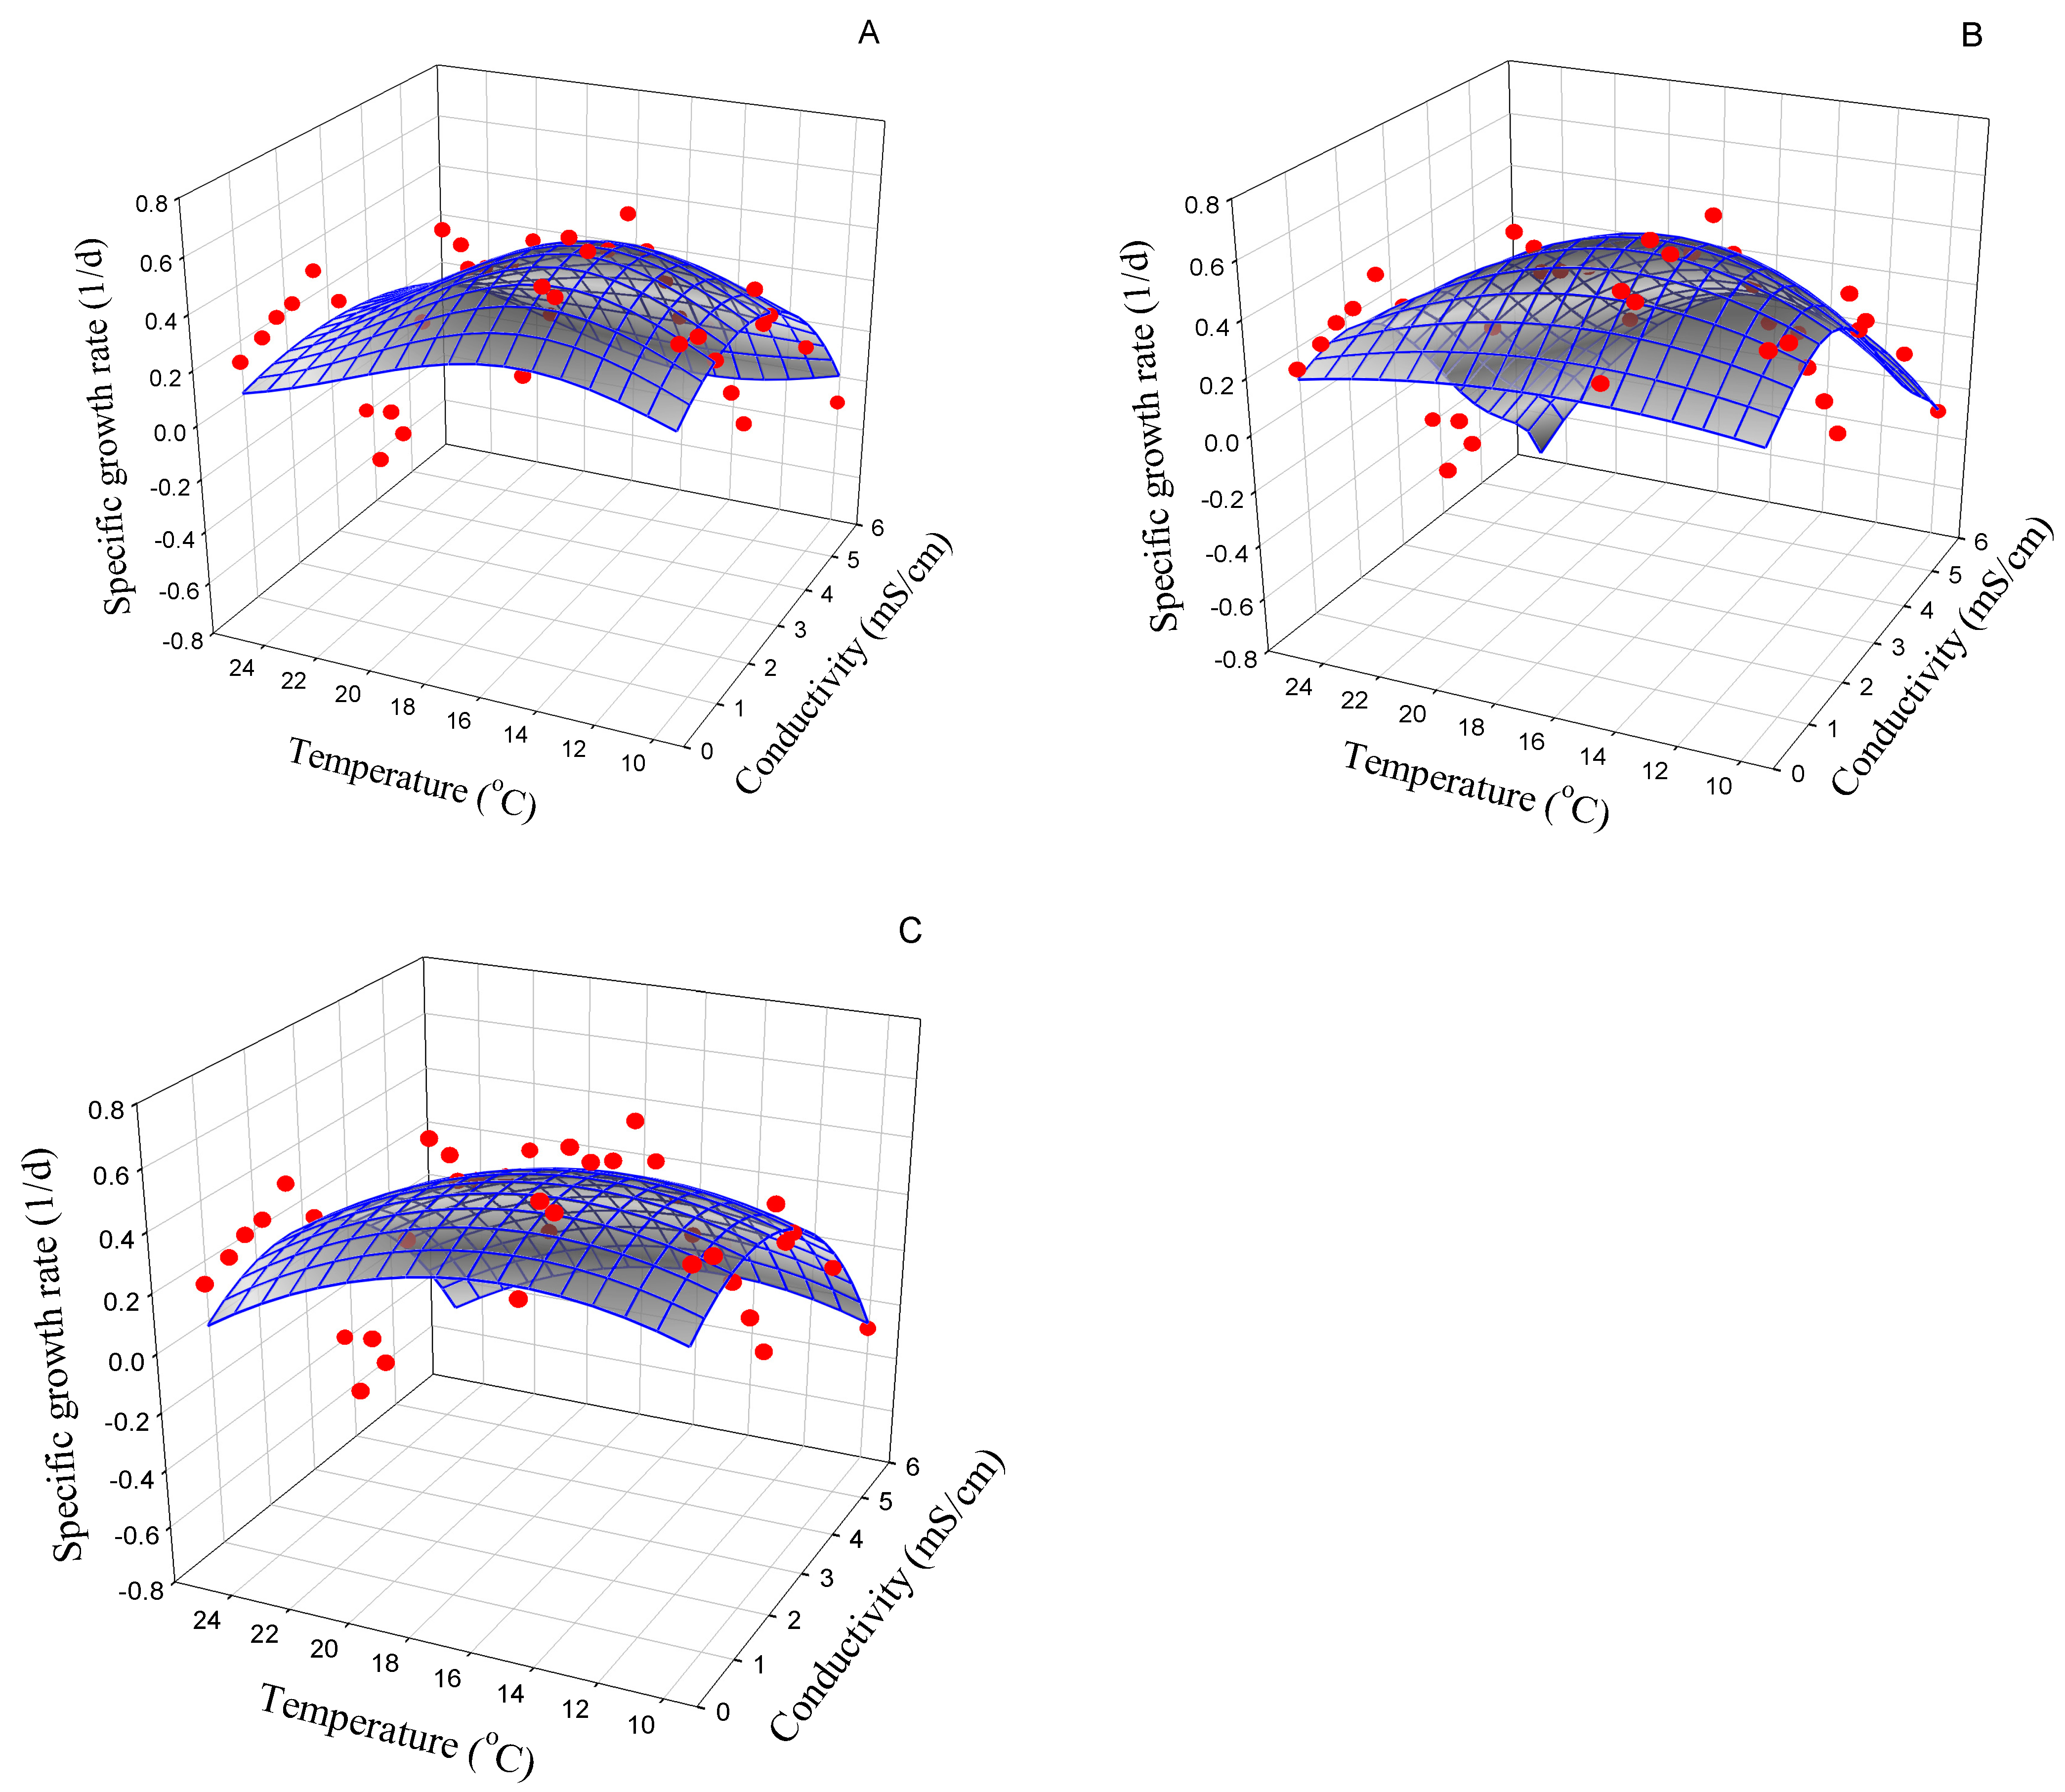
Non-interactive multiplicative Equation (ST13) was the best for describing the growth of C. incurvata at various temperatures and conductivity levels (R2 = 0.97; AIC = −91.06; Table S4; Figure 1A):
μ = c × e d × T × 1 T z w / 2 2 × 1 S S o p t S m a x S o p t 2
where z (°C) is the optimum temperature of the quadratic portion; when d = 0, this value is identical to the optimum temperature of the whole curve (i.e., the growth reaches the maximum rate and the thermal response is symmetric); w (°C) is the thermal breadth (i.e., the range over which diatoms grow); S o p t (mS/cm) is the optimum conductivity; and S m a x (mS/cm) is the maximum conductivity above which the growth ceases. The second and third best models, although quite distant in terms of AIC (Equation (ST12), AIC = −77.93; Equation (ST8), AIC = −69.45), were also non-interactive ones, speaking for a relatively robust conclusion that interactive effects are not necessary to explain the observed pattern in salinity- and temperature-dependent growth of this strain.
This equation could explain the growth rate of C. incurvata better than interactive multiplicative equations (the best one is Equation (ST2); R2 = 0.88; AIC = −62.08; Figure 1B) and the polynomial equation (R2 = 0.82; AIC = −59.42; Figure 1C). Noticeably, estimates of all the parameters in Equation (S13) for C. incurvata were statistically significant (Table S4). According to Equation (ST13), the growth of C. incurvata followed an asymmetric bell-shaped response. The growth rate of this strain increased with increasing temperature, reaching the highest level at the optimum temperature higher than the optimum level of the quadratic portion ( d > 0) of 15.5 °C (14.6–16.3 °C). The thermal breadth of this diatom was estimated as 14.8 °C (12.7–16.9 °C; Table S4; Figure 1A). The temperature response contributes to the difference between Equations (ST13), i.e., asymmetric, and (ST12), i.e., symmetric. Between them, the asymmetric response (ST13) explained the variation in the growth of C. incurvata better than the symmetric one (ST12; Table S4). Also, according to Equation (ST13), the conductivity-growth rate followed a bell-shaped response curve. These responses to temperature and conductivity changes produce an evident peak of the growth rate, as displayed in Figure 1A. However, with an optimum conductivity of 0.63 mS/cm, just slightly above the background conductivity (0.43 mS/cm), the growth of C. incurvata was mainly inhibited by salinization at the investigated conditions (Table S4). This explains the relatively good fit of Equations (ST8), (ST9), and (ST10), in which the growth is inhibited by the addition of NaCl at any concentration (Table S4). In addition, based on Equation (ST13), the growth of this diatom strain ceased at conductivity of 4.88 mS/cm (0.88–8.87 mS/cm; Table S4). According to Equation (ST7), which also yields all significant coefficients, the growth rate of this diatom strain was inhibited by 50% at conductivity of 1.81 mS/cm (1.75–1.88 mS/cm; Table S4). However, the analysis using polynomial equations yielded a different trend (Table S4). In particular, according to these equations, the growth of C. incurvata was significantly affected by temperature, but not by salinity (Table S4; Figure 1C); however, the fit of these models was relatively poor when compared to the above-mentioned top candidates (Table S4).

3.2.2. Nitzschia linearis

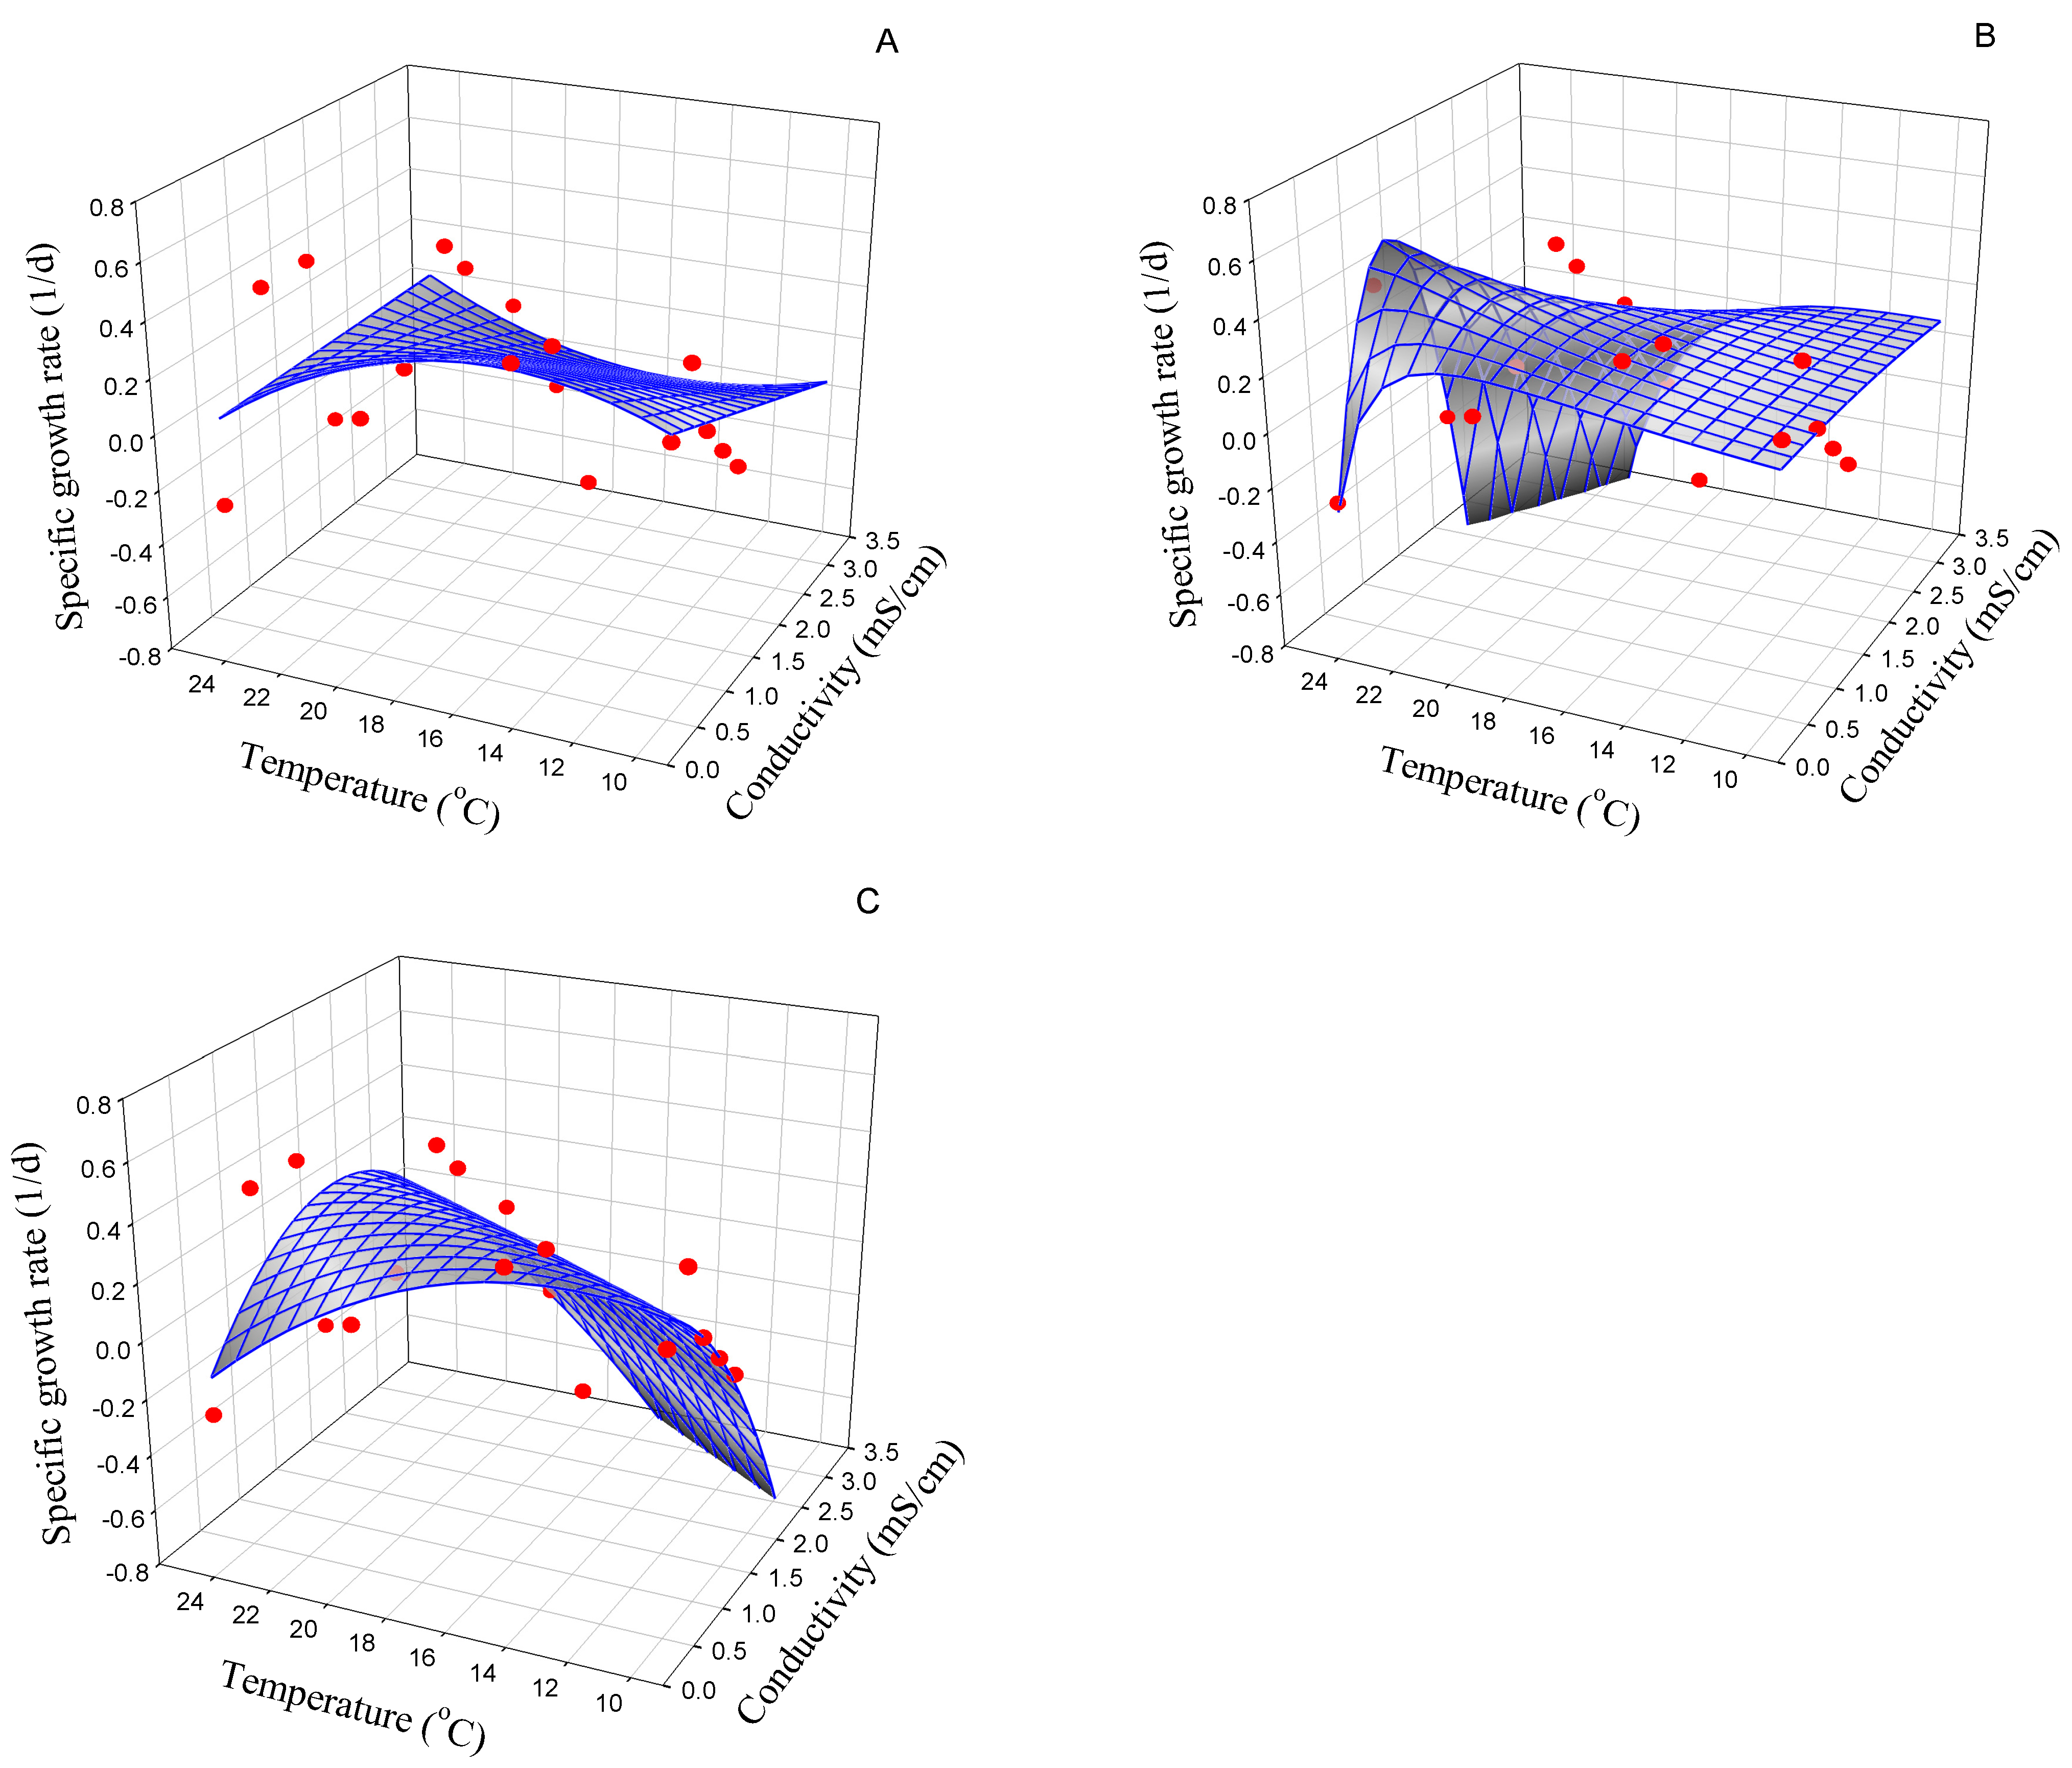
The bell-shaped response of N. linearis as observed from the experiment could be described by various equations (Table S5) with a number of them giving statistically significant estimates, i.e., Equations (ST5), (ST2), (ST14), (ST15), and (S19). Among them, the interactive-multiplicative Equation (ST15) gave the lowest AIC value (Table S5; R2 = 0.59; AIC = −133.49; Figure 2B):
μ = μ m a x × 1 T T o p t w × 1 + a S T × S / 2 2 × e k S × S S o p t 2
with μ m a x (1/d) being the maximum growth rate reached at the optimum temperature ( T o p t ; °C) and the optimum conductivity ( S o p t ; mS/cm); w (°C) being the thermal breadth that can be affected by salinity depending on the interaction coefficient a S T (cm/mS); and k S (cm2/mS2) being the salinity effect factor.
Equation (ST15) could describe the variations in the growth of N. linearis with varying temperature and conductivity better than non-interactive multiplicative equations (the best of which was Equation (ST14); R2 = 0.53; AIC = −130.43; Figure 2A; Table S5) and polynomial equations (Table S5; Figure 2C). Both Equations (ST14) and (ST15) depict a bell-shaped response of growth rate to both temperature and salinity. According to the best Equation (ST15), the thermal breadth for N. linearis becomes narrower with increasing salinity (Table S5). Similar interactions were predicted with the second ranking model (Equation (ST17); AIC = −131.76). The inclusion of this interactive effect improved the predictive potential. This is shown by the lower AIC of Equation (ST15) compared to Equation (ST5), which uses the same functional forms apart from the interaction (Table S5). With Equation (ST15), the maximum growth rate of 0.59 (1/d) was reached at 15.9 °C (14.7–17.1 °C; Table S5) and 2.44 mS/cm (2.02–2.86 mS/cm; Table S5). The significant influence of temperature and salinity was also found with the non-interactive polynomial equation (Equation (4)) as given in Table S5.

3.2.3. Cyclotella meneghiniana

With the limited data from the experiment on the growth of C. meneghiniana, high uncertainty is inherent in our empirical modelling (Table S6). No equations with all significant coefficients were found (Table S6). According to polynomial equations (Equations (4) and (5)), the growth rate of C. meneghiniana was not significantly affected by temperature or salinity (Figure 3C; Table S6). This is consistent with the limited variations in the growth rate of this freshwater diatom with temperature and salinity changes described above. However, the optimum temperature and conductivity could be estimated by various multiplicative equations (Table S6). Similar to N. linearis, the growth rate of C. meneghiniana could be best simulated with interactive multiplicative Equation (ST15) (R2 = 0.80; AIC = −43.90; Figure 3B; Table S6). According to this equation, the maximum growth rate of C. meneghiniana (0.89; 1/d) was reached at 17.3 °C (13.9–20.8 °C) and 0.69 mS/cm (0.58–0.81 mS/cm). Compared to the estimations for these coefficients, high uncertainty is included in the estimate for the salinity effect factor ( k S ) and the thermal breadth ( w ; Table S6). Different estimates were obtained by combining the Arrhenius equation for temperature responses with various salinity functions (Table S6). According to the best non-interactive equation (Equation (ST25)) (R2 = 0.52; AIC = −34.29; Figure 3A; Table S6), the growth rate of C. meneghiniana increased with increasing temperature. An opposite pattern was found with Equation (ST24), which describes the salinity–growth rate with a Michaelis–Menten function (Table S6). Equation (ST24) yielded a maximum conductivity of 1.38 mS/cm (1.06–1.71 mS/cm; Table S6).

3.2.4. Melosira varians

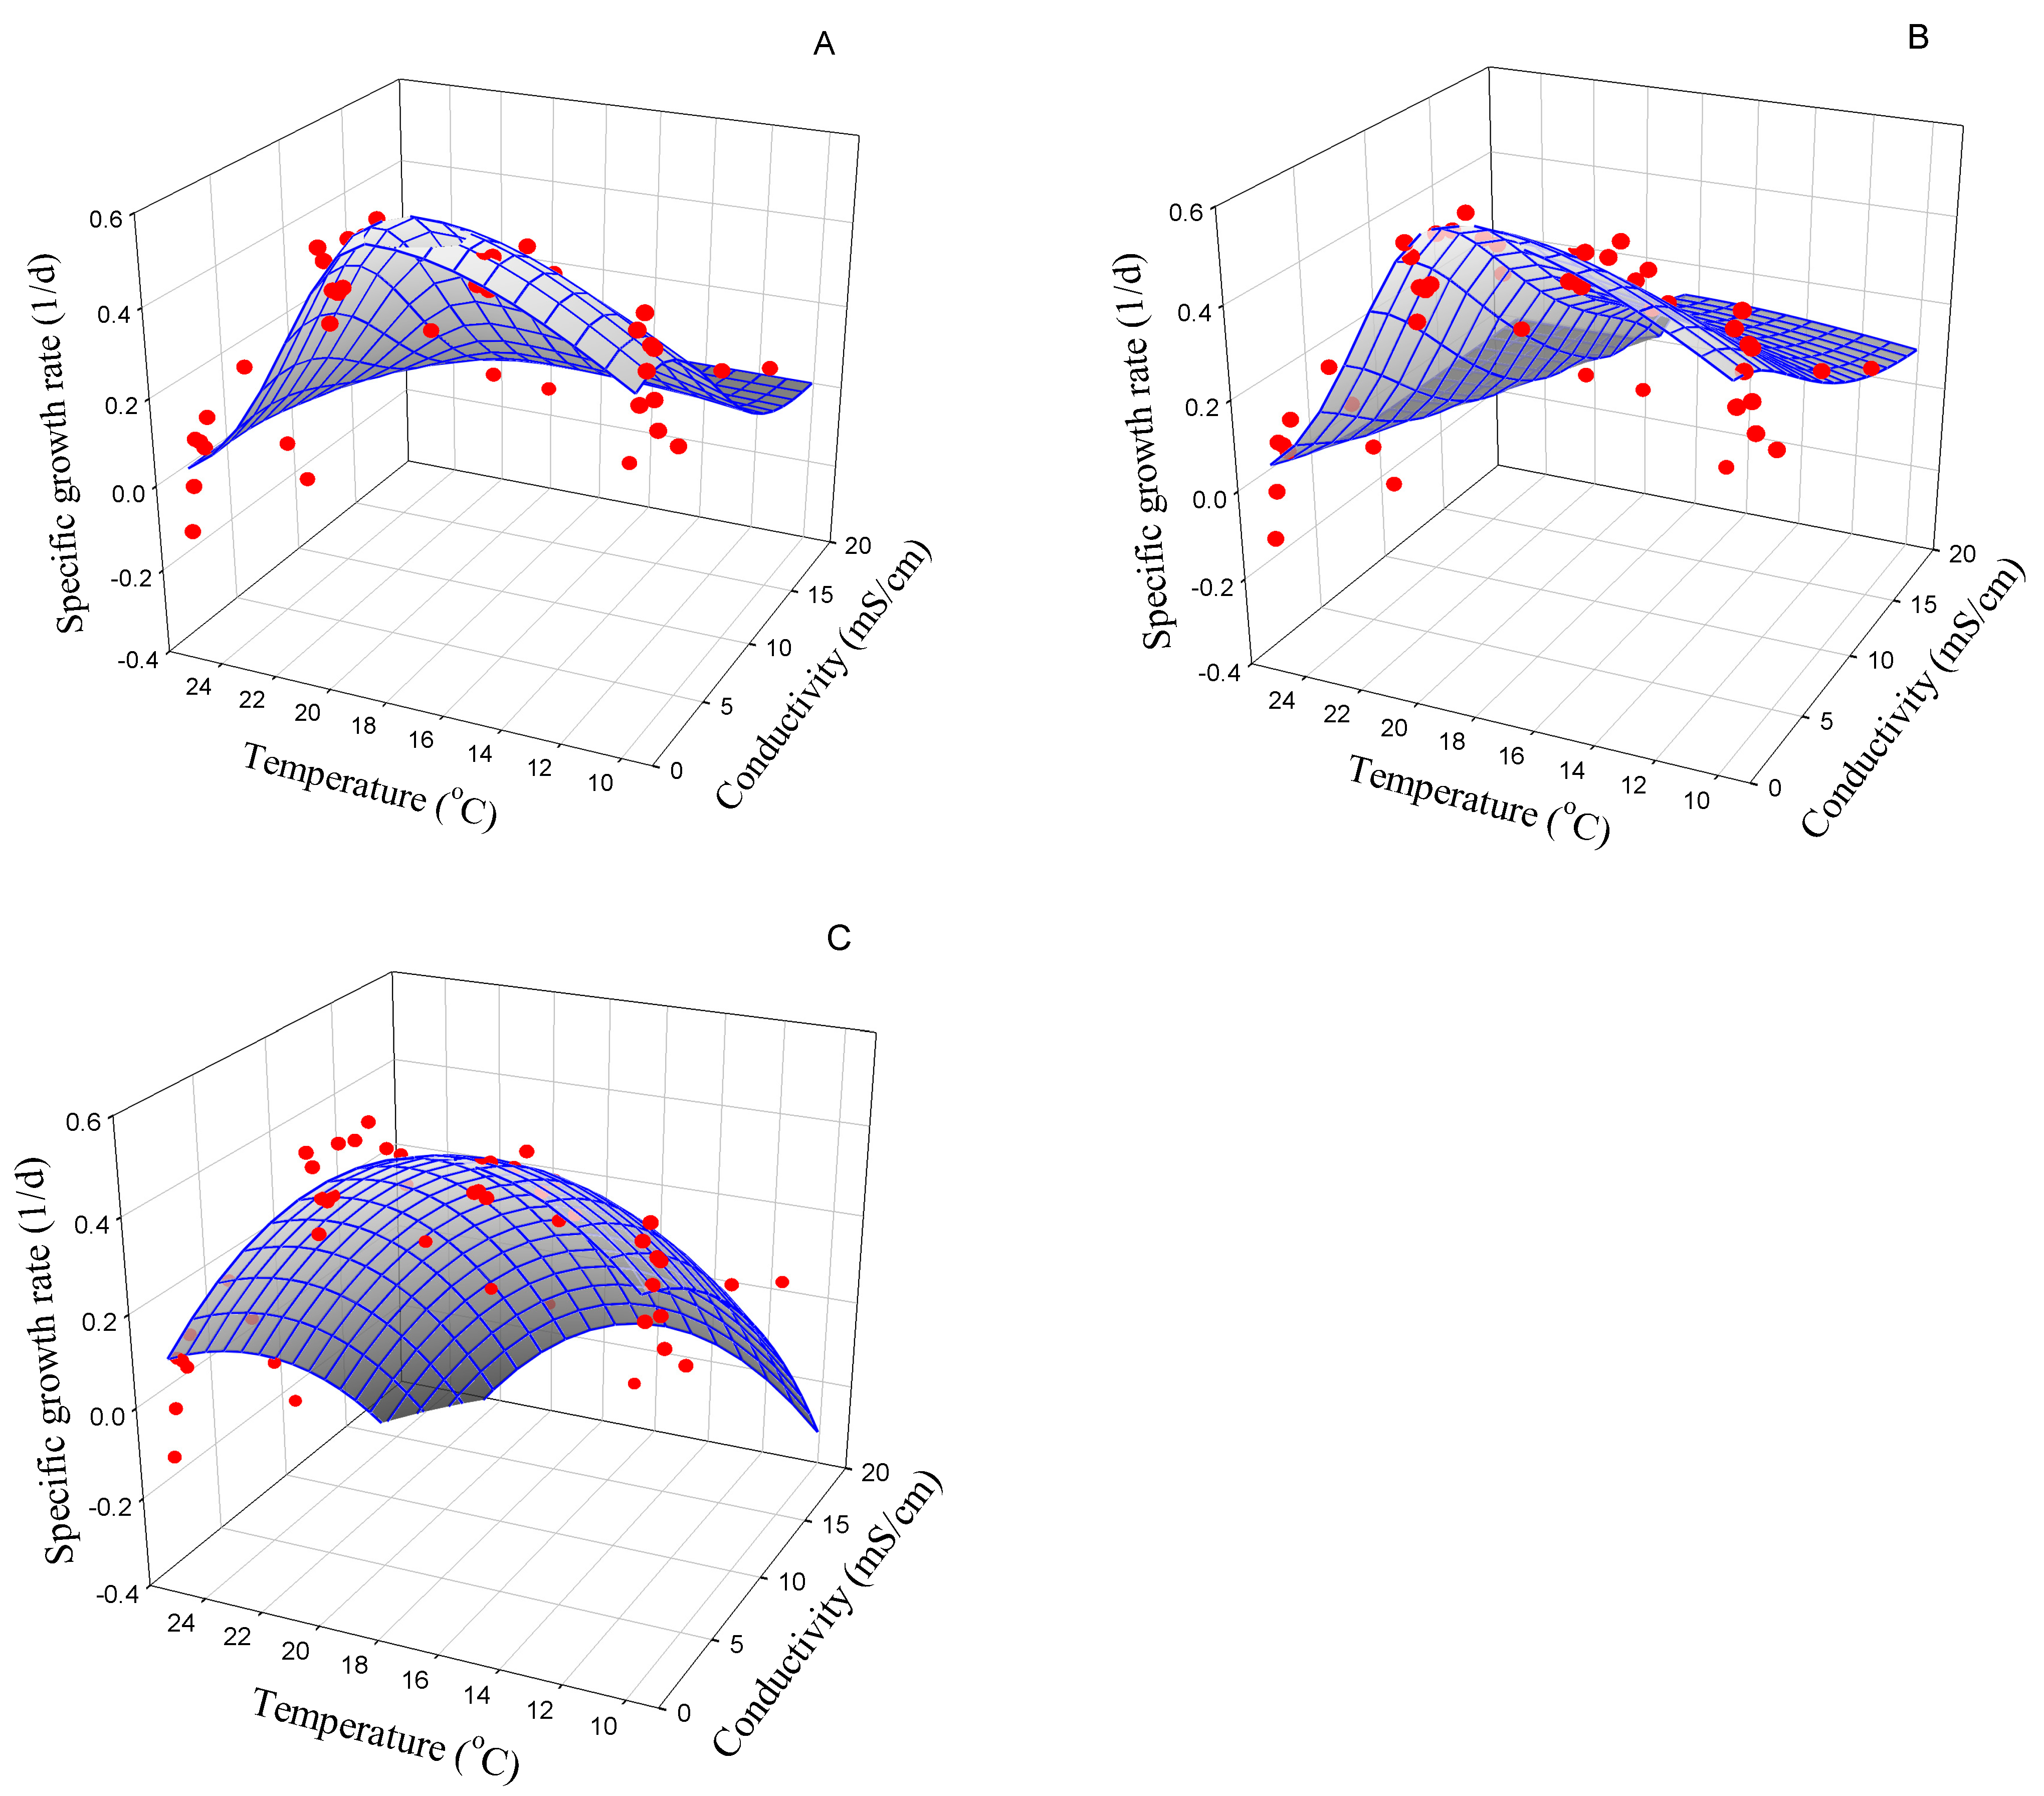
The growth of M. varians at various temperature and conductivity levels was best simulated with the interactive Equation (ST11) (R2 = 0.57; AIC = −51.79; Figure 4B; Table S7):
μ = μ 20 × θ T 20 × 1 S S o p t S m a x × 1 + a S T × T S o p t 2
where μ 20 (1/d) is the growth rate at 20 °C; S o p t (mS/cm) is the optimum conductivity; and S m a x (mS/cm) is the maximum conductivity above which the growth ceases.
Equation (ST11) stood out as it had the lowest AIC and included all significant coefficients (Table S7). According to this equation, the growth rate of M. varians exponentially increased with increasing temperature at the investigated range ( θ = 1.11; Table S7; Figure 4B). At low salinity levels, the growth rate of M. varians increased with increasing conductivity and reached the maximum growth rate at 1.20 mS/cm (1.06–1.34 mS/cm; Table S7). Above this optimum conductivity, the growth rate decreased with increasing conductivity and ceased at the maximum conductivity of 6.41 mS/cm (3.81–8.90 mS/cm; Table S7). Moreover, the maximum conductivity might be lowered by temperature increases. This interaction explains the lower growth rate at 25 °C compared to the rate at lower temperatures at low conductivity (Figure S1D). In other words, the effect of temperature was hidden in the interaction term. Different temperature and salinity responses could be interpreted by the best non-interactive multiplicative equation, which also has all significant coefficients (Equation (ST9); R2 = 0.21; AIC = −42.61; Figure 4A; Table S7). With this equation, the maximum growth rate of M. varians (0.44; 1/d) was obtained in the medium without addition of NaCl and at 15.5 °C (9.5–21.5 °C) (Figure 4A). The growth of this diatom was linearly inhibited by NaCl at any concentration. In addition, the growth of M. varians ceased at the temperature outside the range of 15.5 ± 9.4 °C (thermal breadth: 18.8 °C; Table S7). In contrast to the influence of temperature and salinity estimated by multiplicative equations, non-significant effects were predicted by polynomial equations (Table S7).

3.2.5. Ulnaria acus

With more data on the growth of U. acus, more equations could be applied (Table S8). A number of equations yielded statistically significant estimates of all coefficients (Table S8). Among them, Equation (ST35) could describe the growth of this diatom strain best (R2 = 0.74; AIC = −94.70; Figure 5B) with all significant coefficients (Table S8):
μ = μ m a x × e k T × T T o p t × 1 + a S T × S 2 × 1 S S o p t S m a x S o p t 2
where k T (1/°C2) is the temperature effect factor describing the change in the growth rate, with increasing temperature below or above the optimum ( T o p t ; °C); S o p t and S m a x (mS/cm) are the optimum and maximum conductivity for the growth, respectively; and aST (cm/mS) represents the interactive effect. Also, the second (Equation (ST17), AIC = −90.30) and third (Equation (ST33), AIC = −89.33) ranking model had interactive effects, whilst the best non-interactive model (Equation (ST18)) yielded poor performance (AIC = −88.67; Table S8).
According to Equation (ST35), the growth of U. acus reached the maximum rate of 0.52 (1/d) at 17.1 °C (12.2–22.0 °C) and 1.08 mS/cm (0.79–1.37 mS/cm) (Figure 6B; Table S8). Remarkably, the optimum of the symmetric temperature–growth curve was swept left by salinization (Table S8). Including such interactive effects improved the predictive potential as shown by better statistical parameters in the estimation with Equation (ST35) (with interactions) compared to Equation (ST34) (without interactions; Table S8). The growth of U. acus ceased at conductivity above 2.29 mS/cm (2.02–2.56 mS/cm; Table S8). The response to temperature and salinity in Equation (ST35) could be similarly expressed by Equation (ST33), which yielded a thermal breadth of 28.1 °C (11.7–44.4 °C; Table S8).
According to the best non-interactive multiplicative equation (Equation (ST18); R2 = 0.67; AIC = −88.67; Table S8; Figure 5A), the conductivity–growth curve exhibits asymmetric responses, i.e., at conductivity above the optimum, the growth rate decreases with a higher slope compared to the change at conductivity below the optimum. Higher uncertainty is included in the estimation with this equation as two effect factors are required to simulate the asymmetric response (Table S8). Statistically significant estimates of all coefficients could be obtained when the number of coefficients was reduced (Equations (ST5), (ST9), (ST10), (ST19), and (ST25); Table S8). However, these equations display different temperature- and conductivity-growth responses. Contrasting with a common bell-shaped response curve (Equations (ST5), (ST10), (ST9), and (ST25)), Equation (ST9) exhibits a linear inhibition of the growth rate by salinization. Equations (ST10) and (ST25) display an exponential increase in the growth rate with increasing temperature (monotonic response), while the other equations show the opposite trend at temperatures above the optimum (bell-shaped response). In contrast to such influences of temperature and salinity predicted with these equations, the growth rate of U. acus was estimated to be not significantly affected based on polynomial equations (Table S8; Figure 5C).

3.2.6. Navicula gregaria

Data fitting for the growth of N. gregaria with a number of equations yielded statistically significant coefficients, albeit with different interpretations (Table S9). According to Equations (ST5), (ST15), (ST6), (ST9), (ST19), (ST20), and (ST48), this diatom exhibited a symmetric response to temperature changes, contrasting with Equations (ST26) and (ST47). Most of the equations indicate a decrease in the growth rate with decreasing electrical conductivity, while Equations (ST15) and (ST19) represented a bell-shaped response curve. Based on AIC, the growth rate of N. gregaria could be best explained by non-interactive Equation (ST26) (R2 = 0.86; AIC = −229.82; Figure 6A; Table S9):
μ = μ m a x × e k T 1 × T T o p t 2   f o r   T T o p t e k T 2 × T T o p t 2   f o r   T > T o p t × e k S × S S o p t 2
where μ m a x (1/d) is the maximum growth rate obtained at the optimum temperature T o p t (°C) and the optimum conductivity S o p t (mS/cm); k T 1 and k T 2 (1/°C2) are the temperature effect factors at temperature below and above the optimum, respectively; and k S (cm2/mS2) is the salinity effect factor.
According to Equation (ST26), N. gregaria responded to temperature changes in an asymmetric norm. In particular, the growth rate decreased more strongly with temperature increases at high temperatures than at low temperatures. This contrasted with the symmetric response to salinity changes. The maximum growth rate (0.6; 1/d) was reached at 18.4 °C (17.3–19.4 °C) and 2.13 mS/cm (0.29–3.96 mS/cm; Table S9). Equation (ST26) could explain the variation in the growth rate of N. gregaria better than the interactive multiplicative Equation (ST52) (R2 = 0.86; AIC = −219.61; Figure 6B; Table S9) or the non-interactive polynomial Equation (4) (R2 = 0.84; AIC = −222.78; Figure 6C; Table S9). Moreover, all the best formulation forms display a non-interactive norm that is consistent with the data fitting with polynomial equations (Table S9).

3.3. Temperature and Salinity Tolerance of Freshwater Diatoms

In the present study, we attempted to estimate the salinity and temperature sensitivity of selected freshwater diatom strains by shock treatments, meaning that the cultures were not acclimated to the treatment conditions before their growth rates were measured. This means that our data might underestimate the niche breadth as well as the severity of non-optimal growth conditions upon growth rates. The lack of a uniform acclimation phase might also contribute to a relatively high noise-to-signal ratio in our growth rate measurements. With these reservations, we summarize the general conclusions from the above observations as relating to possible shapes of the temperature–salinity response surfaces. For further refinement of the modelling approach, pre-acclimated culture experiments will be beneficial.
The temperature tolerance range could be well estimated by empirical modelling described in the previous section for investigated diatom strains, except for M. varians and C. meneghiniana (Table 2). The growth rate of M. varians was expected to increase exponentially with increasing temperature with the best equation, as mentioned above. Our analysis indicates small variations in the optimum temperature among investigated freshwater diatoms (Table 2). In contrast, larger variations were revealed in the thermal breadth (Table 2). Among the diatoms, C. meneghiniana had the widest thermal tolerance, followed by N. linearis and U. acus (Table 2). The variations in the optimum temperature among the investigated freshwater diatoms (except for M. varians) were smaller than those reported in previous studies, probably related to the difference in the isolation approaches. For example, from other previous studies, the optimum temperature range differs among estuarine epipelic diatoms isolated from cohesive sediments sampled from three different sites along the Colne Estuary, UK: 10–20 °C for Navicula phyllepta, 10–30 °C for Navicula perminuta, and 20–35 °C for Navicula salinarum [42]. The diatom N. gregaria isolated from the epipelon reached the maximal growth at the lowest temperature (15 °C), compared to Nitzschia gracilis and Nitzschia palea isolated from the epiphyton, Navicula minima v. atomides (20 °C) from the episammon, or Navicula seminulum (30 °C) from the epipelon [22]. The growth of an estuarine clone of Nitzschia americana increased with increasing temperature up to 25 °C, above which the growth rate declined [29].
The optimum and the maximum conductivity could be estimated for all investigated strains, demonstrating N. linearis, M. varians, and N. gregaria as the most tolerant (Table 2). By contrast, C. incurvata and C. meneghiniana were the most sensitive to salinization with the lowest optimum and maximum conductivity (Table 2). Except for N. gregaria, the growth of the investigated freshwater diatoms ceased at electrical conductivity above 8.90 mS/cm (Table 2). Our results reveal the difference in the tolerance to temperature and salinity changes among the investigated freshwater diatoms. As a result of species-specific tolerance to salinity, the species composition and distribution of diatoms has been considered to be indicative of salinity gradients [43,44,45,46,47,48,49,50,51]. Therefore, an understanding of the tolerance of diatoms to salinity might provide a better understanding on their distribution in nature and facilitate predicting the species succession. Consequently, diatom-based models have been developed to quantitatively reconstruct salinity changes [47,48,52].
Different mathematical formulations of single-stressor reaction norms can be classified into two groups: (1) formulations that describe a monotonic response to increasing stressor intensity; and (2) formulations that exhibit a bell-shaped (unimodal or hormetic) relationship. The bell-shaped curve can be symmetric around the optimum or asymmetric, i.e., the response decreases to the right more steeply than to the left. In other words, at high stressor intensity, small changes in this environmental variable could significantly inhibit the growth of diatoms. The more profound inhibition of diatom growth by changes at high levels compared to low ranges reported previously [32,53] is clear evidence of the asymmetric response of diatoms. In this regard, our data set generated from four to five different temperature treatments is not sufficiently informative to differentiate between the latter two possibilities for temperature reaction norms. Furthermore, interactive effects between temperature and salinity might lead to or change the asymmetric response to one of these two environmental variables, as discussed below. The asymmetric temperature–growth curve for diatoms is also supported by their different responses between the stressor regime and the recovery phase [54]. In terms of responses to salinity changes, we found both monotonically decreasing as well as bell-shaped curves, indicating that some freshwater diatoms from the sampled habitat perform better under elevated salt concentrations than at very low salt levels. This is not surprising insofar as the locality sampled being affected by elevated salinity levels (conductivity often reaching, sometimes exceeding, 2 mS/cm).

3.4. Ambiguity in Empirically Modelling Interactive Effects under Various Environmental Conditions

3.4.1. Diversity of Interaction Types

Our assessment above indicates ambiguity in evaluating the effects of temperature and salinity on diatom growth by empirical modelling. Further ambiguity is inherent in the assessment of interactions between these two factors. Interactions between temperature and salinity could be interpreted in different ways (Tables S4–S9, Supplementary material). Of the two polynomial equations used, the one without interaction (Equation (4)) better described the growth of C. incurvata, N. linearis, C. meneghiniana, M. varians, U. acus, and N. gregaria than the one with interaction (Equation (5)), based on AIC (Tables S4–S9). Several further possibilities could be conceived to capture possible interactive effects in polynomial models. However, for the forms applied here, we generally conclude that polynomial formulations were never among the best fitting models tested. Beyond polynomials, a number of multiplicative equations indicated significant interactive effects of temperature and salinity (Tables S4–S9). For four of the six tested strains, interactive models were found to be the best based on AIC values (Tables S4–S9). With respect to ecological reaction norms, interactive effects of two stressors are conceivable in several different types, as illustrated in Table 3 and Table 4. The two main basic types of interactive effects can be summarized in several ways: one stressor shifting the location of the optimum to another; one stressor changing the slope of the (monotonic or bell-shaped) response curve, on one or both sides of the optimum; and one stressor affecting through a combination of the above mechanisms. Previous studies have also indicated that temperature and salinity might interact with each other, affecting the growth of diatoms [29,55,56]. The interactions revealed in the present study have been reported previously, mostly for marine diatoms. For example, the optimum temperature for the growth of the diatom N. americana depended on the salinity level [29]. The tolerance of Thalassiosira rotula to low salinity levels increased with temperatures ranging from 0 to 15 °C [57].

3.4.2. Ambiguity in Result Interpretation

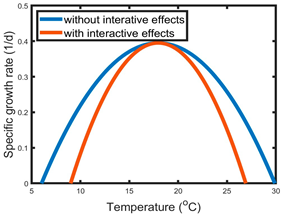
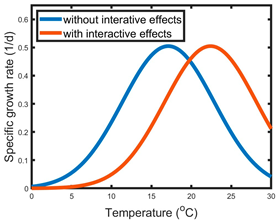
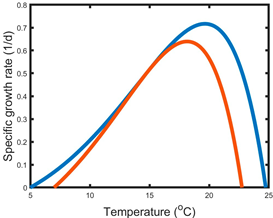
The most common interactive effect we observed was a change in the slope of the growth curve accompanied by the change in the tolerance breadth (Type A; Table 3 and Table 4). Interactive effects frequently increased the slope of the temperature-growth curve and narrowed the thermal breadth (Table 3 and Table 4). A narrowing effect of salinization on thermal tolerance was indicated for all investigated diatoms: C. incurvata (Equations (ST2), (ST4), and (ST7); Table S4), N. linearis (Equations (ST15) and (ST17); Table S5), C. meneghiniana (Equations (ST7) and (ST15); Table S6), U. acus (Equations (ST17) and (ST34); Table S8), and N. gregaria (Equation (ST15); Table S9). However, contrasting patterns could be estimated for the same species. For example, the thermal breadth of U. acus could be interpreted to be narrowed (Equations (ST17) and (ST34); Table S8), to be broadened one-sided (Equations (ST23), (ST37), and (ST39); Table S8), or both-sided (Equation (ST22); Table S8) by salinization (Table 4). These effects might change or cause asymmetric temperature–growth curves. An increase in the right-sided slope of the thermal curve (Table 3 and Table 4; Equations (ST23), (ST37), and (ST39); Table S8) resulted in asymmetric responses to temperature. This type of effect is more common than the effects on both sides of the curve. Contrasting types of interactions on the temperature–growth curve were also exhibited for N. linearis (Table 4). A reduction in an asymmetric thermal breadth could lower not only the maximum growth rate, but also the optimum temperature (Equations (ST2) and (ST4); Table 3 and Table 4), as demonstrated for C. incurvata (Table S4). By contrast, according to Equation (ST7), another strong candidate model for the same strain, the maximum growth rate of a symmetric response was not affected (Table 3, Table 4, and Table S4).
This type of interactions (A) was also revealed to express the influence of temperature increases on the conductivity–growth curve (Table 3 and Table 4). However, such interactions more frequently resulted in decreased slope and broadened breadth of the conductivity-growth curve (Table 3 and Table 4). The slope of a linear conductivity–growth relationship for N. linearis (Equation (ST21)), C. meneghiniana (Equation (ST21)), and M. varians (Equations (ST21) and (ST31)) was reduced by increasing temperature (Table 3 and Table 4). Similar effects could exert on exponential response curves. For example, the right-sided slope of the asymmetric conductivity–growth curve of U. acus (Equations (ST36), (ST38), (ST41), and (ST43); Table 3, Table 4, and Table S8) was decreased by temperature increases. Similar interactions might also affect the symmetric conductivity–growth response, leading to an asymmetric pattern. This was shown for M. varians (Equations (ST28), (ST30), and (ST32); Table 3, Table 4, and Table S7). Alternatively, both sides of the symmetric response to conductivity changes could be affected as was also displayed for M. varians (Equations (ST27) and (ST29); Table 3, Table 4, and Table S7). However, this type of interaction is less common than the effects on the right side of the exponential response curve (Table 3). Only for C. incurvata was an increase in temperature expected to reduce the maximum conductivity (Equation (ST11); Table 3, Table 4 and Table S4).
Compared to such common interactions, the change in the location of the optimum of the response curve was expected for two strains only. The optimum temperature of U. acus could be shifted to the right due to salinization (type B; Equations (ST33) and (ST34); Table 3, Table 4, and Table S8). Its optimum temperature was shifted to the right by salinization (Table 3 and Table 4). In addition, the temperature–growth curve for C. incurvata might be affected by a combination of the above interactions (type C; Equations (ST2) and (ST4); Table 3, Table 4, and Table S4). Accordingly, the temperature–growth curve could be altered horizontally and vertically by salinization. Both the thermal breadth and the optimum temperature could be lowered by increasing conductivity.
The interpretation in the present study is solid evidence of the diversity in the interaction types that can be deduced from empirical modelling. The question is which one reflects the nature of the interactions. With our limited physiological understanding of the interactions between various environmental variables, statistical parameters such as AIC might be considered. However, the validity of this method is of concern because of the limited variation in the AIC in the empirical modelling with these equations (Table 3). In other words, substantial uncertainties are inherent in the analysis of interaction types with empirical modelling. Among the five models that were found to be the best at describing the growth of the six investigated strains, interactive factors were included in four (Table 1). This result supports our hypothesis that interactive factors are commonly required to explain the variations in the responses of freshwater diatoms to temperature–salinity changes. Moreover, the simulation of various types of temperature–salinity interactions as given in Table 3 clearly demonstrates that the variability in the interactions could not be interpreted simply by synergism–antagonism dichotomy.

4. Conclusions

The response of organisms to a single environmental variable (stressor) could be expressed by a broad variety of functional forms, based on theoretical, mechanistic, or pragmatic grounds. These forms could be categorized into monotonic, symmetric bell-shaped, and asymmetric bell-shaped. In the context of exposure to binary stressors, stressor 1 might affect the response to stressor 2 by altering: (a) the slope, and consequently the tolerance breadth, of the response curve to stressor 2; (b) the location of the optimum for the response to stressor 2; and (c) both of these factors. Such a diversity of both the response to a single environmental variable and interaction effects leads to a large number of combinatorial possibilities for possible functional forms describing 3D reaction norm surfaces. While the fundamental niche breadth could be well estimated by empirical modelling, capturing interactions between temperature and salinity proved challenging in this study. Presence/absence or type of interaction could not be inferred unambiguously for most strains. Because of our limited understanding of the underlying mechanisms, our interpretation is purely based on statistical parameters, leading to ambiguity in such an assessment. Interactions between environmental variables, such as temperature and salinity, might enlarge the uncertainties in empirical modelling. When contrasting the vast diversity of possible functional forms, empirical data is usually not fully conclusive, raising the question of what approaches can improve the estimation. First, more treatments covering a large number of temperature and salinity levels should be included in the experiment. The present study indicates high uncertainties in empirical modelling with limited data. Second, background knowledge should be considered to pre-select functional forms. And third, the effects of environmental variables on growth could be mechanistically delineated via the effects on the processes that control growth, for example, photosynthesis, respiration, and energy dynamics. A more reliable estimate of algal growth that considers interactions between various environmental variables might improve our estimates of water quality models, food chain models, and biomass growth models for aquatic ecosystems as they are based on the growth rate of primary producers.

Supplementary Materials

The following supporting information can be downloaded at: https://www.mdpi.com/article/10.3390/phycology3040028/s1, Figure S1: The salinity response curve describing the specific growth rate (1/d) of Cymbella cf. incurvata, Nitzschia linearis, Cyclotella memeghiniana, Melosira varians, Ulnaria acus, and Navicula gregaria with changing salinity represented by the electrical conductivity (mS/cm) at the temperature range of 10–28 °C. Cymbella incurvate: 25 °C not included as the diatom did not grow regardless of the conductivity level; Table S1: Temperature-dependent maximum growth rate [58,59,60,61,62,63,64,65,66,67]; Table S2: Temperature factor [25,26,28,32,62,68,69,70,71,72,73,74,75,76,77,78,79,80,81,82,83]; Table S3: Salinity factor [26,27,28,70,72]; Table S4: Results of empirical modelling of the growth rate of Cymbella cf. incurvate at various temperatures and electrical conductivities; Table S5: Results of empirical modelling of the growth rate of Nitzschia linearis at various temperatures and electrical conductivities; Table S6: Results of empirical modelling of the growth rate of Cyclotella meneghiniana at various temperatures and electrical conductivities; Table S7: Results of empirical modelling of the growth rate of Melosira varians at various temperatures and electrical conductivities; Table S8. Results of empirical modelling of the growth rate of Ulnaria acus at various temperatures and electrical conductivities; Table S9. Results of empirical modelling of the growth rate of Navicula gregaria at various temperatures and electrical conductivities.

Author Contributions

Conceptualization, T.T.Y.L. and B.B.; methodology, T.T.Y.L. and B.B; software, T.T.Y.L.; formal analysis, T.T.Y.L. and B.B.; investigation, A.B. and J.K.; resources, S.B. and B.B.; data curation, A.B., J.K., S.B., B.B.; writing—original draft preparation, T.T.Y.L.; writing—review and editing, T.T.Y.L., L.F., N.A.S.M., S.B. and B.B.; visualization, T.T.Y.L.; supervision, T.T.Y.L., S.B. and B.B.; project administration, T.T.Y.L. and B.B.; funding acquisition, T.T.Y.L. and B.B. All authors have read and agreed to the published version of the manuscript.

Funding

This research was funded by the Deutsche Forschungsgemeinschaft (DFG, German Research Foundation), project number 426547801 (CRC 1439/1).

Institutional Review Board Statement

Not applicable.

Informed Consent Statement

Not applicable.

Data Availability Statement

The data presented in this study are available in the supplementary material.

Conflicts of Interest

The authors declare no conflict of interest.

Appendix A

Table A1. Recipe for the SFM + Si Medium.
Components and Final Concentration in
Culture Medium
Stock SolutionAddition Per Litre of Culture Medium
1. HEPES (1.00 mM)238.10 g/L dH2O1.0 mL
2. Ca(NO3)2 × 4 H2O (0.21 mM)100.00 g/L dH2O0.5 mL
3. MgSO4 × 7 H2O (0.203 mM)20.00 g/L dH2O2.5 mL
4. K2 HPO4 × 3 H2O (13.20 µM)5.00 g/L dH2O0.6 mL
  + NaNO3 (0.35 mM)50.00 g/L dH2O
  + Na2CO3 (0.19 mM)32.00 g/L dH2O
5. H3BO3 (16 µm)1.00 g/L dH2O1 mL
6. Vitamin Solution 1 mL
  Vitamin B12 (0.15 nM)0.20 mg/L dH2O
  Biotin (4.10 nM)1.00 mg/L dH2O
  Thiamine-HCl (0.30 µM)100.00 mg/L dH2O
  Niacinamide (0.80 nM)0.10 mg/L dH2O
pH of the Vitamin Solution should be around pH 7
7. Trace Metals 1 mL
  7.1. Preparation of Trace Metal Solution
    Na2EDTA × 2 H2O: 4.36 g
    FeCl3 × 6 H2O: 3.15 g
Dissolve in 1000 mL dH2O, then add 1 mL of Primary Trace Metals each (see below).
Primary Trace Metals are stored frozen as 1 mL aliquots.
  7.2. Primary Trace Metals
    7.2.1. K2CrO4 0.194 g/100 mL dH2O
    7.2.2. CoCl2 × 6 H2O1.00 g/100 mL dH2O
    7.2.3. CuSO4 × 5 H2O0.25 g/100 mL dH2O
    7.2.4. MnCl2 × 4 H2O518.00 g/100 mL dH2O
    7.2.5. Na2MoO4 × 2 H2O1.89 g/100 mL dH2O
    7.2.6. NiSO4 × 6 H2O0.27 g/100 mL dH2O
    7.2.7. H2SeO30.13 g /100 mL dH2O
    7.2.8. Na3VO40.184 g /100 mL dH2O
    7.2.9. ZnSO4 × 7 H2O 2.20 g/100 mL dH2O
8. Na2SiO3 × 9 H2O (0.50 mM)–optional28.42 g/L dH2O5 mL

References

  1. Field, C.B.; Behrenfeld, M.J.; Randerson, J.T.; Falkowski, P.G. Primary production of the biosphere: Integrating terrestrial and oceanic components. Science 1998, 281, 237–240. [Google Scholar] [CrossRef]
  2. Wilhelm, C.; Buchel, C.; Fisahn, J.; Goss, R.; Jakob, T.; LaRoche, J.; Laavud, J.; Lohr, M.; Riebesell, U.; Stehfest, K.; et al. The regulation of carbon and nutrient assimilation in diatoms is significantly different green algae. Protist 2006, 157, 91–124. [Google Scholar] [CrossRef]
  3. Prestegard, S.K.; Knutsen, G.; Herfindal, L. Adenosine content and growth in the diatom Phaeodactylum tricornutum (Bacillariophyceae): Effect of salinity, light, temperature and nitrate. Diatom Res. 2014, 29, 361–369. [Google Scholar] [CrossRef]
  4. Smol, J.P.; Stoermer, E.F. The Diatoms: Applications for the Environmental and Earth Sciences; Cambridge University Press: Cambridge, MA, USA, 2010. [Google Scholar]
  5. Lobo, E.A.; Heinrich, C.G.; Schuch, M.; Wetzel, C.E.; Ector, L. Diatoms as bioindicators in rivers. In River Algae; Necchi, O., Jr., Ed.; Springer: Berlin/Heidelberg, Germany, 2016; pp. 245–271. [Google Scholar]
  6. Stevenson, R.J.; Pan, Y.; Van Dam, H. Assessing environmental conditions in rivers and streams with diatoms. In The Diatoms: Applications for the Environmental and Earth Sciences; Smol, J.P., van Dam, H., Eds.; Cambridge University Press: Cambridge, MA, USA, 1999; pp. 57–85. [Google Scholar]
  7. Birks, H.J.B. Numerical methods for the analysis of diatom assemblage data. In The Diatoms: Applications for the Environmental and Earth Sciences, 2nd ed.; Smol, P.J., Stoermer, E.F., Eds.; Cambridge University Press: Cambridge, MA, USA, 2010; pp. 23–54. [Google Scholar]
  8. Pajunen, V.; Kahlert, M.; Soininen, J. Stream diatom assemblages as environmental indicators–A cross-regional assessment. Ecol. Indic. 2020, 113, 106183. [Google Scholar] [CrossRef]
  9. Crain, C.M.; Kroeker, K.; Halpern, B.S. Interactive and cumulative effects of multiple ahuman stressors in marine systems. Ecol. Lett. 2008, 11, 1304–1315. [Google Scholar] [CrossRef]
  10. Jackson, M.; Loewen, C.G.; Vinebrooke, R.D.; Chimimba, C.T. Net effects of multiple stressors in freshwater ecosystems: A meta-analysis. Glob. Chang. Biol. 2016, 22, 180–189. [Google Scholar] [CrossRef]
  11. Cote, I.M.; Darling, E.S.; Brown, C.J. Interactions among ecosystem stressors and their importance in conservation. Proc. R. Soc. B 2016, 283, 10152592. [Google Scholar] [CrossRef]
  12. Birk, S.; Chapman, D.; Carvalho, L.; Spears, B.M.; Andersen, H.E.; Argillier, C.; Auer, S.; Baattrup-Pedersen, A.; Banin, L.; Beklioğlu, M.; et al. Impacts of multiple stressors on freshwater biota across spatial scales and ecosystems. Nat. Ecol. Evol. 2020, 4, 1060–1068. [Google Scholar] [CrossRef]
  13. Boyd, P.W.; Collins, S.; Dupont, S.; Fabricius, K.; Gattuso, J.P.; Havenhand, J.; Hutchins, D.A.; Riebesell, U.; Rintoul, M.S.; Vichi, M.; et al. Experimental strategies to assess the biological ramifications of multiple drivers of global ocean change—A review. Glob. Chang. Biol. 2017, 24, 2239–2261. [Google Scholar] [CrossRef]
  14. Erofeeva, E.A. Plant hormesis and Shelford’s tolerance law curve. J. For. Res. 2021, 32, 1789–1802. [Google Scholar] [CrossRef]
  15. Low-Decarie, E.; Boatman, T.G.; Bennett, N.; Passfield, W.; Gavalas-Olea, A.; Siegel, P.; Geider, R.J. Predictions of response to temperature are contingent on model choice and data quality. Ecol. Evol. 2017, 7, 10467–10481. [Google Scholar] [CrossRef]
  16. Barton, S.; Yvon-Durocher, G. Quantifying the temperature dependence of growth rate in marine phytoplankton within an across species. Limnol. Oceanogr. 2019, 64, 2081–2091. [Google Scholar] [CrossRef]
  17. Grimaud, G.M.; Mairet, F.; Sciandra, A.; Bernard, O. Modeling the temperature effect on the specific growth rate of phytoplankton: A review. Rev. Environ. Sci. Biotechnol. 2017, 16, 625–645. [Google Scholar] [CrossRef]
  18. Brand, L.E. The salinity tolerance of forty-six marine phytoplankton isolates. Estuar. Coast. Shelf. S. 1984, 18, 542–556. [Google Scholar] [CrossRef]
  19. Kirst, G.O. Salinity tolerance of eukaryotic marine algae. Annu. Rev. Plant. Physiol. Plant Mol. Biol. 1989, 40, 21–53. [Google Scholar] [CrossRef]
  20. Albrecht, M.; Roshan, S.K.; Fuchs, L.; Karsten, U.; Schumann, R. Applicability and limitations of high-throughput algal growth rate measurements using in vivo fluorescence in microtiter plates. J. Appl. Phycol. 2022, 34, 2037–2049. [Google Scholar] [CrossRef]
  21. Mata, T.M.; Martins, A.A.; Caetano, N.S. Microalgae for biodiesel production and other applications: A review. Renew. Sustain. Energ. Rev. 2010, 14, 217–232. [Google Scholar] [CrossRef]
  22. Beliveau, D.J.; Hickman, M. Isolation and response to temperature of five diatom species. Arch. Protstenk. 1982, 126, 355–370. [Google Scholar] [CrossRef]
  23. Lee, E.; Jalalizadeh, M.; Zhang, Q. Growth kinetic models for microalgae cultivation: A review. Algal Res. 2015, 12, 497–512. [Google Scholar] [CrossRef]
  24. Gustavs, L.; Schumann, R.; Eggert, A.; Karsten, U. In vivo growth fluorometry: Accuracy and limits of microalgal growth rate measurements in ecophysiological innvestigations. Aquat. Microb. Ecol. 2009, 55, 95–104. [Google Scholar] [CrossRef]
  25. Cerco, C.F.; Cole, T. User’s Guide to the CE-QUAL-ICM Three-Dimensional Eutrophication Model; US Army Corps of Engineers: Washington, DC, USA, 1995. [Google Scholar]
  26. Gharagozloo, P.E.; Drewry, J.L.; Collins, A.M.; Dempster, T.A.; Choi, C.Y.; James, S.C. Analysis and modeling of Nannochloropsis growth in lab, greenhouse, and raceway experiments. J. Appl. Phycol. 2014, 26, 2303–2314. [Google Scholar] [CrossRef]
  27. Gao, S.; Waller, P.; Khawam, G.; Attalah, S.; Huesemann, M.; Ogden, K. Incorporation of salinity, nitrogen, and shading stress factors into the Huesemann Algae Biomass Growth model. Algal Res. 2018, 35, 462–470. [Google Scholar] [CrossRef]
  28. Dudley, B.D.; Barr, N.G.; Plew, D.R.; Scheuer, K. Experiments to parameterise a growth and nutrient storage model for Agarophyton spp. Estuar. Coast. Shelf Sci. 2022, 264, 107660. [Google Scholar] [CrossRef]
  29. Miller, R.L.; Kamykowski, D.L. Effects of temperature, salinity, irradiance and diurnal periodicity on growth and photosynthesis in the diatom Nitzschia americana: Light-saturated growth. J. Phycol. 1986, 22, 339–348. [Google Scholar] [CrossRef]
  30. Bosma, R.; van Zessen, E.; Reith, J.H.; Tramper, J.; Wijffels, R.H. Prediction of volumetric productivity of an outdoor photobioreactor. Biotechnol. Bioeng. 2007, 97, 1108–1120. [Google Scholar] [CrossRef]
  31. Akaike, H. Information theory and an extension of the maximum likelihood principle. In Selected Papers of Hirotugu Akaike. Springer Series in Statistics; Parzen, E., Tanabe, K., Kitagawa, G., Eds.; Springer: New York, NY, USA, 1998; pp. 199–213. [Google Scholar]
  32. Bernard, O.; Remond, B. Validation of a simple model accounting for light and temperature on microalgal growth. Bioresour. Technol. 2012, 123, 520–527. [Google Scholar] [CrossRef]
  33. Singh, S.P.; Singh, P. Effect of temperature and light on the growth of algae species: A review. Renew. Sustain. Energy Rev. 2015, 50, 431–444. [Google Scholar] [CrossRef]
  34. Walter, B.; Peters, J.; van Beusekom, J.E.E.; John, M.A.S. Interactive effects of temperature and light during deep convection: A case study on growth and condition of the diatom Thalassiosira weissflogii. ICES J. Mar. Sci. 2015, 72, 2061–2071. [Google Scholar] [CrossRef]
  35. Renaud, S.M.; Thinh, L.-V.; Lambrinidis, G.; Parry, D.L. Effect of temperature on growth, chemical composition and fatty acid composition of tropical Australian microalgae grown in batch cultures. Aquaculture 2002, 211, 195–214. [Google Scholar] [CrossRef]
  36. Ras, M.; Steyer, J.-P.; Bernard, O. Temperature effect on microalgae: A crucial factor for outdoor production. Rev. Environ. Sci. Bio/Technol. 2013, 12, 153–164. [Google Scholar] [CrossRef]
  37. Falk, S.; Maxwell, D.P.; Laudenbach, D.E.; Huner, N.P.A. Photosynthetic adjustment to temperature. In Photosynthesis and the Environment; Baker, N.R., Ed.; Springer: Dordrecht, The Netherlands, 1996; pp. 367–385. [Google Scholar]
  38. Roubeix, V.; Lancelot, C. Effect of salinity on growth, cell size and silicification of an euryhaline freshwater diatom: Cyclotella meneghiniana. Transit. Waters Bull. 2008, 1, 31–38. [Google Scholar]
  39. Yin, J.; Sun, X.; Zhao, R.; Qiu, X.; Eeswaran, R. Application of uniform design to evaluate the different conditions on the growth of algae Prymnesium parvum. Sci. Rep. 2021, 11, 12672. [Google Scholar] [CrossRef] [PubMed]
  40. Ritchie, R.J.; Larkum, A.W.D. Potassium transport in Enteromorpha intestinalis (L.) link. J. Exp. Bot. 1985, 164, 394–412. [Google Scholar] [CrossRef]
  41. Munns, R.; Greenway, H.; Kirst, G.O. Halotolerant eukaryotes. In Encyclopedia of Plant Physiology; Lange, O.L., Nobel, P.S., Osmond, C.B., Ziegler, H., Eds.; Springer: Berlin/Heidelberg, Germany; New York, NY, USA, 1983; Volume 12C, pp. 59–135. [Google Scholar]
  42. Underwood, G.J.C.; Provot, L. Determining the environmental preferences of four estuarine epipelic diatom taxa: Growth across a range of salinity, nitrate and ammonium conditions. Eur. J. Phycol. 2000, 35, 173–182. [Google Scholar] [CrossRef]
  43. Cumming, B.F.; Smol, J.P. Development of diatom-based salinity models for paleoclimatic research from lakes in British Columbia (Canada). van Dam, H., Ed.; In Twelfth International Diatom Symposium. Developments in Hydrobiology; Springer: Dordrecht, The Netherland, 1993; Volume 90. [Google Scholar]
  44. Clavero, E.; Hernandez-Marine, M.; Grimalt, J.O.; Garcia-Pichel, F. Salinity tolerance of diatoms from thalassic hypersaline environments. J. Phycol. 2000, 36, 1021–1034. [Google Scholar] [CrossRef]
  45. Wachnicka, A.; Gaiser, E.; Collins, L.; Frankovich, T.; Boyer, J. Distribution of diatoms and development of diatom-based models for inferring salinity and nutrient concentrations in Florida Bay and Adjacent Coastal Wetlands of South Florida. Estuar. Coast. 2010, 33, 1080–1098. [Google Scholar] [CrossRef]
  46. Potapova, M. Patterns of diatom distribution in relation to salinity. In The Diatom World; Seckbach, J., Kociolek, J.P., Eds.; Springer: Berlin/Heidelberg, Germany, 2011; pp. 313–332. [Google Scholar]
  47. Saunders, K.M. A diatom dataset and diatom-salinity inference model for southeast Australian estuaries and coastal lakes. J. Paleolimnol. 2011, 46, 525–542. [Google Scholar] [CrossRef]
  48. Reed, J.M.; Mesquita-Joanes, F.; Griffiths, H.I. Multi-indicator conductivity transfer functions for quaternary palaeoclimate reconstruction. J. Paleolimnol. 2012, 47, 251–275. [Google Scholar] [CrossRef]
  49. Nodine, E.R.; Gaiser, E.E. Distribution of diatoms along environmental gradients in the Charlotte Harbor, Florida (USA), estuary and its watershed: Implications for bioassessment of salinity and nutrient concentrations. Estuar. Coast. 2014, 37, 864–879. [Google Scholar] [CrossRef]
  50. Rzodkiewicz, M.; Gabka, M.; Szpikowska, G.; Woszczyk, M. Diatom assemblages as indicators of salinity gradients: A case study from a coastal lake. Oceanol. Hydrobiol. Stud. 2017, 46, 325–339. [Google Scholar] [CrossRef]
  51. Tibby, J.; Richards, J.; Tyler, J.J.; Barr, C.; Fluin, J.; Goonan, P. Diatom-water quality thresholds in South Australian stream indicate a need for more stringent water quality guidelines. Mar. Freshw. Res. 2020, 71, 942–952. [Google Scholar] [CrossRef]
  52. Juggins, S. Quantitative reconstructions in palaeolimnology: New paradigm or sick science? Quarter. Sci. Rev. 2013, 64, 20–32. [Google Scholar] [CrossRef]
  53. Sogaard, D.H.; Hansen, P.J.; Rysgaard, S.; Glud, R.N. Growth limitation of three Arctic sea algal species: Effects of salinity, pH, and inorganic carbon availability. Polar Biol. 2011, 34, 1157–1165. [Google Scholar] [CrossRef]
  54. Remy, M.; Hillebrand, H.; Floder, S. Stability of marine phytoplankton communities facing stress related to global change: Interactive effects of heat waves and turbidity. J. Exp. Mar. Biol. Ecol. 2017, 497, 219–229. [Google Scholar] [CrossRef]
  55. Yan, T.; Zhou, M.; Qian, P. Combined effects of temperature, irradiance and salinity on growth of diatom Skeletonema costatum. Chi. J. Oceano. Limnol. 2002, 20, 237–243. [Google Scholar]
  56. Baek, S.H.; Jung, S.W.; Shin, K. Effects of temperature and salinity on growth of Thalassiosira pseudonana (Bacillariophyceae) isolated from ballast water. J. Freshw. Ecol. 2011, 26, 547–552. [Google Scholar]
  57. Krawiec, R.W. Autecology and clonal variability of the marine centric diatom Thalassiosira rotula (Bacillariphyceae) in response to light, temperature and salinity. Mar. Biol. 1982, 69, 79–89. [Google Scholar] [CrossRef]
  58. Collins, C.D.; Boylen, C.W. Physiological responses of Anabaena variabilis (Cyanophyceae) to instantaneous exposure to various combinations of light intensity and temperature. J. Phycol. 1982, 18, 206–211. [Google Scholar] [CrossRef]
  59. Arrigo, K.R.; Sullivan, C.W. A high resolution bio-optical model of microalgal growth: Tests using sea-ice algal community time-series data. Limnol. Oceanogr. 1994, 39, 609–631. [Google Scholar] [CrossRef]
  60. Moisan, J.R.; Moisan, T.A.; Abbott, M.R. Modelling the effect of temperature on the maximum growth rates of phytoplankton populations. Ecol. Model. 2002, 153, 197–215. [Google Scholar] [CrossRef]
  61. Montagnes, D.J.S.; Kimmance, S.A.; Atkinson, D. Using Q10: Can growth rates increase linearly with temperature? Aquat. Microb. Ecol. 2003, 32, 307–313. [Google Scholar] [CrossRef]
  62. Haario, H.; Kalachev, L.; Laine, M. Reduced models of algae growth. Bull. Mathe. Biol. 2009, 71, 1626–1648. [Google Scholar] [CrossRef] [PubMed]
  63. Pegallapati, A.K.; Nirmalakhandan, N. Modeling algal growth in bubble columns under sparging with CO2-enriched air. Bioresour. Technol. 2012, 124, 137–145. [Google Scholar] [CrossRef]
  64. Ketheesan, B.; Nirmalakhandan, N. Modeling microalgal growth in an airlift-driven raceway reactor. Bioresour. Technol. 2013, 136, 689–696. [Google Scholar] [CrossRef] [PubMed]
  65. Bordel, S.; Guieysse, B.; Munoz, R. Mechanistic model for the reclamation of industrial wastewaters using algal-bacterial photobioreactors. Environ. Sci. Technol. 2009, 43, 3200–3207. [Google Scholar] [CrossRef] [PubMed]
  66. Bernhardt, J.R.; Sunday, J.M.; Thompson, P.L.; O’Connor, M.I. Nonlinear averaging of thermal experience predicts population growth rates in a thermally variable environment. Proc. R. Soc. B. 2018, 285, 20181076. [Google Scholar] [CrossRef]
  67. Thomas, M.K.; Kremer, C.T.; Klausmeier, C.A.; Litchman, E. A global pattern of thermal adaptation in marine phytoplankton. Science 2012, 338, 1085–1088. [Google Scholar] [CrossRef]
  68. Cossins, A.R.; Bowler, K. Temperature Biology of Animals; Chapman and Hall: New York, NY, USA, 1987. [Google Scholar]
  69. James, S.C.; Janardhanam, V.; Hanson, D.T. Simulating pH effects in an algal growth hydrodynamics model. J. Phycol. 2013, 49, 608–615. [Google Scholar] [CrossRef]
  70. Cerco, C.F.; Cole, T. Three-Dimensional Eutrophication Model of Chesapeake Bay; US Army Corps of Engineers: Washington, DC, USA, 1994. [Google Scholar]
  71. Dauta, A.; Devaux, J.; Piquemal, F.; Boumnich, L. Growth rate of four freshwater algae in relation to light and temperature. Hydrobiologia 1990, 207, 221–226. [Google Scholar] [CrossRef]
  72. Martins, I.; Azevedo, A.; Gomez, I.; Valente, L.M.P. Variation on the standing stock of Gracilaria sp. In a temperature estuary under single-stressor and multiple-stressor climate change scenarios. Algal Res. 2020, 51, 102079. [Google Scholar] [CrossRef]
  73. Tevatia, R.; Demirel, Y.; Rudrappa, D.; Blum, P. Effects of thermodynamically coupled reaction diffusion in microalgae growth and lipid accumulation: Model development and stability analysis. Comp. Chem. Engineer. 2015, 75, 28–39. [Google Scholar] [CrossRef]
  74. Guterman, H.; Vonshak, A.; Ben-Yaakov, S. A macromodel for outdoor algal mass production. Biotechnol. Bioeng. 1990, 35, 809–819. [Google Scholar] [CrossRef] [PubMed]
  75. Chen, M.; Fan, M.; Liu, R.; Wang, X.; Yuan, X.; Zhu, H. The dynamics of temperature and light on the growth of phytoplankton. J. Theor. Biol. 2015, 385, 8–19. [Google Scholar] [CrossRef]
  76. Di Toro, D.M.; O’Connor, D.J.; Thomann, R.V. A dynamic model of the phytoplankton population in the sacramento-san joaquin delta. Am. Chem. Soc. 1971, 106, 131–180. [Google Scholar]
  77. Ahlgren, G. Temperature functions in biology and their application to algal growth constants. Oikos 1987, 49, 177–190. [Google Scholar] [CrossRef]
  78. Blanchard, G.F.; Guarini, J.-M.; Richard, P.; Gros, P.; Mornet, F. Quantifying the short-term temperature effect on light-saturated photosynthesis of intertidal microphytobenthos. Mar. Ecol. Prog. Ser. 1996, 134, 309–313. [Google Scholar] [CrossRef]
  79. Slegers, P.M.; Loesing, M.B.; Wijffels, R.H.; van Straten, G.; van Boxtel, A.J.B. Scenario evaluation of open pond microalgae production. Algal Res. 2013, 2, 358–368. [Google Scholar] [CrossRef]
  80. Quinn, J.; de Winter, L.; Bradley, T. Microalgae bulk growth model with application to industrial scale systems. Bioresource Technol. 2011, 102, 5083–5092. [Google Scholar] [CrossRef]
  81. Geider, R.J.; MacIntyre, H.L.; Kana, T.M. Dynamic model of phytoplankton growth and acclimation: Responses of the balanced growth rate and the chlorophyll a:carbon ratio to light, nutrient-limitation and temperature. Mar. Ecol. Prog. Ser. 1997, 148, 187–200. [Google Scholar] [CrossRef]
  82. Wigmosta, M.S.; Coleman, A.M.; Skaggs, R.J.; Huesemann, M.H.; Lane, L.J. National microalgae biofuel production potential and resource demand. Water Resour. Res. 2011, 47, W00H04. [Google Scholar] [CrossRef]
  83. Kleiman, R.M.; Characklis, G.W.; Kern, J.D.; Gerlach, R. Characterizing weather-related biophysical and financial risks in algal biofuel production. App. Energ. 2021, 294, 116960. [Google Scholar] [CrossRef]
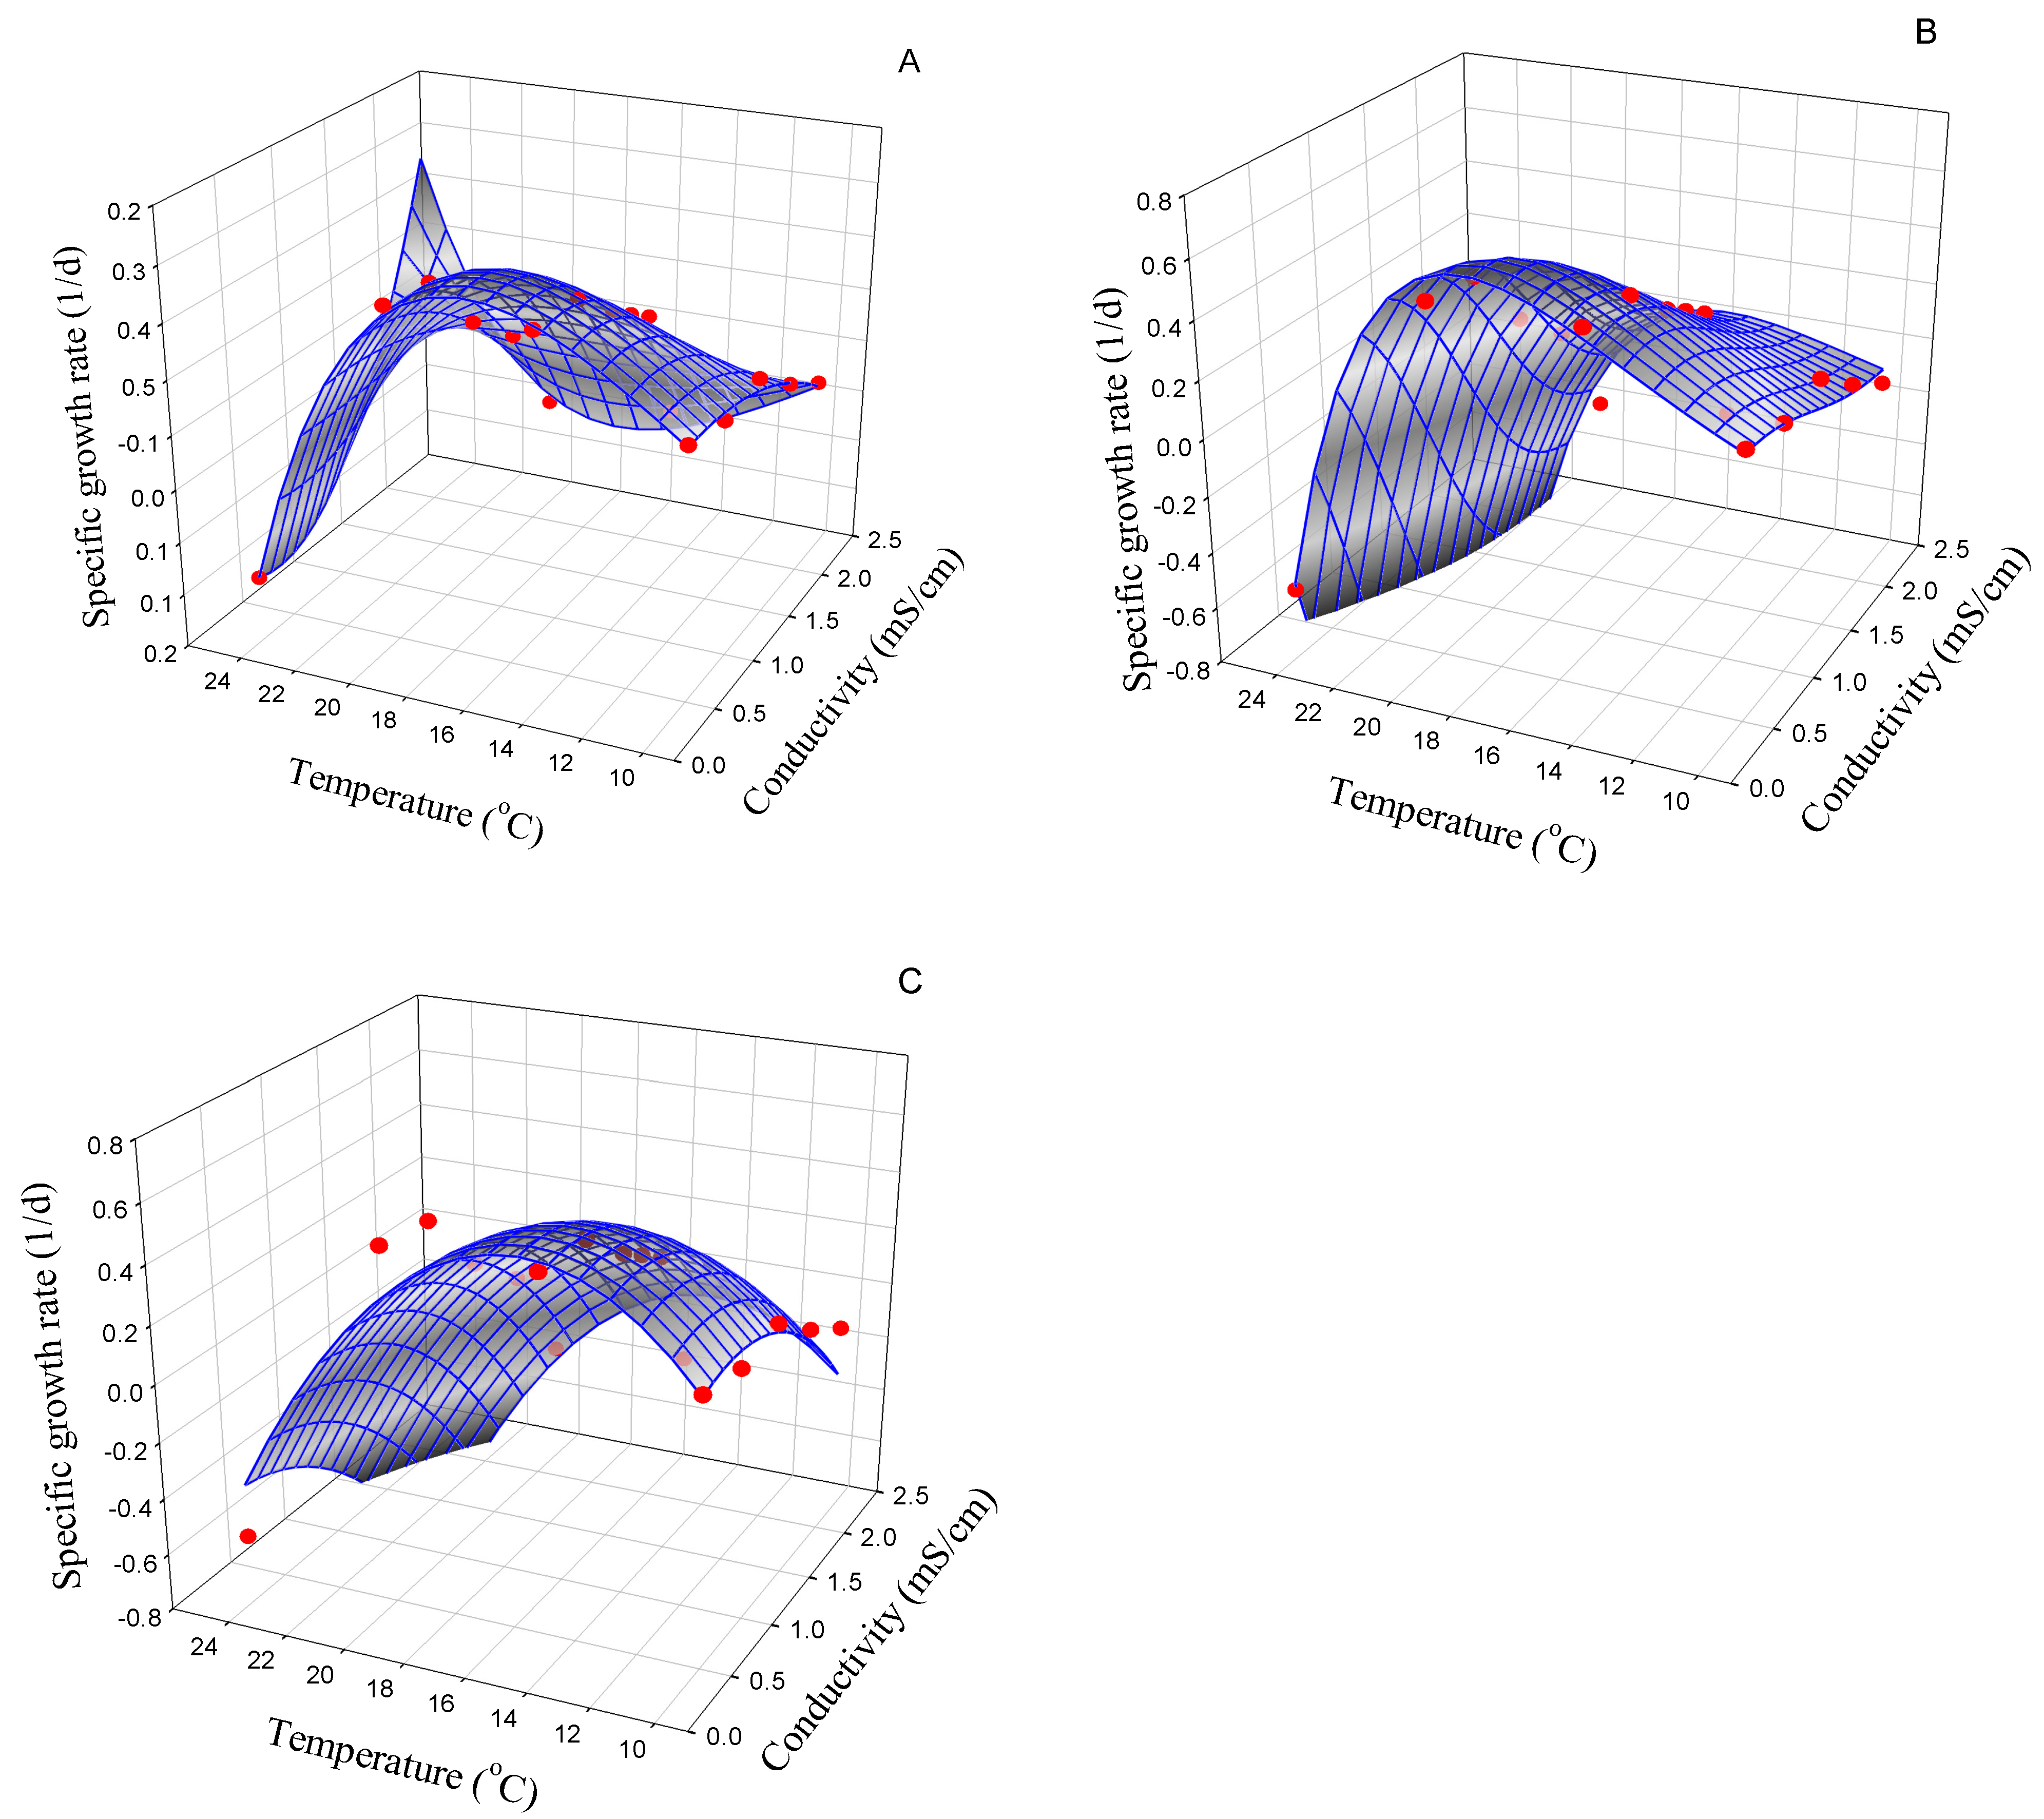
Figure 1. Simulation of the growth of Cymbella incurvata based on experimental data according to non-interactive multiplicative Equation (ST13) ((A); R2 = 0.97; AIC = −91.06), interactive multiplicative Equation (ST2) ((B); R2 = 0.88; AIC = −62.08), and polynomial Equation (4) ((C); R2 = 0.82; AIC = −59.42).
Phycology 03 00028 g001
Figure 2. Simulation of the growth of Nitzschia linearis based on experimental data according to non-interactive multiplicative Equation (ST14) ((A); R2 = 0.53; AIC = −130.43), interactive multiplicative Equation (ST15) ((B); R2 = 0.59; AIC = −133.49), and polynomial Equation (4) ((C); R2 = 0.51; AIC = −128.74).
Phycology 03 00028 g002
Figure 3. Simulation of the growth of Cyclotella meneghiniana based on experimental data according to non-interactive multiplicative Equation (ST25) ((A); R2 = 0.52; AIC = −34.29), interactive multiplicative Equation (ST15) ((B); R2 = 0.80; AIC = −43.90), and polynomial Equation (4) ((C); R2 = 0.58; AIC = −34.25).
Phycology 03 00028 g003
Figure 4. Simulation of the growth of Melosira varians based on experimental data according to non-interactive multiplicative Equation (ST9) ((A); R2 = 0.21; AIC = −42.61), interactive multiplicative Equation (ST11) ((B); R2 = 0.57; AIC = −51.79), and polynomial Equation (5) ((C); R2 = 0.45; AIC = −45.37).
Phycology 03 00028 g004
Figure 5. Simulation of the growth of Ulnaria acus based on experimental data according to non-interactive multiplicative Equation ST18 ((A); R2 = 0.67; AIC = −88.67), interactive multiplicative Equation ST35 ((B); R2 = 0.74; AIC = −94.70), and polynomial Equation (4) ((C); R2 = 0.51; AIC = −80.87).
Phycology 03 00028 g005
Figure 6. Simulation of the growth of Navicula gregaria based on experimental data according to non-interactive multiplicative Equation (ST26) ((A); R2 = 0.86; AIC = −229.82), interactive multiplicative Equation (ST52) ((B); R2 = 0.83; AIC = −219.61), and polynomial Equation (4) ((C); R2 = 0.84; AIC = −222.78).
Phycology 03 00028 g006
Table 1. Best models selected for the investigated freshwater diatoms based on AIC.
StrainBest ModelSymbol (Unit)Model ParameterAIC
Cymbella cf. incurvata μ = c × e d × T × 1 T z w / 2 2 × 1 S S o p t S m a x S o p t 2 z (°C)Optimum temperature of the quadratic portion; when d = 0, this value is identical to the optimum temperature of the whole curve (i.e., growth reaches the maximum rate, and the thermal response is symmetric)−91.06
w (°C)the thermal breadth (i.e., the range over which diatoms grow)
S o p t (mS/cm)Optimum conductivity
S m a x (mS/cm)Maximum conductivity above which growth ceases
Nitzschia linearis μ = μ m a x × 1 T T o p t w × 1 + a S T × S / 2 2 × e k S × S S o p t 2 μ m a x (1/d)Maximum growth rate reached at the optimum temperature ( T o p t ; °C) and the optimum conductivity ( S o p t ; mS/cm)−133.49
w (°C)Thermal breadth that can be affected by salinity depending on the interaction coefficien a S T (cm/mS)
k S (cm2/mS2)Salinity effect factor
Cyclotella meneghiniana μ = μ m a x × 1 T T o p t w × 1 + a S T × S / 2 2 × e k S × S S o p t 2 See aboveSee above−43.90
Melosira varians μ = μ 20 × θ T 20 × 1 S S o p t S m a x × 1 + a S T × T S o p t 2 μ 20 (1/d)Growth rate at 20 °C−51.79
S o p t (mS/cm)Optimum conductivity
S m a x (mS/cm)Maximum conductivity above which growth ceases
Ulnaria acus μ = μ m a x × e k T × T T o p t × 1 + a S T × S 2 × 1 S S o p t S m a x S o p t 2 k T (1/°C2)Temperature effect factor describing the change in the growth rate with increasing temperature below or above the optimum ( T o p t ; °C)−94.70
S o p t (mS/cm)Optimum conductivity for growth
S m a x (mS/cm)Maximum conductivity for growth
a S T (cm/mS)Represents the interactive effect
Navicula gregaria μ = μ m a x × e k T 1 × T T o p t 2   f o r   T T o p t e k T 2 × T T o p t 2   f o r   T > T o p t × e k S × S S o p t 2 μ m a x (1/d) isMaximum growth rate obtained at the optimum temperature T o p t (°C) and the optimum conductivity S o p t (mS/cm)−229.82
k T 1   and   k T 2 (1/°C2)Temperature effect factors at temperature below and above the optimum, respectively
k S (cm2/mS2)Salinity effect factor.
Table 2. Temperature and salinity tolerance of the freshwater diatoms estimated with the best equation.
StrainTemperature ResponseSalinity Response
Optimum
Temperature (°C)
Thermal Breadth (°C)Temperature
Tolerance Range (°C)
Optimum
Conductivity (mS/cm)
Maximum
Conductivity (mS/cm)
Half-Saturation
Conductivity (mS/cm)
Cymbella cf.
incurvate
15.8 (15.3–16.3)14.8 (12. 7–16.9)15.5 ± 7.40.63 (0.35–0.90)1.81 (1.75–1.88)0.81 (0.01–1.61)
Nitzschia linearis15.9 (14.7–17.1)31.8 (24.1–39.4)15.9 ± 15.92.44 (2.02–2.87)5.29 (4.84–5.74)4.60 (1.17–8.04)
Cyclotella
meneghiniana
17.3 (13.9–20.8)59.6 (0–121.0)17.3 ± 29.80.69 (0.58–0.81)1.38 (1.06–1.71)
Melosira varians 1.20 (1.06–1.34)6.41 (3.81–8.90)
Ulnaria acus17.1 (12.2–22.0)28.1 (11.7–44.4)17.1 ± 14.11.08 (0.79–1.37)2.29 (2.02–2.56)
Navicular gregaria18.4 (17.3–19.4)19.3 (17.9–20.6)18.4 ± 9.72.12 (0.29–3.96) 9.01 (6.65–11.37)
Table 3. Illustration of various types of interactive effects visualized by a comparison of changes in the shape of a reaction norm.
Interaction IDType of InteractionInteractive EffectsSimulation
AStressor 1—modulated slope of the response to stressor 2 Salinization increased or decreased the slope of the temperature–growth curve, which is accompanied by the narrowed or broadened thermal breadth, respectively. Similar effects can be exerted by temperature increases on the conductivity–growth curve.Phycology 03 00028 i001
BStressor 1—shifted optimum level of stressor 2Salinization increases the optimum temperature of the bell-shaped temperature–growth curvePhycology 03 00028 i002
CCombination of A and BThe temperature–growth curve is modulated both vertically and horizontally by salinization. Salinization narrows the thermal breadth. Both the optimum temperature and the maximum growth rate are lowered. Phycology 03 00028 i003
Table 4. Various types of interactions revealed for freshwater diatoms. The best model for each strain with respect to AIC value marked with double asterisk; models within 6 AIC units from the latter (relative likelihood compared to best model < 5%) with a single asterisk.
EquationInteraction IDAIC
Cymbella
incurvata
Nitzschia
linearis
Cyclotella
meneghiniana
Melosia
varians
Ulnaria acusNavicula
gregaria
ST7A−52.53 −33.02
ST15A −133.49 **−43.90 ** −173.43
ST17A −131.76 * −90.30 *
ST34A −88.75 *
ST11A−56.91 −51.79 **
ST21A −120.46−32.72−42.93
ST31A −43.25
ST22A −117.83 −78.93
ST23A −118.88 −87.97 *
ST37A −88.43 *
ST39A −88.09 *
ST27A −42.19
ST29A −44.10
ST28A −42.85
ST30A −44.78
ST32A −41.02
ST36A −87.56
ST38A −89.24 *
ST41A −86.34
ST43A −84.32
ST51A −211.67
ST52A −219.61 **
ST33B −89.72 *
ST35B −94.70 **
ST2C−62.08 **
ST4C−60.63 *
Disclaimer/Publisher’s Note: The statements, opinions and data contained in all publications are solely those of the individual author(s) and contributor(s) and not of MDPI and/or the editor(s). MDPI and/or the editor(s) disclaim responsibility for any injury to people or property resulting from any ideas, methods, instructions or products referred to in the content.