
The Fate and Distribution of Microalgal Nitrogen When Applied as an Agricultural Soil Fertiliser and Its Effect on Soil Microbial Communities


Abstract
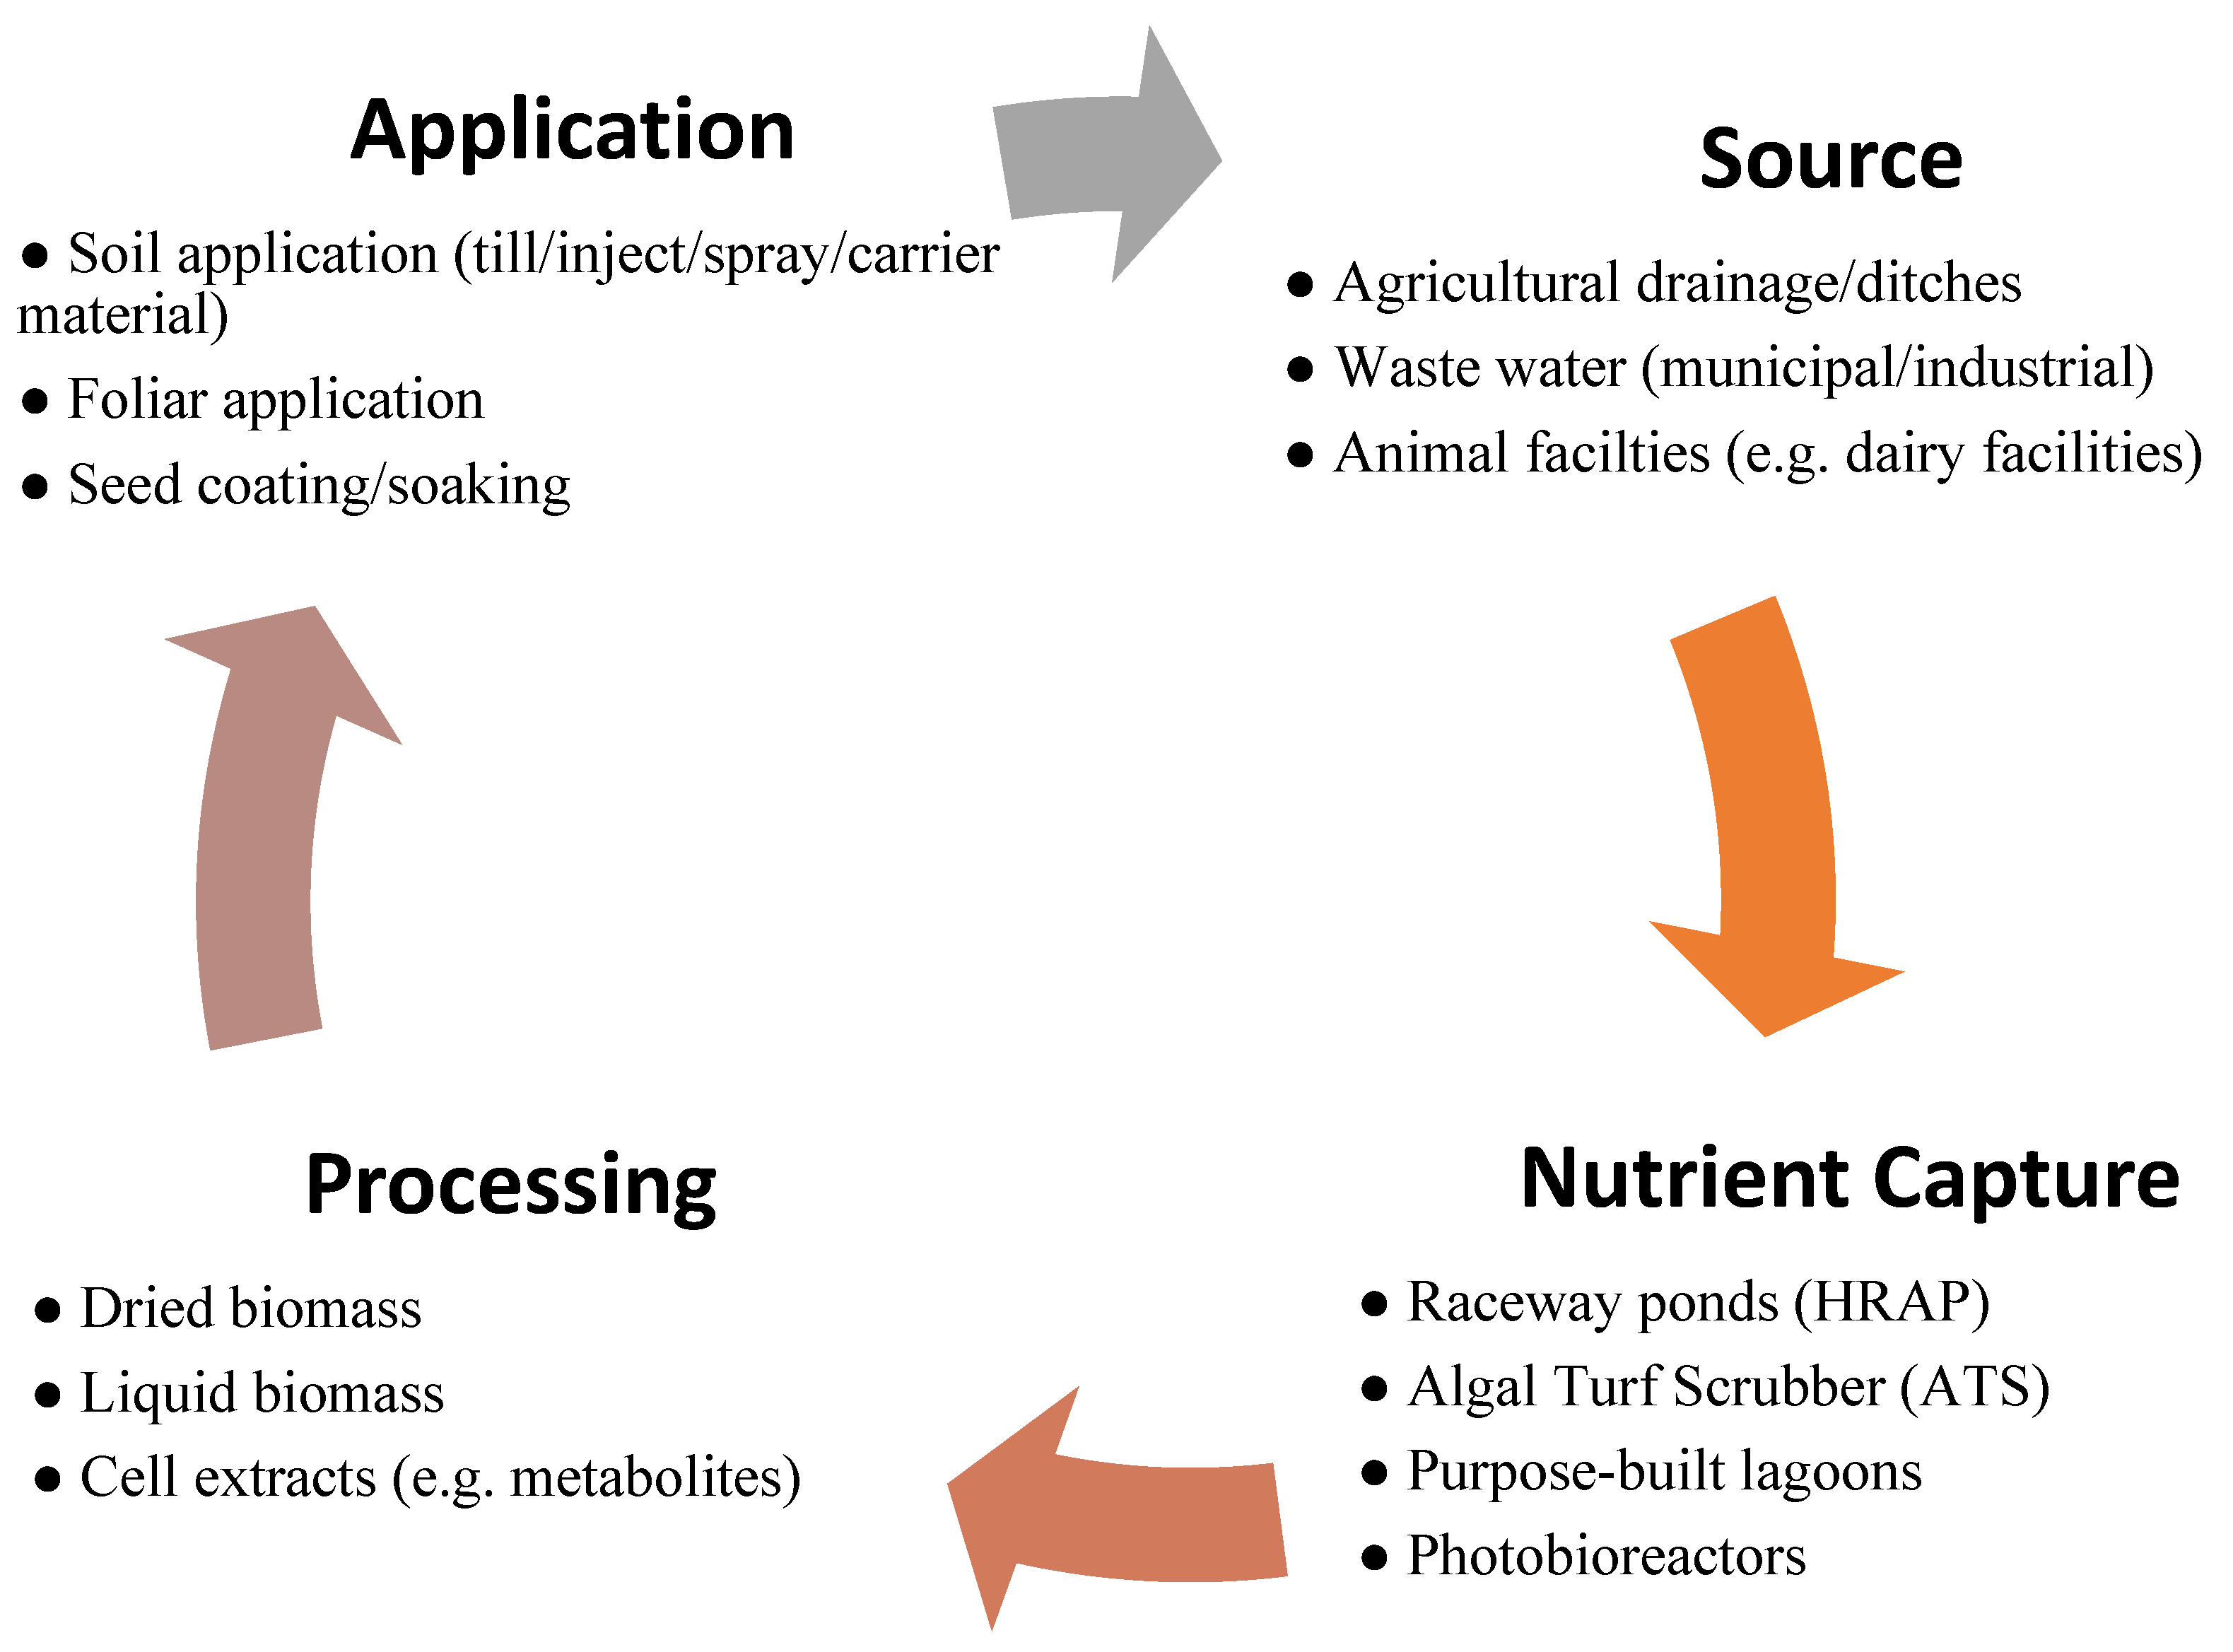
:1. Introduction
2. Materials and Methods
2.1. Maintenance and Cultivation of C. vulgaris
2.2. Cultivation of 15N-Enriched Algal Biomass
2.3. Soil Sampling and Characterisation
2.4. Experimental Set-Up
2.5. N Pools and 15N Isotope Analysis
2.5.1. Wheat Shoots
2.5.2. Bulk Soil
2.5.3. Soil Inorganic Nitrogen
2.6. DNA Extraction and Illumina Sequencing
2.7. Calculations
2.7.1. Total N Concentrations of Pools
2.7.2. 15N Recovery in N Pools
2.8. Data Processing
2.9. Statistical Analyses
3. Results
3.1. N Concentrations in Plant and Soil N Pools
3.1.1. N Concentrations in Plants
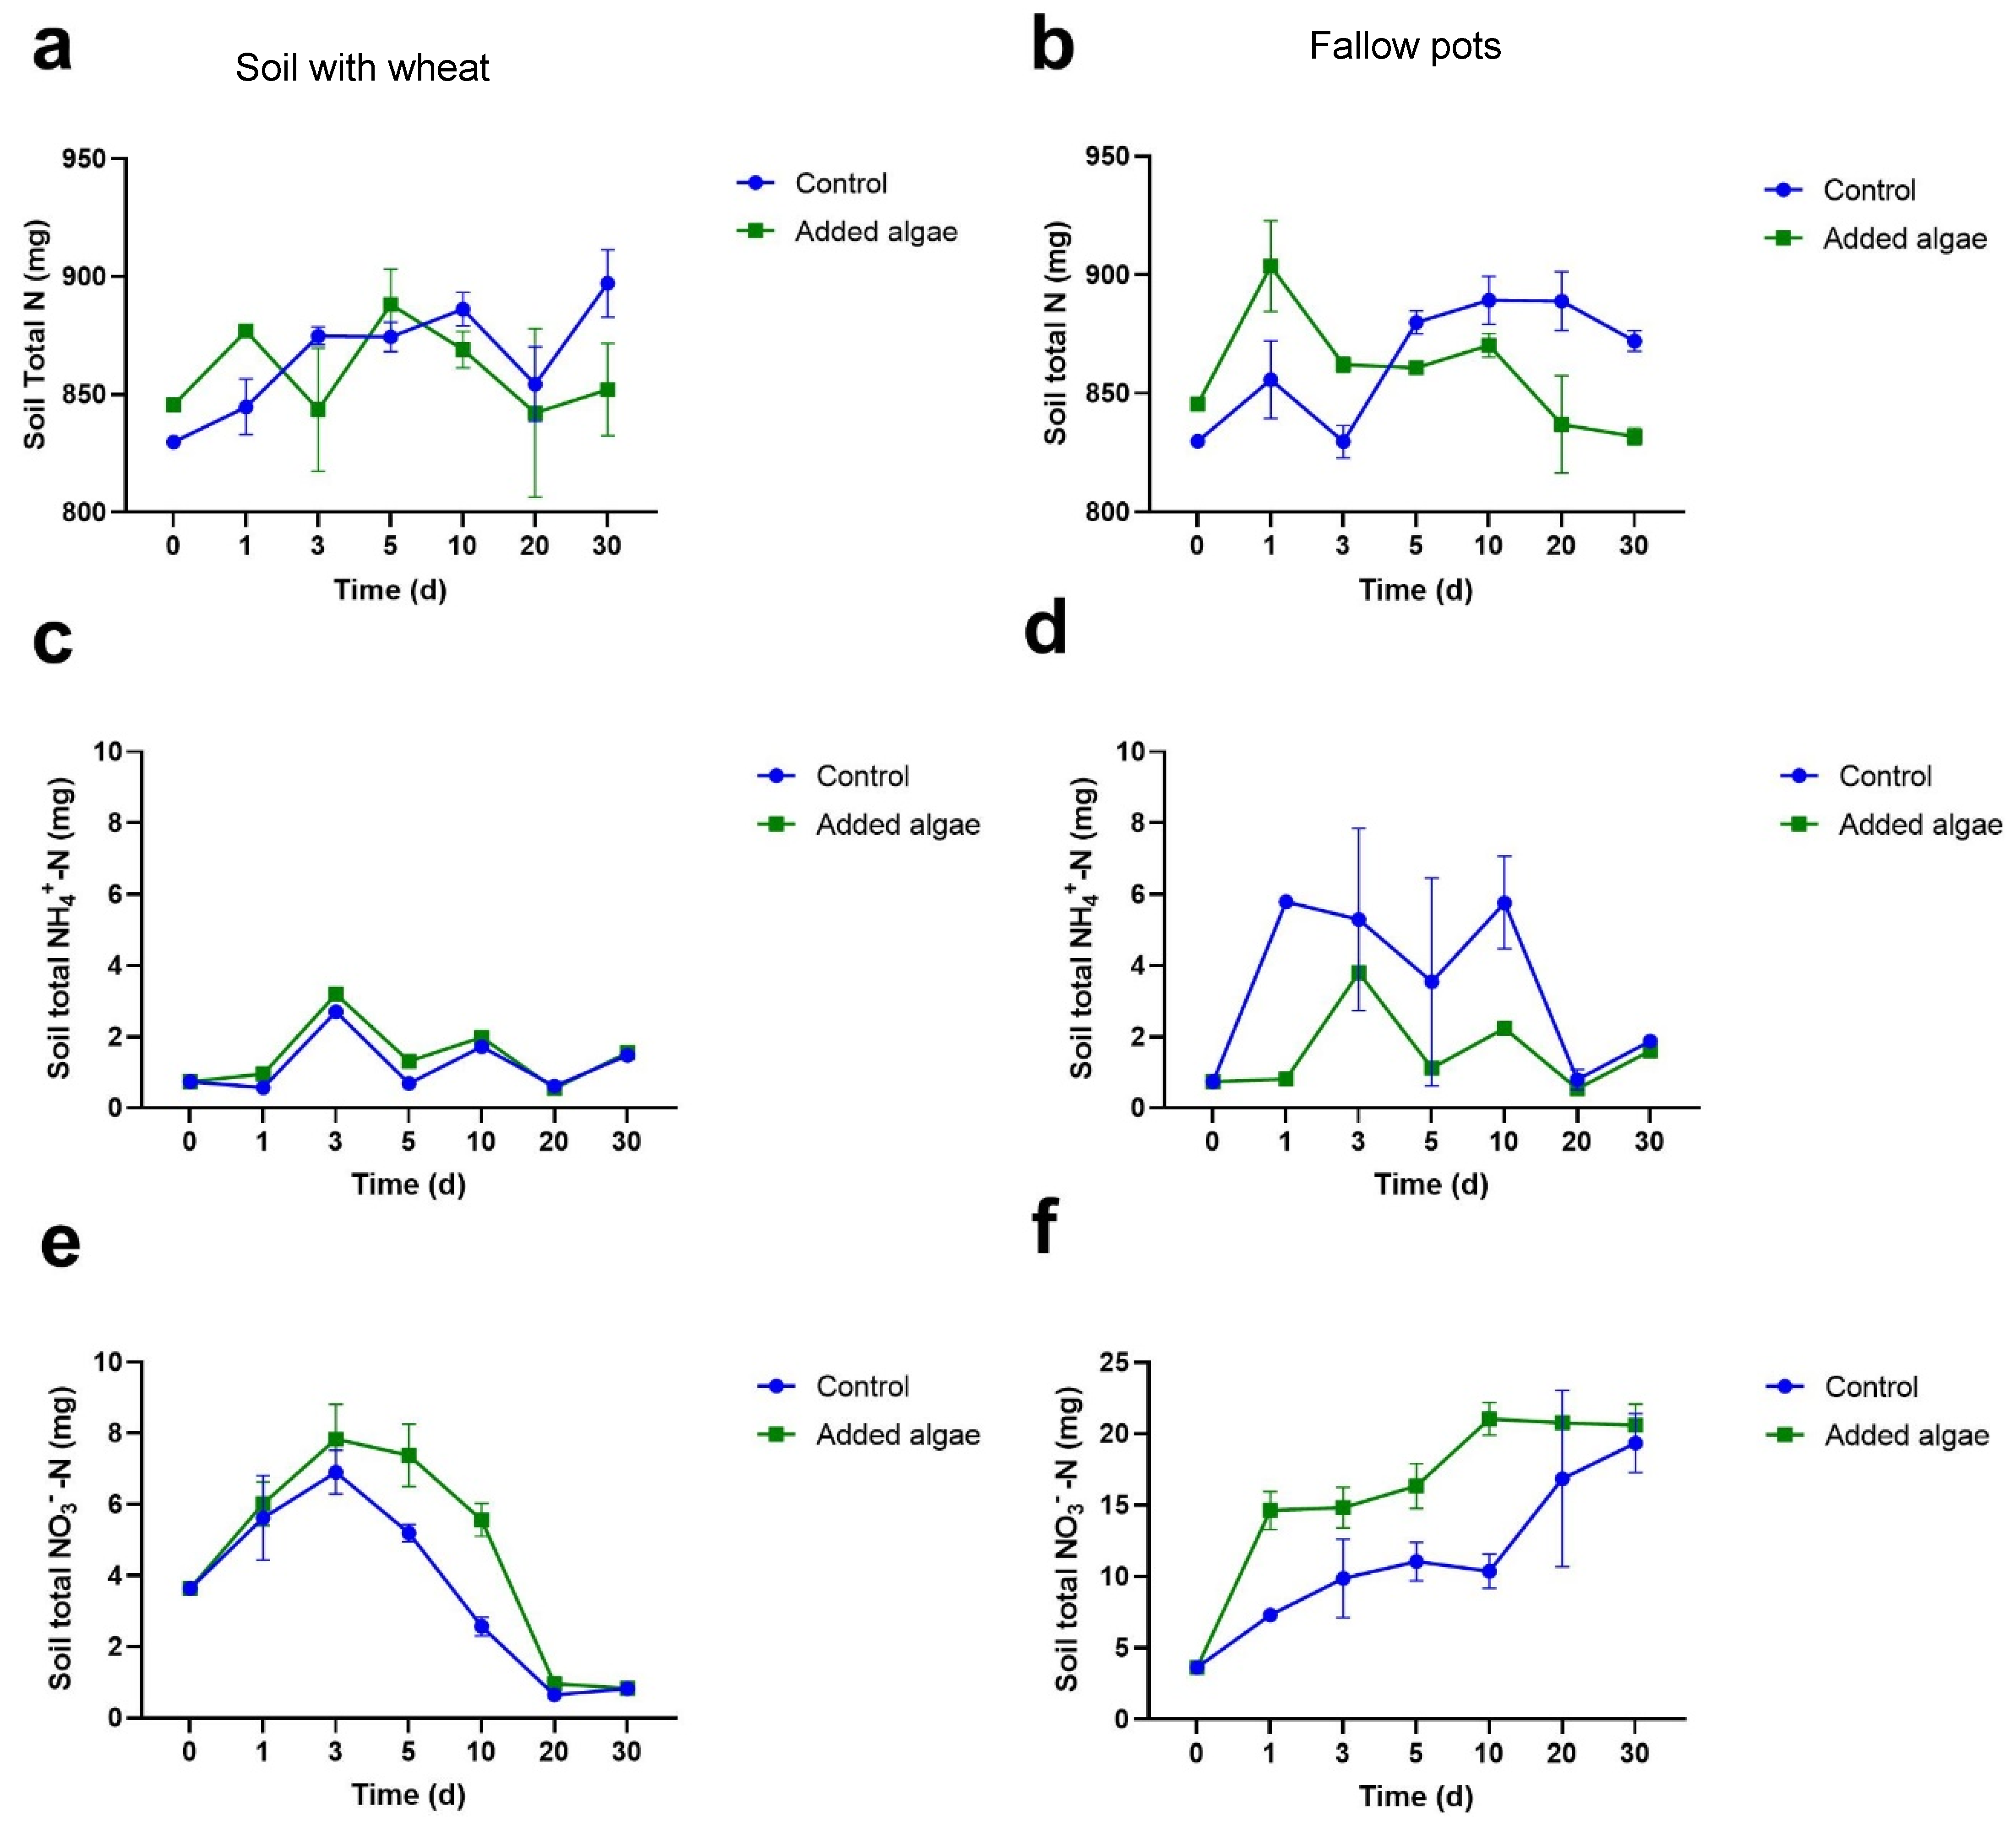
3.1.2. N Concentrations in Bulk Soil
3.1.3. NH4+-N Concentrations in Bulk Soil
3.1.4. NO3−-N Concentrations in Bulk Soil
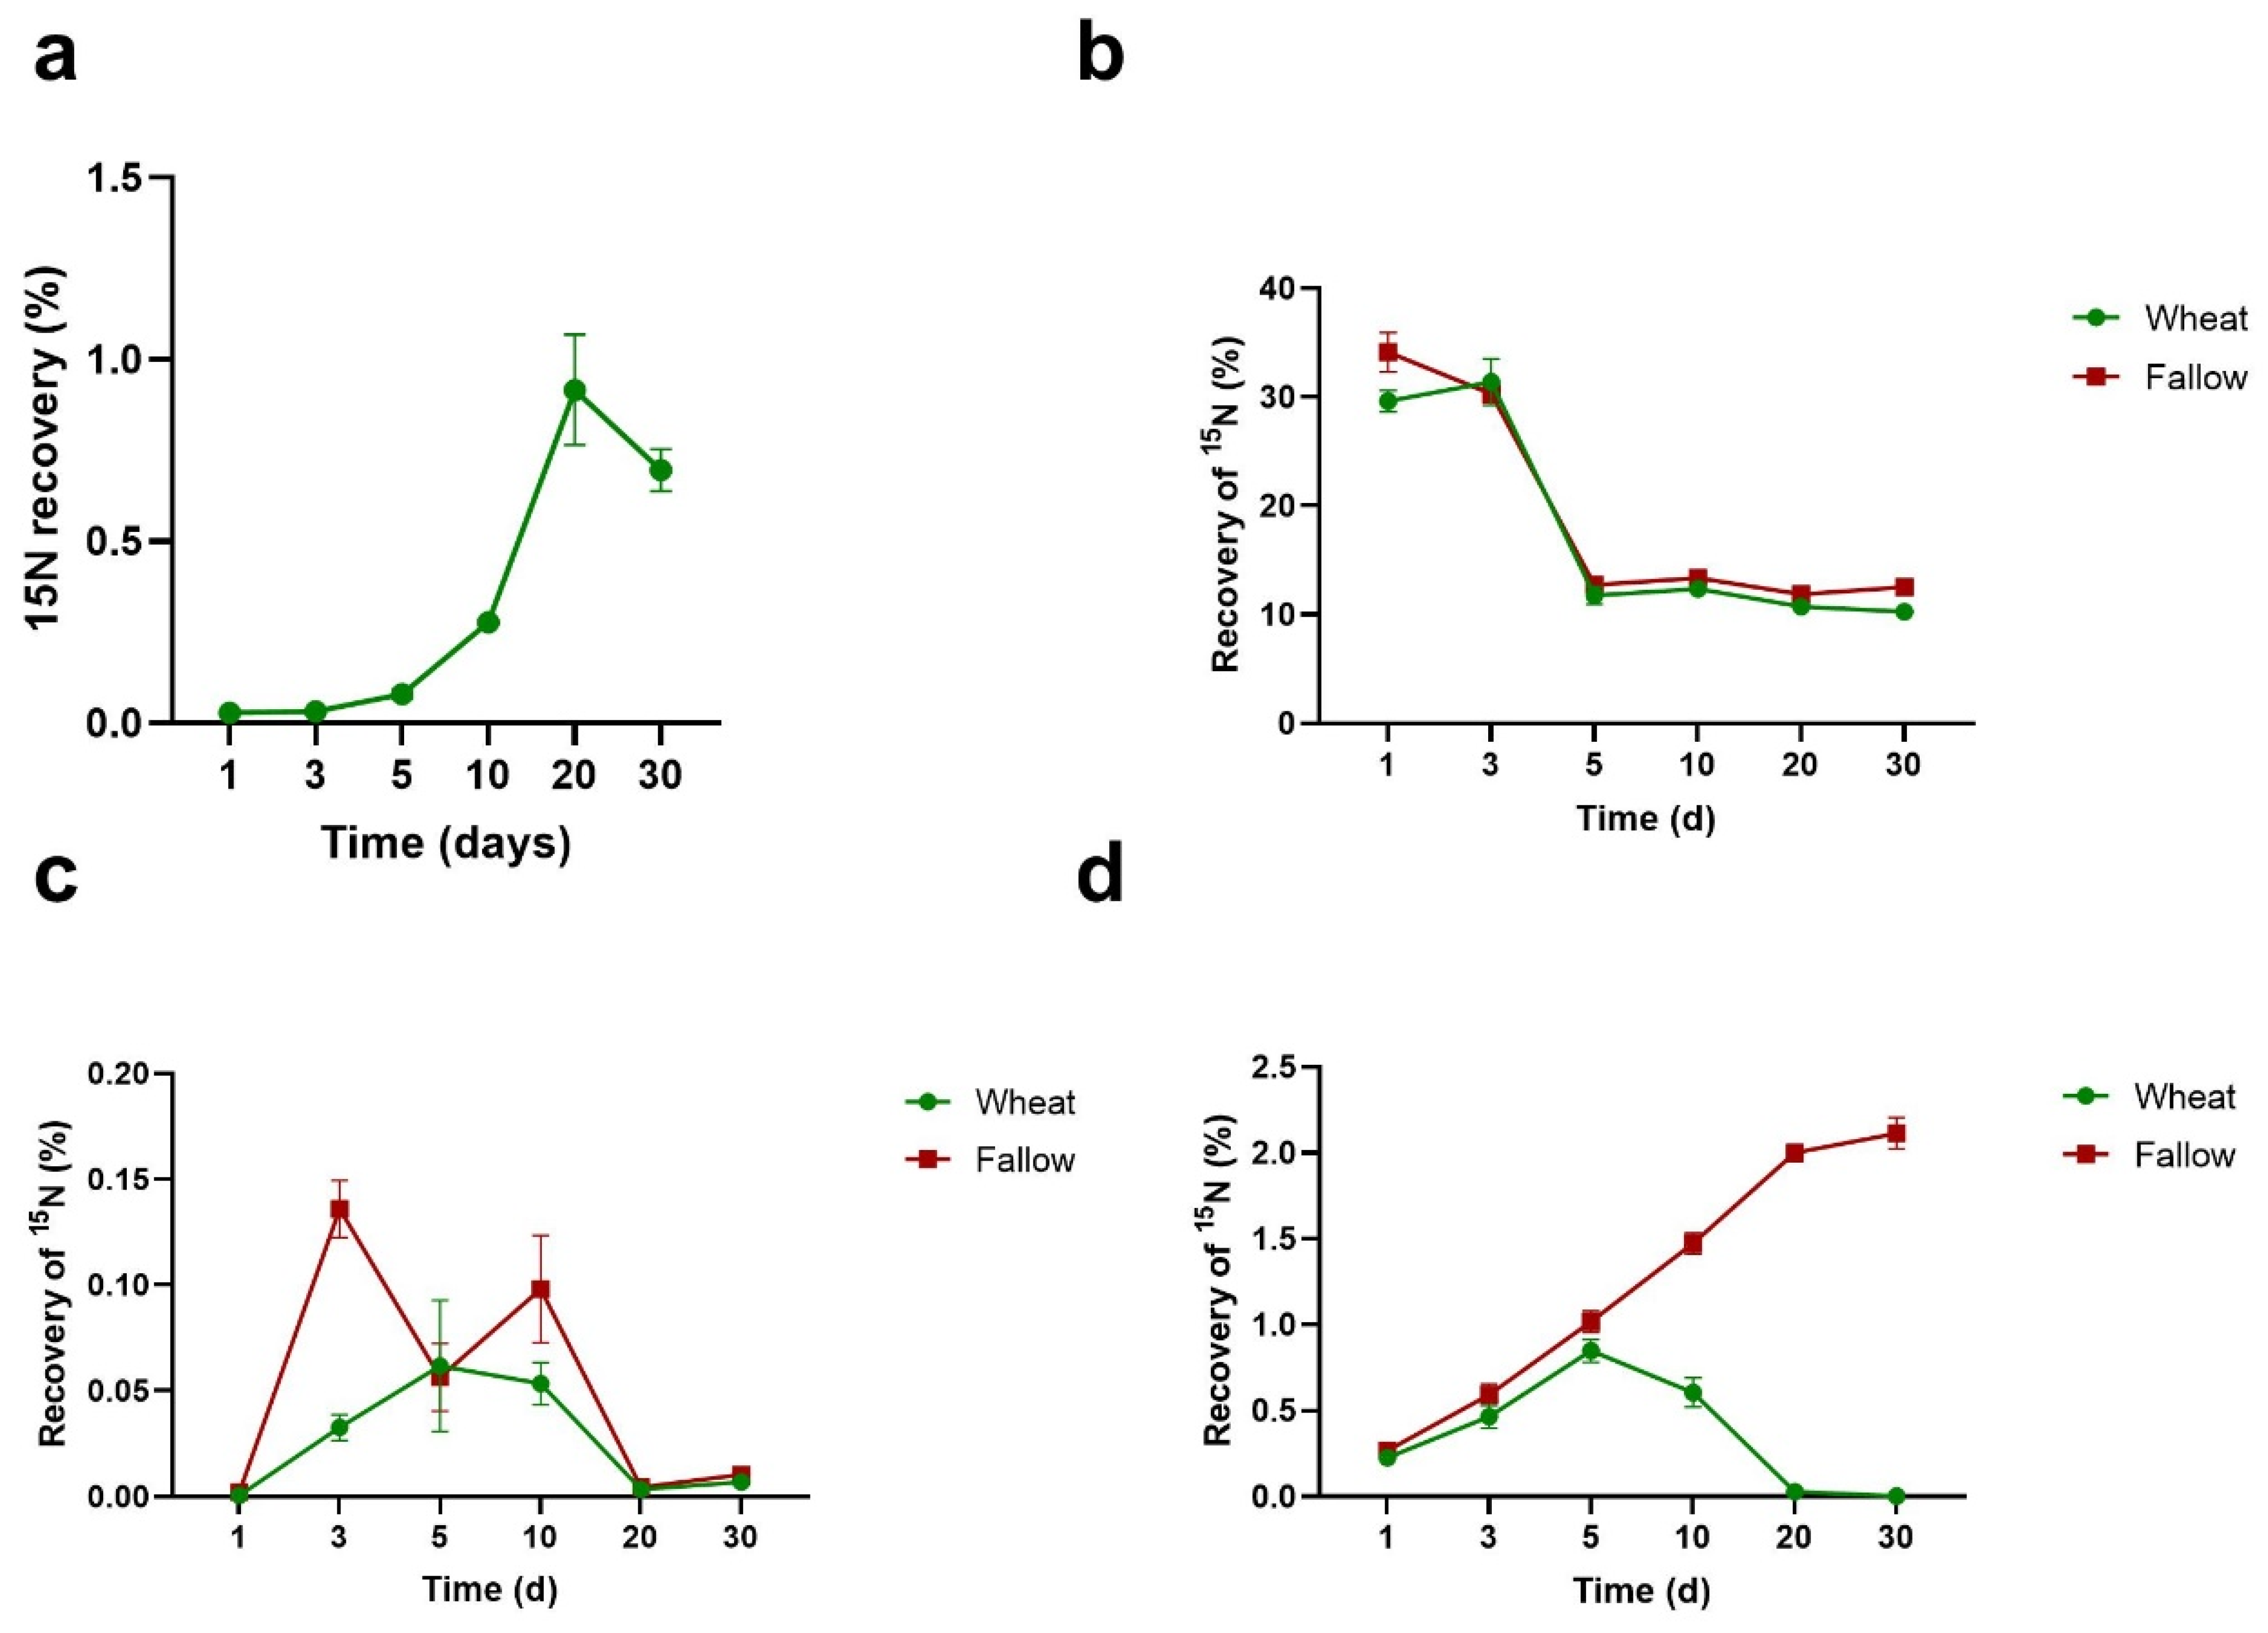
3.2. Percentage Recovery of 15N from Algal Necromass in Measured N Pools
3.3. Efficiency of Utilisation of Algal N
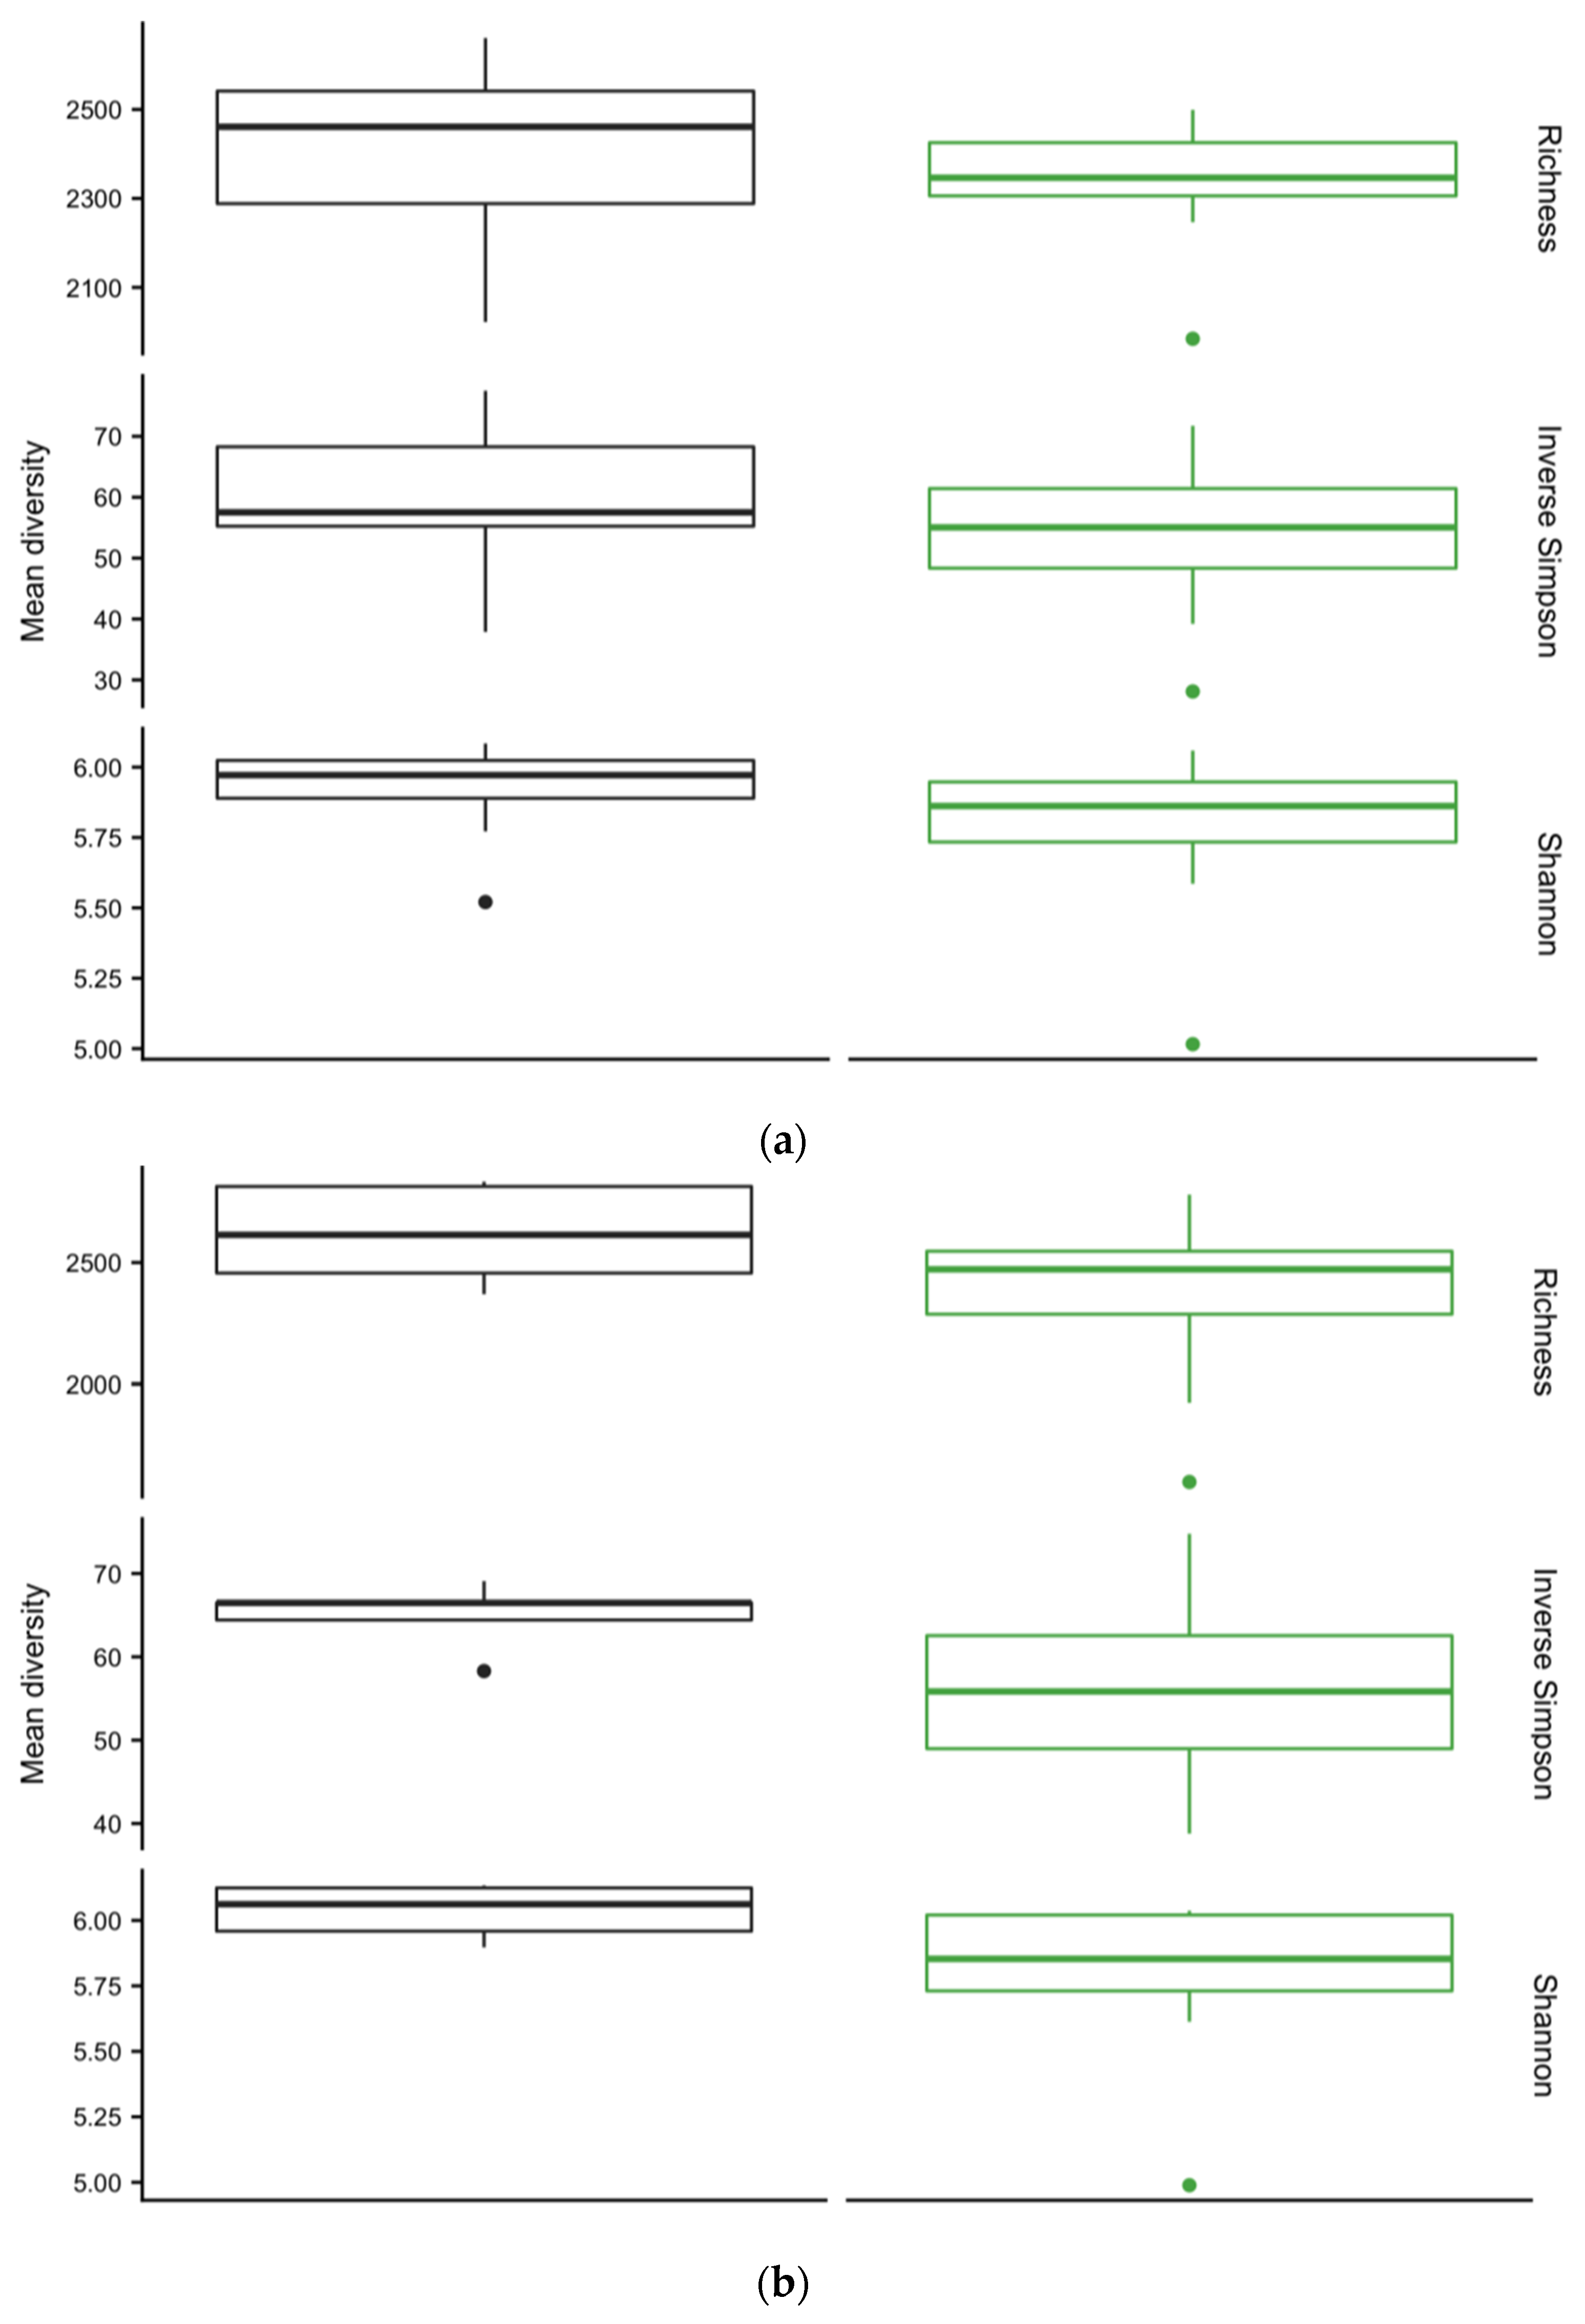
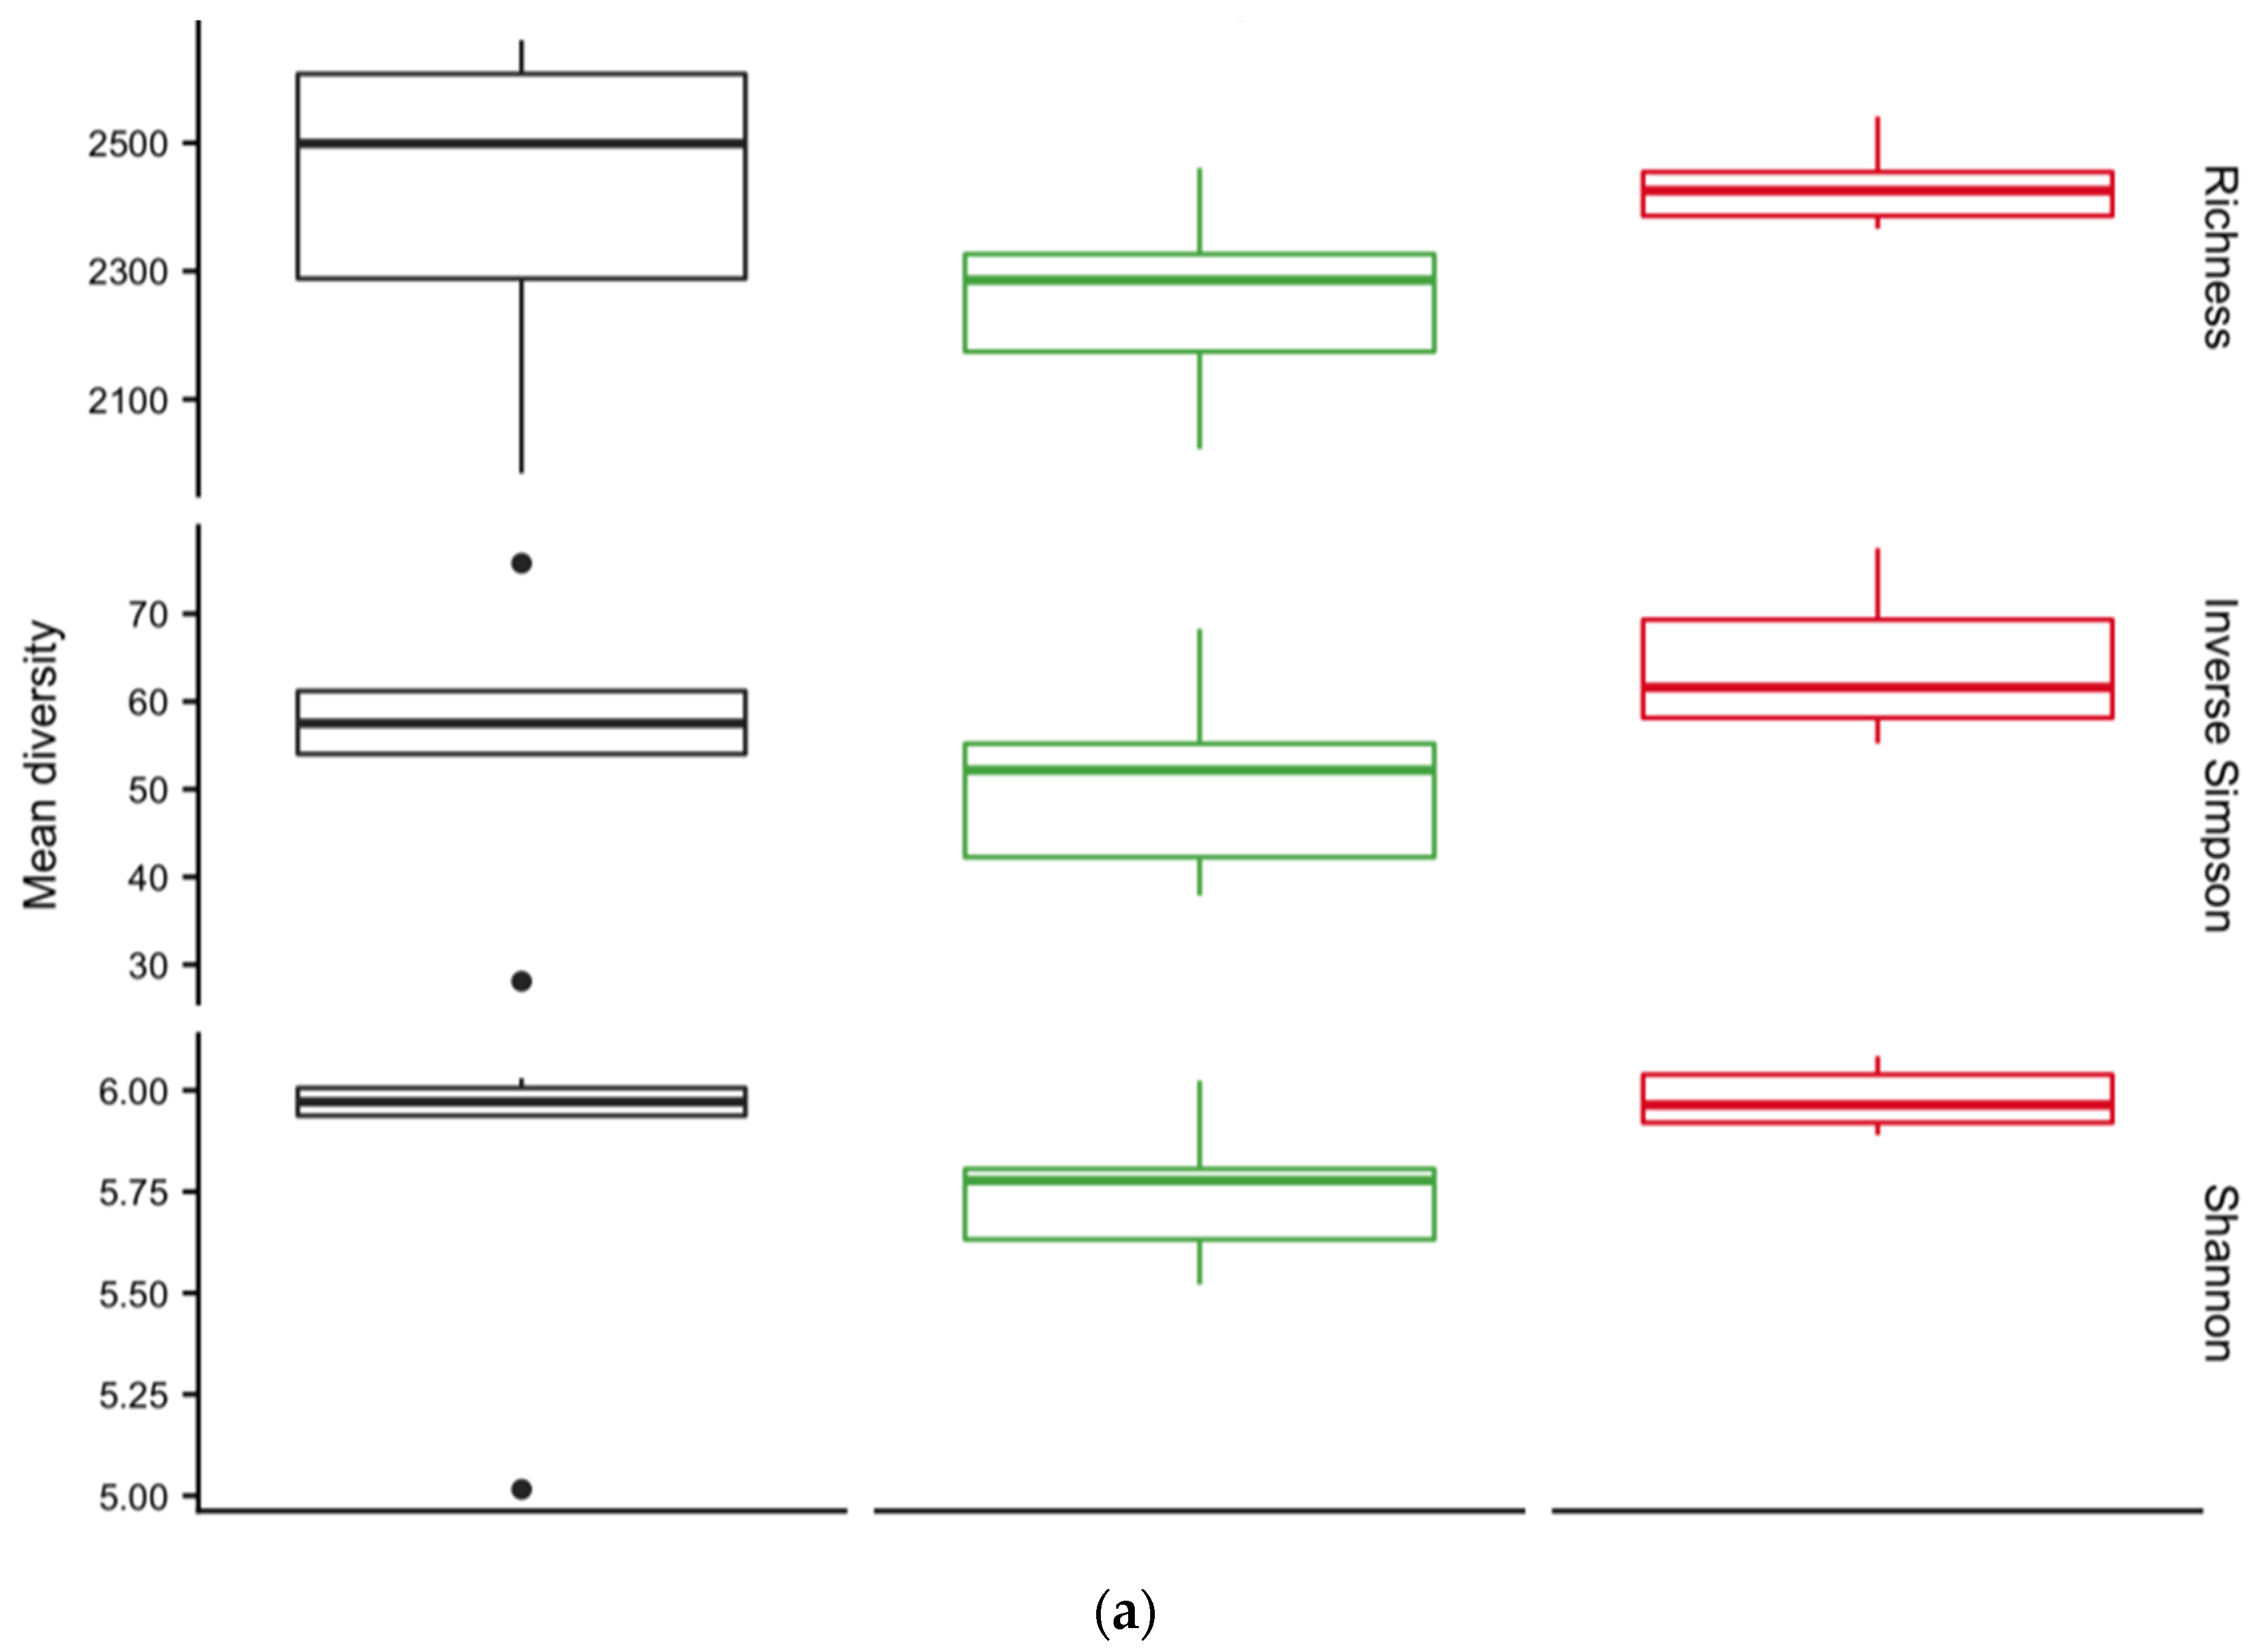
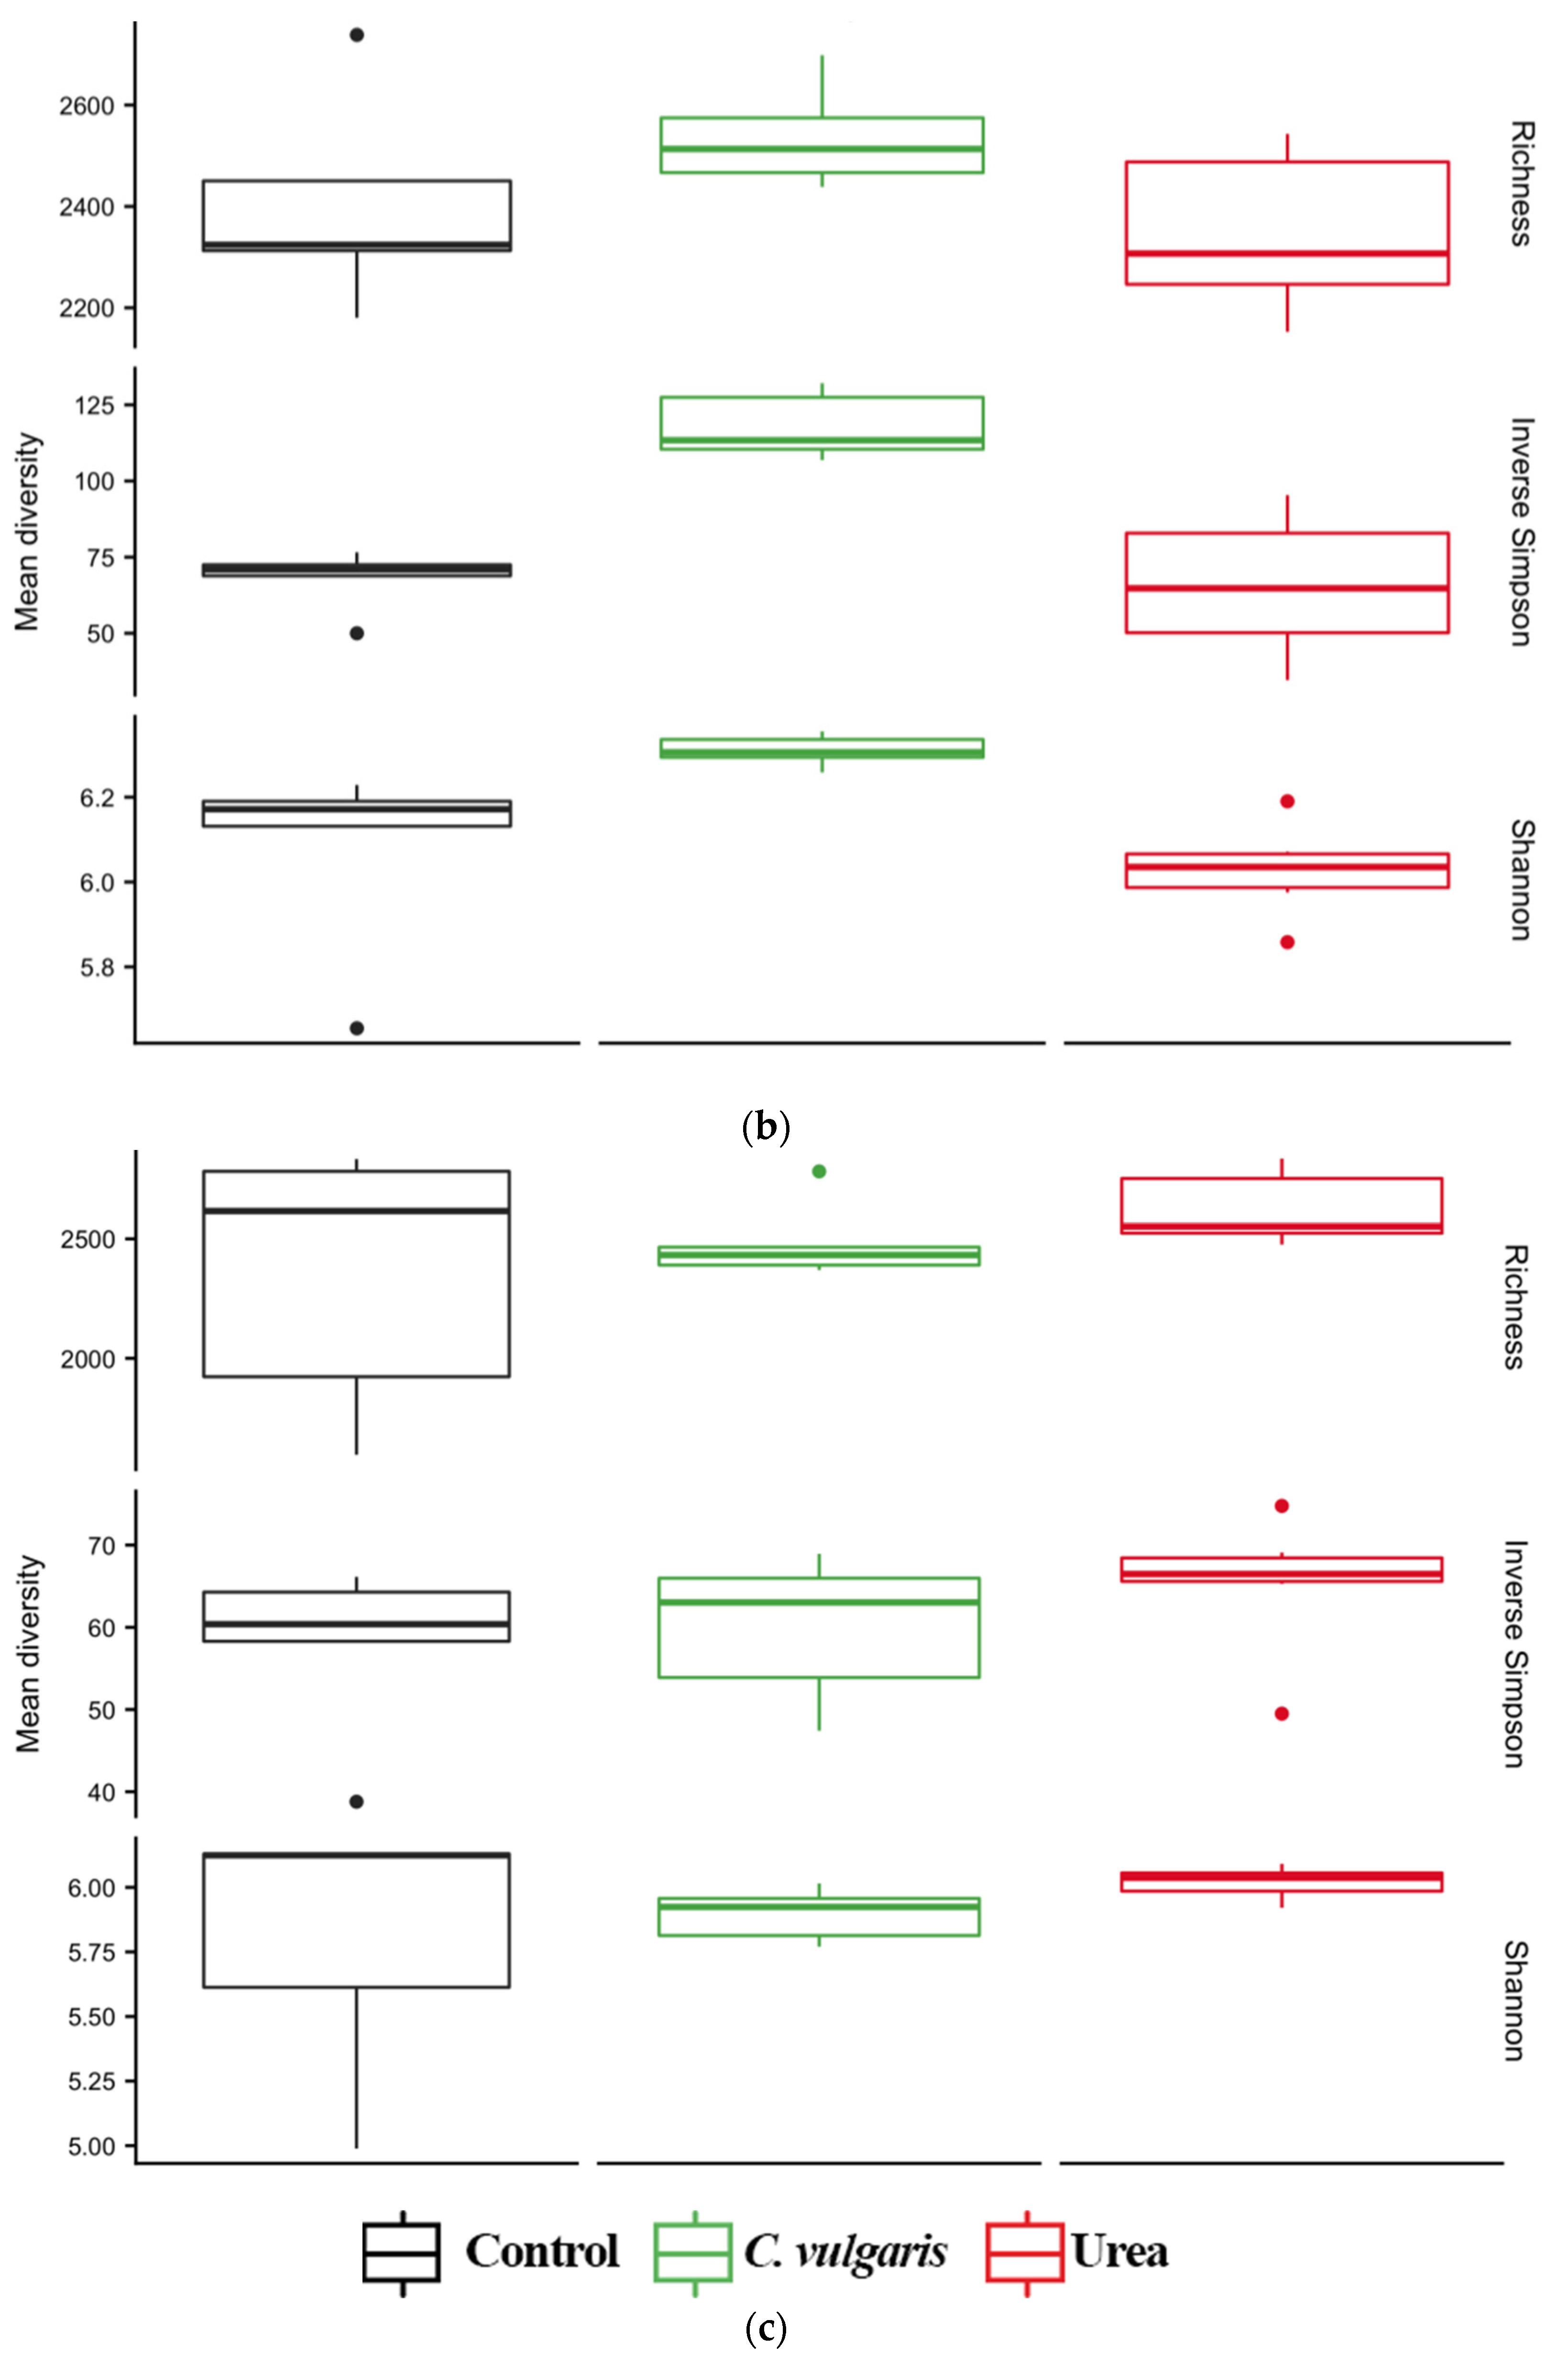
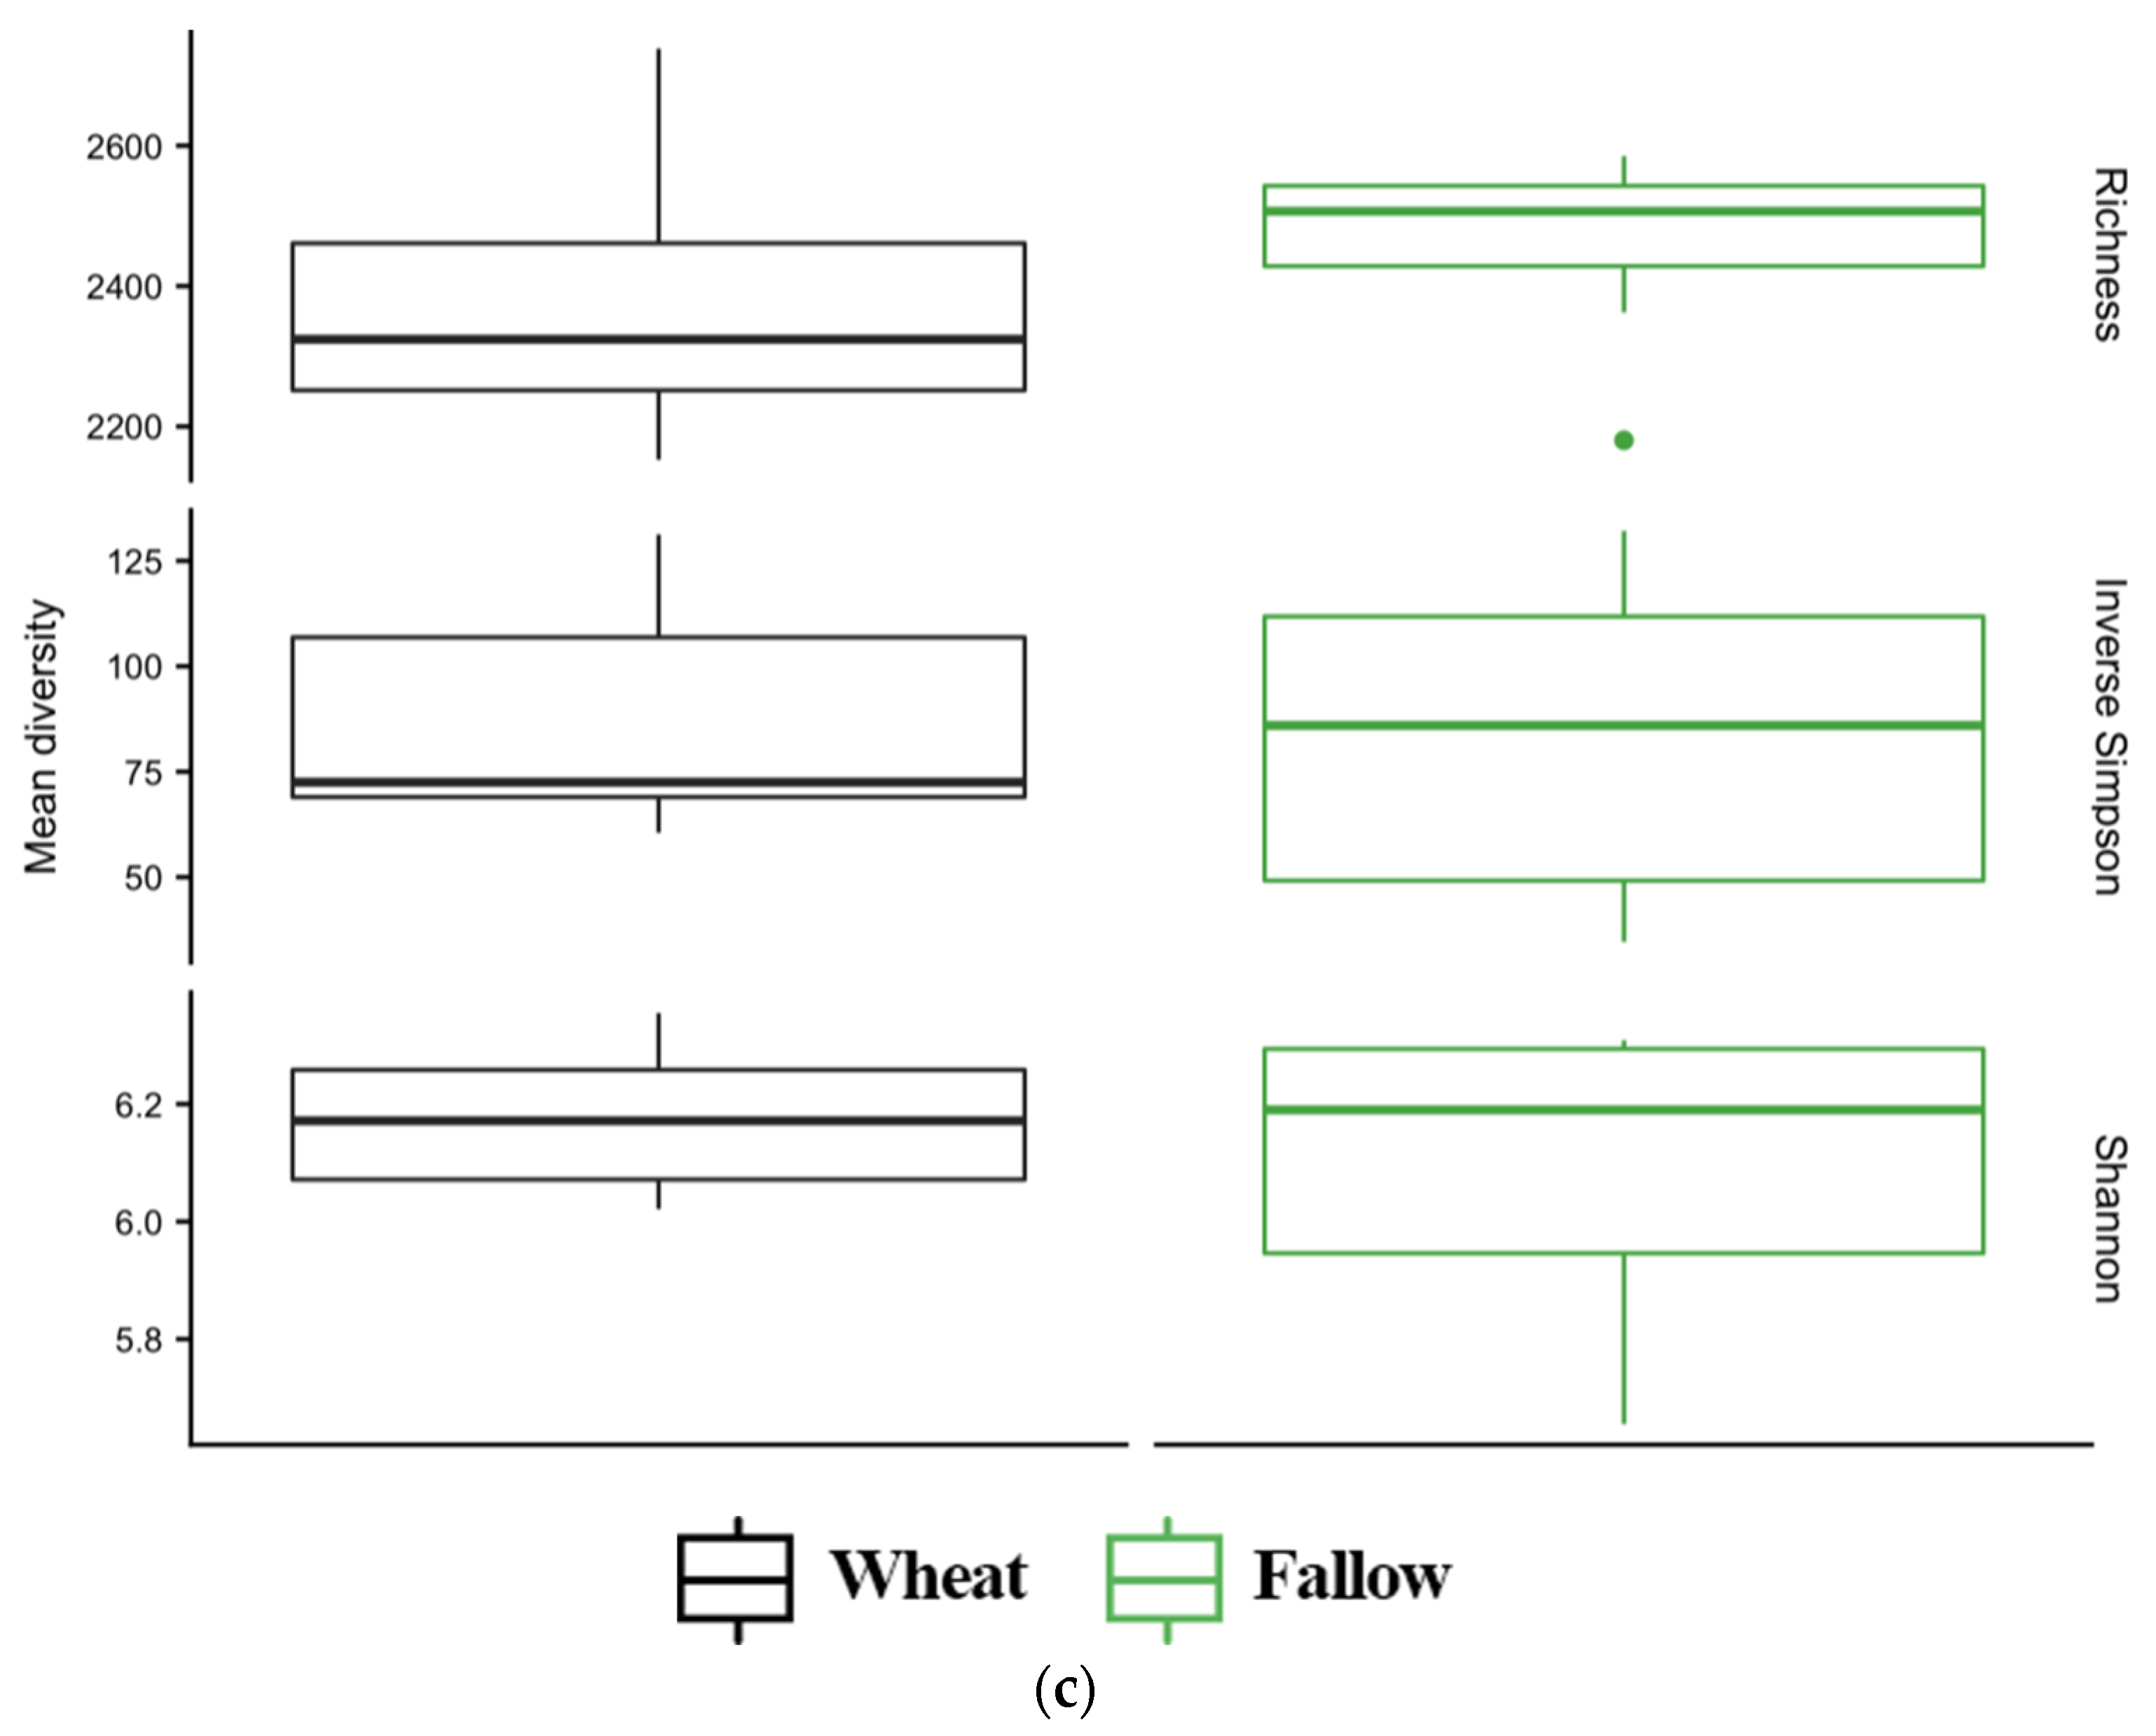
3.4. Diversity of Soil Microbial Communities
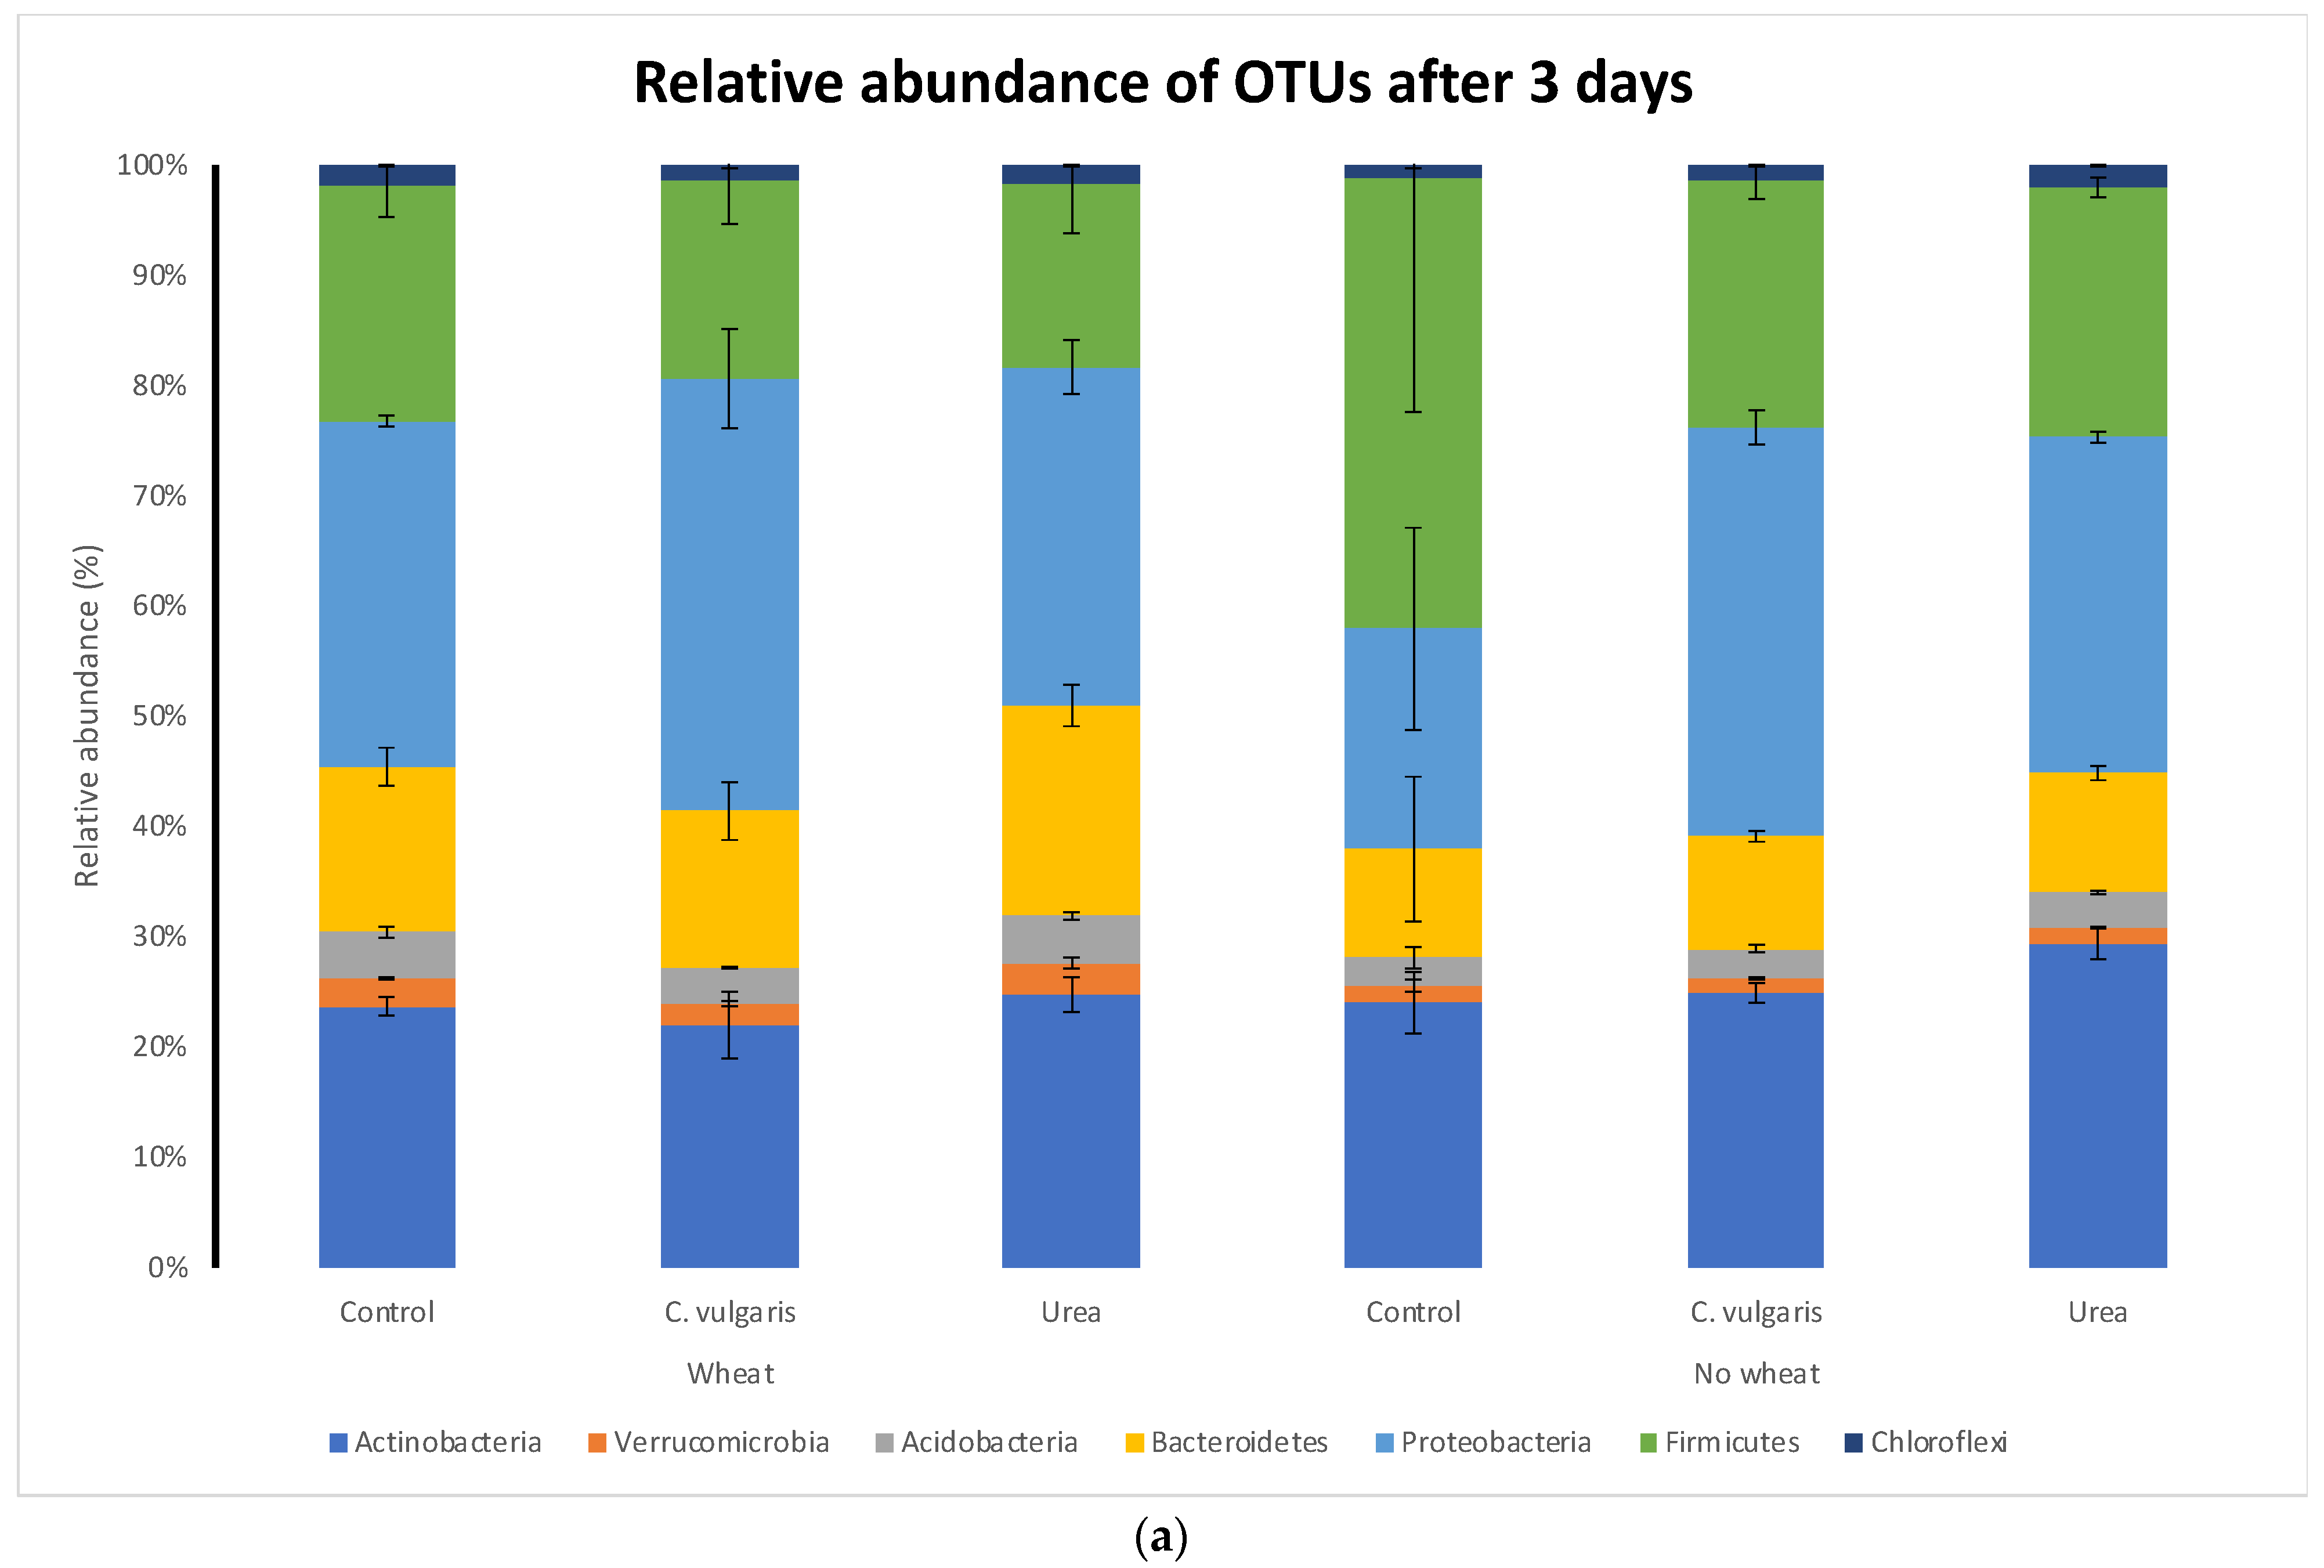
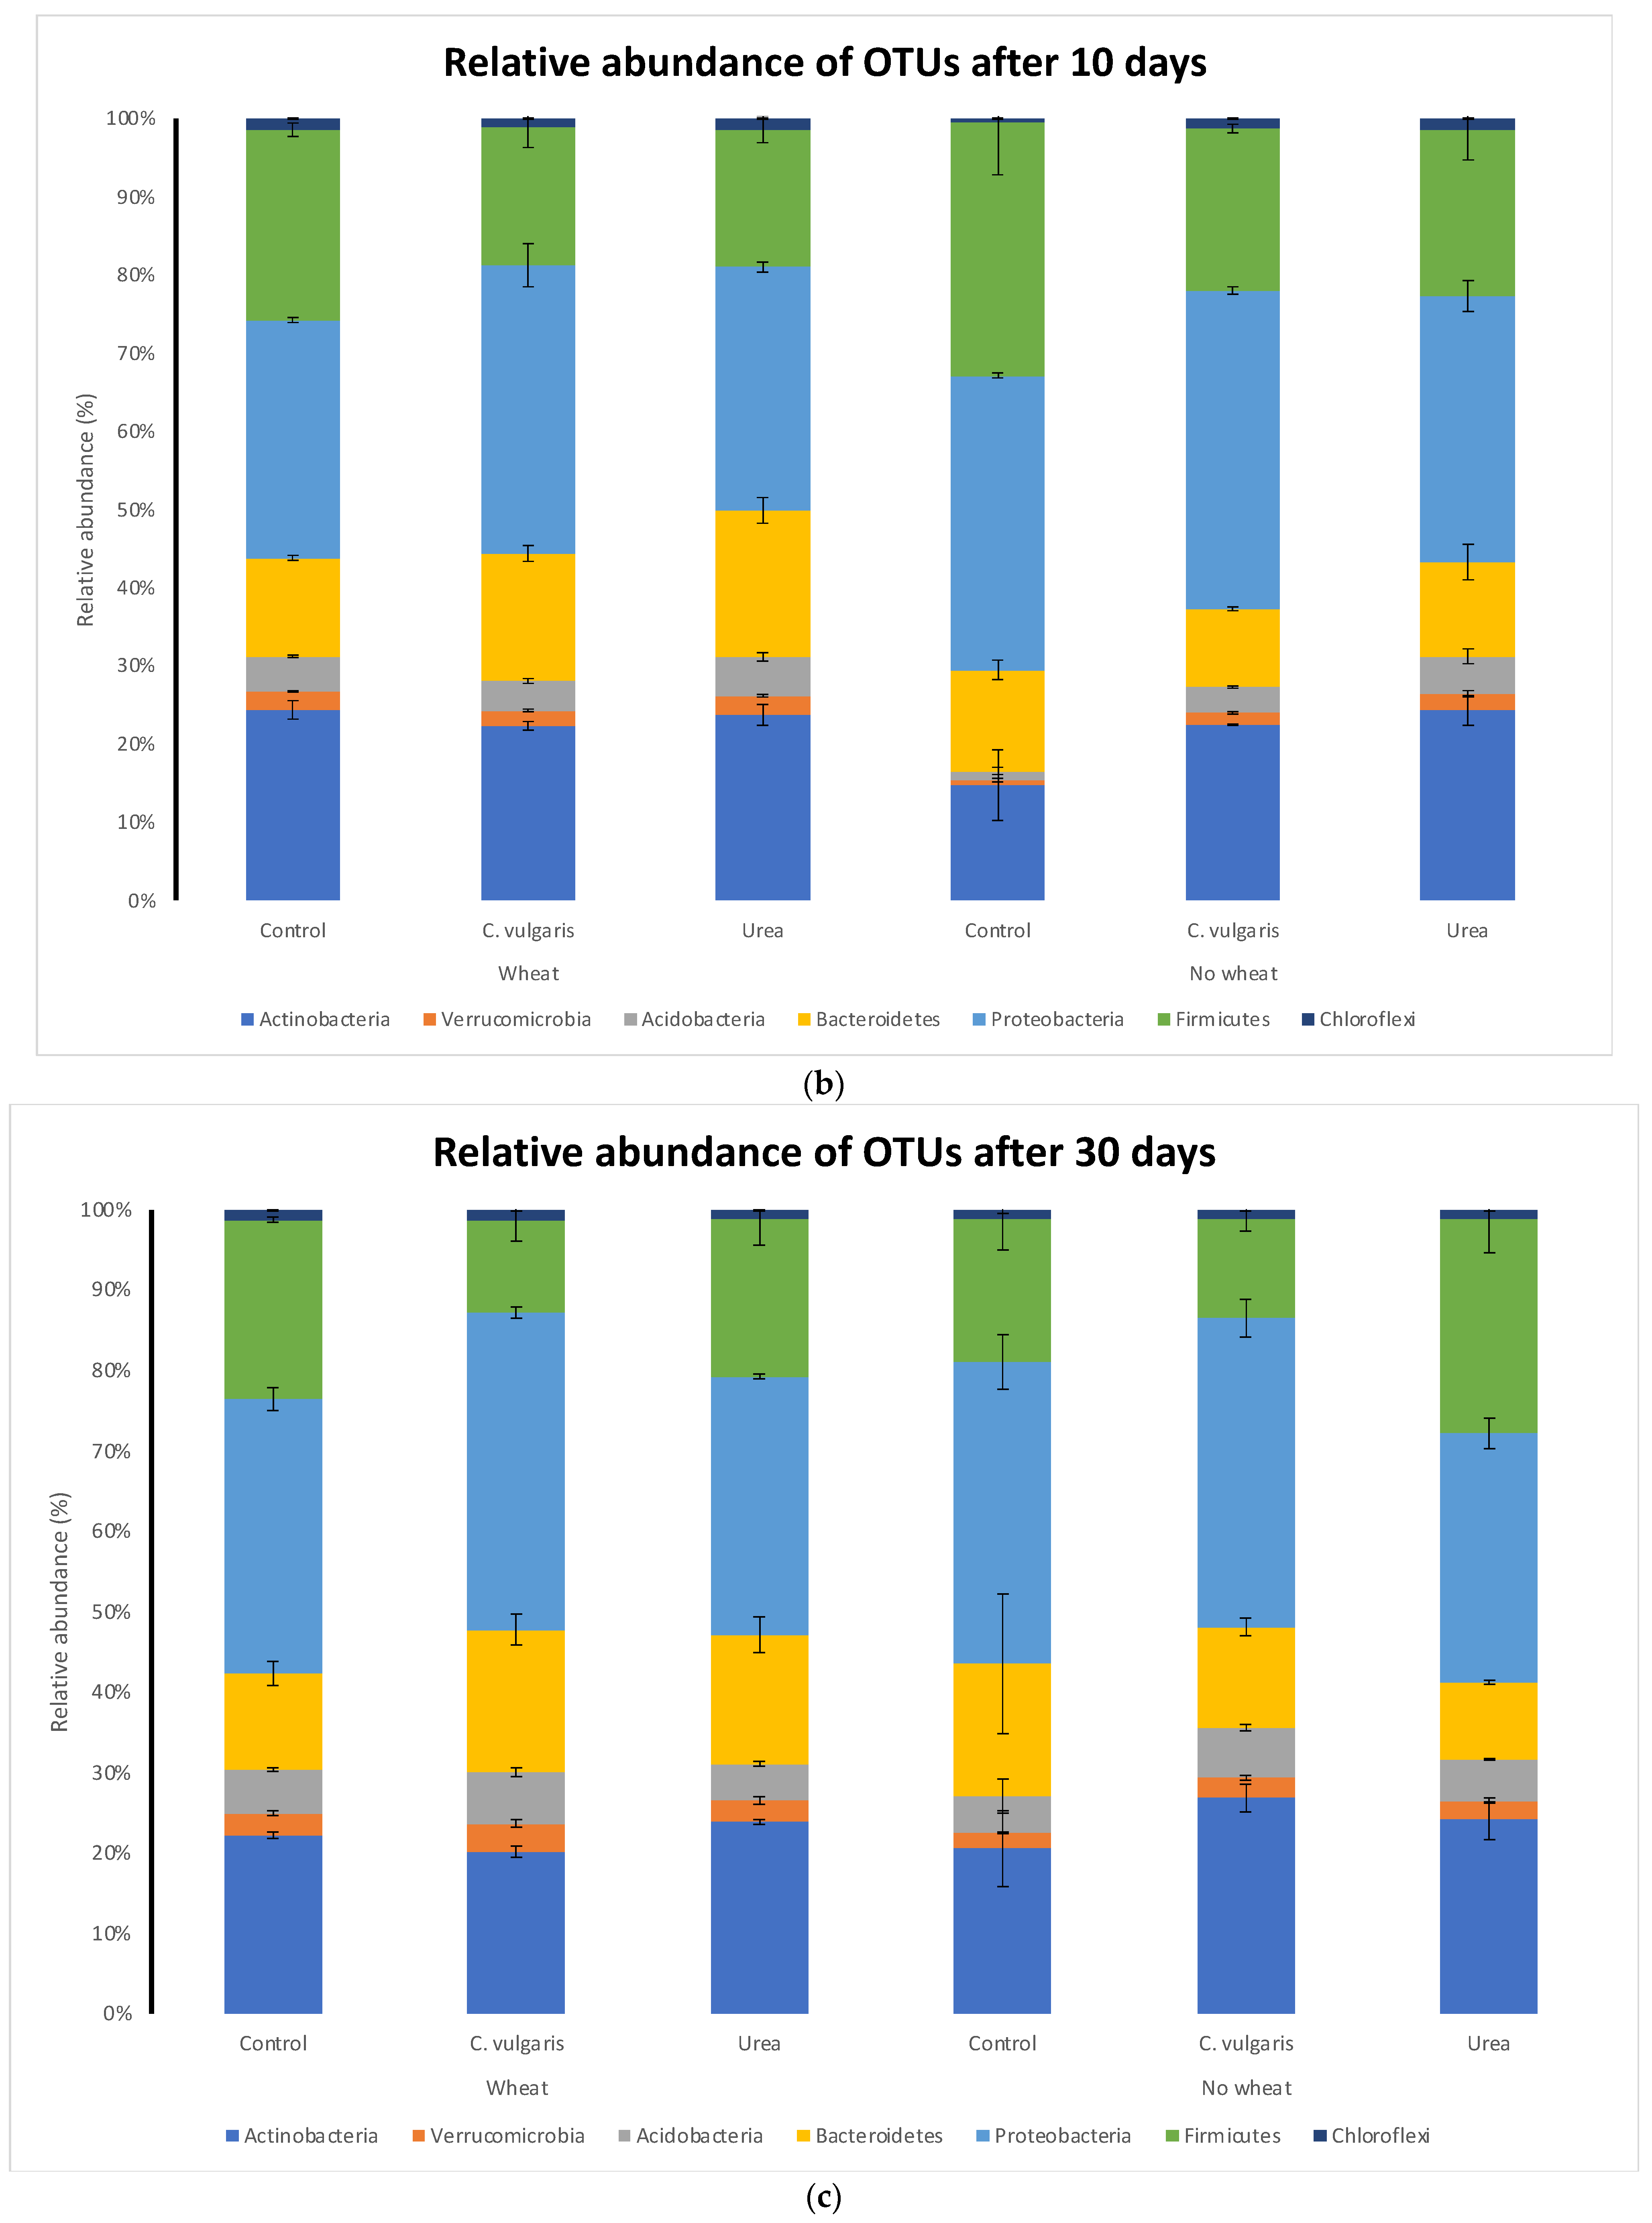
3.5. Taxonomic Composition of Soil Microbial Communities
4. Discussion
5. Conclusions
Author Contributions
Funding
Institutional Review Board Statement
Informed Consent Statement
Data Availability Statement
Acknowledgments
Conflicts of Interest
References
- Heijboer, A.; Ten Berge, H.F.M.; De Ruiter, P.C.; Jorgensen, H.B.; Kowalchuck, G.A.; Bloen, J. Plant biomass, soil microbial community structure and nitrogen cycling under different organic amendment regimes; a 15N tracer-based approach. Appl. Soil Ecol. 2016, 107, 251–260. [Google Scholar] [CrossRef]
- Fixen, P.E.; West, F.B. Nitrogen fertilisers: Meeting contemporary challenges. Ambio J. Hum. Environ. 2002, 31, 169–176. [Google Scholar] [CrossRef] [PubMed]
- Food and Agriculture Organization of the United Nations (FAO). World Fertilizer Trends and Outlook to 2022; FAO: Rome, Italy, 2019. [Google Scholar]
- Muller, C.; Clough, T.J. Advances in understanding nitrogen flows and transformations: Gaps and research pathways. J. Agric. Sci. 2014, 152, s34–s44. [Google Scholar] [CrossRef]
- Lassaletta, L.; Billen, G.; Grizzetti, B.; Anglade, J.; Garnier, J. 50-year trends in nitrogen use efficiency of world cropping systems: The relationship between yield and nitrogen input to cropland. Environ. Res. Lett. 2014, 9, 105011. [Google Scholar] [CrossRef]
- Lopez-Pacheco, I.Y.; Silva-Nunez, A.; Garcia-Perez, J.S.; Carrillo-Nieves, D.; Salinas-Salazar, C.; Castillo-Zacarias, C.; Afewerki, S.; Barcelo, D.; Iqbal, H.N.M.; Parra-Saldivar, R. Phyco-remediation of swine wastewater as a sustainable model based on circular economy. J. Environ. Manag. 2021, 278, 111534. [Google Scholar] [CrossRef]
- Mulbry, W.; Konrad, S.; Pizarro, C.; Kebede-Westhead, E. Treatment of dairy manure effluent using freshwater algae: Algal productivity and recovery of manure nutrients using pilot-scale algal turf scrubbers. Bioresour. Technol. 2008, 99, 8137–8142. [Google Scholar] [CrossRef]
- Kangas, P.; Mulbry, W. Nutrient removal from agricultural drainage water using algal turf scrubbers and solar power. Bioresour. Technol. 2014, 152, 484–489. [Google Scholar] [CrossRef]
- Alobwede, E.; Leake, J.R.; Pandhal, J. Circular economy fertilization: Testing micro and macro algal species as soil improvers and nutrient sources for crop production in greenhouse and field conditions. Geoderma 2019, 334, 113–123. [Google Scholar] [CrossRef]
- Haynes, R.J. Fate and recovery of 15N derived from grass/clover residues when incorporated into a soil and cropped with spring or winter wheat for two succeeding seasons. Biol. Fertil. Soils 1997, 25, 130–135. [Google Scholar] [CrossRef]
- Kramer, A.W.; Doane, T.A.; Horwath, W.R.; Van Kessel, C. Short-term nitrogen-15 recovery vs. long-term total soil N gains in conventional and alternative cropping systems. Soil Biol. Biochem. 2002, 34, 43–50. [Google Scholar] [CrossRef]
- Chalk, P.M.; Craswell, E.T.; Polidoro, J.C.; Chen, D. Fate and efficiency of 15N-labelled slow–and controlled- release fertilizers. Nutr. Cycl. Agroecosyst. 2015, 102, 167–178. [Google Scholar] [CrossRef]
- Mian, M.H.; Stewart, D.P. Fate of nitrogen applied as Azolla and blue-green algae (Cyanobacteria) in waterlogged rice soils—A 15N tracer study. Plant Soil 1985, 83, 363–370. [Google Scholar] [CrossRef]
- Tirol, A.C.; Roger, P.A.; Watanabe, I. Fate of nitrogen from a blue-green alga in a flooded rice soil. Soil Sci. Plant Nutr. 1982, 4, 559–569. [Google Scholar] [CrossRef]
- Thind, H.S.; Rowell, D.L. The fate of algal nitrogen in a flooded soil system. Nutr. Cycl. Agroecosyst. 1999, 55, 89–94. [Google Scholar] [CrossRef]
- Robinson, R.A.; Sutherland, W.J. Post-war changes in arable farming and biodiversity in Great Britain. J. Appl. Ecol. 2002, 39, 157–176. [Google Scholar] [CrossRef] [Green Version]
- Gregory, A.S.; Ritz, K.; McGrath, S.P.; Quinton, J.N.; Goulding, K.W.T.; Jones, R.J.A.; Harris, J.A.; Bol, R.; Wallace, P.; Pilgrim, E.S.; et al. A review of the impacts of degradation threats on soil properties in the UK. Soil Use Manag. 2015, 31, 1–15. [Google Scholar] [CrossRef] [PubMed] [Green Version]
- Guhra, T.; Stolze, K.; Totsche, K.U. Pathways of biogenically excreted organic matter into soil aggregates. Soil Biol. Biochem. 2022, 164, 108483. [Google Scholar] [CrossRef]
- Sarker, J.R.; Singh, B.P.; Dougherty, W.J.; Fang, Y.; Badgery, W.; Hoyle, F.C.; Dalal, R.C.; Cowie, A.L. Impact of agricultural management practices on the nutrient supply potential of soil organic matter under long-term farming systems. Soil Tillage Res. 2018, 175, 71–81. [Google Scholar] [CrossRef]
- Leloup, J.; Baude, M.; Nunan, N.; Meriguet, J.; Dajoz, I.; Le Roux, X.; Raynaud, X. Unravelling the effects of plant species diversity aboveground litter input on soil bacterial communities. Geoderma 2018, 317, 1–7. [Google Scholar] [CrossRef]
- Wang, M.; Chen, L.; Li, Y.; Chen, L.; Liu, X.; Wang, X.; Xan, P.; Qin, S. Responses of soil microbial communities to a short-term application of seaweed fertiliser by deep amplicon sequencing. Appl. Soil Ecol. 2018, 125, 288–296. [Google Scholar] [CrossRef]
- Haslam, S.F.I.; Hopkins, D.W. Physical and biological effects of kelp (seaweed) added to soil. Appl. Soil Ecol. 1996, 3, 257–261. [Google Scholar] [CrossRef]
- Haroun, S.A.; Hussein, M.H. The promotive effect of algal biofertilizers on growth, protein pattern and some metabolic activities of Lupinus termis plants grown in siliceous soil. Asian J. Plant Sci. 2003, 2, 944–951. [Google Scholar] [CrossRef] [Green Version]
- Alam, M.Z.; Braun, G.; Norrie, J.; Hodges, D.M. Ascophyllum extract application can promote plant growth and root yield in carrot associated with increased root-zone soil microbial activity. Can. J. Plant Sci. 2014, 94, 337–348. [Google Scholar] [CrossRef] [Green Version]
- Grzesik, M.; Romanowska-Duda, Z.; Kalaji, H.M. Effectiveness of cyanobacteria and green algae in enhancing the photosynthetic performance and growth of willow (Salix viminalis L.) plants under limited synthetic fertilizers application. Photosynthetica 2017, 55, 510–521. [Google Scholar] [CrossRef]
- Kumar, A.; Bera, S. Revisiting nitrogen utilization in algae: A review on the process of regulation and assimilation. Bioresour. Technol. Rep. 2020, 12, 100584. [Google Scholar] [CrossRef]
- Barraclough, D. The use of mean pool abundances to interpret 15N tracer experiments. Plant Soil 1991, 131, 89–96. [Google Scholar] [CrossRef]
- Turner, T.R.; Ramakrishnan, K.; Walshaw, J.; Heavens, D.; Alston, M.; Swarbreck, D.; Osbourn, A.; Grant, A.; Poole, P.S. Comparative metatranscriptomics reveals kingdom level changes in the rhizosphere microbiome of plants. ISME J. 2013, 7, 2248–2258. [Google Scholar] [CrossRef] [Green Version]
- Bold, H.C. The morphology of Chlamydomonas Chlamydogama, sp. Nov. Bull. Torrey Bot. Club 1949, 76, 101–108. [Google Scholar] [CrossRef]
- Anderson, R. Algal Culturing Techniques; Elsevier: London, UK, 2005; p. 437. [Google Scholar]
- Cranfield University. The Soils Guide. Available online: www.landis.org.uk (accessed on 24 September 2017).
- Mulvaney, R.L. Nitrogen-Inorganic forms. In Methods of Soil Analysis: Part 3. Chemical Methods; Sparksed, D.L., Page, A.L., Helmke, P.A., Loeppert, R.H., Eds.; Book Series No.5 1123-84; SSSA Soil Science Society of America and Agronomy Society of America: Madison, WI, USA, 1996. [Google Scholar]
- BS EN ISO 13395:1996; Water Quality. Determination of Nitrite Nitrogen and Nitrate Nitrogen and the Sum of Both by Flow Analysis (CFA and FIA) and Spectrometric Detection, 1996. (Under review). Available online: https://www.iso.org/committee/52846.html (accessed on 10 June 2022).
- BS EN ISO 11732:2005; Water Quality. Determination of Ammonium Nitrogen. Method by Flow Analysis (CFA and FIA) and Spectrometric Detection, (Confirm). 2005. Available online: https://www.iso.org/standard/38924.html (accessed on 10 June 2022).
- Brooks, P.D.; Stark, J.M.; Mcinteer, B.B.; Preston, T. Diffusion method to prepare soil extracts for automated nitrogen-15 analysis. Soil Sci. Soc. Am. J. 1989, 53, 1707–1711. [Google Scholar] [CrossRef]
- Stark, J.M.; Hart, S.C. Diffusion technique for preparing salt solutions, Kjeldahl digests, and persulfate digests for nitrogen-15 analysis. Soil Sci. Soc. Am. J. 1996, 60, 1846–1855. [Google Scholar] [CrossRef]
- Sainju, U.M. Determination of nitrogen balance in agroecosystems. MethodsX 2017, 4, 199–208. [Google Scholar] [CrossRef] [PubMed]
- Bagherzadeh, A.; Brumme, R.; Beese, F. The fate of 15N-labeled nitrogen inputs to pot cultured beech seedlings. J. For. Res. 2009, 20, 314–322. [Google Scholar] [CrossRef] [Green Version]
- Braun, J.; Mooshammer, M.; Wanek, W.; Prommer, J.; Walker, T.W.N.; Rutting, T.; Richter, A. Full 15N tracer accounting to revisit major assumptions of 15N isotope pool dilution approaches for gross nitrogen mineralization. Soil Biol. Biochem. 2018, 117, 16–26. [Google Scholar] [CrossRef] [PubMed]
- Quan, Z.; Huang, B.; Lu, C.; Shi, Y.; Chen, X.; Zhang, H.; Fang, Y. The fate of fertilizer nitrogen in a high nitrate accumulated agricultural soil. Sci. Rep. 2016, 6, 21539. [Google Scholar] [CrossRef] [PubMed]
- Caporaso, J.G.; Bittinger, K.; Bushman, F.D.; Desantis, T.Z.; Andersen, G.L.; Knight, R. PyNAST: A flexible tool for aligning sequences to a template alignment. Bioinformatics 2010, 26, 266–267. [Google Scholar] [CrossRef] [PubMed] [Green Version]
- Wang, Q.; Garrity, G.M.; Tiedje, J.M.; Cole, J.R. Naïve bayesian classifier for rapid assignment of rRNA sequences into the new bacterial taxonomy. Appl. Environ. Microbiol. 2007, 73, 5261–5267. [Google Scholar] [CrossRef] [PubMed] [Green Version]
- Mcmurdie, P.J.; Holmes, S. Phyloseq: An R package for reproducible interactive analysis and graphics of microbiome census data. PLoS ONE 2013, 8, e61217. [Google Scholar] [CrossRef] [Green Version]
- Simpson, E.H. Measurement of diversity. Nature 1949, 163, 163–688. [Google Scholar] [CrossRef]
- Shannon, C.E. A mathematical theory of communication. Bell Syst. Tech. J. 1948, 27, 379–423. [Google Scholar] [CrossRef] [Green Version]
- Rutting, T.; Huygens, D.; Staelens, J.; Muller, C.; Pascal, B. Advances in 15N–tracing experiments: New labeling and data analysis approaches. Biochem. Soc. Trans. 2011, 39, 279–283. [Google Scholar] [CrossRef] [Green Version]
- Holbeck, B.; Amelung, W.; Wolf, A.; Sudekum, K.-H.; Schloter, M.; Welp, G. Recoveries of 15N-labelled fertilizers (chicken manure, mushroom compost and potassium nitrate) in arable topsoil after autumn application to winter cover crops. Soil Tillage Res. 2013, 130, 120–127. [Google Scholar] [CrossRef]
- Morier, I.; Schleppi, P.; Siegwolf, R.; Kicker, H.; Guenat, C. 15N immobilization in forest soil: A sterilization experiment coupled with 15CPMAS NMR spectroscopy. Eur. J. Soil Sci. 2008, 59, 467–475. [Google Scholar] [CrossRef] [Green Version]
- Piatek, K.B. The fate of nitrogen mineralized from leaf litter–initial evidence from 15N-labeled litter. In Proceedings of the 17th Central Hardwood Forest Conference, Lexington, KY, USA, 5–7 April 2010; Fei, S., Lhotka, J.M., Stringer, J.W., Gottschalk, K.W., Miller, G.W., Eds.; Gen. Tech. Rep. NRS-P-78. U.S. Department of Agriculture, Forest Service, Northern Research Station: Newtown Square, PA, USA, 2010; pp. 164–176. [Google Scholar]
- Nadelhoffer, K.J.; Downs, M.R.; Fry, B. Sinks for 15N-enriched additions to an oak forest and a red pine plantation. Ecol. Appl. 1999, 9, 72–86. [Google Scholar] [CrossRef]
- Cheng, W.; Coleman, D.C. Effect of living roots on soil organic matter decomposition. Soil Biol. Biochem. 1990, 22, 781–787. [Google Scholar] [CrossRef]
- Rohrbacher, F.; St-Arnaud, M. Root exudation: The ecological driver of hydrocarbon rhizoremediation. Agronomy 2016, 6, 19. [Google Scholar] [CrossRef]
- Griffiths, D.A.; Griffiths, D.J. The fine structure of autotrophic and heterotrophic cells of Chlorella vulgaris (Emerson strain). Plant Cell Physiol. 1969, 10, 11–19. [Google Scholar]
- Safi, C.; Zebib, B.; Merah, O.; Potalier, P.-Y.; Vaca-Garcia, C. Morphology, composition, production, processing and applications of Chlorella vulgaris: A review. Renew. Sustain. Energy Rev. 2014, 35, 265–278. [Google Scholar] [CrossRef] [Green Version]
- Bastian, F.; Bouzri, L.; Nicolardot, B.; Ranjard, L. Impact of wheat straw decomposition on successional patters of soil microbial community structure. Soil Biol. Biochem. 2009, 41, 262–275. [Google Scholar] [CrossRef]
- Morrison, J.M.; Murphy, C.L.; Baker, K.; Zamor, R.M.; Nikolai, S.J.; Wilder, S.; Elshahed, M.S.; Youssef, N.H. Microbial communities mediating algal detritus turnover under anaerobic conditions. PeerJ 2017, 5, e2803. [Google Scholar] [CrossRef] [Green Version]
- Fierer, N.; Bradford, M.A.; Jackson, R.B. Toward an ecological classification of soil bacteria. Ecology 2007, 88, 1354–1364. [Google Scholar] [CrossRef]
- Hou, J.; Li, M.; Mao, X.; Hao, Y.; Ding, J.; Liu, D.; Xi, B.; Liu, H. Response of microbial community of organic-matter-impoverished arable soil to long term application of soil conditioner derived from dynamic rapid fermentation of food waste. PLoS ONE 2017, 12, e0175715. [Google Scholar] [CrossRef] [PubMed]
- Chen, L.; Zhang, J.; Zhao, B.; Yan, P.; Zhou, G.; Xin, X. Effects of straw amendment and moisture on microbial communities in Chinese fluvo-aquic soil. J. Soil Sediment 2014, 14, 1829–1840. [Google Scholar] [CrossRef]
- Pascault, N.; Ranjard, L.; Kaisermann, A.; Bachar, D.; Christen, R.; Terrat, S.; Mathieu, O.; Leveque, J.; Mougel, C.; Henault, C.; et al. Simulation of different functional groups of Bacteria by various plant residues as a driver of soil priming effect. Ecosystems 2013, 16, 810–822. [Google Scholar] [CrossRef]
- Suleiman, A.K.A.; Gonzatto, R.; Aita, C.; Lupatini, M.; Jacques, R.J.S.; Kuramae, E.E.; Antoniolli, Z.I.; Roesch, L.F.W. Temporal variability of soil microbial communities after application of dicyandiamide-treated swine slurry and mineral fertilisers. Soil Biol. Biochem. 2016, 97, 71–82. [Google Scholar] [CrossRef]
- Ventura, M.; Chanchaya, C.; Tauch, A.; Chandra, G.; Fitzgerald, G.F.; Chater, K.F.; Van Sinderen, D. Genomics of Actinobacteria: Tracing the evolutionary history of an ancient phylum. Microbiol. Mol. Biol. Rev. 2007, 71, 495–548. [Google Scholar] [CrossRef] [PubMed] [Green Version]


| TC a | TN | C:N | NH4+ | NO3− | pH | |
|---|---|---|---|---|---|---|
| mg g−1 | mg g−1 | mg kg−1 | mg kg−1 | |||
| Initial soil | 21.3 ± 0.36 | 1.66 ± 0.01 | 12.8 | 1.48 ± 0.04 | 7.27 ± 0.22 | 7.4 |
| Treatment | TC a | TN | C:N |
|---|---|---|---|
| mg g−1 | mg g−1 | ||
| Initial soil (control) | 21.3 ± 0.36 | 1.66 ± 0.01 | 12.8 |
| Mixed algae b | 478.5 + 1.99 | 79.0 ± 2.28 | 6.06 |
| Urea | 0.10 ± 0.06 | 353.9 ± 0.14 | 0.0003 |
| Treatment | N Input | N Output (Plant Uptake) | Proportion of Added N in Plant |
|---|---|---|---|
| mg TN/500 g soil | mg TN/plant shoot | (%) | |
| Control | 0 | 9.29 ± 0.50 | - |
| Algal biomass | 15.81 ± 2.28 | 9.60 ± 0.68 | +1.98 ± 2.8 |
Publisher’s Note: MDPI stays neutral with regard to jurisdictional claims in published maps and institutional affiliations. |
© 2022 by the authors. Licensee MDPI, Basel, Switzerland. This article is an open access article distributed under the terms and conditions of the Creative Commons Attribution (CC BY) license (https://creativecommons.org/licenses/by/4.0/).
Share and Cite
Alobwede, E.; Cotton, A.; Leake, J.R.; Pandhal, J. The Fate and Distribution of Microalgal Nitrogen When Applied as an Agricultural Soil Fertiliser and Its Effect on Soil Microbial Communities. Phycology 2022, 2, 297-318. https://doi.org/10.3390/phycology2030016
Alobwede E, Cotton A, Leake JR, Pandhal J. The Fate and Distribution of Microalgal Nitrogen When Applied as an Agricultural Soil Fertiliser and Its Effect on Soil Microbial Communities. Phycology. 2022; 2(3):297-318. https://doi.org/10.3390/phycology2030016
Chicago/Turabian StyleAlobwede, Emanga, Anne Cotton, Jonathan R. Leake, and Jagroop Pandhal. 2022. "The Fate and Distribution of Microalgal Nitrogen When Applied as an Agricultural Soil Fertiliser and Its Effect on Soil Microbial Communities" Phycology 2, no. 3: 297-318. https://doi.org/10.3390/phycology2030016
APA StyleAlobwede, E., Cotton, A., Leake, J. R., & Pandhal, J. (2022). The Fate and Distribution of Microalgal Nitrogen When Applied as an Agricultural Soil Fertiliser and Its Effect on Soil Microbial Communities. Phycology, 2(3), 297-318. https://doi.org/10.3390/phycology2030016