Article

Fast-Tracking Isolation, Identification and Characterization of New Microalgae for Nutraceutical and Feed Applications

Algae Biotechnology Laboratory, School of Agriculture and Food Sciences, The University of Queensland, Brisbane, QLD 4072, Australia
*
Author to whom correspondence should be addressed.
Phycology 2022, 2(1), 86-107; https://doi.org/10.3390/phycology2010006
Submission received: 15 December 2021 / Revised: 10 January 2022 / Accepted: 13 January 2022 / Published: 16 January 2022
(This article belongs to the Collection Feature Papers in Phycology)

Abstract

:
Microalgae contain high-value biochemical compounds including fatty acids (FA), protein and carotenoids, and are promising bioresources to enhance nutrition of food and animal feed. Important requirements for commercial strains are rapid growth and high productivities of desirable compounds. As these traits are believed to be found in aquatic environments with fluctuating conditions, we collected microalgae from marine and freshwater environments that are subjected to eutrophication and/or tidal fluctuations. Using this directed approach, 40 monoalgal cultures were isolated and 25 identified through 18S rDNA sequencing and morphological characterization. Based on their high growth rates (0.28–0.60 day−1) and biomass productivities (0.25–0.44 g L−1 day−1) in commercial fertilizer under standardized conditions, six new strains were selected. Scenedesmus sp. GW63 produced quality FA-rich biomass with high omega-3 polyunsaturated FA (28.5% of total FA (TFA)) contents, especially α-linolenic acid (ALA; 20.0% of TFA) with a very low n-6/n-3 ratio (0.4), and high FA productivity (32.6 mg L−1 day−1). A high protein productivity (34.5 mg L−1 day−1) made Desmodesmus sp. UQL1_26 (33.4% of dry weight (DW)) attractive as potential protein-rich feed and nutrition supplement. Monoraphidium convolutum GW5 displayed valuable carotenoid production (0.8% DW) with high carotenoid accumulation capability (0.8 mg L−1 day−1). This research provides a pathway for fast-tracking the selection of high-performing local microalgae from different environments for nutraceuticals, functional foods and animal feed applications.

1. Introduction

Microalgae are promising bioresources that contain a wide array of valuable bioproducts to enhance the nutritional value of food and animal feed. Some of these unicellular and multicellular photosynthetic microorganisms are opportunistic and can grow rapidly under favorable conditions but also survive under extreme environmental conditions. Microalgae are highly abundant and have a rich biodiversity, with more than 72,500 species [1]. The numerous advantages of cultivating microalgae over terrestrial plants for food and feed applications are widely recognized: higher growth rates [2] and biomass productivities per land area [3]; cultivation on non-arable land [2,3,4,5]; high efficiencies in reducing greenhouse gas emission and removing CO2 from industrial flue gases by algae bio-fixation [6,7].
Based on their potentially high biomass productivity and rich biochemical composition, there has been much interest to use microalgae for a diverse range of commercial applications. This includes the use of microalgae as renewable energy sources such as biodiesel or biocrude oils [4,5,8,9], wastewater bioremediation [10], photosynthetic gas exchangers for space travel [11], cosmetics [12], nutraceuticals [13,14], functional foods [13], and feed additives [15,16]. While there is potential for microalgae-based biofuels, the high cost of microalgae production makes such low-value commodities unfeasible under current market conditions [4,13,17]. Most promising at the current state-of-the-art is therefore to develop high-value, commercial products such as nutraceuticals, functional foods and animal feed additives [13,16,17]. Of particular interest for these high-value products are biochemical compounds, such as fatty acids, protein and carotenoids, which have clear health-promoting properties [13,16,17].
Microalgae are rich sources of lipids with total lipid contents commonly ranging between 5 and 20% of the dry weight (DW) and in excess of 20% up to 80% DW in some species under stressed or unfavorable conditions [18]. Although the total lipid content is commonly reported for microalgae, quantification of the content of total fatty acids (TFA) and fatty acid composition is the essential criterion for identifying suitable microalgal strains for nutraceuticals, food and feed applications. Food or feed with a high proportion of omega-3 PUFA is considered favorable for health and nutrition. In particular, omega-3 PUFA such as C18:3(n-3) α-linolenic acid (ALA), C20:5(n-3) eicosapentaenoic acid (EPA), and C22:6(n-3) docosahexaenoic acid (DHA) are nutritionally valuable products that promote cardiovascular and circulatory health in humans as well as growth and health in aquaculture species [2]. Traditionally, omega-3 PUFA are derived from wild fish oil. However, much concern has been raised in regard to unsustainable fishing [19], the presence of chemical contaminants and the vegetarian consumption dilemma [20]. Thus, the demand for microalgae-based omega-3 PUFA is rapidly increasing.
Protein quality and quantity are also key factors in measuring the nutritional value of microalgae for foods, health products and animal feeds [16,21]. While algae can synthesize all amino acids, humans and animals must take up essential amino acids from food [16,21]. Almost all microalgae have high-quality amino acids that are superior to conventional food proteins [21]. Furthermore, the crude protein content generally makes up a large fraction of their actively growing biomass [15,22]. This is one of the main reasons to consider microalgae as an excellent alternative source of protein [16,21]. A prominent example is Spirulina sp. which can yield up to 46–71% DW of high-quality protein and is widely used for functional foods and nutraceuticals [15]. Protein-rich microalgae can be used in animal nutrition and aquaculture feed [16]. Specifically, several trials of utilizing microalgae as an alternative protein feed supplement have been performed on poultry and ruminants, and significantly higher growth rates and lower non-specific mortality rates were observed [21]. The overall protein production for food or food substitutes has not been fully exploited, despite its high nutritious content [15].
Algae can produce a greater variety of carotenoids than higher plants [21,23,24]. Microalgae-derived carotenoids are commercially exploited as natural food colorants, antioxidants, animal feed additives, and cosmetics [16]. Specifically, β-carotene can be converted into vitamin A by the human metabolism [17] and the consumption of a rich β-carotene diet can reduce the chance of developing several types of cancer and degenerative diseases [21]. Dunaliella salina is a well-commercialized species that has a high content (up to 14% DW under certain stressed conditions) of β-carotene [13,16]. Astaxanthin is a powerful antioxidant that is also used by the aquaculture industry to refine coloration characteristics of fish and crustaceans [16]. The commercial species Haematococcus pluvialis contains the highest amount of astaxanthin (1.5–3.0% DW) in any natural source [13,14,25]. Although the current market is dominated by chemically-synthesized carotenoids, the natural forms of these, produced by microalgae, do contribute to a large share [13,16,17]. In addition, the natural carotenoid industry is substantially growing due to the decreased use of synthetic food additives as some of these are suspected to possess carcinogenic, liver and renal toxicity properties [21].
Irrespective of different growth conditions, such as growth phase, culture medium, light irradiance, and temperature, the biochemical composition of microalgae, including the total lipid content [14,18,26], fatty acid composition [2,14,27,28], total protein content (10% to 71% DW) [15,29], and total carotenoid content (0.1% to 14% DW) [16,30], varies significantly between species. The use of local dominant microalgae with high growth rates and high productivities of desirable compounds is considered superior to using non-native (exotic) strains, as these may not be well adapted to local environments and may pose an ecological risk as invasive species [5]. However, this is contrary to most commercial microalgae operations who typically only use less than a dozen strains. Despite the fact that algae have numerous potentials and benefits to be utilized in human and animal nutrition and their high biodiversity, only few species are currently commercialized in the market.
Much effort needs to be made to investigate ‘wild’ local microalgal strains from unique and diverse aquatic environments with capacities of more efficient biocompound production [18]. Significant opportunities exist to identify, assess and select promising local strains, based on rapid growth in agricultural fertilizers, high biomass productivity, easy harvesting capability, high protein, carotenoid and oil content and quality, all of which are key properties for successful commercialization. As the algae industry is expanding, there is a need to fast-track effective isolation and characterization of high-performing local strains. An important foundation step is to rapidly identify, assess growth/harvesting properties, and profile and quantify the biochemical composition of local microalgae to target high-value natural compounds for nutraceuticals, food and animal feeds. The current study provides a pathway for the rapid selection of local high-performing strains by sampling from fluctuating and extreme environments, where opportunistic microalgae with high compound inducibility are likely to preferentially reside. Following isolation and identification, standardized protocols for cultivation, harvesting and compound profiling were used.

2. Materials and Methods

2.1. Microalgae Sample Collection and Isolation

In an effort to streamline the sampling of robust and fast-growing microalgae, water samples of microalgae were collected from a great variety of local fluctuating aquatic environments, such as freshwater lakes and ponds (subject to sporadic eutrophication), as well as environments with tidal fluctuating conditions such as a brackish river, an estuary and a coastal rocky beach of subtropical regions in Queensland, Australia (for exact location see Results section). All samples were filtered through a 50-micron-filter mesh and initially cultivated with F/2 medium (Algaboost F/2 (2000×) silicate free, AusAqua, Wallaroo, Australia) [31] for 2 weeks. Pure cultures were then isolated by micromanipulation and agar plate streaking, and subsequently kept as stock cultures following the rapid isolation protocol by Duong et al. [32,33]. In addition, one promising strain from the Northern Territory, Scenedesmus dimorphus NT8C, from the Queensland Microalgae Collection at the University of Queensland, Brisbane, Australia [34] was included in this study as a benchmark strain. All microalgal stock cultures were enriched with agricultural-grade fertilizer nutrients (Table 1) and were maintained in 50 mL Erlenmeyer flasks with constant orbital shaking (100 rpm) at 25 ± 2 °C, under 24 h white fluorescent light (120 µmol photons m−2 s1). As axenic cultures often produce low biomass productivity [25], xenic, monoalgal cultures (with associated bacteria still present) were maintained and sub-cultured every three weeks. All microalgal cultures were routinely examined under a compound microscope (Olympus CX21LED, Notting Hill, Australia) for other microalgal contamination or visible bacterial presence during exponential algal growth.

2.2. Standardized Cultivation and Growth Experiments

Based on pre-screening criteria of fast growth, ease of harvesting (settling properties), and easy cultivation in fertilizer media, seven microalgal strains were pre-selected for the growth experiment (see Results section). In order to promote health of cultures and standardize cell densities, recent stock cultures were used as inoculums and initially cultured for 4 days till they reached late logarithmic (late log) phase in fertilizer medium (Table 1). Nitrate concentrations were measured with the Nitrate (NO3−) Test Kit (API Aquarium Pharmaceuticals) on day 4 to ensure cultures contained adequate nutrients, prior to the growth experiments. A total of 50 mL of inoculated algal cultures was used to start the standardized growth experiment with 450 mL fertilizer medium. All cultures were maintained in 500 mL Erlenmeyer flasks with aeration (without external CO2 supply) at a temperature and light controlled laboratory (25 ± 2 °C, 16 h:8 h light:dark cycle, 150 µmol photons m−2 s−1 light from white LED lights). Three replicates of each strain were cultured, harvested and analyzed separately. Growth experiments were carried out for 3–5 days, then 250 mL of algal cultures in late log phase were harvested through centrifugation at 1700× g for 5 min. Cell culture densities (haemocytometer, Blaubrand, Merck, Bayswater, Australia) and nutrient concentrations were measured daily. As lipid production increased in some microalgal species under nutrient deprivation [2,3,14,35], the remaining nutrient deprived cultures were further cultivated for 2 days to induce lipid production. A total of 100 mL of remaining biomass was harvested and centrifuged at 1700× g for 5 min. After nutrient deprivation, 2 mL of microalgal cultures were stained with 0.5 mg mL−1 Nile red (Sigma-Aldrich, dissolved in dimethyl sulfoxide) for 15 min and photographed under a compound microscope (Zeiss AX10, AxioCam MRc camera, Oberkochen, Germany) with epifluorescent light (excitation: 510–550 nm, emission: 590 nm). All harvested biomass was frozen at −80 °C and lyophilized for 3 days. Biomass used for protein analysis was stored at −20 °C and the remaining biomass was stored at −80 °C till further analyses. The average growth rate [36] was calculated using the equation:
µ = ln ( N y / N x ) / ( t y t x )
where Nx was the number of cells at the start (tx) of the growth period (5–7 days) and Ny was the number of cells at the end (ty) of the growth period. The average doubling time [2] was calculated using the equation:
T = ( t y t x ) / log 2 ( N x / N y )
Biomass productivities (g L−1 day−1) were calculated as total DW over the duration of the growth experiment (late log phase (3–5 days, LL), average of the total growth experiment period (5–7 days, AVE), and the nutrient depleted period (2 days, ND)).

2.3. DNA Isolation, Sequencing and Identification

Genomic DNA was extracted from 15 mL fresh algal stock cultures of each strain using a DNeasy Plant Mini Kit (Qiagen) following the manufacturer’s instructions. DNA amplification for the partial sequence of 18S rRNA gene was performed by polymerase chain reaction (PCR) with the following primers: Forward: 5′-GCGGTAATTCCAGCTCCAATAGC-3′ and Reverse: 5′-GACCATACTCCCCCCGGAACC-3′. PCR was performed in a 25 µL mixture containing 1.25 U/µL TAQ DNA Polymerase (Scientifix, Clayton, Australia), 1× Reaction Buffer with 2 mM MgCl2 (Scientifix, Clayton, Australia), 200 µM dNTP mix (Scientifix, Clayton, Australia), 0.25 µM of each primer, 18.75 µL of UltraPure Distilled Water (Thermo Fisher Scientific, Waltham, MA, USA) and 1 µL of genomic DNA (10–25 ng), and amplified on a Bio-Rad DNA Engine PCR machine with the following cycling profile: initialization at 94 °C for 5 min, denaturation at 94 °C for 30 s, annealing at 55 °C for 30 s, extension at 72 °C for 1 min, final extension at 72 °C for 10 min. PCR products were purified using a Wizard SV Gel PCR Clean-Up System (Promega, Madison, WI, USA). A volume of 5 µL of purified DNA (25 ng) was mixed with 0.83 µM of each primer separately, topped up to 12 µL in a final volume with UltraPure Distilled Water and sequenced in both directions by the Australian Genome Research Facility in Brisbane, Australia.
Sequences were manually checked, edited and submitted to GenBank (Table 1). DNA sequences were searched and compared using nucleotide BLAST in GenBank (http://blast.ncbi.nlm.nih.gov/Blast.cgi, accessed on 27 October 2015). Based on BLAST results, closely related sequences in preference to published peer reviewed journal articles were downloaded and included for constructing the phylogenetic tree. Species names were assigned to sequences with 100% identity match, whereas genus names were adopted with 99% identity match. When sequence identity was less than a 99% match or was matched with multiple genera, morphological taxonomy and phylogenetic trees were used to identify the genus of strains. A total of 38 sequences (13 from GenBank and 25 from this study) were aligned and trimmed into standard size in MEGA 6.06. The maximum parsimony phylogenetic tree was constructed in MEGA 6.06 using the Subtree-Pruning-Regrafting (SPR) algorithm and was drawn to scale, with branch lengths calculated using the average pathway method [37,38]. The alignment consisted of 397 positions. Gaps and missing data from all positions were eliminated. The bootstrap test (1000 replicates) was used to estimate the reliability of the phylogenetic tree [39].

2.4. Fatty Acid Methyl Ester (FAME) Analyses

Lyophilized algal biomass (5 mg) was hydrolyzed and methyl-esterified in 300 µL of a 2% (v/v) H2SO4 methanol solution for 2 h at 80 °C with 50 µg C21:0 (heneicosanoic acid, Sigma-Aldrich, St. Louis, MO, USA) as an internal recovery standard. A total of 300 µL of hexane and 300 µL of 0.9% (w/v) NaCl were added to the mixture. The mixture was vortexed for 20 s and centrifuged at 16,000× g for 3 min to facilitate phase separation. A total of 150 µL of the hexane layer was injected into an Agilent 6890 gas chromatograph connected to a 5975 MSD mass spectrometer. The running conditions of Agilent’s RTL DBWax method (Application note: 5988-5871EN) was set up as described previously [2]. Fatty acids were identified by comparing retention times with pre-run external standards (37 FAME Mix, Supelco, identified through the NIST library). A linear calibration curve based on the internal standard C22:4(n-6) (adrenic acid) and the internal recovery standard C21:0 were used for fatty acid quantification. TFA content was determined as the sum of all fatty acids. TFA productivity (mg L1 day1) was calculated as TFA multiplied by the average biomass productivity over the entire growth period.

2.5. Total Protein Analyses

The protein content was measured by the Lowry method ([22,40] 1951) with slight modifications. A total of 10 mg of crushed, lyophilized algal biomass was suspended in 10 mL of lysis buffer (5 mL L−1 of Triton X-100, Chem Supply; 0.37 g L−1 ethylenediaminetetraacetic acid disodium salt, Chem Supply; 0.03 g L−1 of phenyl methyl sulfonyl fluoride, Sigma-Aldrich, St. Louis, MO, USA) for 30 min. Then, 0.1 mL of SDS solution (0.05 g L−1 of sodium dodecyl sulfate salt, Sigma-Aldrich, St. Louis, MO, USA) was added into 0.1 mL of the lysis buffer mixture and mixed by vortexing. The reaction mixture was used for extracting proteins with a CB-X Protein Assay Kit (G-Biosciences, St. Louis, MO, USA) following the manufacturer’s instructions. A microplate photometer (Glomax Multi Detection System, Promega, Madison, WI, USA) was used to obtain the absorbance at wavelength 600 nm. The absorbance was then converted into protein concentration using a linear calibration curve (correlation coefficient was 0.995) established by the absorbance range of 0.2−1 corresponding to the bovine serum albumin (BSA) standard concentration of 0–1 mg mL−1. The protein content of the biomass was calculated using the equation:
Protein   ( % ,   DW ) = CVD / m   ×   100
where C was the protein concentration (mg L−1) obtained from the calibration curve, V was the volume (L) of the lysis buffer, D was the dilution factor, and m was the amount of biomass (mg) [22]. Protein productivity (mg L−1 day−1) was calculated as the total protein content multiplied by the biomass productivity during the late log phase.

2.6. Total Carotenoid Analyses

The total carotenoid extraction was carried out as previously described [36,41,42]. Briefly, 10 mL of 90% acetone (Merck KGaA, HPLC grade, Bayswater, Australia) was added to 10 mg of crushed lyophilized algal sample and mixed by vortexing. The mixture was then kept in the dark for 24 h at 4 °C. A spectrophotometer (Hitachi U-2800, Tokyo, Japan) was used to obtain the absorbance of the solvent at wavelengths 470, 646.6 and 663.6 nm. The carotenoid content of the biomass was calculated using the following equations:
C a = 12.25 A 663.2 2.79 A 646.8
C b = 21.50 A 646.8 5.10 A 663.2
C x + c = ( 1000 A 470 1.82 C a 85.02 C b ) / 198
Carotenoids   ( mg   g 1 DW ) = ( C x + c ×   V ) / ( m   ×   1000 )
where V was the volume (mL) of the acetone and m was the amount of biomass (g). Carotenoid productivity (mg L−1 day−1) was calculated as the total carotenoid content multiplied by the biomass productivity during the late logarithmic phase.

2.7. Statistical Analyses

All results were obtained from three separately-grown replicate cultures (six replicates for reference strain S. dimorphus NT8C) and are shown as the mean values ± SE. Growth rate, doubling time and biomass productivity were analyzed by ANOVA followed by Tukey’s test.

3. Results

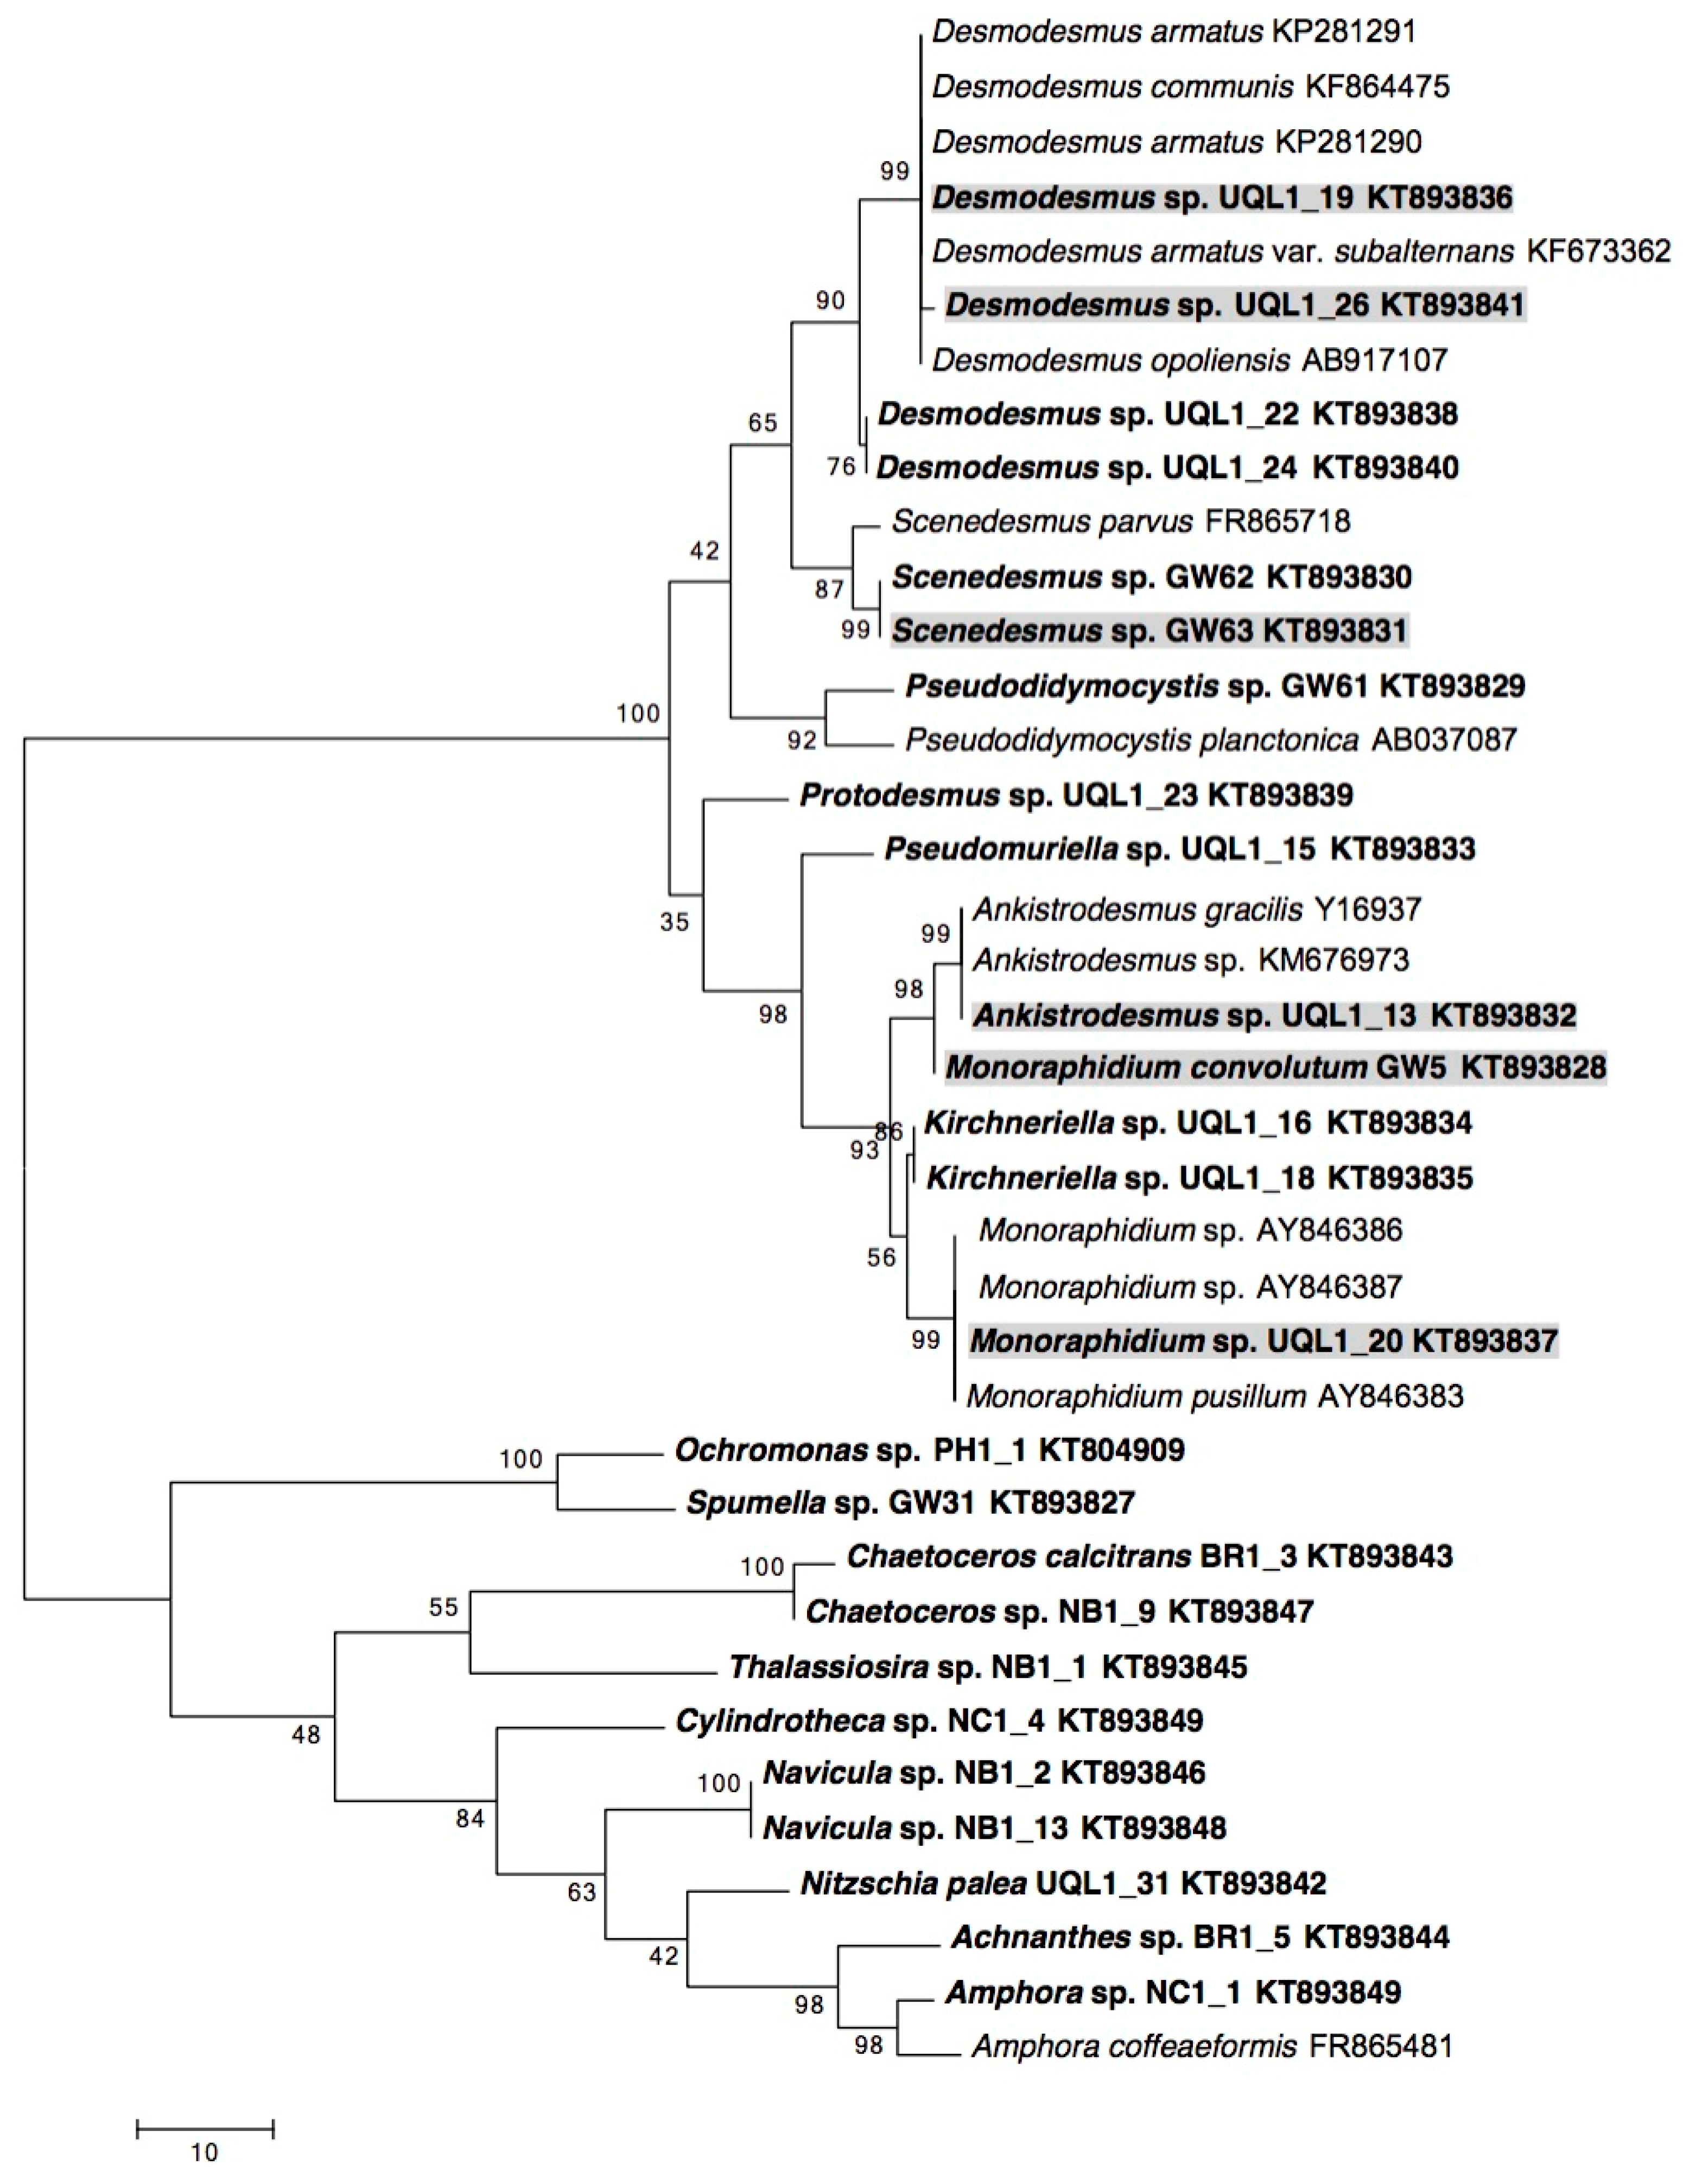
3.1. Sample Collection, Isolation and Identification

A total of 40 microalgal strains were successively isolated and cultured from marine, brackish and freshwater environments that are subjected to frequent fluctuating conditions (eutrophication and/or tidal influences). Based on initial observations under a compound microscope, freshwater strains were dominated by Chlorophyceae, whereas marine strains were dominated by Bacillariophyceae. More than half of the marine algae were unhealthy (displaying lysed cells or fractured cell walls) and ultimately died upon culturing in agricultural fertilizer media, leaving 25 cultures. BLAST results of the 18S rRNA gene sequences were able to assign identity to 20 out of 25 isolated new strains, and those with less than 99% sequence identity matches were confirmed by morphological taxonomy and the maximum parsimony phylogenetic tree (Table 2, Figure 1).
UQL1_19 and UQL1_26 were identified as Desmodesmus sp. as they formed a well-supported clade (99% bootstrap support) with Desmodesmus armatus (Genbank accession: KP281291 and KP281290), Desmodesmus communis (Genbank accession: KF864475), Desmodesmus armatus var. subalternans (Genbank accession: KF673362), and Desmodesmus opoliensis (Genbank accession: AB917107). The morphological description matched with this finding, where the formation of spines was the distinct difference between Desmodesmus and Scenedesmus [43]. Non-spiny strains were identified as Scenedesmus, while spiny strains were assigned into the genus Desmodesmus. The sequence of Scenedesmus sp. GW63 was 99% identical to Scenedesmus parvus (Genbank accession: FR865718). UQL1_13 formed a distinct clade (99% bootstrap support) with Ankistrodesmus gracilis (Genbank accession: Y16937) and Ankistrodesmus sp. (Genbank accession: KM676973), and therefore was assigned to Ankistrodesmus species. GW5 sequence was identical to the Genbank sample Monoraphidium convolutum (AY846377). However, this strain clustered with Ankistrodesmus sp. UQL1_13 rather than other Monoraphidium species. UQL1_20 had a sequence identity of 100% with Monoraphidium sp. (Genbank accession: AY846386 and AY846387) and Monoraphidium pusillum (Genbank accession: AY846383) and was ultimately identified as a Monoraphidium species. Clear monophyletic clades of Scenedesmaceae, Selenastraceae, Chlorophyceae, and Bacillariophyceae were formed in the 18S rRNA phylogeny in this study (Figure 1). Among the 25 identified new monoalgal strains (Table 2), six displayed initial fast growth, easy cultivation with agricultural fertilizer-grade nutrients and settling as an indicator of good harvesting potential (Figure 2). These were subjected to standardized growth and lipid induction experiments in triplicate cultures to allow a direct comparison.

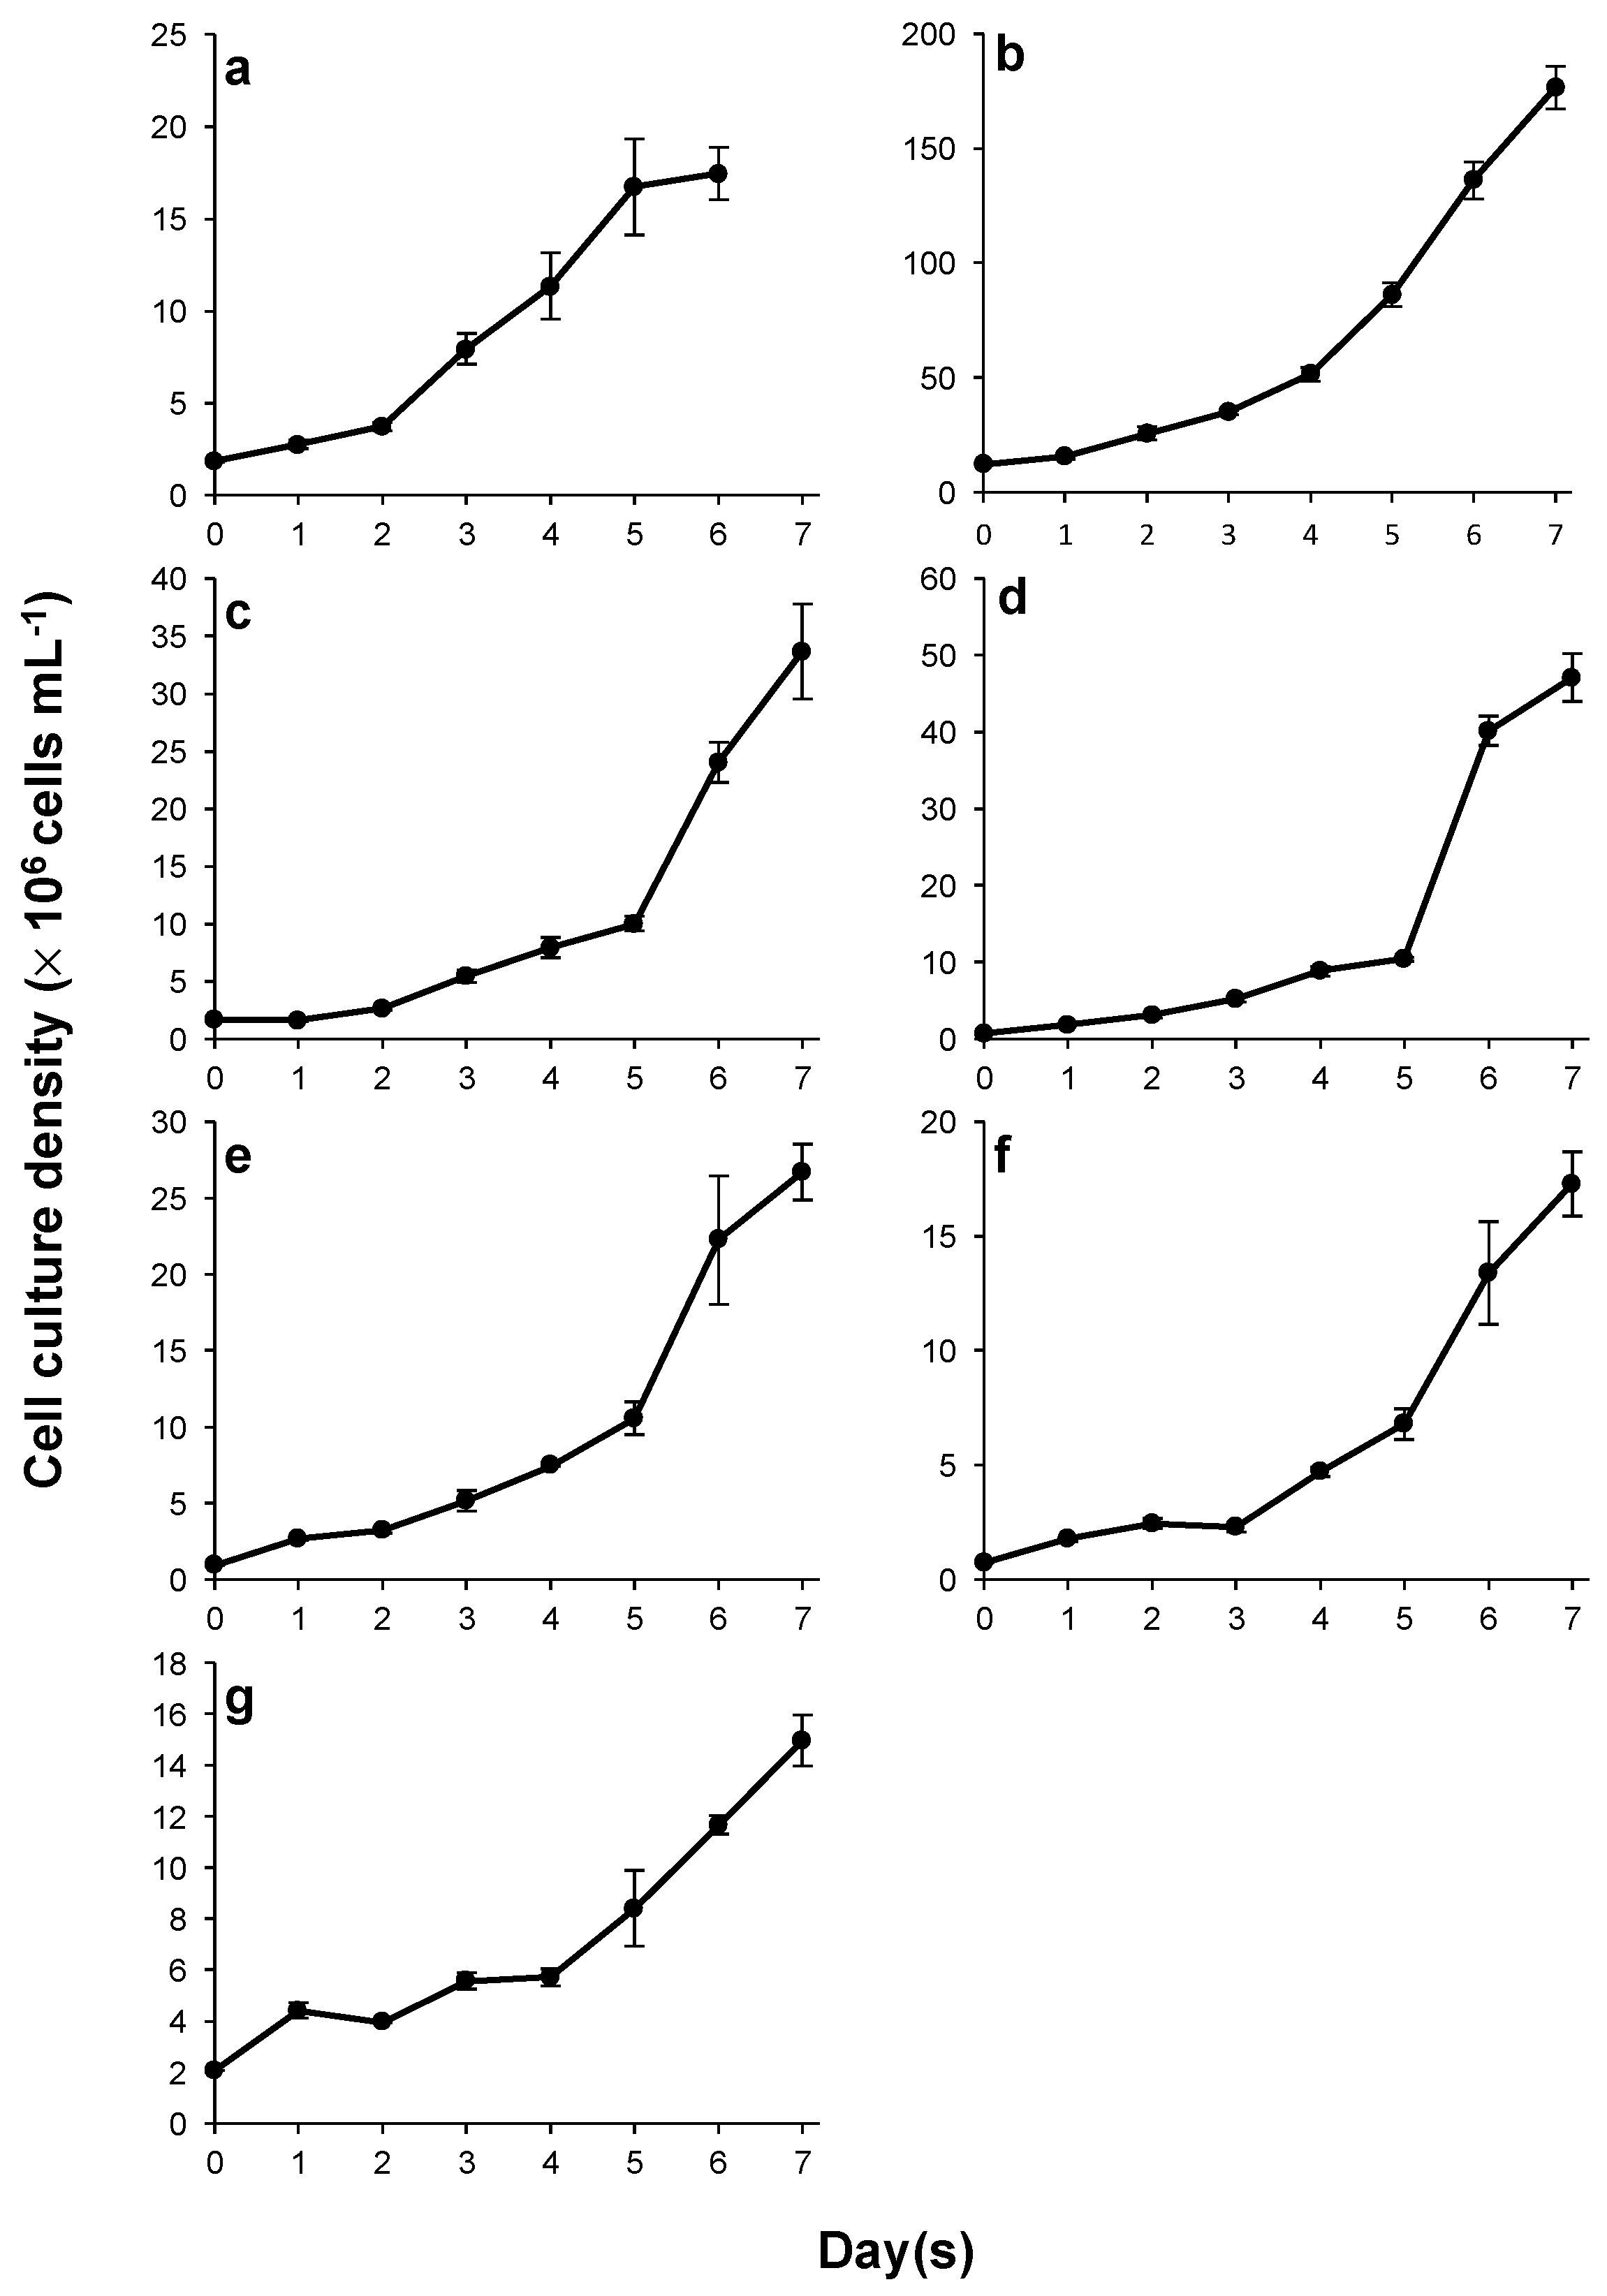
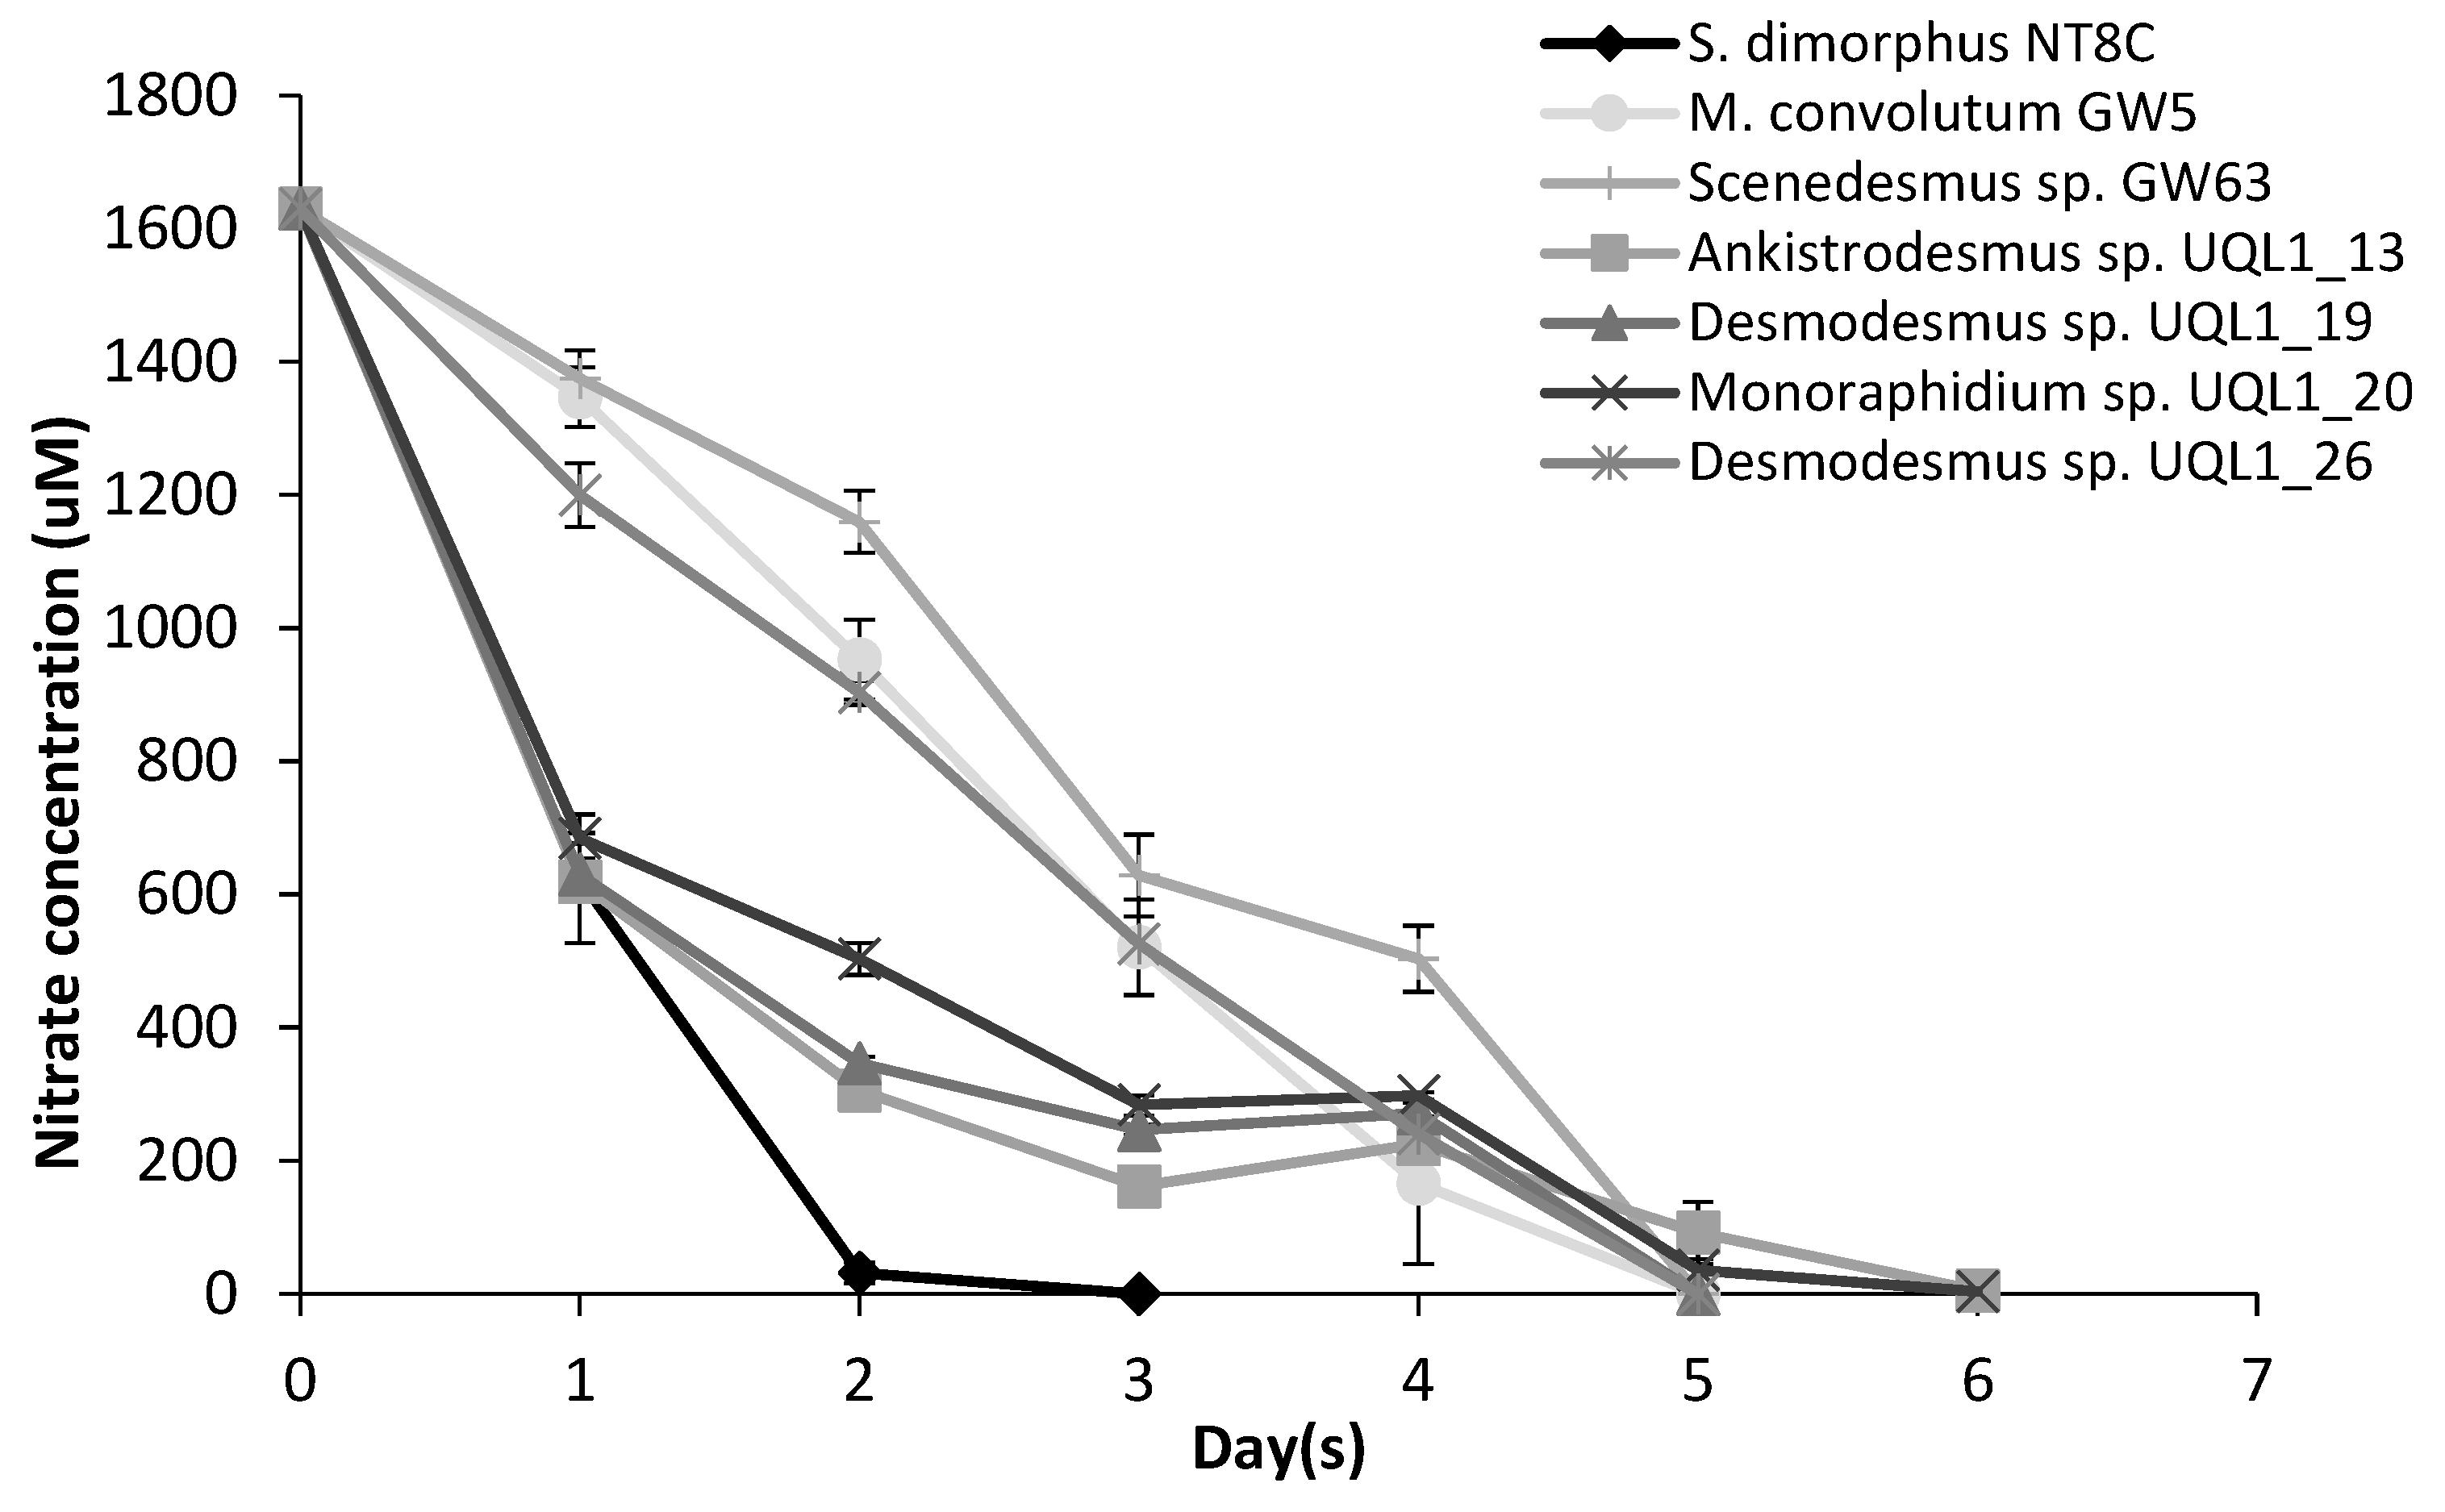
3.2. Cultivation and Growth

After inoculation for the standardized assay, most cultures maintained exponential growth with the exception of Scenedesmus sp. GW63, which did not grow during day 1 and resumed growth on day 2. A lag phase was observed in Monoraphidium sp. UQL1_20 on day 3, and Desmodesmus sp. UQL1_26 on day 2 and day 4. All cultures attained exponential growth in relatively homogeneous patterns till the end of the experiment (Figure 3). S. dimorphus NT8C maintained relatively the same growth rate (on average) before and after nutrient depletion. The average growth rate was slightly reduced in Ankistrodesmus sp. ULQ1_13, Desmodesmus sp. UQL1_19, Monoraphidium sp. UQL1_20 upon nutrient deprivation, and slightly increased in M. convolutum GW5, Scenedesmus sp. GW63 and Desmodesmus sp. UQL1_26 (Figure 3). Nutrient draw down was the fastest in S. dimorphus NT8C, with no residual nitrate detected in the medium on day 3. Nitrate in culture media was consumed by all other strains by day 5 (Figure 4).
The highest growth rate was found for Ankistrodesmus sp. UQL1_13 (0.60 day−1), followed by Desmodesmus sp. UQL1_19 (0.48 day−1), Monoraphidium sp. UQL1_20 (0.45 day−1), S. dimorphus NT8C (0.44 day−1), and Scenedesmus sp. GW63 (0.42 day−1) (Table 3). The lowest growth rate was observed in Desmodesmus sp. UQL1_26 (0.28 day−1). Average growth rates were highly variable within the same genus apart from two Scenedesmus spp. According to growth rates, cell doubling time was the shortest in Ankistrodesmus sp. UQL1_13 (1.15 days) and the longest in Desmodesmus sp. UQL1_26 (2.45 days) (Table 3).
M. convolutum GW5 reached the maximum cell density (cell densityMax) of 176.50 × 10⁶ cells mL−1, while Desmodesmus sp. UQL1_26 reached the minimum cell density of 14.96 × 10⁶ cells mL−1 among the seven studied strains (Table 3). S. dimorphus NT8C was the highest biomass producer when grown till late log phase (0.17 g L−1 day−1) and a high biomass producer during the whole period of the growth experiment (0.24 g L−1 day−1) and nutrient deprivation phase (0.37 g L−1 day−1). However, Scenedesmus sp. GW63 became the most productive strain with its high average biomass productivity over the duration of the growth experiment (0.27 g L−1 day−1) and its biomass productivity over the nutrient depleted period (0.37 g L−1 day−1). The fast-growing strain Ankistrodesmus sp. UQL1_13 showed considerable strength in producing biomass during nutrient depletion (0.37 g L−1 day−1). Notably, algal biomass productivity achieved during the nutrient depleted period was higher overall compared to other growth phases; however, patterns were highly variable between species.

3.3. Fatty Acid Content and Composition

The content of TFA determined from GC-MS analyses varied markedly between strains and ranged from 11.7 to 15.9% DW (Table 4). Monoraphidium sp. UQL1_20 had the highest content of TFA (15.9% DW), followed by Ankistrodesmus sp. UQL1_13 (14.9% DW), while Desmodesmus sp. UQL1_26 (11.7% DW) and S. dimorphus NT8C (11.8% DW) had the lowest content of TFA. The proportion of SFA ranged from 21 to 31.8% of TFA across all strains with C16:0 (palmitic acid, 17.9–25.7% of TFA) being the most abundant SFA. The proportion of MUFA was between 28.5 and 35.4% of TFA, dominated by C18:1(n-9) (oleic acid, 26.4–32.7% of TFA). All strains had high proportions of PUFA (33–41.6% of TFA), dominated by C18:3(n-3) (α-linolenic acid, ALA, 11.4–20% of TFA). No C20:5(n-3) (eicosapentaenoic acid, EPA) and C22:6(n-3) (docosahexaenoic acid, DHA) higher than the cut-off of 1% were found in the algae examined. The proportion of omega-3 PUFA of TFA (22–31.2%) was larger than that of omega-6 PUFA (7.9–12.8%), reflected by low n-6/n-3 ratios (0.3–0.6). While the types of FA present in the examined strains were essentially homogeneous, there was variation in the content and composition of FA. In a similar manner, there was also distinct variation in TFA productivity, which ranged between 22.3 and 32.6 mg L−1 day−1, with Scenedesmus sp. GW63 having the highest and Desmodesmus sp. UQL1_26 having the lowest TFA productivity.

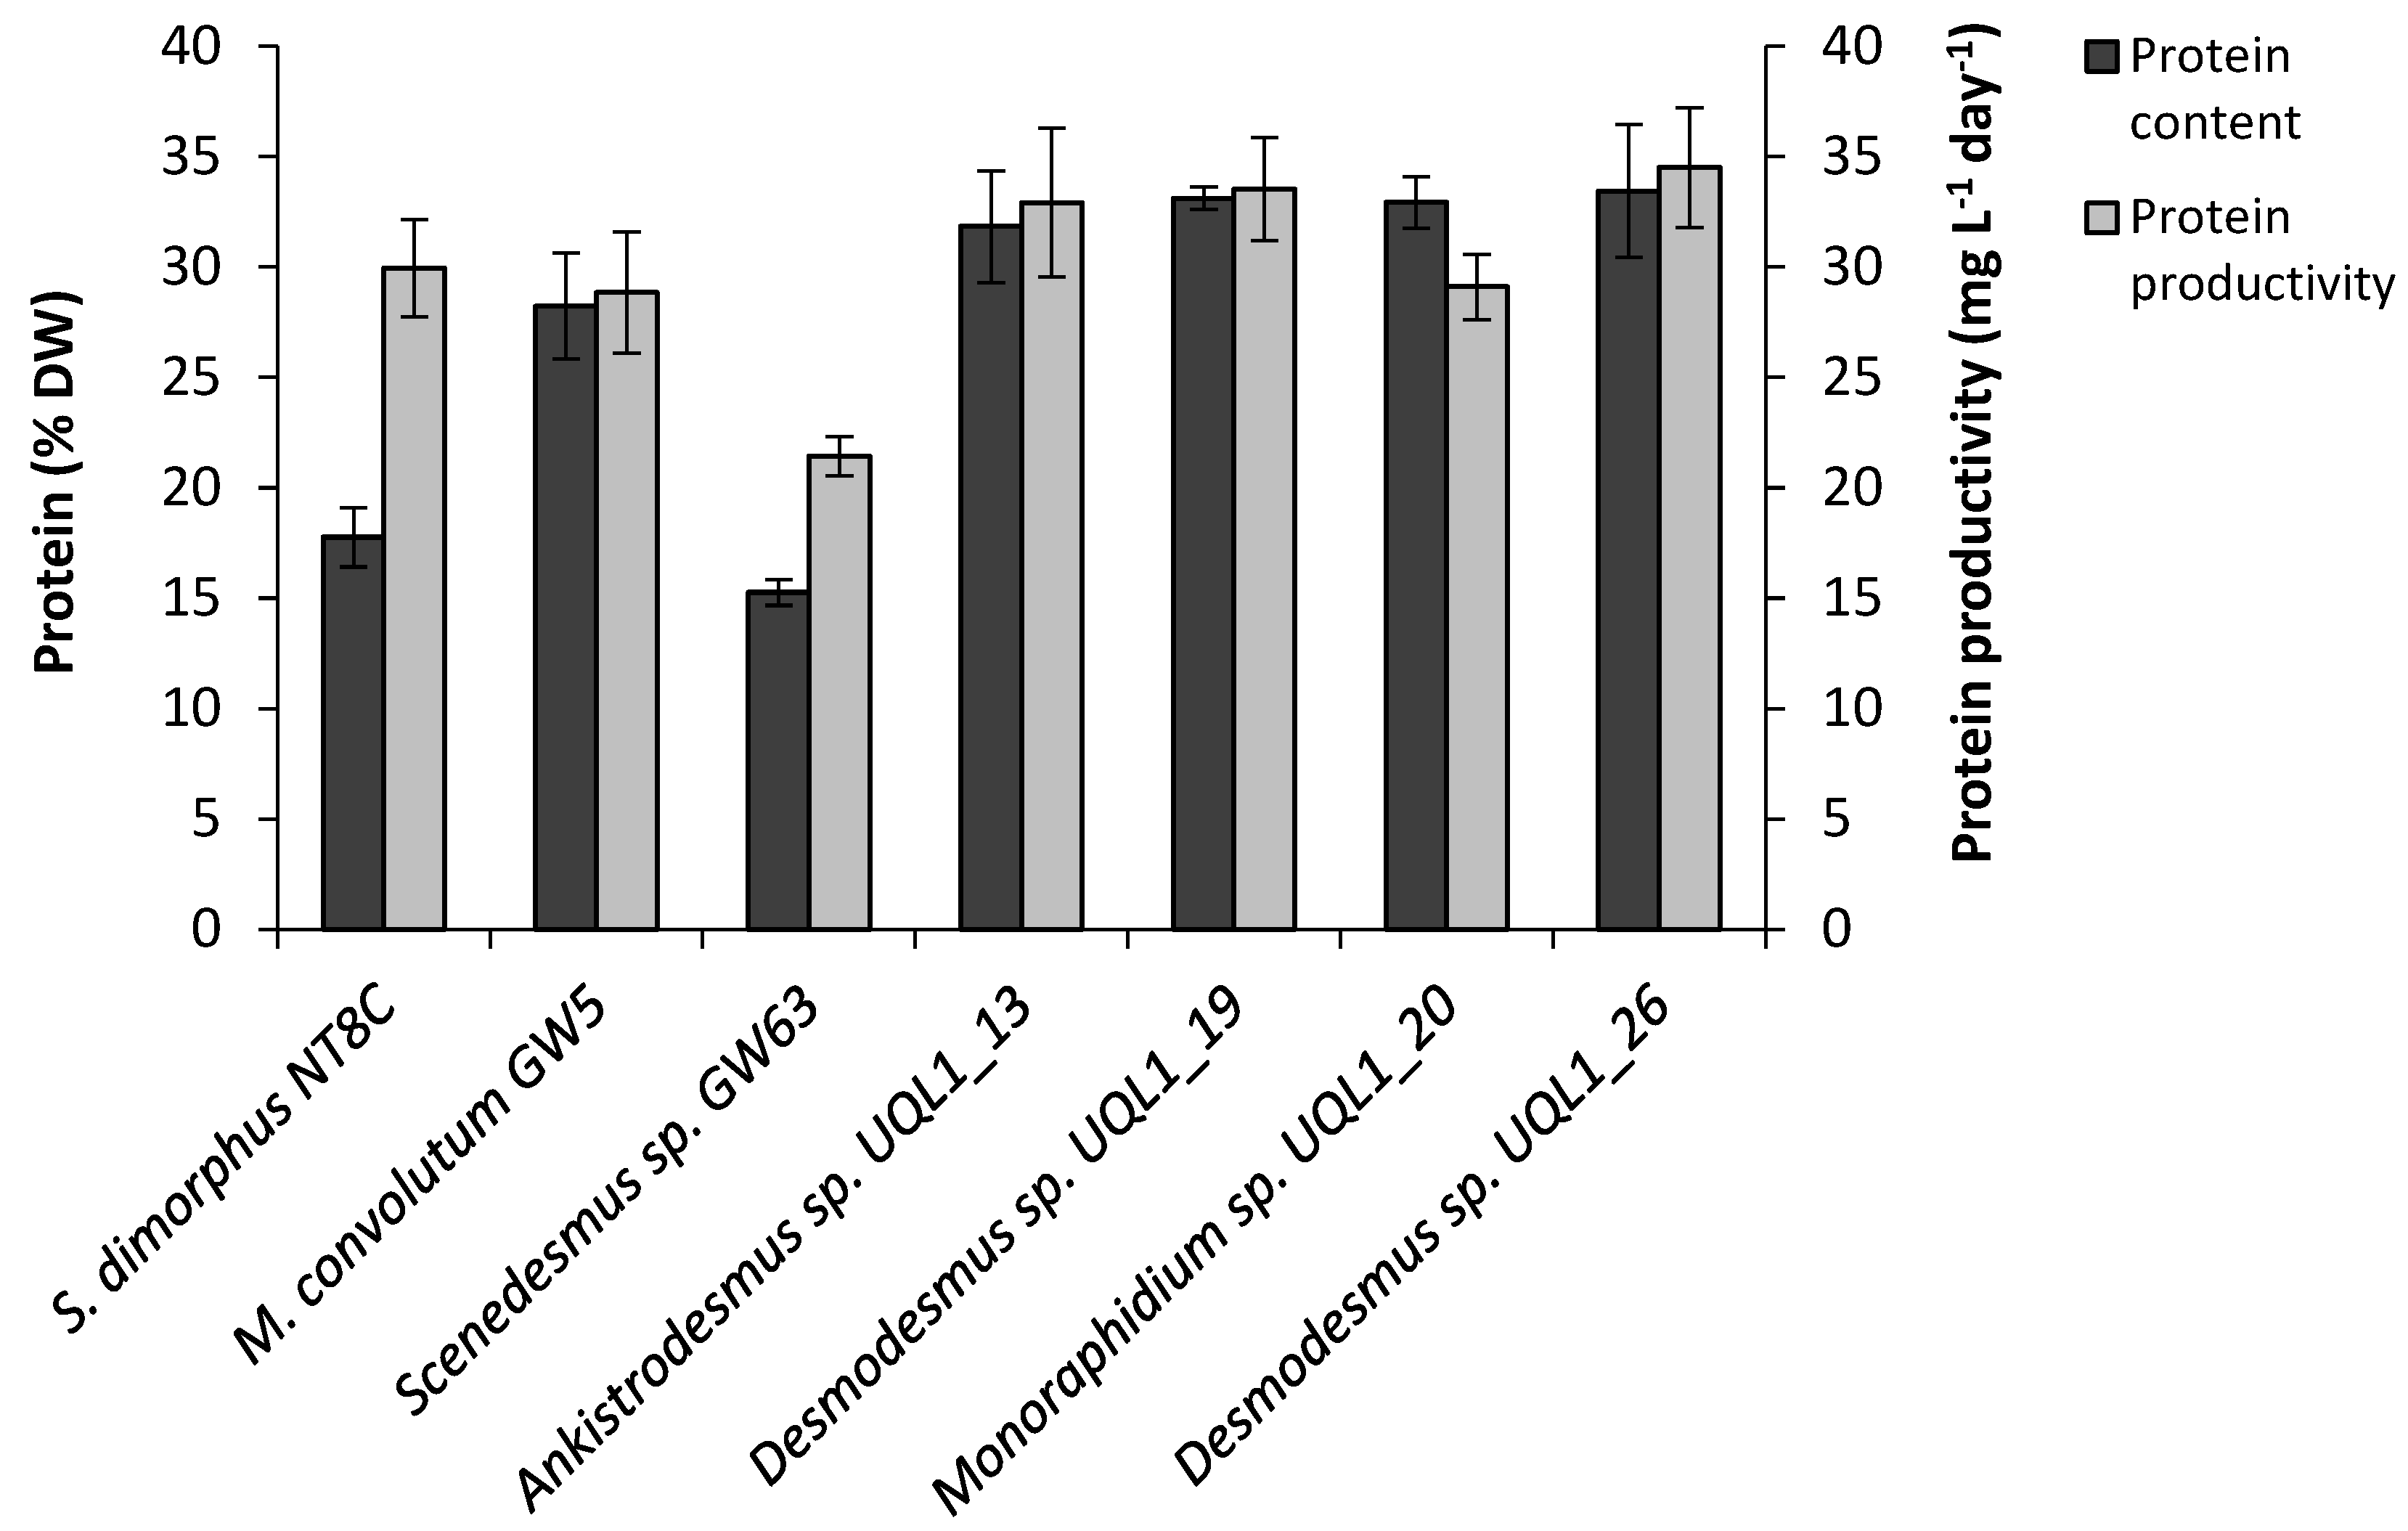
3.4. Total Protein Content

The crude protein content ranged from 15.3 to 33.4% DW across all tested strains (Figure 5). The highest protein content was found in two Desmodesmus spp. UQL1_26 (33.4% DW) and UQL1_19 (33.1% DW), followed by Monoraphidium sp. UQL1_20 (32.9% DW) and Ankistrodesmus sp. UQL1_13 (31.8% DW), whereas the lowest protein content was found in two Scenedesmus strains, S. dimorphus NT8C (17.8% DW) and Scenedesmus sp. GW63 (15.3% DW), respectively. Desmodesmus spp. UQL1_26 protein productivity was approximately 61.0% higher than Scenedesmus sp. GW63.

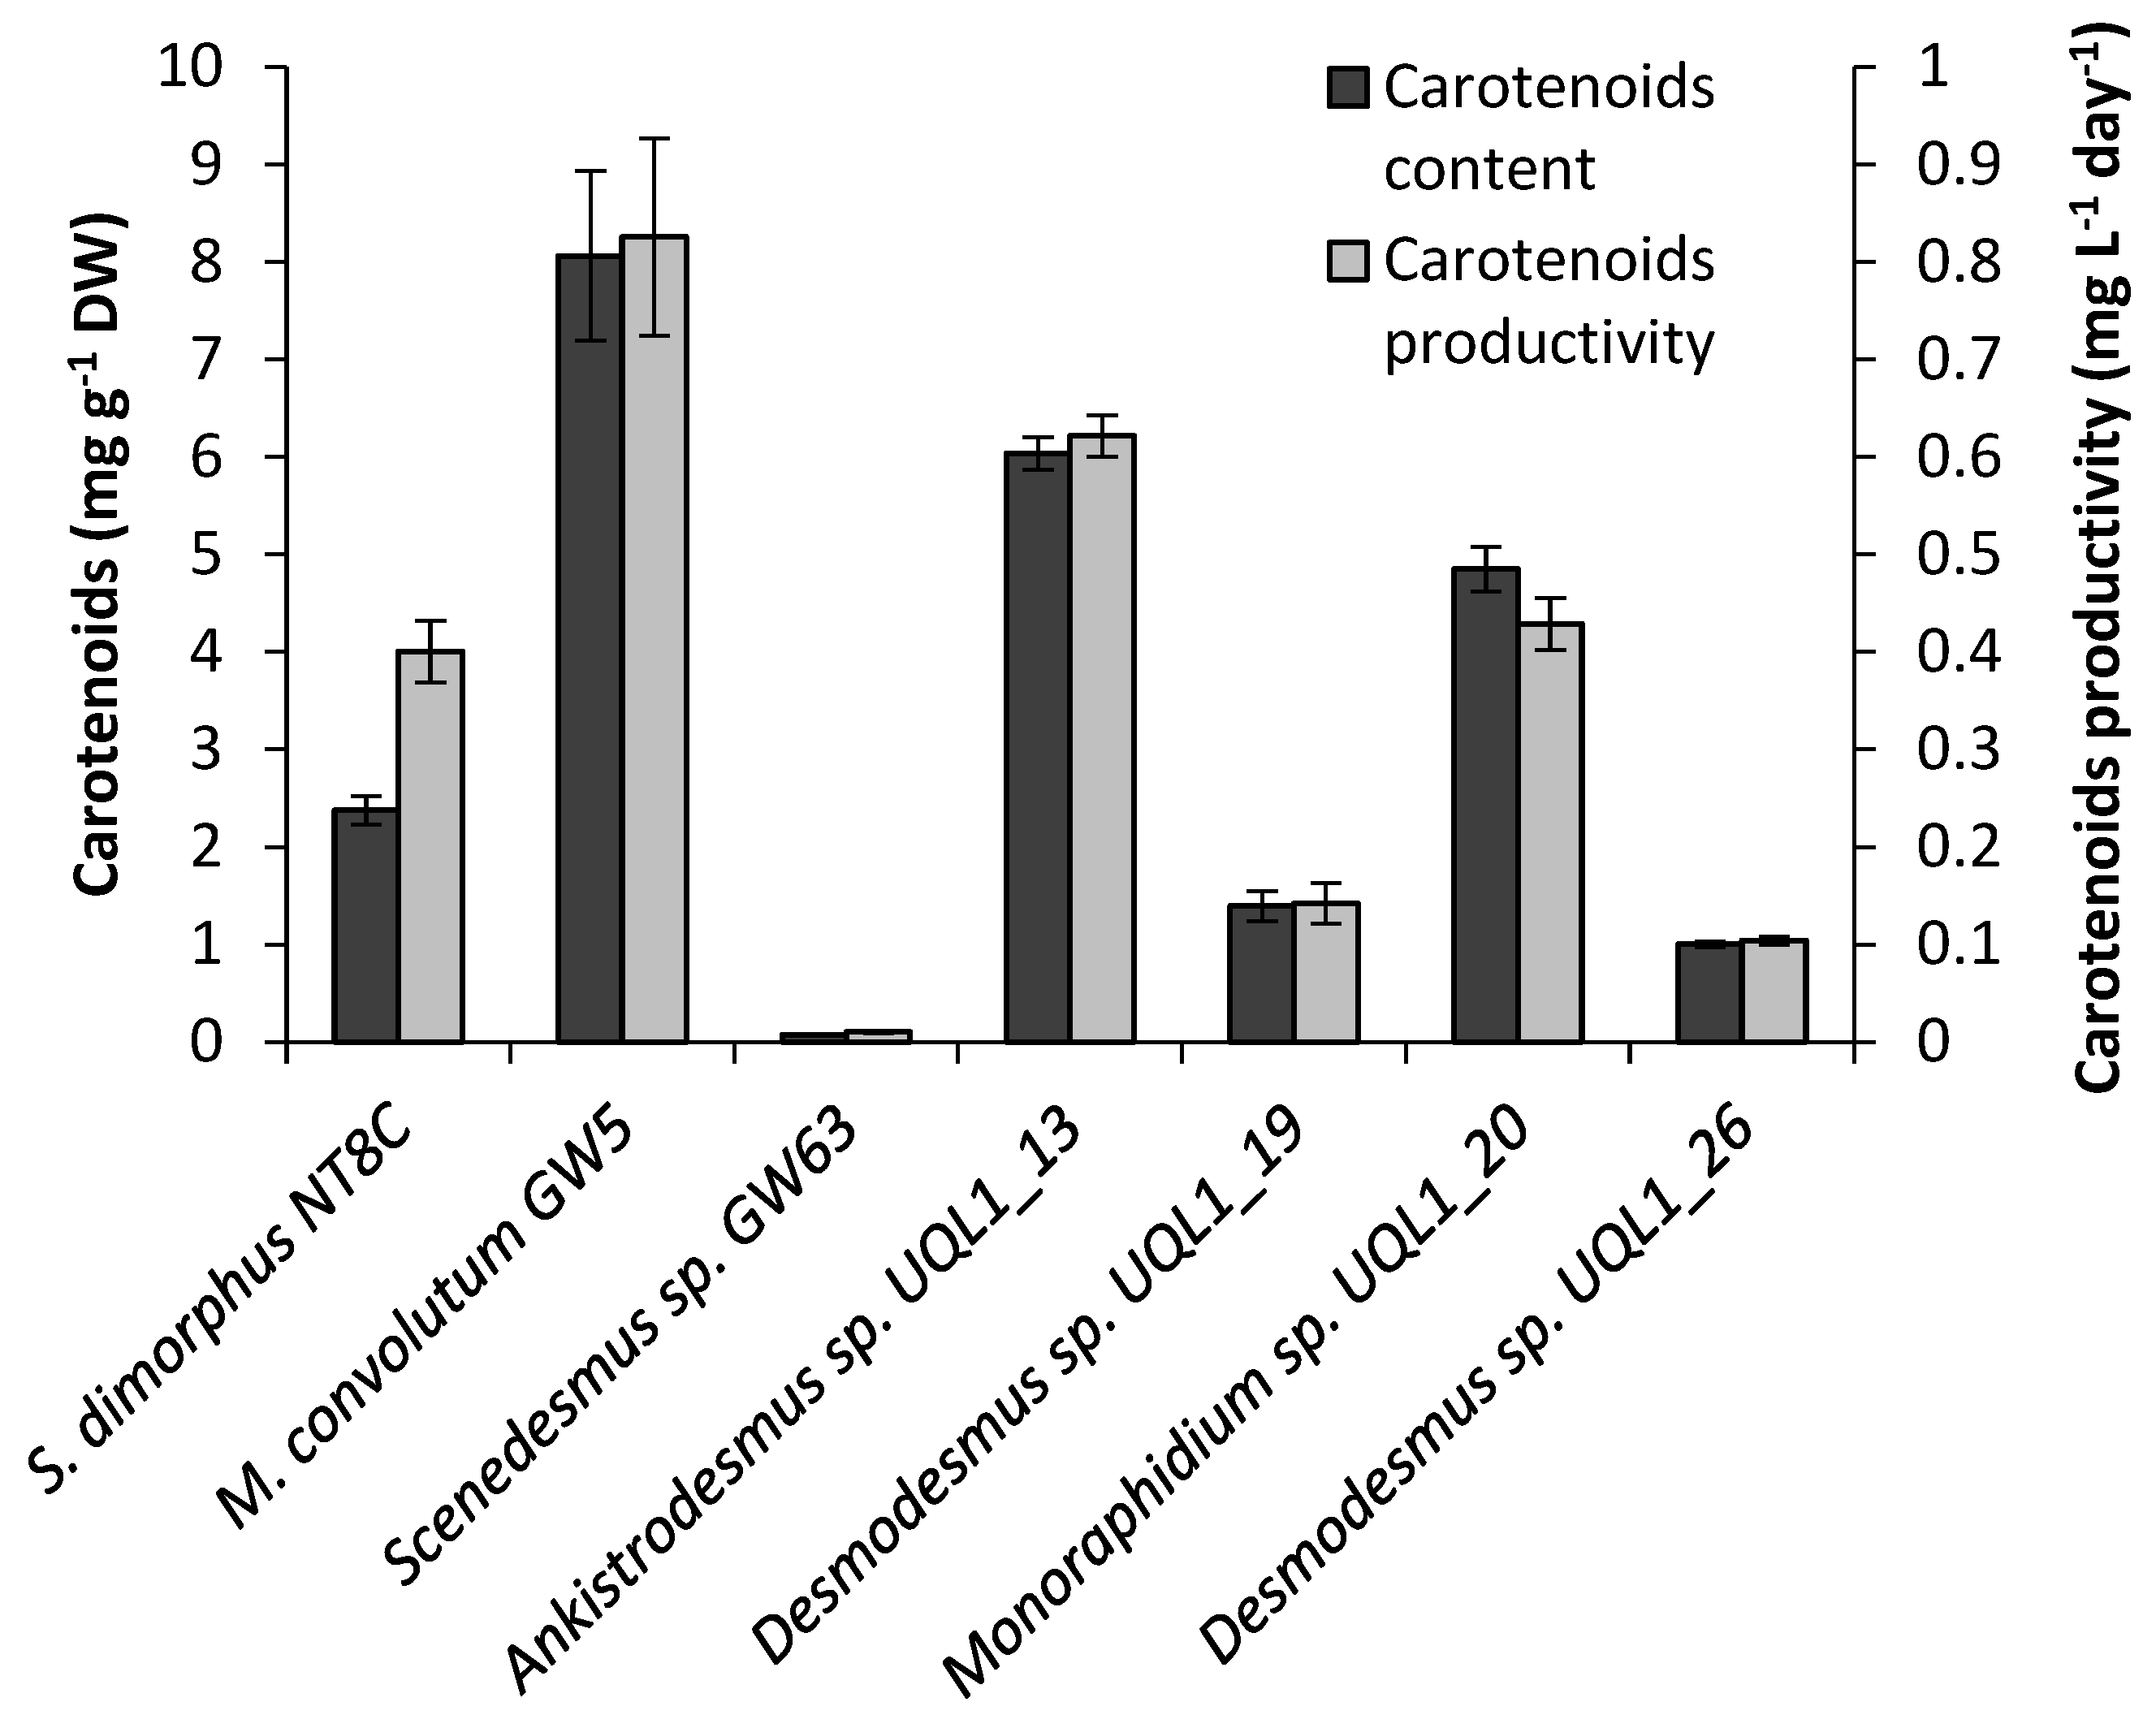
3.5. Total Carotenoid Content

Striking variation (ranging from 0.1 to 8.1 mg g−1 DW) of the total carotenoid content was found across the studied strains (Figure 6). M. convolutum GW5 accumulated the largest amount of carotenoids (8.1 mg g−1 DW), followed by Ankistrodesmus sp. UQL1_13 (6.0 mg g−1 DW) and Monoraphidium sp. UQL1_20 (4.9 mg g−1 DW). Scenedesmus sp. GW63 had the lowest content of carotenoids (0.1 mg g−1 DW), followed by Desmodesmus sp. UQL1_26 (1.0 mg g−1 DW). M. convolutum GW5 had the highest carotenoid productivity (0.8 mg L−1 day−1), which was up to 694.6% greater than that of Scenedesmus sp. GW63 and Desmodesmus sp. UQL1_26, and 106.0% greater than that of S. dimorphus NT8C.

4. Discussion

4.1. Sample Collection, Isolation, Identification and Selection of Microalgal Strains

Selecting suitable local microalgal strains is a fundamental step for achieving reliable and feasible commercial production of bioproducts. It requires algae to produce the desired biocompounds under the local environmental conditions of which large-scale cultivation is envisaged [44]. Thus, the habitat-centered collection strategy [45] was adopted in the hope that these algae are better adapted and resilient to local conditions. In the present study, microalgae were collected from local sites with suboptimal conditions, and subsequently isolated and identified. The choice of these sites was driven by the notion that aquatic environments with fluctuating and at times extreme conditions provide the best habitats for both, fast-growing, opportunistic as well as resilient microalgae. In our study, variable conditions included fluctuating salinity, temperature, and nutrient availability. A rapid isolation protocol was combined with initial screening and standardized productivity assays that enable direct comparisons between strains as well as benchmarking to previously characterized strains (Scenedesmus dimorphus NT8C in our study). In this assay, parameters, such as light irradiation, cultivation time and temperature were kept constant. While this led to the rapid identification of local high-performing strains for various applications, it should be considered that the standardized assay is not optimized for each strain. It therefore serves as a decision tool to select microalgae for large-scale cultivation, rather than providing definite answers on which strains can be used commercially under fully-optimized conditions. Growth optimization, large-scale cultivation and stimulation of biosynthesis of various valuable compounds, such as carotenoids, will still be required. Nevertheless, the most critical issues (rapid growth in commercial fertilizer, high compound productivity, and cost-effective harvesting by settling) have been addressed by the current study.
Partial sequence of the 18S rRNA gene is a widely accepted and commonly used approach in microalgae identification [46,47,48,49]. However, the analyses of sequence, phylogeny and morphology were inconclusive to identify all microalgal strains to the species level in this study. Resolution and reconstruction of relationships at the species level is rather limited due to the high conservation of the 18S rRNA gene [43,48,50], and the fact that small subunit ribosomal (SSU) RNA often underestimates the true number of species in planktonic microalgae [48,50]. Although the majority of microalgae taxa are described based on morphological taxonomy, species identification remains challenging, due to the difficulty of observing specific morphological characteristics and the morphological variations at different life stages [51]. In addition, phenotypic plasticity caused by environmental conditions [52] and genotypic differences have been reported in many microalgae [53,54]. The studied taxa Monoraphidium, Ankistrodesmus and Kirchneriella formed a monophyletic clade within Chlorophyceae, but interestingly, two Monoraphidium spp., (M. convolutum GW5 and Monoraphidium sp. UQL1_20) did not form a distinct clade. This finding supports the view of Fawley et al. [55], and Krienitz et al. [47,56], where species of the family Selenastraceae under existing taxonomic criteria display a polyphyletic nature. Further analyses using a combination of morphological characteristics, including ultrastructure [46,47,51] and DNA sequence including the internal transcribed spacer 2 (ITS2) rDNA, which has higher substitution rates in comparing with 18S rRNA gene [43,47,48,50,56], are required for discrimination of algal species.

4.2. Cultivation and Growth

Rapid growth rate and high biomass productivity are key desirable characteristics in selecting microalgae for cost-effective commercial cultivation [44]. The standard growth experiment under unoptimized laboratory conditions [2] was used to establish and compare growth rates, biomass productivity, and biochemical contents of seven microalgal strains in this study. Overall, the average growth rate (ranged from 0.28 to 0.60 day−1) was comparable to, or greater than those recorded in other studies [57,58,59,60], aside from M. convolutum [61] and S. dimorphus NT8C [34]. S. dimorphus NT8C is a fast growing and easily harvested alga with a wide range of temperature tolerance. The average growth rate of Ankistrodesmus sp. UQL1_13, Desmodesmus sp. UQL1_19, and Monoraphidium sp. UQL1_20 was found to be higher than S. dimorphus NT8C. However, as shown in this study and previous literature [62,63,64], fast growth rates do not necessarily represent high biomass productivities. The largest biomass producer Scenedesmus sp. GW63 was shown to produce 18.9% more biomass than S. dimorphus NT8C. The highest biomass productivity (0.25 to 0.44 g L−1 day−1) was achieved during nutrient depletion where high biomass density was accumulated, despite the lack of CO2 supply, prolonged photoperiods, and high nitrogen availability. This is in the median or upper range compared to the estimated average microalgae biomass productivity of 0.18 g L−1 day−1 found by Griffiths and Harrison [35] and Rodolfi et al. [3]; previous studies of the same species ranged from 0.01 to 0.26 g L−1 day−1 [3,14,34,59,60,65], and current commercialized freshwater species Chlorella vulgaris ranged from 0.01 to 0.73 g L−1 day−1 [3,14,28,35,64], and Spirulina maxima ranged from 0.21 to 0.25 g L−1 day−1 [14,66].
Genotypic differences and phenotypic plasticity between strains and species may be causing variation in algae growth [67]. In fact, it is important to consider that cultivation conditions such as light, nutrients, temperature, growth phase, and even culture senescence (aging) have substantial impact on growth and biochemical content of algae [68,69]. Nitrate concentration used in commercial agricultural fertilizer medium in this study was low compared to other commonly used culturing media for green algae such as BBM (Bold’s Basal Medium, [70]) and BG-11 [71]. Increased initial nitrogen concentrations have been associated with increases in growth rate [2,72,73]. Light intensity is not likely to be a limiting factor for growth and biomass production at a small scale when cell densities are low [2] and individual cells receive the optimal irradiance [74]. Nevertheless, the LED lights used in this study are more effective in energy conversion of photosynthesis and therefore might have increased algae growth rate and biomass productivity [68].

4.3. Fatty Acid Content and Composition

Identifying the content and composition of fatty acids are critical for evaluating the potential of microalgae for human and animal nutrition [75,76]. The overall TFA content of the examined algae (11.7 to 15.9% DW) was higher than in the commercially important species Spirulina platensis (4.8% DW) [76] and certain strains of C. vulgaris (6.1–7.6% DW) [27,76], aquaculture feed species Chaetoceros muelleri (3.5–5.9% DW) [2,77], Isochrysis sp. (3.9–4.0% DW) [2,78], Pavlova salina (1.2–9.9% DW) [2,77], and the oleaginous alga Botryococcus braunii (5.9% DW) [64], but lower than Nannochloropsis oculata (26.7% DW) [27].
Overall, the investigated strains had fatty acid profiles characterized by relative low proportions of SFA (21.0–31.8% of TFA) and MUFA (28.5–35.4% of TFA) and high proportions of PUFA (33.0–41.6% of TFA). The dominant fatty acids were C16:0, C18:1(n-9) and C18:3(n-3) which is typical for green freshwater algae [69]. The investigated strains also had moderate or relative high proportions of omega-3 PUFA (22.0–31.2% of TFA) compared to other species such as Scenedesmus quadricauda (5.4% of TFA) [26], C. vulgaris (26.1% of TFA) [76], but lower than C. muelleri (32.4% of TFA) and P. salina (61.3% of TFA) [77]. The predominant omega-3 PUFA was ALA C18:3(n-3) which is considered essential for human nutrition and has benefits for cardiovascular diseases, liver function and can redistribute body fat in animals [79]. Furthermore, the here investigated microalgae had extremely low n-6/n-3 ratios (0.3–0.6), which makes them ideal for health and nutrition, as the typical Western diet is characterized by too high n-6/n-3 ratios [80,81] and therefore has been associated with cancer, and cardiovascular, inflammatory and autoimmune diseases [82]. While ALA is a precursor for EPA and DHA [83], the synthesis efficiency in animals and humans is generally low and additional intake of EPA and DHA is recommended [84]. Overall, the high contents of PUFA, and specifically omega-3 PUFA with associated low n-6/n-3 ratios and coupled with relatively low contents of SFA found in seven microalgae in this study are ideal for human and animal nutrition. However, the fatty acid content and composition of microalgae varied between species and strains, and these can also be strongly influenced by culture conditions such as light, nutrients, temperature and growth phase [69]. Nitrogen limitation is the major stimulus of FA accumulation and composition [69]. While this may increase the total FA content by increasing the SFA and MUFA content [3], the reduction in biomass productivity [3] and the PUFA content might not be desirable for omega-3 PUFA production [2].
While the content of TFA and the FA compositions are important selection criteria for oil-producing microalgae, of particular importance is the biomass productivity and the associated FA productivity, as this determines the final FA production in a culture system. The highest FA productivity was found in Scenedesmus sp. GW63 (32.6 mg L−1 day−1), which not only accumulated more FA than those of Ankistrodesmus sp. UQL1_13 (32.2 mg L−1 day−1) and S. dimorphus NT8C (30.8 mg L−1 day−1), but also had a high quality of FA with a low SFA content and a high PUFA content. This FA productivity is in the upper range of other commercial microalgae such as C. vulgaris (12.6–15.6 mg L−1 day−1), Spirulina sp. (approximately 4 mg L−1 day−1) [85], Isochrysis sp. (6.4–21.1 mg L−1 day−1, lipid productivity), and Nannochloropsis sp. (4.6–20.0 mg L−1 day−1, lipid productivity) [62]. In addition, the high content of total omega-3 PUFA (28.5% of TFA) and the essential PUFA ALA (20.0% of TFA), and the very low n-6/n-3 ratio (0.4) make Scenedesmus sp. GW63 a good choice for producing FA-rich biomass with high nutritional and health value for nutraceuticals, food, and livestock feed applications for species with the ability to bioconvert ALA into EPA and/or DHA. Subsequent enhancement of FA content and desired composition in this strain with special focus on omega-3 PUFA content and especially ALA content should be achieved through manipulations of culturing conditions [86].

4.4. Total Protein Content

Green algae have a high quantity of protein, with typical yields between 10 and 30% DW [87]. The crude protein content of microalgae evaluated in this study is within this range. The protein value of Desmodesmus sp. UQL1_26, Desmodesmus sp. UQL1_19, Monoraphidium sp. UQL1_20, Ankistrodesmus sp. UQL1_13 was found to be over 30% DW, which was almost twice the amount of those found in S. dimorphus NT8C (17.8% DW). Moreover, these top four protein producers exceeded the 20% DW protein supplement baseline set by the Ontario Ministry of Agriculture and Food for animal feeds [76,88]. Notably, the overall protein contents obtained in the present study were lower than those reported previously for the same species [26,34,65,76], apart from Monoraphidium sp. [89]. Not surprisingly, varied previous studies on commercial species C. vulgaris and Spirulina sp. also showed comparably lower values than the ones commonly reported [29,76,85]. Key cultivational attributes of microalgae that contribute to its protein production—light intensity and photoperiod [26,90], growth phase [14], nutrient availability [18]—are crucial considerations when evaluating protein content from different studies. In addition, some of the variability in protein content was driven by different analytical methods [22,76,91]. For example, the commonly used Kjeldahl method overestimates the protein content in microalgae with the nitrogen to protein conversion factor of 6.25 [22,91].
Nevertheless, protein content is a critical factor determining the nutritional value of microalgae in human diet, animal livestock feed, and aquaculture nutrition [16,92]. The world’s most prominent commercial alga Spirulina is utilized in human nutrition due to its high protein content and other nutritive values, such as the presence of vitamins. It is renowned for improving several health conditions such as hyperlipidaemia, hypertension [16], anaemia, and immune function [76]. Microalgal biomass is also proven to be suitable for animal feed supplement [15,16,21] and about 30% of global production is currently sold for this application [15]. It can be used as partial replacement for conventional protein such as soybean and fish meal in livestock feeds [16,21]. Overall, Desmodesmus sp. UQL1_26 has the highest potential to be used for protein production as feed and nutrition supplement, due to its high protein content (33.4% of DW; Figure 5), productivity, and fast settling. Furthermore, it is capable of withstanding harsh environmental conditions and forms protective eight-celled colonies to avoid predation from small-sized grazers [52]. These features suggest that Desmodesmus sp. UQL1_26 is likely to be a reliable competitive strain when cultivated in mass outdoor open systems. To further investigate the nutritional quality of protein, the content and quantity of individual amino acids, especially essential amino acids, should be analyzed and compared to FAO/WHO guidelines [21]. Mutagenesis of promising microalgal strains can also lead to further protein contents. For example, a 60% increase in protein content (to 48.7% of DW) has been reported recently for a Chlorella vulgaris mutant with reduced chlorophyll contents when grown heterotrophically [93].

4.5. Total Carotenoid Content

Microalgae are also good sources of carotenoids, with an average content of 0.1 to 0.2% DW [16,21]. The overall carotenoid content of the here investigated strains (0.1 to 0.8% DW) are similar to, or higher than this average value, aside from Scenedesmus sp. GW63 (0.01% DW). The carotenogenic strain M. convolutum GW5 was capable of accumulating 0.8% DW carotenoids without further stress induction. This value is greater than those in commonly reported species Scenedesmus obliquus (0.3% DW) and aquaculture feed species C. muelleri (0.4% DW), Isochrysis galbana (0.5% DW), Tetraselmis suecica (0.6% DW), Pavlova salina (0.5% DW) [30,77], the commercial alga C. vulgaris (0.01–0.1% DW) [23,76], and even the famous β-carotene producer D. salina in some studies (0.7% DW) [30] and the natural astaxanxin source H. pluvialis (0.4% DW) [94]. However, as expected, the carotenoid content of M. convolutum GW5 is still considerable low compared to commercial carotenogenic H. pluvialis and D. salina, which are currently dominating the lucrative carotenoid market [4,16,17]. While these high carotenoid contents of commercial producers are usually achieved under specific stress-induced production, the microalgae presented in this study did not grow under any of the following carotenogenesis conditions: high light intensity (175 µmol photons m−2 s−1), phosphate or sulphate starvation and salt stress (0.8% of NaCl) [95], which might explain their relative low values. However, stress-induced carotenogenesis is likely to reduce algae growth rates [95], biomass productivity [96,97] and therefore increases the production costs [4,17]. In addition, variation in carotenoid content and the extremely low value obtained from Scenedesmus sp. GW63 can be due to the algae cell disruption method used, the pigment–protein binding efficiency [94] and loss of pigments within time [98] in aqueous acetone extraction.
Carotenoid contents and properties, especially its antioxidant activity and pigmentation are critical measurements in determining microalgae’s suitability in the food and feed industry. Carotenoid-rich microalgae can be applied to food products as vitamin supplements, food colorant, nutraceuticals, and functional foods to promote overall health; and as feed additives for poultry, livestock, fish, and crustaceans to enhance coloration and survival [16,21]. Monoraphidium sp. GK12, a similar strain of M. convolutum GW5, has been proposed as a potential astaxanthin producer. In addition, it has been successfully cultivated in large-scale outdoor cultures and trialed in prawn farming for improving prawn pigmentation and survival [57,89]. In summary, M. convolutum GW5 is an attractive strain for carotenoid applications based on its high content of carotenoids (8 mg g1 DW; Figure 6) and the ability to achieve high productivity. Furthermore, it has great potential to be cultivated at a large scale for astaxanthin production as demonstrated by the promising performance of Monoraphidium sp. GK12. Further research on M. convolutum GW5 as a source of valuable carotenoid production will rest on detailed individual carotenoid profiling, quantity and quality optimization of desired pigments through the carotenogenesis process. Recent reports on Chlorella spp. demonstrate that further increases in carotenoid biosynthesis and profile variations can be achieved by mutagenesis and induction by high light irradiation, glucose, NaCl, and nitrogen deficiency [99,100].

5. Conclusions

Using streamlined protocols, this study isolated and identified novel microalgal strains, and assessed their growth, biomass productivity, fatty acid content and composition, protein content, and carotenoid content. The results clearly demonstrate the naturally high growth rates and productivities of multiple promising strains under standardized conditions. In addition, the essential PUFA ALA, together with the very low n-6/n-3 ratio, and the high FA productivity suggested the suitability of Scenedesmus sp. GW63 for the production of high-quality FA oils. The high protein content and productivity, and its unique physiological response to grazers suggest that Desmodesmus sp. UQL1_26 is likely to be a reliable competitive alga when cultivated in mass outdoor open systems for protein-rich foods and feeds. Exceptionally high carotenoid content and productivity of M. convolutum GW5 were identified and highlighted as desirable traits, suggesting that this alga is an ideal candidate for high-value carotenoid production. All these characteristics confirmed great potential of Scenedesmus sp. GW63, Desmodesmus sp. UQL1_26, and M. convolutum GW5 to be exploited commercially for the production of nutraceuticals, functional foods and animal feeds. Furthermore, the combination of these three microalgae in one multi-nutrient supplement would provide add-on health and nutritional advantages, including high levels of quality FA, protein and carotenoids, respectively. Further investigations should be carried out under large-scale outdoor cultivation. Subsequently, future improvements and optimizations of desired biocompounds through manipulation of cultivation conditions, and necessary toxicity tests for these algae to be consumed by humans and animals are required. This study laid the fundamental framework for targeting high-value natural compounds from promising local microalgae for food and feed applications, through careful collection, isolation, and identification of suitable microalgae, and comparisons of biochemical contents under a standard cultivation assay. The streamlined methods are applicable to most other locations to identify high-performing local microalgal strains.

Author Contributions

Conceptualization, S.R.T.-H. and P.M.S.; methodology, B.B.; data analysis, B.B. and S.R.T.-H.; writing—original draft preparation, B.B.; writing—review and editing, S.R.T.-H. and P.M.S.; supervision, S.R.T.-H. and P.M.S.; project administration, P.M.S.; funding acquisition, P.M.S. All authors have read and agreed to the published version of the manuscript.

Funding

This work was funded by Meat & Livestock Australia [B.NBP.0695] and a Moggill Markets Prize.

Institutional Review Board Statement

Not applicable.

Informed Consent Statement

Not applicable.

Data Availability Statement

Data is contained within the article.

Acknowledgments

We would like to thank Stephen Ryan and Cécile Fabre for assistance with experiments. We are also grateful to Björn Gosch and Dorothee Hahne (Metabolomics Australia) for assistance and advice on FAME analyses, and Tom Woods from Woods Grain Pty Ltd. for samples.

Conflicts of Interest

The authors declare no conflict of interest.

References

  1. Guiry, M.D. How many species of algae are there? J. Phycol. 2012, 48, 1057–1063. [Google Scholar] [CrossRef] [PubMed]
  2. Lim, D.K.; Garg, S.; Timmins, M.; Zhang, E.S.; Thomas-Hall, S.R.; Schuhmann, H.; Li, Y.; Schenk, P.M. Isolation and evaluation of oil-producing microalgae from subtropical coastal and brackish waters. PLoS ONE 2012, 7, e40751. [Google Scholar] [CrossRef] [PubMed]
  3. Rodolfi, L.; Chini Zittelli, G.; Bassi, N.; Padovani, G.; Biondi, N.; Bonini, G.; Tredici, M.R. Microalgae for oil: Strain selection, induction of lipid synthesis and outdoor mass cultivation in a low-cost photobioreactor. Biotechnol. Bioeng. 2009, 102, 100–112. [Google Scholar] [CrossRef] [PubMed]
  4. Borowitzka, M.; Moheimani, N. Sustainable biofuels from algae. Mitig. Adapt. Strateg. Glob. Change 2013, 18, 13–25. [Google Scholar] [CrossRef]
  5. Schenk, P.M.; Thomas-Hall, S.R.; Stephens, E.; Marx, U.C.; Mussgnug, J.H.; Posten, C.; Kruse, O.; Hankamer, B. Second generation biofuels: High-efficiency microalgae for biodiesel production. BioEnergy Res. 2008, 1, 20–43. [Google Scholar] [CrossRef]
  6. Khan, S.A.; Rashmi Hussain, M.Z.; Prasad, S.; Banerjee, U.C. Prospects of biodiesel production from microalgae in India. Renew. Sustain. Energy Rev. 2009, 13, 2361–2372. [Google Scholar] [CrossRef]
  7. Wang, B.; Li, Y.; Wu, N.; Lan, C.Q. CO2 bio-mitigation using microalgae. Appl. Microbiol. Biotechnol. 2008, 79, 707–718. [Google Scholar] [CrossRef]
  8. Chisti, Y. Biodiesel from microalgae. Biotechnol. Adv. 2007, 25, 294–306. [Google Scholar] [CrossRef]
  9. Vardon, D.R.; Sharma, B.K.; Scott, J.; Yu, G.; Wang, Z.; Schideman, L.; Zhang, Y.; Strathmann, T.J. Chemical properties of biocrude oil from the hydrothermal liquefaction of Spirulina algae, swine manure, and digested anaerobic sludge. Bioresour. Technol. 2011, 102, 8295–8303. [Google Scholar] [CrossRef] [PubMed]
  10. Mallick, N. Biotechnological potential of immobilized algae for wastewater N, P and metal removal: A review. BioMetals 2002, 15, 377–390. [Google Scholar] [CrossRef]
  11. Borowitzka, M.A. Commercial production of microalgae: Ponds, tanks, tubes and fermenters. J. Biotechnol. 1999, 70, 313–321. [Google Scholar] [CrossRef]
  12. Stolz, P.; Obermayer, B. Manufacturing microalgae for skincare. Cosmet. Toilet. 2005, 120, 99–106. [Google Scholar]
  13. Borowitzka, M. High-value products from microalgae—their development and commercialisation. J. Appl. Phycol. 2013, 25, 743–756. [Google Scholar] [CrossRef]
  14. Mata, T.M.; Martins, A.A.; Caetano, N.S. Microalgae for biodiesel production and other applications: A review. Ren. Sustain. Energy Rev. 2010, 14, 217–232. [Google Scholar] [CrossRef] [Green Version]
  15. Becker, E.W. Micro-algae as a source of protein. Biotechnol. Adv. 2007, 25, 207–210. [Google Scholar] [CrossRef] [PubMed]
  16. Spolaore, P.; Joannis-Cassan, C.; Duran, E.; Isambert, A. Commercial applications of microalgae. J. Biosci. Bioeng. 2006, 101, 87–96. [Google Scholar] [CrossRef] [Green Version]
  17. Milledge, J. Commercial application of microalgae other than as biofuels: A brief review. Rev. Environ. Sci. Bio/Technol. 2011, 10, 31–41. [Google Scholar] [CrossRef]
  18. Hu, Q. Environmental effects on cell composition. In Handbook of Microalgal Culture; Richmond, A., Hu, Q., Eds.; John Wiley & Sons Ltd.: Hoboken, NJ, USA, 2013; pp. 114–122. [Google Scholar]
  19. Adarme-Vega, T.C.; Thomas-Hall, S.R.; Schenk, P.M. Towards sustainable sources for omega-3 fatty acids production. Curr. Opin. Biotechnol. 2014, 26, 14–18. [Google Scholar] [CrossRef]
  20. Adarme-Vega, T.; Lim, D.K.; Timmins, M.; Vernen, F.; Li, Y.; Schenk, P.M. Microalgal biofactories: A promising approach towards sustainable omega-3 fatty acid production. Microb. Cell Factories 2012, 11, 96. [Google Scholar] [CrossRef] [PubMed] [Green Version]
  21. Becker, E.W. Microalgae for human and animal nutrition. In Handbook of Microalgal Culture; Richmond, A., Hu, Q., Eds.; John Wiley & Sons Ltd.: Hoboken, NJ, USA, 2013; pp. 461–503. [Google Scholar]
  22. Lopez, C.V.; Garcia Mdel, C.; Fernandez, F.G.; Bustos, C.S.; Chisti, Y.; Sevilla, J.M. Protein measurements of microalgal and cyanobacterial biomass. Bioresour. Technol. 2010, 101, 7587–7591. [Google Scholar] [CrossRef]
  23. Guedes, A.C.; Amaro, H.M.; Malcata, F.X. Microalgae as sources of carotenoids. Mar. Drugs 2011, 9, 625–644. [Google Scholar] [CrossRef]
  24. Jin, E.; Polle, J.E.; Hong, K.L.; Sang, M.H.; Chang, M. Xanthophylls in microalgae: From biosynthesis to biotechnological mass production and application. J. Microbiol. Biotechnol. 2013, 13, 165–174. [Google Scholar]
  25. Lorenz, R.T.; Cysewski, G.R. Commercial potential for Haematococcus microalgae as a natural source of astaxanthin. Trends Biotechnol. 2000, 18, 160–167. [Google Scholar] [CrossRef]
  26. Renaud, S.M.; Thinh, L.-V.; Parry, D.L. The gross chemical composition and fatty acid composition of 18 species of tropical Australian microalgae for possible use in mariculture. Aquaculture 1999, 170, 147–159. [Google Scholar] [CrossRef]
  27. Islam, M.; Magnusson, M.; Brown, R.; Ayoko, G.; Nabi, M.; Heimann, K. Microalgal species selection for biodiesel production based on fuel properties derived from fatty acid profiles. Energies 2013, 6, 5676–5702. [Google Scholar] [CrossRef] [Green Version]
  28. Lang, I.; Hodac, L.; Friedl, T.; Feussner, I. Fatty acid profiles and their distribution patterns in microalgae: A comprehensive analysis of more than 2000 strains from the SAG culture collection. BMC Plant Biol. 2011, 11, 124. [Google Scholar] [CrossRef] [PubMed] [Green Version]
  29. Batista, A.P.; Gouveia, L.; Bandarra, N.M.; Franco, J.M.; Raymundo, A. Comparison of microalgal biomass profiles as novel functional ingredient for food products. Algal Res. 2013, 2, 164–173. [Google Scholar] [CrossRef] [Green Version]
  30. Ahmed, F.; Fanning, K.; Netzel, M.; Turner, W.; Li, Y.; Schenk, P.M. Profiling of carotenoids and antioxidant capacity of microalgae from subtropical coastal and brackish waters. Food Chem. 2014, 165, 300–306. [Google Scholar] [CrossRef] [PubMed] [Green Version]
  31. Guillard, R.R.L.; Ryther, J.H. Studies of marine planktonic diatoms: I. Cyclotella nana Hustedt, and Dectonula confervacea (Cleve) Gran. Can. J. Microbiol. 1962, 8, 229–239. [Google Scholar] [CrossRef]
  32. Duong, V.T.; Li, Y.; Nowak, E.; Schenk, P.M. Microalgae isolation and selection for prospective biodiesel production. Energies 2012, 5, 1835–1849. [Google Scholar] [CrossRef]
  33. Duong, V.T.; Bao, B.; Schenk, P.M. Oleaginous microalgae isolation and screening for lipid productivity using a standard protocol. In Hydrocarbon and Lipid Microbiology Protocols; McGenity, T.J., Timmis, K.N., Nogales Fernández, B., Eds.; Springer: Berlin/Heidelberg, Germany, 2015. [Google Scholar]
  34. Duong, V.T.; Ahmed, F.; Thomas-Hall, S.R.; Quigley, S.; Nowak, E.; Schenk, P.M. High protein- and high lipid-producing microalgae from northern australia as potential feedstock for animal feed and biodiesel. Front. Bioeng. Biotechnol. 2015, 3, 53. [Google Scholar] [CrossRef] [PubMed] [Green Version]
  35. Griffiths, M.; Harrison, S.L. Lipid productivity as a key characteristic for choosing algal species for biodiesel production. J. Appl. Phycol. 2009, 21, 93–507. [Google Scholar] [CrossRef]
  36. Wood, A.M.; Everroad, R.C.; Wingard, L.M. Measuring growth rates in microalgal cultures. In Algal Culturing Techniques; Andersen, R.A., Ed.; Elsevier Academic Press: Burlington, MA, USA, 2005; pp. 269–285. [Google Scholar]
  37. Nei, M.; Kumar, S. Molecular Evolution and Phylogenetics; Oxford University Press: New York, NY, USA, 2000. [Google Scholar]
  38. Tamura, K.; Peterson, D.; Peterson, N.; Stecher, G.; Nei, M.; Kumar, S. MEGA5: Molecular evolutionary genetics analysis using maximum likelihood, evolutionary distance, and maximum parsimony methods. Mol. Biol. Evol. 2011, 28, 2731–2739. [Google Scholar] [CrossRef] [Green Version]
  39. Hall, B.G. Building phylogenetic trees from molecular data with MEGA. Mol. Biol. Evol. 2013, 30, 1229–1235. [Google Scholar] [CrossRef] [Green Version]
  40. Lowry, O.H.; Rosebrough, N.J.; Farr, A.L.; Randall, R.J. Protein measurement with the Folin phenol reagent. J. Biol. Chem. 1951, 193, 265–275. [Google Scholar] [CrossRef]
  41. Huang, J.J.; Cheung, P.C. +UVA treatment increases the degree of unsaturation in microalgal fatty acids and total carotenoid content in Nitzschia closterium (Bacillariophyceae) and Isochrysis zhangjiangensis (Chrysophyceae). Food Chem. 2011, 129, 783–791. [Google Scholar] [CrossRef]
  42. Porra, R.; Thompson, W.; Kriedemann, P. Determination of accurate extinction coefficients and simultaneous equations for assaying chlorophylls a and b extracted with four different solvents: Verification of the concentration of chlorophyll standards by atomic absorption spectroscopy. Biochim. Biophys. Acta 1989, 975, 384–394. [Google Scholar] [CrossRef]
  43. An, S.S.; Friedl, T.; Hegewald, E. Phylogenetic relationships of Scenedesmus and Scenedesmus-like coccoid green algae as Inferred from ITS-2 rDNA sequence comparisons. Plant Biol. 1999, 1, 418–428. [Google Scholar] [CrossRef]
  44. Borowitzka, M. Species and strain selection. In Developments in Applied Phycology; Borowitzka, M.A., Moheimani, N.R., Eds.; Springer: Dordrecht, The Netherlands, 2013; Volume 5, pp. 77–89. [Google Scholar]
  45. Barclay, W.; Apt, K. Strategies for bioprospecting microalgae for potential commercial applications. In Handbook of Microalgal Culture; Richmond, A., Hu, Q., Eds.; John Wiley & Sons Ltd.: Hoboken, NJ, USA, 2013; pp. 69–79. [Google Scholar]
  46. Friedl, T.; O’Kelly, C.J. Phylogenetic relationships of green algae assigned to the genus Planophila (Chlorophyta): Evidence from 18S rDNA sequence data and ultrastructure. Eur. J. Phycol. 2002, 37, 373–384. [Google Scholar] [CrossRef]
  47. Krienitz, L.; Bock, C.; Nozaki, H.; Wolf, M. SSU rRNA gene phylogeny of morphospecies affiliated to the bioassay alga “Selenastrum capricornutum” recovered the polyphyletic origin of crescent-shaped Chlorophyta. J. Phycol. 2011, 47, 880–893. [Google Scholar] [CrossRef]
  48. Leliaert, F.; Verbruggen, H.; Vanormelingen, P.; Steen, F.; López-Bautista, J.M.; Zuccarello, G.C.; De Clerck, O. DNA-based species delimitation in algae. Eur. J. Phycol. 2014, 49, 179–196. [Google Scholar] [CrossRef] [Green Version]
  49. Moon-van der Staay, S.Y.; De Wachter, R.; Vaulot, D. Oceanic 18S rDNA sequences from picoplankton reveal unsuspected eukaryotic diversity. Nature 2001, 409, 607–610. [Google Scholar] [CrossRef]
  50. Piganeau, G.; Eyre-Walker, A.; Grimsley, N.; Moreau, H. How and why DNA barcodes underestimate the diversity of microbial eukaryotes. PLoS ONE 2011, 6, e16342. [Google Scholar] [CrossRef] [PubMed]
  51. Andersen, R.A. The microalgal cell. In Handbook of Microalgal Culture; Richmond, A., Hu, Q., Eds.; John Wiley & Sons Ltd.: Hoboken, NJ, USA, 2013; pp. 1–20. [Google Scholar]
  52. Lürling, M. Phenotypic plasticity in the green algae Desmodesmus and Scenedesmus with special reference to the induction of defensive morphology. Ann. Limnol. Int. J. Limnol. 2009, 39, 85–101. [Google Scholar] [CrossRef] [Green Version]
  53. Alpermann, T.J.; Tillmann, U.; Beszteri, B.; Cembella, A.D.; John, U. Phenotypic variation and genotypic diversity in a planktonic population of the toxigenic marine dinoflagellate Alexandrium tamarense (Dinophyceae). J. Phycol. 2010, 46, 18–32. [Google Scholar] [CrossRef] [Green Version]
  54. Luo, W.; Pflugmacher, S.; Proschold, T.; Walz, N.; Krienitz, L. Genotype versus phenotype variability in Chlorella and Micractinium (Chlorophyta, Trebouxiophyceae). Protist 2006, 157, 315–333. [Google Scholar] [CrossRef]
  55. Fawley, M.W.; Dean, M.L.; Dimmer, S.K.; Fawley, K.P. Evaluating the Morphospecies Concept in the Selenastraceae (Chlorophyceae, Chlorophyta)1. J. Phycol. 2005, 42, 142–154. [Google Scholar] [CrossRef]
  56. Krienitz, L.; Ustinova, I.; Friedl, T.; Huss, V.A.R. Traditional generic concepts versus 18S rRNA gene phylogeny in the green algal family selenastraceae (chlorophyceae, chlorophyta). J. Phycol. 2001, 37, 852–865. [Google Scholar] [CrossRef] [Green Version]
  57. Fujii, K.; Nakajima, H.; Anno, Y. Potential of Monoraphidium sp. GK12 for energy-saving astaxanthin production. J. Chem. Technol. Biotechnol. 2008, 83, 1578–1584. [Google Scholar] [CrossRef]
  58. Ruangsomboon, S.; Ganmanee, M.; Choochote, S. Effects of different nitrogen, phosphorus, and iron concentrations and salinity on lipid production in newly isolated strain of the tropical green microalga, Scenedesmus dimorphus KMITL. J. Appl. Phycol. 2012, 25, 867–874. [Google Scholar] [CrossRef]
  59. Vidyashankar, S.; Deviprasad, K.; Chauhan, V.S.; Ravishankar, G.A.; Sarada, R. Selection and evaluation of CO2 tolerant indigenous microalga Scenedesmus dimorphus for unsaturated fatty acid rich lipid production under different culture conditions. Bioresour. Technol. 2013, 144, 28–37. [Google Scholar] [CrossRef]
  60. Yu, X.; Zhao, P.; He, C.; Li, J.; Tang, X.; Zhou, J.; Huang, Z. Isolation of a novel strain of Monoraphidium sp. and characterization of its potential application as biodiesel feedstock. Bioresour. Technol. 2012, 121, 256–262. [Google Scholar] [CrossRef]
  61. Radzun, K.A.; Wolf, J.; Jakob, G.; Zhang, E.; Stephens, E.; Ross, I.; Hankamer, B. Automated nutrient screening system enables high-throughput optimisation of microalgae production conditions. Biotechnol. Biofuels 2015, 8, 65. [Google Scholar] [CrossRef] [PubMed] [Green Version]
  62. Huerlimann, R.; de Nys, R.; Heimann, K. Growth, lipid content, productivity, and fatty acid composition of tropical microalgae for scale-up production. Biotechnol. Bioeng. 2010, 107, 245–257. [Google Scholar] [CrossRef] [PubMed]
  63. Lawton, R.J.; de Nys, R.; Paul, N.A. Selecting reliable and robust freshwater macroalgae for biomass applications. PLoS ONE 2013, 8, e64168. [Google Scholar] [CrossRef] [PubMed]
  64. Nascimento, I.A.; Marques, S.S.I.; Cabanelas, I.T.D.; Pereira, S.A.; Druzian, J.I.; de Souza, C.O.; Vich, D.V.; de Carvalho, G.C.; Nascimento, M.A. Screening microalgae strains for biodiesel production: Lipid productivity and estimation of fuel quality aased on fatty acids profiles as selective criteria. BioEnergy Res. 2012, 6, 1–13. [Google Scholar] [CrossRef]
  65. Voltolina, D.; Cordero, B.; Nieves, M.; Soto, L.P. Growth of Scenedesmus sp. in artificial wastewater. Bioresour. Technol. 1999, 68, 265–268. [Google Scholar] [CrossRef]
  66. Gouveia, L.; Oliveira, A.C. Microalgae as a raw material for biofuels production. J. Ind. Microbiol. Biotechnol. 2009, 36, 269–274. [Google Scholar] [CrossRef]
  67. Via, S.; Lande, R. Genotype-environment interaction and the evolution of phenotypic plasticity. Evolution 1985, 39, 505–522. [Google Scholar] [CrossRef]
  68. Chen, C.Y.; Yeh, K.L.; Aisyah, R.; Lee, D.J.; Chang, J.S. Cultivation, photobioreactor design and harvesting of microalgae for biodiesel production: A critical review. Bioresour. Technol. 2011, 102, 71–81. [Google Scholar] [CrossRef]
  69. Hu, Q.; Sommerfeld, M.; Jarvis, E.; Ghirardi, M.; Posewitz, M.; Seibert, M.; Darzins, A. Microalgal triacylglycerols as feedstocks for biofuel production: Perspectives and advances. Plant J. 2008, 54, 621–639. [Google Scholar] [CrossRef]
  70. Bischoff, H.W.; Bold, H.C. Some Soil Algae from Enchanted Rock and Related Algal Species; University of Texas: Austin, TX, USA, 1963; Volume 4. [Google Scholar]
  71. Allen, M.M.; Stanier, R.Y. Growth and division of some unicellular blue-green algae. J. Gen. Microbiol. 1968, 51, 199–202. [Google Scholar] [CrossRef] [Green Version]
  72. Chen, M.; Tang, H.; Ma, H.; Holland, T.C.; Ng, K.Y.; Salley, S.O. Effect of nutrients on growth and lipid accumulation in the green algae Dunaliella tertiolecta. Bioresour. Technol. 2011, 102, 1649–1655. [Google Scholar] [CrossRef]
  73. Samori, G.; Samori, C.; Guerrini, F.; Pistocchi, R. Growth and nitrogen removal capacity of Desmodesmus communis and of a natural microalgae consortium in a batch culture system in view of urban wastewater treatment: Part I. Water Res. 2013, 47, 791–801. [Google Scholar] [CrossRef]
  74. Richmond, A. Biological Principles of Mass Cultivation of Photoautotrophic Microalgae. In Handbook of Microalgal Culture; Richmond, A., Ed.; John Wiley & Sons Ltd.: Hoboken, NJ, USA, 2013; pp. 169–204. [Google Scholar]
  75. Gosch, B.J.; Magnusson, M.; Paul, N.A.; de Nys, R. Total lipid and fatty acid composition of seaweeds for the selection of species for oil-based biofuel and bioproducts. GCB Bioenergy 2012, 4, 919–930. [Google Scholar] [CrossRef] [Green Version]
  76. Kent, M.; Welladsen, H.M.; Mangott, A.; Li, Y. Nutritional evaluation of Australian microalgae as potential human health supplements. PLoS ONE 2015, 10, e0118985. [Google Scholar] [CrossRef]
  77. Martínez-Fernández, E.; Acosta-Salmón, H.; Southgate, P.C. The nutritional value of seven species of tropical microalgae for black-lip pearl oyster (Pinctada margaritifera, L.) larvae. Aquaculture 2006, 257, 491–503. [Google Scholar] [CrossRef]
  78. Patil, V.; Källqvist, T.; Olsen, E.; Vogt, G.; Gislerød, H.R. Fatty acid composition of 12 microalgae for possible use in aquaculture feed. Aquacult. Int. 2006, 15, 1–9. [Google Scholar] [CrossRef]
  79. Poudyal, H.; Panchal, S.K.; Waanders, J.; Ward, L.; Brown, L. Lipid redistribution by alpha-linolenic acid-rich chia seed inhibits stearoyl-CoA desaturase-1 and induces cardiac and hepatic protection in diet-induced obese rats. J. Nutr. Biochem. 2012, 23, 153–162. [Google Scholar] [CrossRef] [PubMed]
  80. Dubois, V.; Breton, S.; Linder, M.; Fanni, J.; Parmentier, M. Fatty acid profiles of 80 vegetable oils with regard to their nutritional potential. Eur. J. Lipid Sci. Technol. 2007, 109, 710–732. [Google Scholar] [CrossRef]
  81. Martins, D.A.; Custodio, L.; Barreira, L.; Pereira, H.; Ben-Hamadou, R.; Varela, J.; Abu-Salah, K.M. Alternative sources of n-3 long-chain polyunsaturated fatty acids in marine microalgae. Mar. Drugs 2013, 11, 2259–2281. [Google Scholar] [CrossRef] [PubMed] [Green Version]
  82. Simopoulos, A.P. The importance of the omega-6/omega-3 fatty acid ratio in cardiovascular disease and other chronic diseases. Exp. Biol. Med. 2008, 233, 674–688. [Google Scholar] [CrossRef]
  83. Bell, M.; Tocher, D. Biosynthesis of polyunsaturated fatty acids in aquatic ecosystems: General pathways and new direction. In Lipids in Aquatic Ecosystems; Kainz, M., Brett, M.T., Arts, M.T., Eds.; Springer: New York, NY, USA, 2009; pp. 211–236. [Google Scholar]
  84. Hempel, N.; Petrick, I.; Behrendt, F. Biomass productivity and productivity of fatty acids and amino acids of microalgae strains as key characteristics of suitability for biodiesel production. J. Appl. Phycol. 2012, 24, 1407–1418. [Google Scholar] [CrossRef] [Green Version]
  85. Sharma, K.K.; Schuhmann, H.; Schenk, P.M. High lipid induction in microalgae for biodiesel production. Energies 2012, 5, 1532–1553. [Google Scholar] [CrossRef] [Green Version]
  86. Herrero, M.; Mendiola, J.; Plaza, M.; Ibañez, E. Screening for bioactive compounds from algae. In Advanced Biofuels and Bioproducts; Lee, J.W., Ed.; Springer: New York, NY, USA, 2013; pp. 833–872. [Google Scholar]
  87. Wright, T.; Lackey, R. Definitions of Feed Manufacturing and Livestock Nutrition Terms, Ontario Ministry of Agriculture, Food, and Rural Affairs. 2008. Available online: http://www.omafra.gov.on.ca/english/livestock/dairy/facts/08-039.pdf (accessed on 18 October 2015).
  88. Fujii, K.; Nakashima, H.; Hashidzume, Y.; Uchiyama, T.; Mishiro, K.; Kadota, Y. Potential use of the astaxanthin-producing microalga, Monoraphidium sp. GK12, as a functional aquafeed for prawns. J. Appl. Phycol. 2009, 22, 363–369. [Google Scholar] [CrossRef]
  89. Seyfabadi, J.; Ramezanpour, Z.; Amini Khoeyi, Z. Protein, fatty acid, and pigment content of Chlorella vulgaris under different light regimes. J. Appl. Phycol. 2011, 23, 721–726. [Google Scholar] [CrossRef]
  90. Lee, Y.-K.; Chen, W.; Shen, H.; Han, D.; Li, Y.; Jones, H.D.T.; Timlin, J.A.; Hu, Q. Basic culturing and analytical measurement techniques. In Handbook of Microalgal Culture; Richmond, A., Ed.; John Wiley & Sons Ltd.: Hoboken, NJ, USA, 2013; pp. 37–68. [Google Scholar]
  91. Pignolet, O.; Jubeau, S.; Vaca-Garcia, C.; Michaud, P. Highly valuable microalgae: Biochemical and topological aspects. J. Ind. Microbiol. Biotechnol. 2013, 40, 781–796. [Google Scholar] [CrossRef] [Green Version]
  92. Chan, M.-C.; Ho, S.-H.; Lee, D.-J.; Chen, C.-Y.; Huang, C.-C.; Chang, J.-S. Characterization, extraction and purification of lutein produced by an indigenous microalga Scenedesmus obliquus CNW-N. Biochem. Eng. J. 2013, 78, 24–31. [Google Scholar] [CrossRef]
  93. Schüler, L.; Greque de Morais, E.; Trovão, M.; Machado, A.; Carvalho, B.; Carneiro, M.; Maia, I.; Soares, M.; Duarte, P.; Barros, A.; et al. Isolation and characterization of novel Chlorella vulgaris mutants with low chlorophyll and improved protein contents for food applications. Front. Bioeng. Biotechnol. 2020, 8, 469. [Google Scholar] [CrossRef]
  94. Mendes-Pinto, M.M.; Raposo, M.F.J.; Bowen, J.; Young, A.J.; Morais, R. Evaluation of different cell disruption processes on encysted cells of Haematococcus pluvialis: Effects on astaxanthin recovery and implications for bio-availability. J. Appl. Phycol. 2001, 13, 19–24. [Google Scholar] [CrossRef]
  95. Boussiba, S. Carotenogenesis in the green alga Haematococcus pluvialis: Cellular physiology and stress response. Physiol. Plant. 2000, 108, 111–117. [Google Scholar] [CrossRef]
  96. Borowitzka, M.A. Dunaliella: Biology, production, and markets. In Handbook of Microalgal Culture; Richmond, A., Hu, Q., Eds.; John Wiley & Sons Ltd.: Hoboken, NJ, USA, 2013; pp. 359–368. [Google Scholar]
  97. Han, D.; Li, Y.; Hu, Q. Biology and commercial aspects of Haematococcus pluvialis. In Handbook of Microalgal Culture; Richmond, A., Hu, Q., Eds.; John Wiley & Sons Ltd.: Hoboken, NJ, USA, 2013; pp. 388–405. [Google Scholar]
  98. Latasa, M.; Van Lenning, K.; Garrido, J.; Scharek, R.; Estrada, M.; Rodríguez, F.; Zapata, M. Losses of chlorophylls and carotenoids in aqueous acetone and methanol extracts prepared for RPHPLC analysis of pigments. Chromatographia 2001, 53, 385–391. [Google Scholar] [CrossRef]
  99. Kim, J.; Kim, M.; Lee, S.; Jin, E. Development of a Chlorella vulgaris mutant by chemical mutagenesis as a producer for natural violaxanthin. Algal Res. 2020, 46, 101790. [Google Scholar] [CrossRef]
  100. Huang, W.; Lin, Y.; He, M.; Gong, Y.; Huang, J. Induced high-yield production of zeaxanthin, lutein, and β-carotene by a mutant of Chlorella zofingiensis. J. Agricult. Food Chem. 2018, 66, 891–897. [Google Scholar] [CrossRef] [PubMed]
Figure 1. Phylogenetic analyses of 18S rRNA gene sequences of microalgae in this study. The maximum parsimony tree is shown. Numbers near each node indicate bootstrap values (1000 replicates). Strains isolated in this study are shown in bold. Strains selected for comparative growth experiments are indicated with shading. The length of the tree is 341 with the consistency index of 0.66, the retention index of 0.91, and the composite index of 0.61 for all sites.
Phycology 02 00006 g001
Figure 2. Images of Scenedesmus dimorphus NT8C (A,B), Monoraphidium convolutum GW5 (C,D), Scenedesmus sp. GW63 (E,F), Ankistrodesmus sp. UQL1_13 (G,H), Desmodesmus sp. UQL1_19 (I,J), Monoraphidium sp. UQL1_20 (K,L), Desmodesmus sp. UQL1_26 (M,N) under the compound microscope with bright field and epifluorescent light. Neutral lipids are shown as yellow droplets after Nile red staining, whereas chlorophyll is shown in red.
Phycology 02 00006 g002
Figure 3. Growth curves of S. dimorphus NT8C (a), M. convolutum GW5 (b), Scenedesmus sp. GW63 (c), Ankistrodesmus sp. UQL1_13 (d), Desmodesmus sp. UQL1_19 (e), Monoraphidium sp. UQL1_20 (f), Desmodesmus sp. UQL1_26 (g). Shown are mean values (±SE) from three separately-grown replicate cultures (six replicates for reference strain S. dimorphus NT8C).
Phycology 02 00006 g003
Figure 4. Nitrate usage of the seven microalgal strains used in the growth experiment. Shown are mean values (±SE) from three replicates (six replicates for S. dimorphus NT8C). Due to the experimental error and natural variation of the method used for measuring nitrate concentration, the values less than 100 µM were too low to be measured accurately.
Phycology 02 00006 g004
Figure 5. Total protein content (% DW) and protein productivity (mg L−1 day−1) of the seven microalgal strains used in this study. Shown are mean values (±SE) from three replicate cultures (six replicates for S. dimorphus NT8C).
Phycology 02 00006 g005
Figure 6. Total carotenoid content (mg g−1 DW) and carotenoid productivity (mg L−1 day−1) of the seven microalgal strains used in this study. Shown are mean values (±SE) from three replicate cultures (six replicates for S. dimorphus NT8C).
Phycology 02 00006 g006
Table 1. Composition of the fertilizer-grade nutrients used in this study.
ChemicalProducerAmount Added
(mg L−1)
Final Concentration
in the Media (µM)
NH4H2PO4Yates, Orica Australia Pty Ltd.17.25150
KNO3Biolab (Aust) Ltd.1641624
MgSO4.7H2OChem Supply82333
Sea saltAquasonic25431
RapiSol Mi6 EDTA Chelated Micro NutrientAgspec Australia Pty Ltd.4N/A
RapiSol Iron EDTA Chelated Micro NutrientAgspec Australia Pty Ltd.4N/A
Table 2. Origins and identities of isolated microalgal strains used in this study.
StrainLocationFluctuating EnvironmentGenbank Accession
Monoraphidium convolutum GW5Woods Grains Pond, Goondiwindi
28°32′03″ S 150°19′39″ E
Eutrophic freshwaterKT893828
Scenedesmus sp. GW63Woods Grains Pond, Goondiwindi
28°31′37″ S 150°17′29″ E
Eutrophic freshwaterKT893831
Ankistrodesmus sp. UQL1_13UQ Lake, St Lucia 27°29′55″ S 153°0′58″ EEutrophic freshwaterKT893832
Desmodesmus sp. UQL1_19UQ Lake, St Lucia 27°29′55″ S 153°0′58″ EEutrophic freshwaterKT893836
Monoraphidium sp. UQL1_20UQ Lake, St Lucia 27°29′55″ S 153°0′58″ EEutrophic freshwaterKT893837
Desmodesmus sp. UQL1_26UQ Lake, St Lucia 27°29′55″ S 153°0′58″ EEutrophic FfeshwaterKT893841
Scenedesmus dimorphus NT8C Douglas Daly Research Farm, Winellie
13°49′59″ S 131°11′12″ E
High temperature freshwaterKF286273
Ochromonas sp. PH1_1Algae Energy Farm open pond, Pinjarra Hills
27°32′21″ S 152°55′24″ E
Eutrophic freshwaterKT804909
Spumella sp. GW31Golf Course Pond, Goondiwindi
28°31′45″ S 150°18′27″ E
Eutrophic freshwaterKT893827
Pseudodidymocystis planctonica GW61Woods Grains Pond, Goondiwindi
28°31′37″ S 150°17′29″ E
Eutrophic freshwaterKT893829
Scenedesmus sp. GW62Woods Grains Pond, Goondiwindi
28°31′37″ S 150°17′29″ E
Eutrophic freshwaterKT893830
Pseudomuriella sp. UQL1_15UQ Lake, St Lucia 27°29′55″ S 153°0′58″ EEutrophic freshwaterKT893833
Kirchneriella sp. UQL1_16UQ Lake, St Lucia 27°29′55″ S 153°0′58″ EEutrophic freshwaterKT893834
Kirchneriella sp. UQL1_18UQ Lake, St Lucia 27°29′55″ S 153°0′58″ EEutrophic freshwaterKT893835
Desmodesmus sp. UQL1_22UQ Lake, St Lucia 27°29′55″ S 153°0′58″ EEutrophic freshwaterKT893838
Protodesmus sp. UQL1_23UQ Lake, St Lucia 27°29′55″ S 153°0′58″ EEutrophic freshwaterKT893839
Desmodesmus sp. UQL1_24UQ Lake, St Lucia 27°29′55″ S 153°0′58″ EEutrophic freshwaterKT893840
Nitzschia palea UQL1_31UQ Lake, St Lucia 27°29′55″ S 153°0′58″ EEutrophic freshwaterKT893842
Chaetoceros calcitrans BR1_3Brisbane River, Brisbane
27°29′30″ S 153°0′47″ E
Eutrophic tidal brackishKT893843
Achnanthes sp. BR1_5Brisbane River, Brisbane
27°29′30″ S 153°0′47″ E
Eutrophic tidal brackishKT893844
Thalassiosira sp. NB1_1Nudgee Beach, Brisbane
27°21′3″ S 153°6′23″ E
Tidal marineKT893845
Navicula sp. NB1_2Nudgee Beach, Brisbane
27°21′3″ S 153°6′23″ E
Tidal marineKT893846
Chaetoceros sp. NB1_9Nudgee Beach, Brisbane
27°21′3″ S 153°6′23″ E
Tidal marineKT893847
Navicula sp. NB1_13Nudgee Beach, Brisbane
27°21′3″ S 153°6′23″ E
Tidal marineKT893848
Amphora sp. NC1_1Nudgee Creek, Nudgee Beach
27°21′1″ S 153°6′17″ E
Tidal eutrophic marineKT893849
Cylindrotheca sp. NC1_4Nudgee Creek, Nudgee Beach
27°21′1″ S 153°6′17″ E
Tidal eutrophic marineKT893850
Table 3. Growth rate, cell density, doubling time and biomass productivity analysis of seven microalgal strains during the growth experiment.
StrainAverage Growth RateCell Densitymax (×106 cells mL−1)Doubling Time (days)Biomass Productivity (g L−1 day−1)
Biomass Productivity
LL
Biomass Productivity
AVE
Biomass Productivity
ND
S. dimorphus NT8C0.44 a22.541.59 a0.17 a0.24 a0.37 a
M. convolutum GW50.38 a176.501.81 a0.10 b0.21 a,b0.35 a,b,*
Scenedesmus sp. GW630.42 a33.671.64 a0.14 a0.27 a0.44 a
Ankistrodesmus sp. UQL1_130.60 b47.081.15 b0.09 b0.22 a0.37 a
Desmodesmus sp. UQL1_190.48 a,b26.711.44 a,b0.10 b0.19 b0.30 b
Monoraphidium sp. UQL1_200.45 a17.291.54 a0.09 b0.16 b0.25 b
Desmodesmus sp. UQL1_260.28 c14.962.45 c0.10 b0.19 b0.31 b
Biomass productivityLL—biomass productivity at the late log phase, Biomass productivityAVE—biomass productivity on average of the total growth experiment period, Biomass productivityND—biomass productivity at the nutrient depletion period. Different small letters indicate significant (p < 0.05) differences based on ANOVA followed by Tukey’s test. * Value was underestimated due to biomass loss in centrifugation during harvesting.
Table 4. Fatty acid composition in % of TFA, TFA content (% DW), and TFA productivity (mg L-1 day-1) of seven microalgal strains used in this study.
Fatty AcidS. dimorphus
NT8C
M. convolutum
GW5
Scenedesmus
sp. GW63
Ankistrodesmus
sp. UQL1_13
Desmodesmus
sp. UQL1_19
Monoraphidium
sp. UQL1_20
Desmodesmus
sp. UQL1_26
C14:00.3±0.00.4±0.00.2±0.00.3±0.00.3±0.00.3±0.00.3±0.0
C14:10.3±0.00.4±0.00.2±0.00.3±0.00.3±0.00.3±0.00.3±0.0
C15:00.1±0.00.1±0.00.1±0.00.1±0.00.1±0.00.1±0.00.1±0.0
C16:020.4±0.321.9±0.417.9±0.425.7±0.325.7±0.118.8±0.421.4±0.5
C16:1(n-9)1.1±0.00.5±0.01.2±0.00.7±0.00.6±0.00.7±0.11.4±0.1
C16:1(n-7)0.2±0.00.3±0.00.3±0.00.2±0.00.4±0.10.5±0.10.3±0.0
C16:2(n-6)0.8±0.00.6±0.00.7±0.01.0±0.00.6±0.00.7±0.01.1±0.0
C16:3(n-3)4.2±0.11.3±0.03.2±0.22.3±0.13.6±0.13.1±0.05.2±0.2
C16:4(n-3)5.6±0.36.4±0.32.7±0.24.1±0.23.7±0.15.6±0.53.2±0.1
C17:00.2±0.01.3±0.10.1±0.01.8±0.00.4±0.00.4±0.00.3±0.0
C17:1(n-7)0.1±0.00.1±0.00.2±0.00.1±0.00.3±0.00.1±0.00.2±0.0
C18:02.5±0.21.6±0.12.2±0.22.7±0.03.5±0.32.2±0.22.6±0.2
C18:1(n-9)27.9±1.328.5±1.130.2±1.026.4±0.228.4±0.332.7±2.230.6±0.4
C18:2(n-6)9.0±0.47.0±0.310.1±0.38.9±0.26.8±0.17.3±0.210.2±0.1
C18:3(n-6)0.6±0.00.2±0.00.1±0.00.2±0.01.1±0.00.5±0.11.4±0.1
C18:3(n-3)19.3±0.416.5±0.620.0±0.814.6±0.314.9±0.215.1±0.511.4±0.0
C18:4(n-3)2.2±0.13.4±0.22.5±0.23.4±0.12.2±0.03.6±0.32.2±0.1
C20:00.1±0.00.2±0.00.2±0.00.2±0.00.2±0.00.1±0.00.2±0.0
C20:1(n-9)0.3±0.00.8±0.02.1±0.20.7±0.00.4±0.01.0±0.10.3±0.0
C20:2(n-6) 0.1±0.00.1±0.0 0.1±0.0
C20:3(n-3) 0.1±0.0
C20:5(n-3)
C22:00.2±0.00.9±0.00.3±0.00.2±0.00.2±0.00.3±0.10.3±0.0
C22:1(n-9) 0.2±0.00.2±0.00.1±0.00.1±0.00.1±0.00.1±0.0
C22:6(n-3)
C24:00.2±0.01.0±0.1 0.8±0.10.1±0.00.7±0.00.1±0.0
Other fatty acids4.7±0.56.2±0.35.0±0.65.2±0.66.1±0.45.8±0.96.8±0.7
Total SFA 23.8±0.427.4±0.521.0±0.631.8±0.230.5±0.322.8±0.425.2±0.7
Total MUFA30.0±1.230.9±1.134.5±0.928.5±0.330.3±0.335.4±2.133.3±0.3
Total PUFA41.6±1.135.4±1.439.5±1.434.5±0.833.0±0.236.0±1.634.8±0.3
ω-3 PUFA31.2±0.827.5±1.128.5±1.224.4±0.624.4±0.127.4±1.322.0±0.2
ω-6 PUFA10.3±0.47.9±0.311.0±0.310.1±0.38.6±0.18.6±0.312.8±0.2
ω-6/ω-30.3±0.00.3±0.00.4±0.00.4±0.00.4±0.00.3±0.00.6±0.0
TFA (% DW)11.8±0.313.4±0.612.1±1.014.9±1.412.8±0.915.9±0.611.7±0.5
TFA productivity
(mg L-1 day-1)
30.8±2.628.0±1.132.6±4.232.2±3.123.6±1.425.2±3.422.3±1.3
SFA saturated fatty acids, MUFA monounsaturated fatty acids, PUFA polyunsaturated fatty acids, TFA total fatty acids, DW dry weight. Shown are mean values (±SE) from three replicates.
Publisher’s Note: MDPI stays neutral with regard to jurisdictional claims in published maps and institutional affiliations.

