Article

Shining Light on Photosynthesis in the Harmful Dinoflagellate Karenia mikimotoi–Responses to Short-Term Changes in Temperature, Nitrogen Form, and Availability

by
So Hyun (Sophia) Ahn
* and
Patricia M. Glibert
Horn Point Laboratory, University of Maryland Center for Environmental Science, P.O. Box 775, Cambridge, MD 21613, USA
*
Author to whom correspondence should be addressed.
Phycology 2022, 2(1), 30-44; https://doi.org/10.3390/phycology2010002
Submission received: 25 November 2021 / Revised: 16 December 2021 / Accepted: 21 December 2021 / Published: 27 December 2021
(This article belongs to the Collection Feature Papers in Phycology)

Abstract

:
Karenia mikimotoi is a toxic bloom-forming dinoflagellate that sometimes co-blooms with Karenia brevis in the Gulf of Mexico, especially on the West Florida Shelf where strong vertical temperature gradients and rapid changes in nitrogen (N) can be found. Here, the short-term interactions of temperature, N form, and availability on photosynthesis–irradiance responses were examined using rapid light curves and PAM fluorometry in order to understand their interactions, and how they may affect photosynthetic yields. Cultures of K. mikimotoi were enriched with either nitrate (NO3), ammonium (NH4+), or urea with varying amounts (1, 5, 10, 20, 50 µM-N) and then incubated at temperatures of 15, 20, 25, 30 °C for 1 h. At 15–25 °C, fluorescence parameters (Fv/Fm, rETR) when averaged for all N treatments were comparable. Within a given light intensity, increasing all forms of N concentrations generally led to higher photosynthetic yields. Cells appeared to dynamically balance the “push” due to photon flux pressure and reductant generation, with consumption in overall metabolism (“pull” due to demand). However, at 30 °C, all fluorescence parameters declined precipitously, but differential responses were observed depending on N form. Cells enriched with urea at 30 °C showed a smaller decline in fluorescence parameters than cells treated with NO3 or NH4+, implying that urea might induce a photoprotective mechanism by increasing metabolic “pull”.

1. Introduction

Karenia mikimotoi, the close relative of the harmful dinoflagellate Karenia brevis that forms massive annual blooms mostly in the Gulf of Mexico, is a hemolytic and cytotoxic dinoflagellate found in coastal waters around the world, including Asia (e.g., Japan, China, Korea, Hong Kong), Europe (e.g., Norway, United Kingdom, Denmark, Spain), Oceania (e.g., Australia, New Zealand), and America (e.g., United States, Chile) [1,2]. Several Karenia species co-exist and often co-bloom with K. brevis in the Gulf of Mexico, especially on the West Florida Shelf [1,3]. Although highly variable from year-to-year, Karenia spp. blooms on the West Florida Shelf commonly occur from early fall through winter and only rarely persist as substantial blooms throughout the summer [4].
Temperature is an important variable in understanding the physiological success of phytoplankton taxa, but due to its effect on key enzymes and the different temperature optima of enzymes involved in photosynthesis and metabolism of different forms of nitrogen (N), temperature may have different effects on physiological status depending on growth N form. Seasonal temperature changes on the West Florida Shelf range from lows of ~15 °C in winter when K. brevis blooms are more common, to highs of >30 °C in mid-summer. Sharp vertical gradients in temperature may also exist. For example, Weisberg et al. [5] reported, for the West Florida Shelf for the month of July 2010, that temperatures changed from near 29 °C at the surface to near 17 °C near the bottom, where waters are influenced by upwelling. The near-bottom waters are also more enriched in nitrate (NO3) relative to the surface waters in which regenerated forms of N (e.g., ammonium (NH4+) or urea), are proportionately more abundant. Even when strong upwelling is not present, strong vertical gradients in temperature may be commonly found [6]. Any vertically migrating cells would be subject to sharp changes in temperature and possibly to co-occurring changes in N form and concentration. Here, the short-term interactions of temperature, light, and N form, and amounts were examined in K. mikimotoi, with an aim of understanding how these responses may relate to the fluctuating conditions, under which K. mikimotoi is found on West Florida Shelf.
Temperature effects on photosynthesis and N nutrition are complex, but the interactions between temperature, photosynthesis, and different N forms in phytoplankton metabolism are not well understood. The biophysical light reactions of photosynthesis are relatively temperature-insensitive, while the biochemical reactions (e.g., Calvin Cycle reactions and non-photochemical reactions in the thylakoid) are temperature sensitive leading to reduced rates of carbon (C) assimilation at low temperatures [7]. Temperature also affects enzymes associated with NO3 and NH4+ [7]. The enzyme involved in NO3 reduction, nitrate reductase (NR), typically has an inverse relationship with temperature (generally between 12 °C and 25 °C) [8,9,10,11], while the enzymes involved in NH4+ assimilation, glutamine synthetase–glutamate synthase (GS-GOGAT), are positively related to temperature across the same range, e.g., [12]. The assimilation of NO3 would thus be expected to be higher at lower temperatures (10–15 °C), and indeed, over the temperature range 5–25 °C, NO3 uptake by both diatom-dominated and dinoflagellate-dominated natural communities typically show an inverse relationship with temperature, while NH4+ uptake typically shows a positive relationship [10,11]. Urease, the enzyme involved in urea metabolism, also appears to have a positive relationship with temperature for many phytoplankton taxa, and at least for one dinoflagellate, Prorocentrum minimum, rates of activity remain elevated up to temperatures of 50 °C [13]. Taken together, the assimilation of NO3, NH4+, and urea are regulated differently by temperature, a factor that can influence phytoplankton dynamics in an environment in which N forms may be variable. Light is a fundamental source for photoautotrophs, however, if light energy absorbed by pigments in photosystem II (PSII) exceeds its utilization in C assimilation, PSII can experience oxidative or other damage [14,15,16]. The reaction center chlorophyll (Chl) in PSII, which is aggregated on the thylakoid membrane, absorbs quanta of photosynthetically active radiation (PAR) and generates electrons and protons from water molecules that, in turn, contribute to the generation of chemical energy (ATP, NADPH) that is used to drive diverse metabolic processes such as C and N assimilation. However, the supply of chemical energy must be matched to its use in metabolism to protect PSII from over-reduction e.g., [16]. One of the important mechanisms to rapidly regulate excess light energy is non-photochemical quenching (NPQ) (of fluorescence) [7,15]. This process mainly dissipates the absorbed energy that exceeds the capacity of electron transport over demand of metabolism as non-radiative harmless heat. There are multiple mechanisms contributing to photoprotection, and photoregulation, and the actual relationship between NPQ and photoprotection is complex. Light, nutrients, and temperature are among the main factors affecting the capacity of electron transport and the demand for metabolism [16,17]. When photosynthetic organisms experience nutrient deficiency, metabolism may be resource limited, but not necessarily energy limited. Thus, reduced metabolic use of absorbed light energy may result in over-excitation, altering cellular energy balance [16,17]. In such a case, the reduced demand for metabolism decreases the energy utilization capacity, and it might accelerate photoinhibition. One pathway by which NPQ in algae is triggered is via the accumulation of Light Harvesting Complex Stress Related Proteins (LHCSRs; e.g., [18]), and recent work [19] has characterized these proteins for the green alga Chlamydomonas reinhardtii. Here, these interactions were studied using pulse-amplitude modulation (PAM) fluorometry.
As with other Karenia species, K. mikimotoi is a relatively slow-grower but has a strong adaptive capacity to fluctuating environments [1,2]. Although differences have been found between subspecies, K. mikimotoi is a eurythermal (4–31 °C) and euryhaline (salinity of 9–35) species [1]. While generally thought to be a low-light specialist, K. mikimotoi is also capable of growing well in a wide range of light intensities [1,2] and is positively phototactic. Nutritionally, Karenia spp. are flexible, utilizing various inorganic and organic nutrients and showing phago-mixotrophy [1,20,21,22,23,24,25]. On the West Florida Shelf, diverse nutrient sources (e.g., land-derived nutrient inputs, microbially regenerated nutrients, regenerated nutrients from decaying fish during toxic blooms, nitrification) may be available to be taken up by Karenia spp. [23]. While Karenia spp. are primarily photo-autotrophic, they may also consume prey, and higher growth rates of K. brevis [23,24] and K. mikimotoi [21,22] have been observed when they have ingested prey organisms compared to growth on inorganic nutrient sources.
In this study, the objective was to analyze photosynthesis in K. mikimotoi, in response to short-term exposures to varying combinations of temperature, N form, and concentration. We focused on short-term (hour time scale) exposure to different temperatures, bracketing the temperatures most commonly experienced on the West Florida Shelf, simulating how cells may respond to environmental changes that may be experienced near coastal fronts, in vertical gradients, or near nutrient sources. Photosynthesis-irradiance responses were examined using rapid light curves. We hypothesized that photosynthetic efficiency in K. mikimotoi will increase with temperature and with increasing N concentrations (all forms), but that with increasing temperatures, photosynthetic efficiency—the relative amount of absorbed light energy that can be used to drive photosynthesis—will increase to a greater extent, with increasing concentrations of chemically reduced forms of N compared to changes with increasing concentrations of NO3.

2. Materials and Methods

2.1. Algal Culture

A culture of non-axenic K. mikimotoi (ARC165, originally isolated from Venice, Florida in 2006) was obtained from Mote Marine Laboratory, Sarasota, FL, USA. The K. mikimotoi were grown in semi-batch cultures using L1-silicate media with N added as NO3 [26]. All culture media were prepared with 0.2 µm filtered nearshore west Florida waters and sterilized by autoclaving. Cultures were grown over 12 h light:12 h dark cycle under 40 µmol photons m−2 s−1 at salinity 32~34 and 20 °C.

2.2. Specific Growth Rate, Nutrient Analysis

While maintaining the stock culture, changes in cell number over time were monitored by counting cells with light microscopy using a hemocytometer after fixing with 5% Lugol’s solution. The specific growth rate (μ) of K. mikimotoi was calculated according to
μ = (ln X2 − ln X1)/(t2 − t1)
where X1 and X2 are the cell numbers at time t1 and t2, respectively. At the start of the experiment, samples for cell counts and ambient nutrients were collected. Aliquots of culture were filtered through precombusted (450 °C for 2 h) Whatman GF/F filters (Florham Park, NJ, USA) were stored in a −20 °C freezer for further analysis. The filtrates were reserved for ambient nutrient analysis, which was later done via autoanalysis at the Mote Marine Laboratory.

2.3. Experimental Setup

To initiate the experiment, the culture was first diluted to a final concentration of 6200 cells ml−1 with autoclaved filtered seawater in order to reduce the concentrations of residual nutrients. Aliquots of the diluted culture were then transferred to 60, 50 mL polypropylene tubes. The tubes were divided into 12 batches of five tubes (Figure 1). Within each batch, tubes received an enrichment of either NO3, NH4+ or urea at the following concentrations: 1, 5, 10, 20, 50 μM-N, as 15N (99% enriched). One batch of each substrate enrichment gradient (NO3, NH4+ or urea) was then incubated for 1 h at each of four different temperatures. To do so, tubes were placed in temperature-controlled water baths maintained at 15, 20, 25, 30 °C. Tubes were illuminated continuously by LED lights with 350–400 μmol photons m−2 s−1 as measured with QSL-100 quantum scalar irradiance meter (Biospherical Instruments Inc., San Diego, CA, USA). At the end of the incubation period, tubes were subsampled for photosynthesis measurements and 15N incorporation as described below.

2.4. Chl Fluorescence Measurements

After the 1 h incubation at the designated temperature, black multiwell plates (24 wells each) were filled with K. mikimotoi cells from the various tubes (3 mL in each well) and were dark acclimated for 20 min to fully open (i.e., oxidize) the PSII reaction center Chl and to minimize non-photochemical energy dissipation. Fluorescence emissions from PS II were monitored by a MAXI-Imaging PAM M-Series (Heinz Walz GmbH, Effeltrich, Germany), equipped with 44 blue LED lamps. Light intensities were calibrated with a ULM-500 Light Meter & Logger equipped with a micro quantum sensor (Heinz Walz GmbH, Effeltrich, Germany). Rapid light curves were run to monitor PS II fluorescence emissions as a function of rapid changes in irradiance (12 steps for 20 s at each step: 0, 4, 10, 28, 53, 86, 128, 178, 236, 377, 460, 671 µmol photons m−2 s−1). The data were exported from the ImagingWin software (Heinz Walz GmbH, Effeltrich, Germany) and fluorescence parameters were calculated (Supplementary Materials, Table S1). For the dark-adapted cells, the maximum quantum yields of PSII photochemistry were calculated as the ratio of variable fluorescence (Fv) to maximum fluorescence (Fm), Fv/Fm [15,27]. Subsequently, the effective quantum yield of PSII photochemistry at each light step was calculated as
YII = (F’m − Ft)/F’m
where F’m is light-acclimated maximum fluorescence and Ft is the steady-state value of fluorescence immediately prior to a flash for a light-adapted sample, respectively [14,28]. The quantum yield of non-regulated non-photochemical energy dissipation (YNO) and the quantum yield of regulated non-photochemical energy dissipation (YNPQ) were further calculated to analyze the allocation of PSII excitation energy at each light step [28]. The sum of these three yields equals 1.
The relative electron transfer rate (rETR) of PS II in units of µmol electrons m−2 s−1 was calculated as
rETR = 0.5 × YII × PAR × 0.84
which is the product of the effective quantum yield (YII) and photosynthetically active radiation (PAR), adjusting the product by a factor of 0.5, which takes into account that half of the absorbed light energy is directed to PSII, and by the factor 0.84, which is the presumed PAR absorptivity, e.g., [14]. Photosynthesis-irradiance curves were fitted using the formula of Platt et al. [29] and rETR parameters were calculated using the R package ‘phytotools’ (https://cran.r-project.org/package=phytotools (accessed on 12 April 2021).
The photosynthetic quenching parameter, qP, was calculated according to
qP = (F’m − Ft)/(F’m − F’o)
in which minimum fluorescence level of illuminated sample is F’o. In order to convert this to a measure of excitation pressure, the value 1-qP was calculated. This value is also interpreted as the number of photosynthetic reaction centers that are closed [30]. Thus, whereas Fv/Fm is a measure of quantum efficiency of PSII and the efficiency of non-photochemical quenching (when all reaction centers are considered open and the cells are dark-adapted), any change in qP reflects the degree of reaction center closures under varying light conditions.

2.5. 15N Isotope Analysis

After incubation, and immediately after the filling of the microwell plates for photosynthetic measurements, the remaining volumes in each of the experimental tubes were filtered through precombusted (450 °C 2 h) Whatman GF/F filters. The filters were immediately frozen, then subsequently dried and transferred to tin capsules. Isotope analysis was then undertaken by the UC Davis Stable Isotope Facility. Values are reported as 15N atom percent enrichment of samples at the end of the incubation periods [31].

2.6. Statistical Analysis

All statistical analyses were performed with R. The normality of data was checked with Shapiro–Wilks test and the homogeneity of variance was assessed with Levene’s test in R package ‘car’. Differences between different temperature (15, 20, 25, 30 °C) and N forms (NO3, NH4+, urea) of fluorescence data (e.g., Fv/Fm, rETR parameters) were tested using one-way analysis of variance (ANOVA), followed by Tukey’s HSD test for pairwise comparisons.

3. Results

3.1. Initial Cell and Nutrient Conditions

The specific growth rate of the initial undiluted culture at the time of the experiment was 0.23 day−1. The cells were not nutrient-depleted and the measured concentrations of nutrients after dilution with filtered seawater were 289 µM ± 2.8 and 1.1 ± 0.5 µM for NO3and NH4+, respectively, and 7.7 ± 0 µM for PO43−. Urea concentrations were negligible.

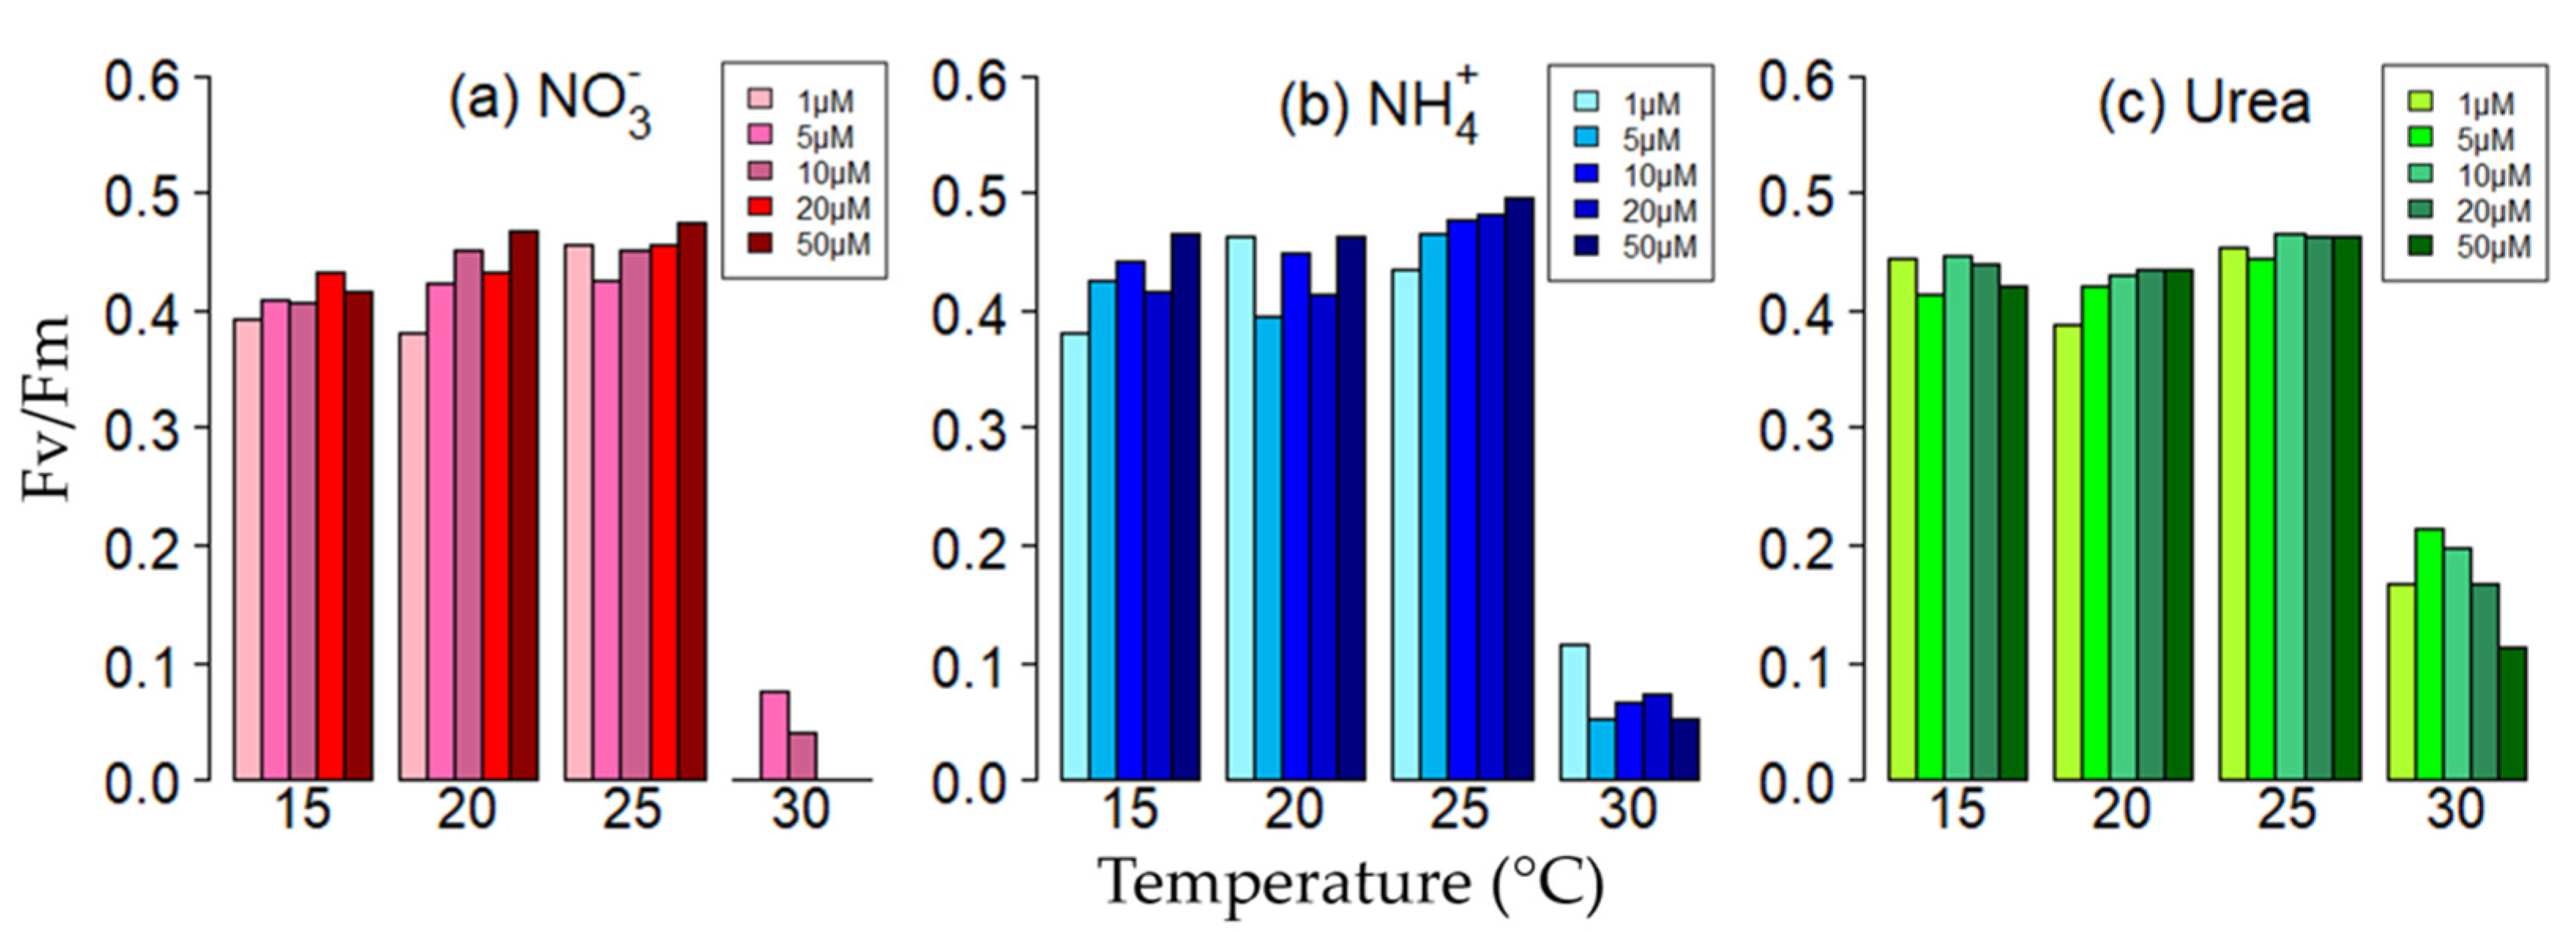
3.2. PSII Quantum Efficiency and Quantum Yields

Over the range of 15–25 °C, the maximum quantum yields of PSII photochemical efficiency, Fv/Fm, did not differ significantly between the N treatments when the different N concentrations for each temperature were averaged (ANOVA, p > 0.05) (Table 1 and Table 2). The Fv/Fm averaged 0.44 ± 0.03 for the 15–25 °C treatments when all N forms and concentrations are taken into account. However, within each N form, Fv/Fm tended to increase with temperature (ANOVA, p < 0.05) (Table 2) and concentrations (Figure 2). In contrast, at 30 °C, the Fv/Fm of all the N-enriched samples dropped precipitously. The Fv/Fm of samples enriched with NO3 and NH4+ and incubated at 30 °C dropped to <0.1, while those with urea enrichment fell to a range of 0.1–0.2. The Fv/Fm values of the urea-treated samples (0.17 ± 0.04) were 2-fold higher than those of the NH4+-treated samples (0.07 ± 0.03) (Tukey’s HSD, p < 0.01) and 9-fold higher than those of the NO3-treated samples (0.02 ± 0.03) (Tukey’s HSD, p < 0.001) (Figure 2 and Table 2). At 30 °C, the Fv/Fm values also showed a general decline when enriched at concentrations >5 µM-N (Figure 2). This trend was most apparent for samples enriched with urea.
At 15–25 °C, the quantum yields of the effective photochemical efficiency of PSII, YII, of K. mikimotoi declined with increasing transient light intensities (Figure 3a–i). The rates of decline were similar for all N treatments (ANOVA, p > 0.05). At 30 °C, all values of YII were much reduced, but values for samples enriched with urea were significantly higher than values for those samples enriched with either NO3 or NH4+ (Tukey’s HSD, p < 0.001) (Figure 3j–l). For a given light intensity, most values of YII increased with increasing N concentrations at 15–25 °C (Figure 3a–i), while no consistent N concentration effects were found at 30 °C (Figure 3j–l).

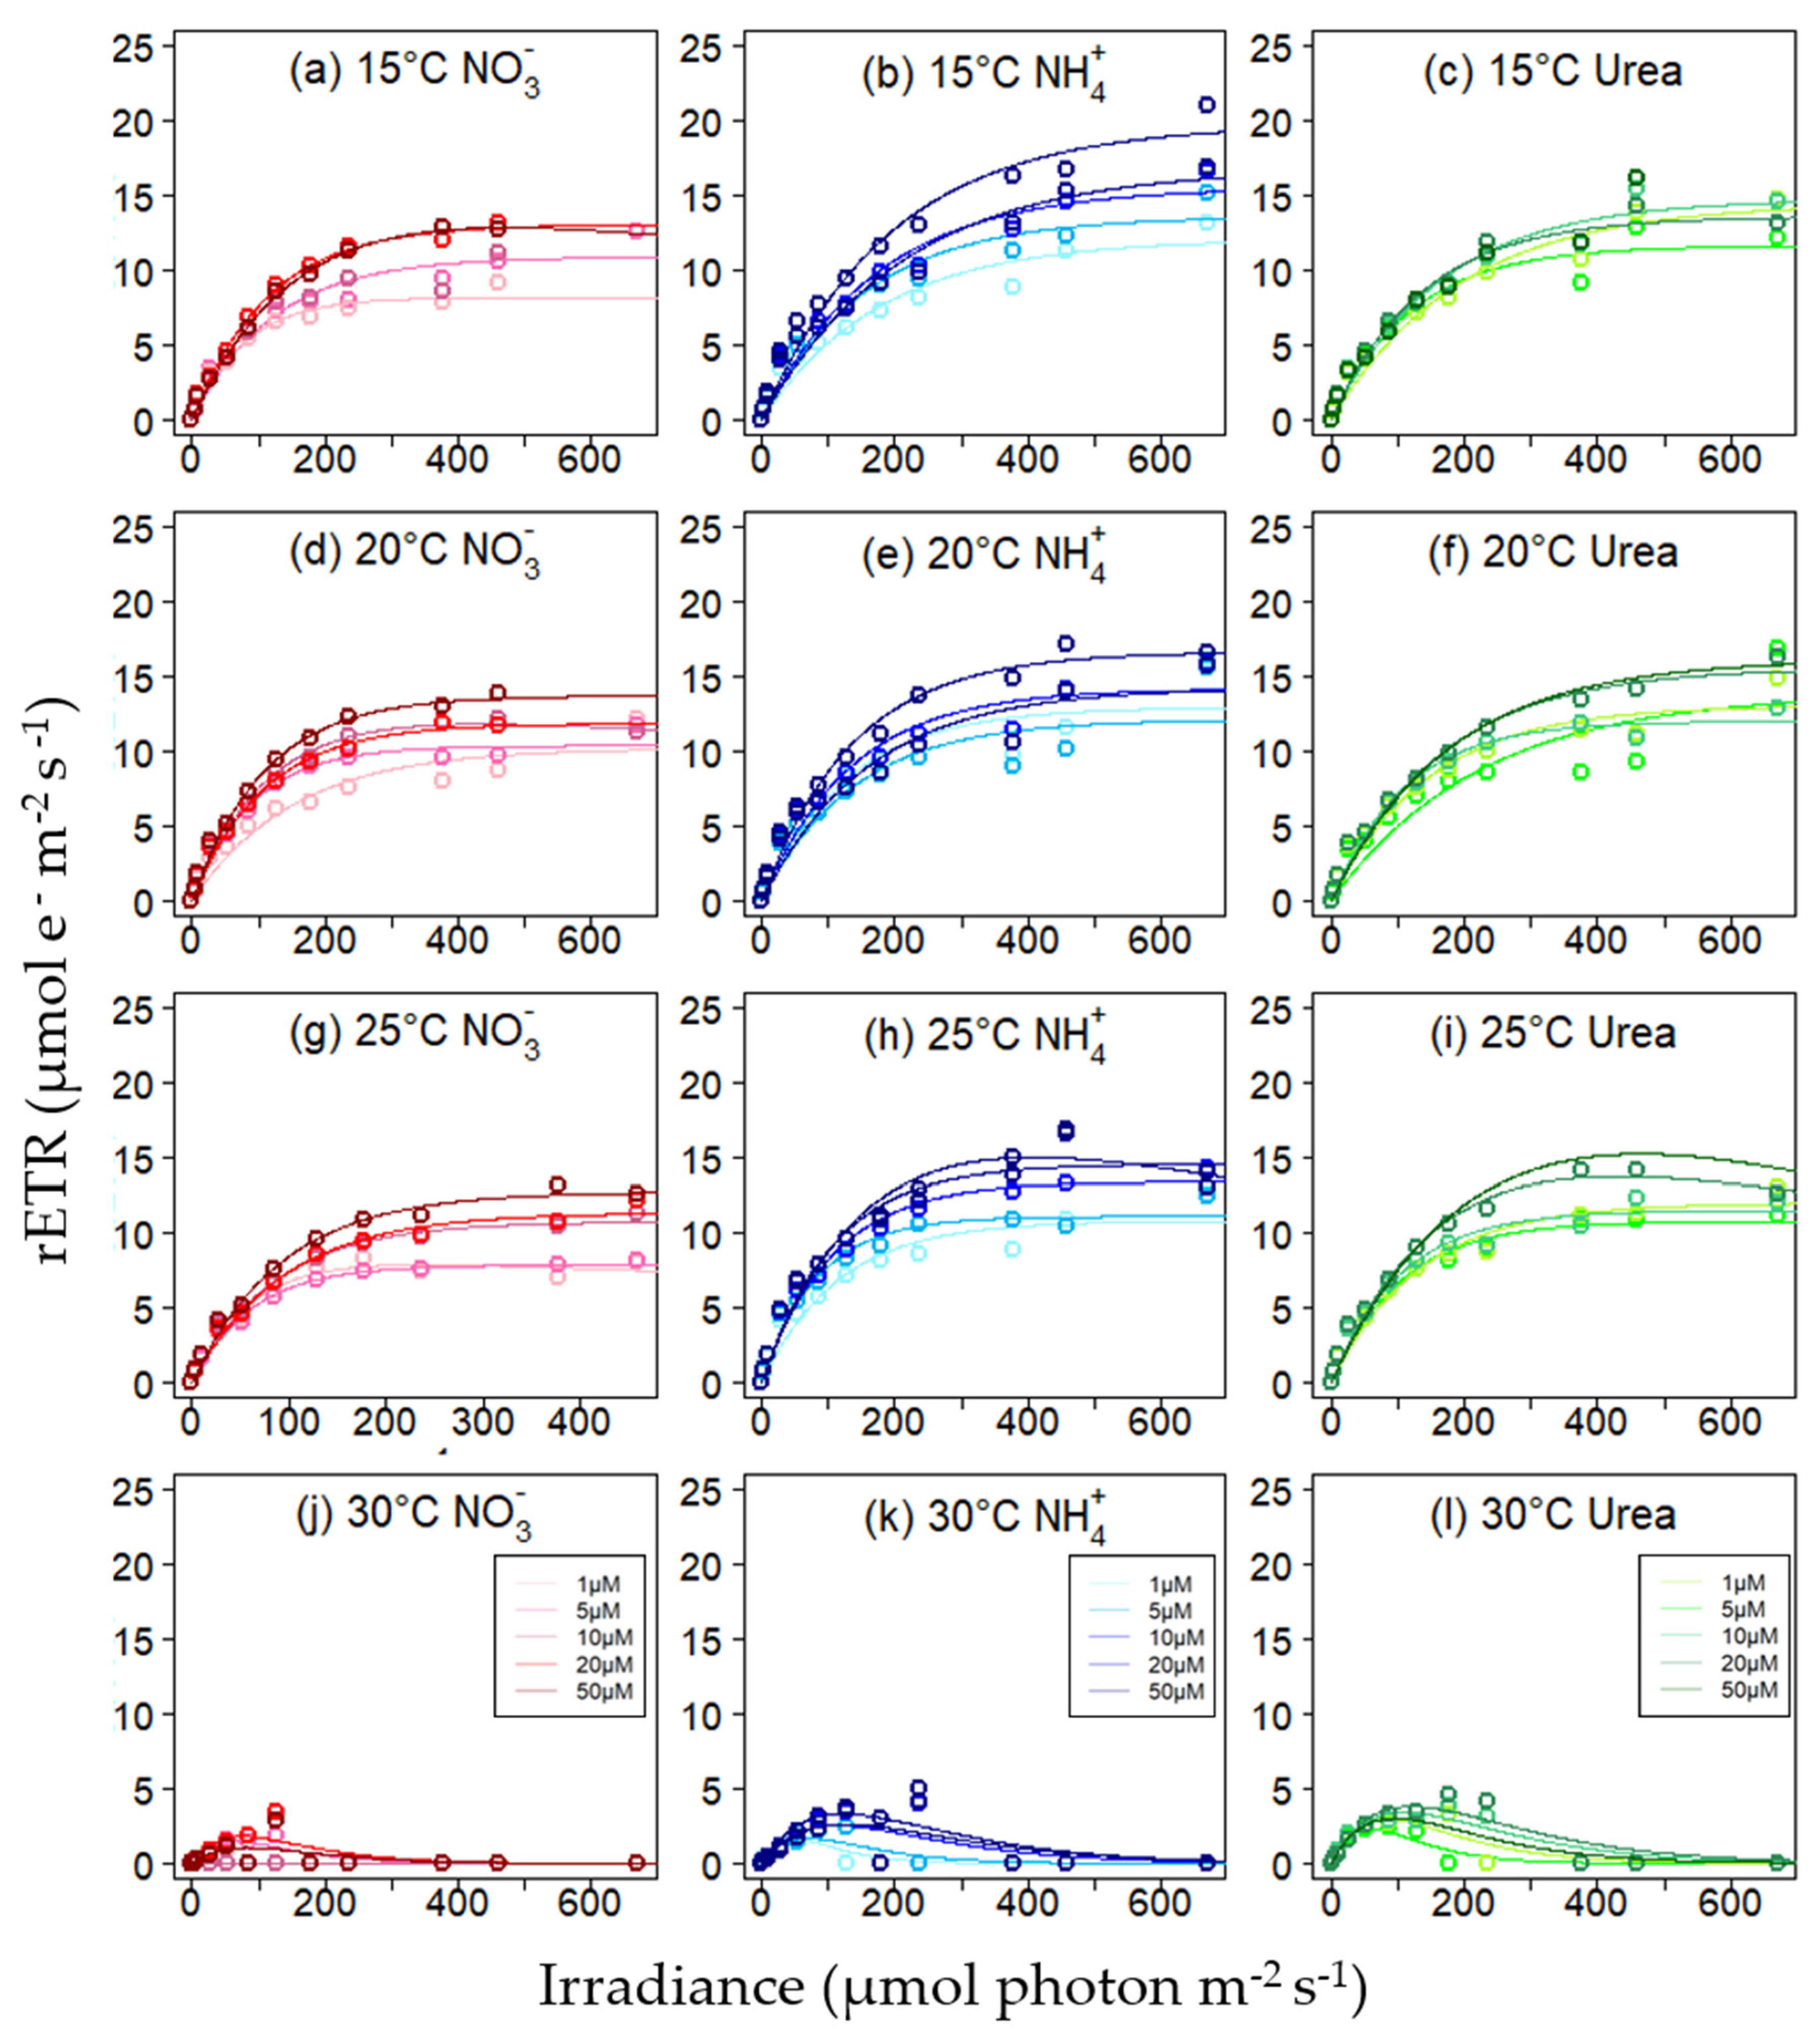
3.3. Relative Electron Transfer Rate

The rapid light response curves of rETR showed a typical saturating response with little evidence of photoinhibition at 15–25 °C at all N forms and concentrations (Figure 4a–i). Only a few treatments showed down-regulation of photochemical reactions, thus exhibited reduction in rETR values at the highest light intensity (e.g., 20 and 50 µM-N of urea at 25 °C). As with values of Fv/Fm and YII, values of rETR were reduced significantly at 30 °C across the light range, but the extent of reduction differed depending on the form of N (ANOVA, p < 0.01) (Figure 4j–l). Both light-limited and light-saturated parts of the rETR versus irradiance curves responded to changes in N concentrations with stronger effects on the light-saturated regions at 15–25 °C (Figure 4a–i). For example, the light-limited rETR of the 1 µM-N NH4+ treatment at 15 °C (0–178 µmol photons m−2 s−1) increased 43% compared to the 50-µM-N NH4+ treatment at 15 °C, and the light-saturated rETR of the 1µM-N NH4+ treatment at 15 °C (236–460 µmol photons m−2 s−1) increased 63% compared to the 50 µM-N NH4+ treatment at 15 °C (rETR parameters including saturation irradiance, Ik, are presented in Supplementary Materials, Table S2).
No significant temperature effects on rETRmax were found at 15–25 °C at each N source (ANOVA > 0.05) (Table 2) while N source effects were found at two temperatures (Tukey’s HSD, p < 0.05) (Table 1). The rETRmax values of the NH4+-enriched cultures (15.6 ± 3.0) were significantly higher than those of samples enriched with NO3 (11.2 ± 2.0) at 15 °C (Tukey’s HSD, p < 0.05) and rETRmax values of the NO3-enriched cultures (0.9 ± 0.8) were markedly lower than those of the NH4+-enriched samples (2.4 ± 0.7) (Tukey’s HSD, p < 0.05), and the urea-treated samples (3.1 ± 0.6) at 30 °C (Tukey’s HSD, p < 0.01) (Figure 5, Table 2).

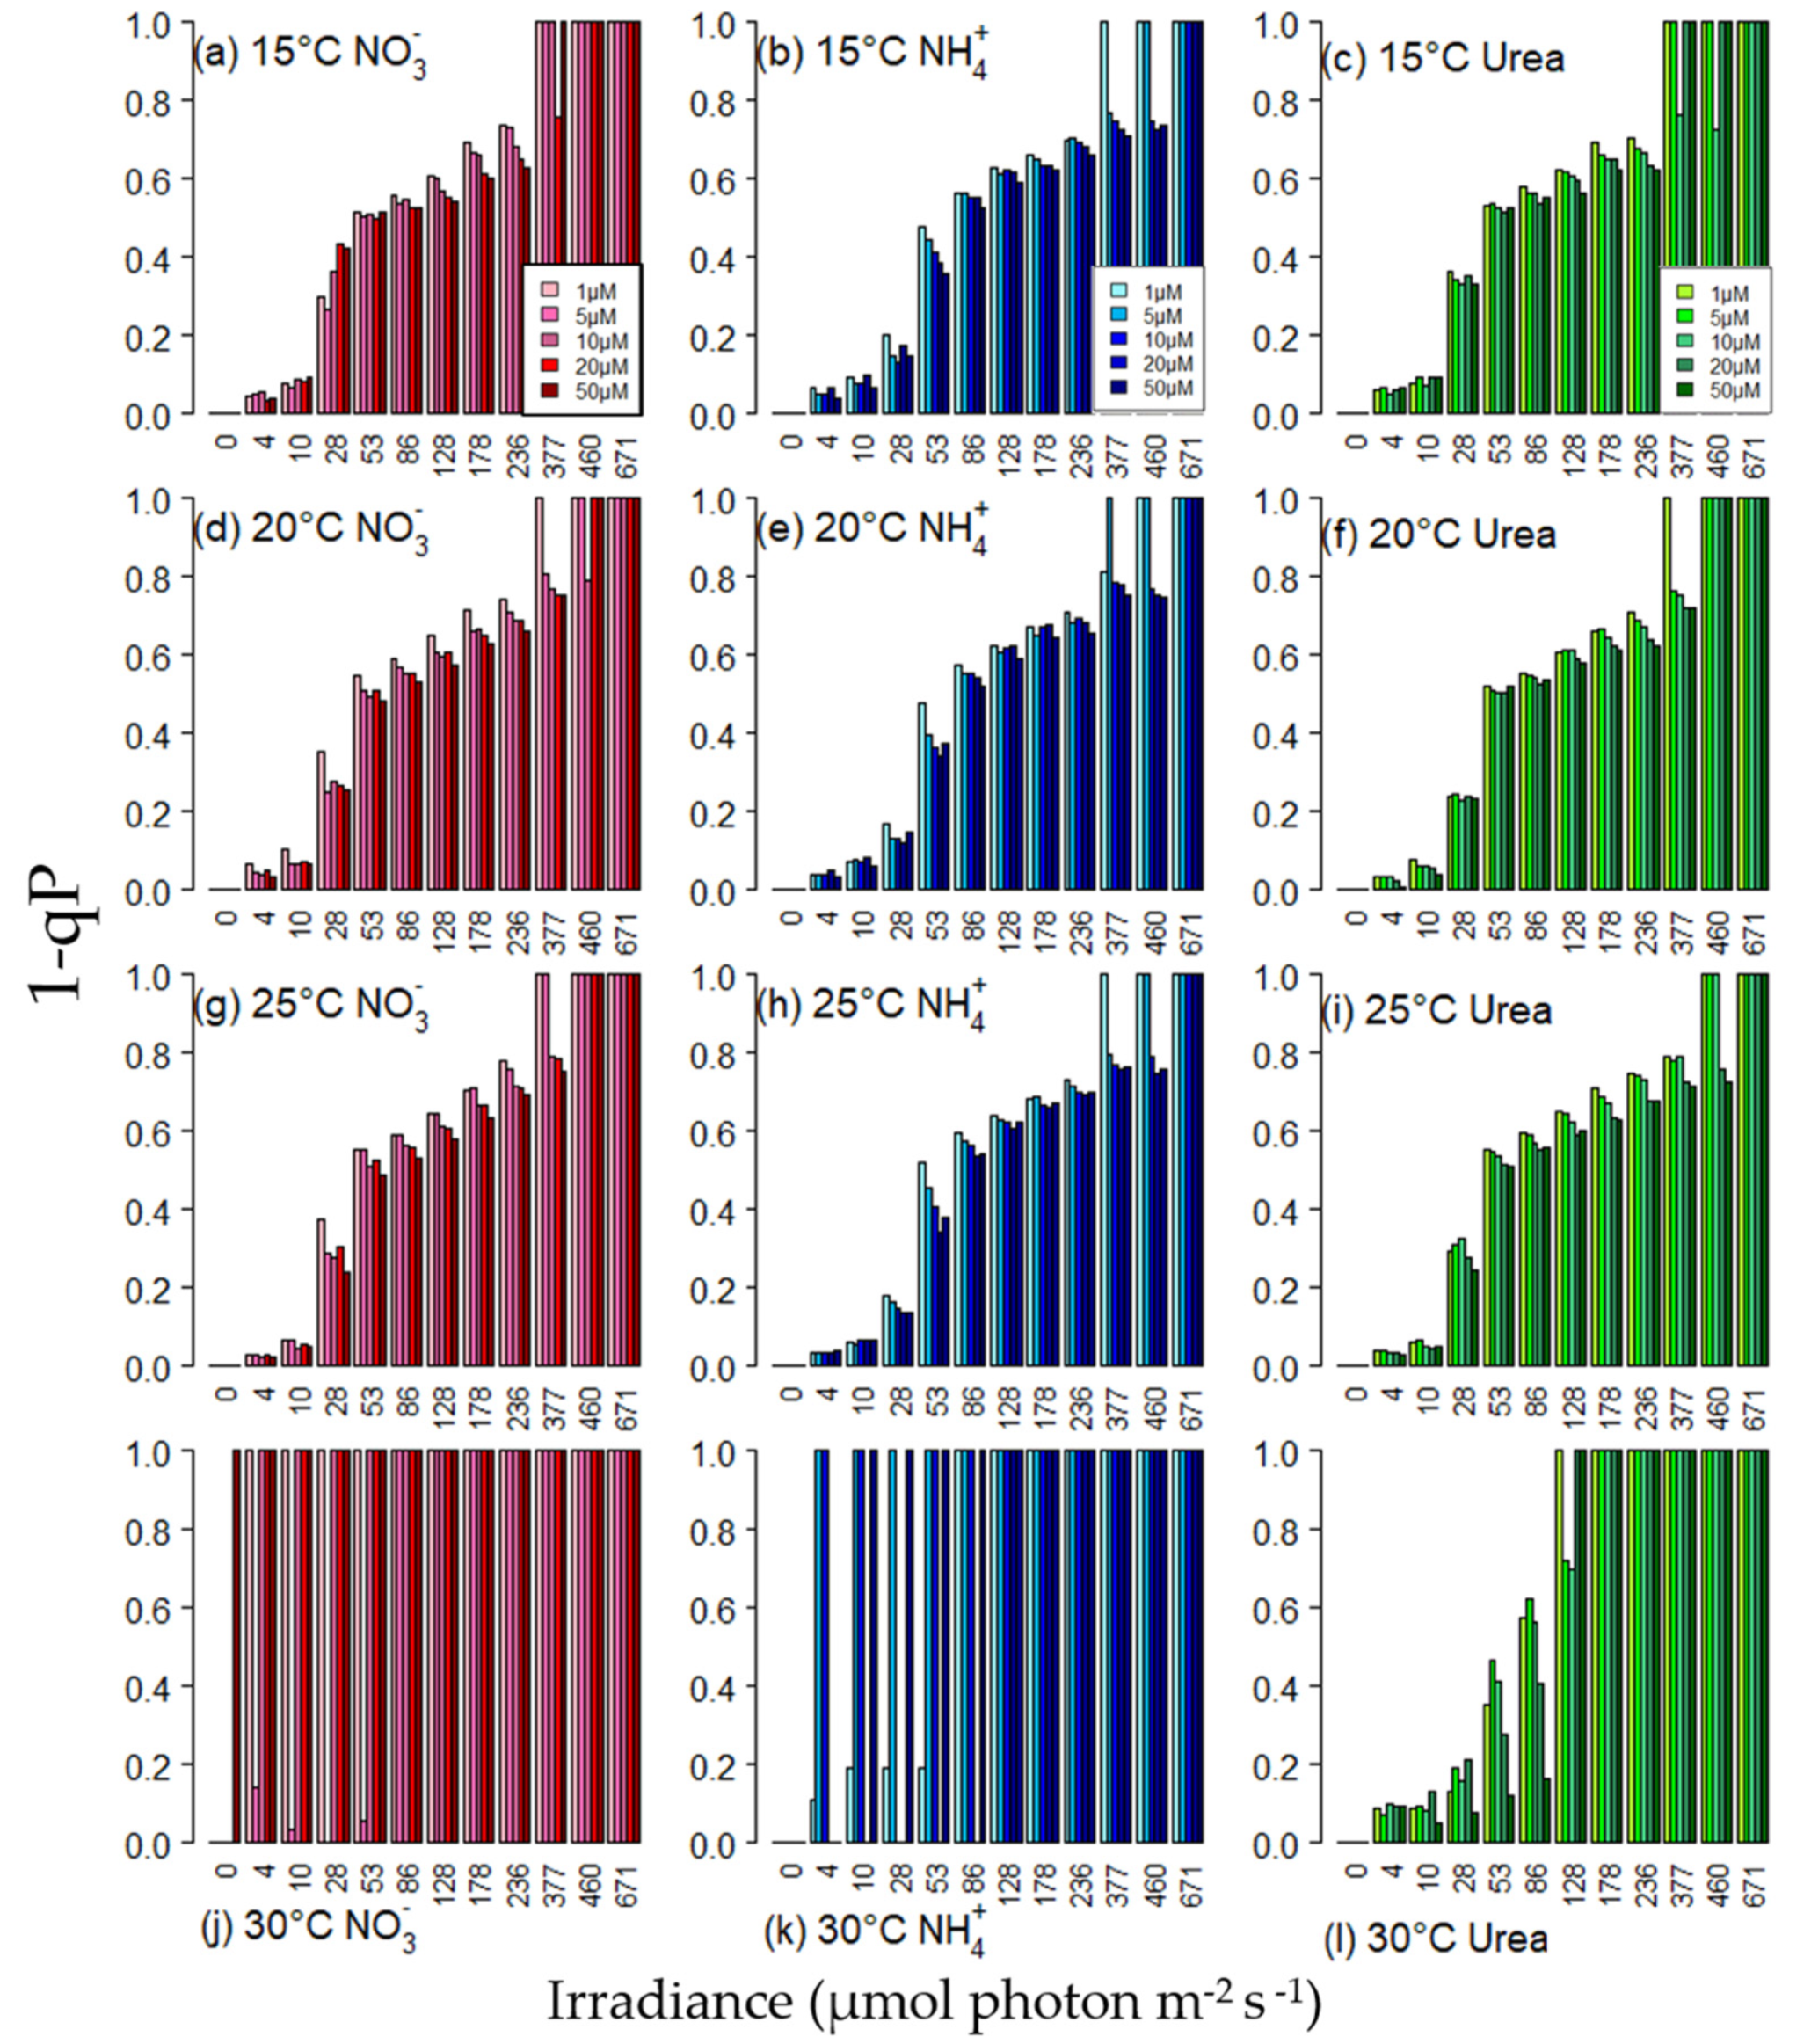
3.4. Excitation Pressure

The excitation pressure, 1-qP, increased with increasing transient light intensities at 15–25 °C (Figure 6a–i). When cells were fully dark-adapted (I = 0 µmol photons m−2 s−1), reaction centers were all open and 1-qP values were low, but by 10 µmol photons m−2 s−1, an increasing fraction of reactions centers were closed. At each light intensity, excitation pressure decreased with increasing concentrations of N forms (Figure 6a–i). However, cells exposed to 30 °C exhibited closed reaction centers across all nearly all irradiance levels for samples enriched with NO3 and NH4+, while for samples enriched with urea, full reaction center closure was observed only for samples exposed to >100 µmol photons m−2 s−1 (Figure 6j–l).
Measures of the quantum yields of regulated and non-regulated non-photochemical energy dissipation (YNPQ and YNO) for all experimental treatments are provided in the in Supplementary Materials (Figures S1 and S2).

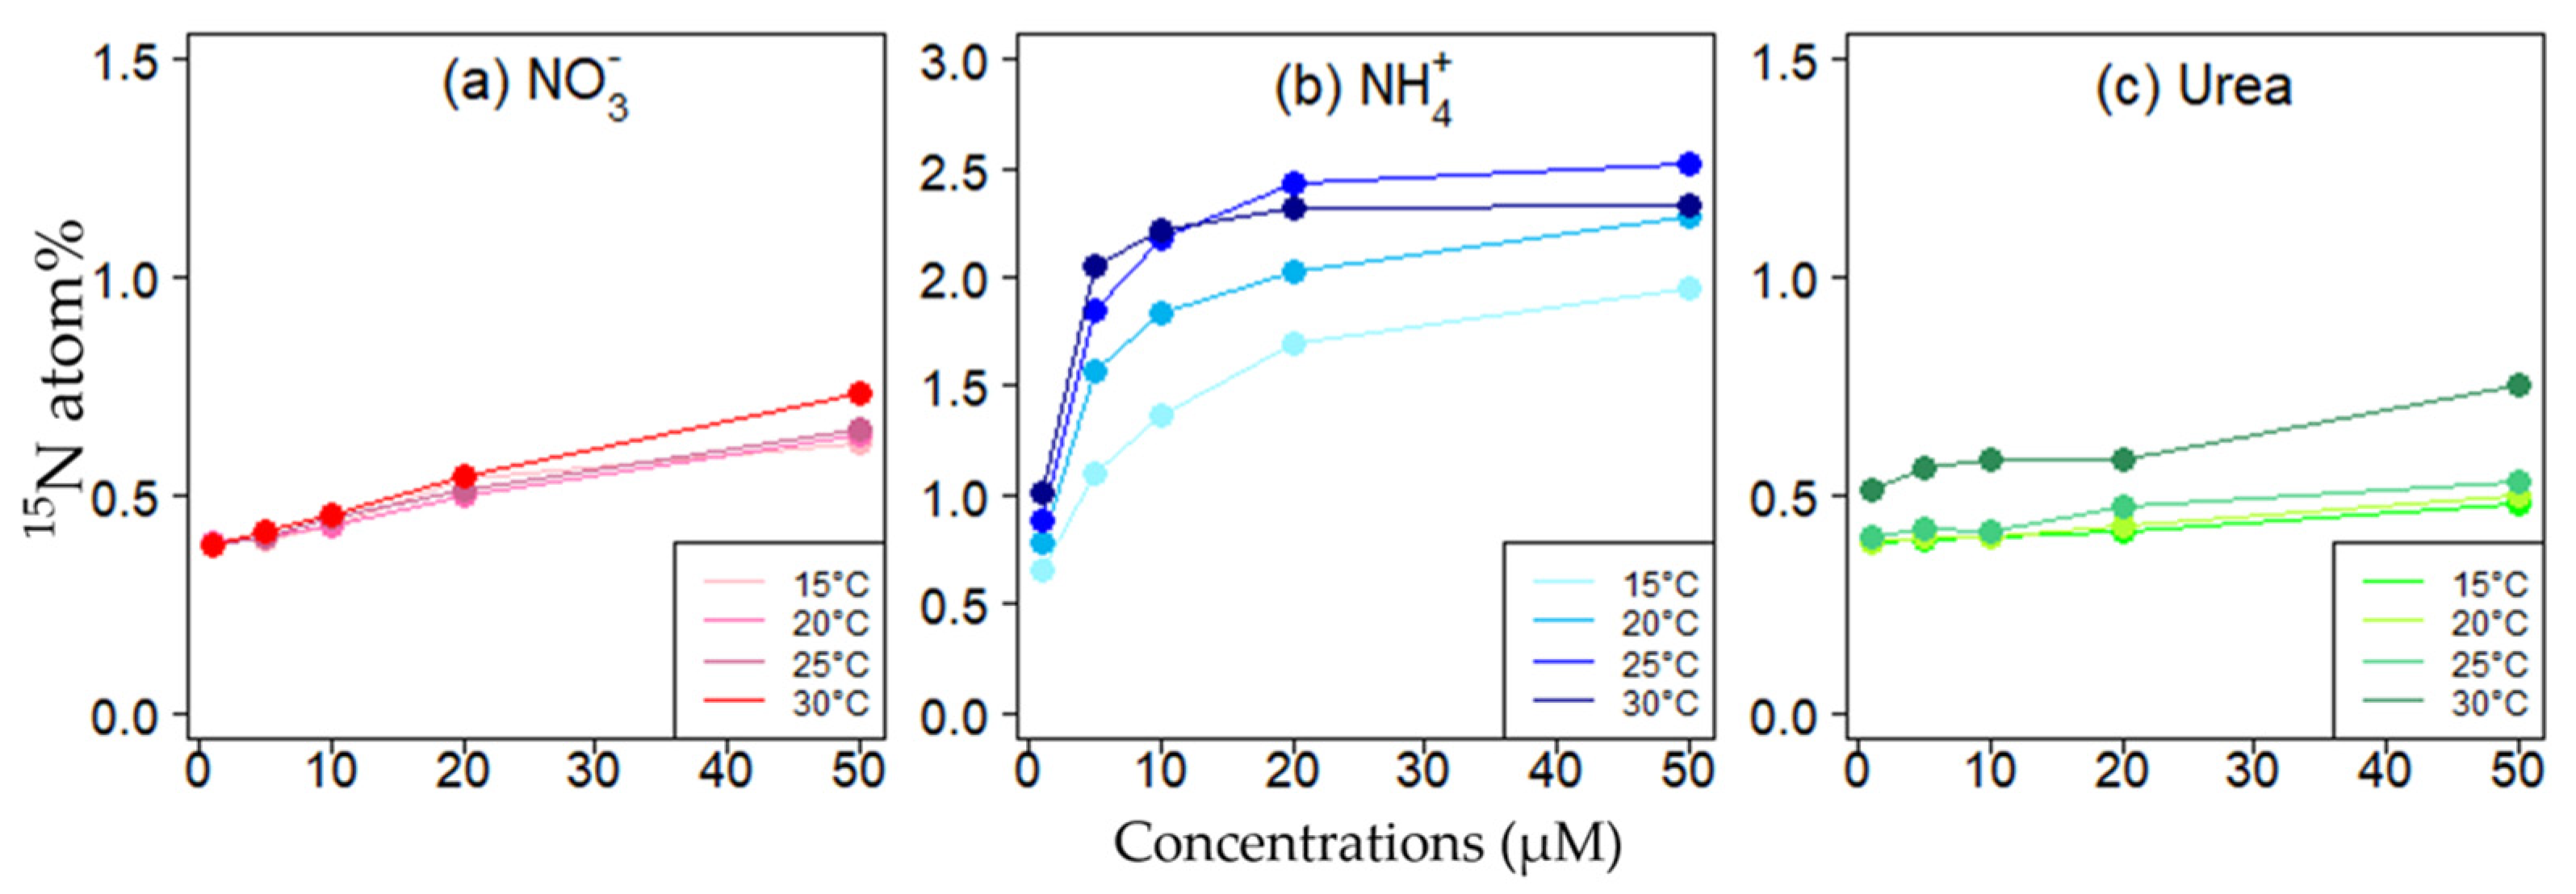
3.5. 15N Isotope Incorporation

The incorporation of 15N (as 15N atom percent) varied with substrate, and temperature. Over the concentration range, the 15N enrichment of NO3 was linear for each temperature, and only a slight, but not significant, increase in 15N incorporation was noted at 30 °C compared to the other temperatures (Figure 7a). Isotopic enrichment levels were highest for NH4+, and all temperatures indicated a saturating response across the concentration gradient. At saturation, the atom % enrichment levels at 25 °C and 30 °C were significantly higher than those measured at 15 °C and 20 °C (Figure 7b). For urea, there was no saturation in the response, but the 15N atom% values across all concentrations were significantly higher at 30 °C than atom% enrichment values at the other temperatures, which did not differ from each other (Figure 7c).

4. Discussion

Light, nutrients, and temperatures drive different rates of metabolism within the cell, and the challenge for the cell is to balance energy and reductant generation with that of its consumption. Here, varying each of these factors in short-term exposures, the dynamic balance between the “push” due to photon flux pressure and the metabolic “pull” of diverse metabolic reactions of K. mikimotoi was investigated (Figure 8). These results are complementary to the dynamic balance theory of photosynthetic regulation [16], which articulated the notion that the concentration of photosynthetic pigments in algae could be explained by the opposing forces of excitation pressure on PSII and degree of reduction of the plastoquinone pool of PSII. Therefore, acclimated pigment concentrations balance the light energy input and biochemical energy use in response to environmental conditions, demonstrating the sensitivity of PSII to metabolic feedback. Once an excitation event occurs in PSII, the downstream redox state determines the electron sink capacity. The redox state around PSII responds rapidly to changes in light availability (and Calvin cycle activity), N reduction and assimilation. Whereas pigment changes with multiple environmental changes were emphasized by Kana et al. [16], in their description of the dynamic balance theory, various fluorescent parameters, including the excitation pressure on PSII, were measured directly herein with changes in light, temperature, and N availability.
The initial hypothesis, that photosynthetic efficiency in K. mikimotoi will increase with temperature and with increasing N concentrations, and that with increasing temperatures, photosynthetic efficiency will increase to a greater extent with increasing concentrations of chemically reduced forms of N, compared to changes with increasing concentrations of NO3, was largely borne out, but the highest temperature tested yielded differential stresses depending on N form. Here, the interactions of the different physiological processes measured are described, as well as implications for growth of Karenia on the West Florida Shelf.

4.1. Temperature, Energy (Light) and Material (N) Addition Effects on Photosynthesis

The biochemical reactions of photosynthetic metabolism are generally considered to be more sensitive to temperature than the light reactions, and increase with temperature up to an optimum temperature, above which they decline rapidly [7,32]. Shen et al. [33] reported for K. mikimotoi that the effective quantum yield, YII (pulsed with 70 µmol photons m−2 s−1), and rETRmax increased from 16–28 °C although only estimates from 16 °C were statistically lower than those measured at 20, 24, and 28 °C. In this study, generally the maximum quantum yield, Fv/Fm, increased with temperature at each N form (e.g., 0.41 ± 0.01, 0.43 ± 0.04, 0.45 ± 0.02 at 15, 20, 25 °C, respectively, when cells were NO3-enriched) although differences were statistically not significant in the case of NH4+-enriched cells (Table 2). However, when cells were light saturated, no clear temperature effects were found in rETRmax in the range of 15–25 °C (Table 2). The cultures from Shen et al. [33] were acclimated to each temperature while our cultures were adapted to 20 °C and exposed to new thermal environments for 1 h. The optimal temperature for maximum photosynthetic rate can increase with increasing growth temperature [34]. At 30 °C, all photosynthetic parameters dropped significantly, suggesting that even a 1 h exposure to this temperature was stressful for K. mikimotoi. Note that herein additional cultures incubated at 30 °C overnight (no extra N addition) did not survive (data not shown).
At all but the highest temperature tested, with increasing light intensity, i.e., increasing “push” due to photon flux pressure (Figure 8), rETR increased progressively until the PSII was saturated with light (Ik) (Figure 4). Although the efficiency of photochemical light capture, YII, decreased with increasing irradiance (Figure 3), enhanced photon flux pressure on PSII increased the quantity of energy channeling to photochemistry, thus, increasing the rETR until Ik. At a given irradiance, rETR increased further with increasing N concentrations. Even though cultures were N-sufficient, photosynthetic activity increased with all forms of N addition when temperature was not at a stressful level (Figure 4). The increased supply of material (N in this case) enhanced metabolic activity, thus raising the demand for energy to run diverse metabolism (“pull” due to demand) (Figure 8). This enhancement was stronger when cells were light saturated. The rETRmax clearly responded to increasing N addition with little variations at 15–25 °C (Figure 5). The dark-adapted fluorescence parameter, Fv/Fm, was also generally increased with all forms of N addition (Figure 2).

4.2. N Form Effects on Photosynthesis at 30 °C

When temperature was not at a stressful level, K. mikimotoi was able to operate its photosynthetic apparatus efficiently with all forms of N tested in this study. However, at 30 °C, cells were dissipating most of their absorbed light energy non-photochemically, but at different degrees depending on N form. At the highest temperature, reaction centers were fully closed for the NO3 and NH4+ treatments across most irradiance levels (Figure 6j,k). The NO3-enriched culture showed the strongest stress (Fv/Fm = 0.02, rETRmax = 0.9), and then NH4+-enriched cells (Fv/Fm = 0.07, rETRmax = 2.4; Table 2). Fluorescence parameters were still significantly lower at this high temperature compared to those at 15–25 °C, but when cells were treated with urea, K. mikimotoi experienced less stress than those cells enriched with NO3 and NH4+ (Fv/Fm = 0.17, rETRmax = 3.1), implying that urea might induce a photoprotective mechanism.
The 15N isotope enrichment trends confirmed the differential effects of temperature with the different forms of N (Figure 7). Little effect of temperature was observed with 15NO3 incorporation, but with 15NH4+, incorporation increased as temperatures rose, and for urea, the highest temperature uniquely yielded the highest isotopic incorporation. Such trends would support the different responses seen in Fv/Fm and rETR with the different N enrichments.
Although K. mikimotoi has been known to use diverse forms of N, the underlying mechanisms for metabolizing each N form are complex with respect to temperature. The inhibition of NR activity at higher temperatures might hinder the first step of NO3 metabolism, reduction to NO2 [7], thereby decreasing subsequent intracellular N supply. Dai et al. [35] reported that K. mikimotoi grown on NO3 could not survive at 30 °C and NR activity was significantly inhibited at this temperature compared to 15–25 °C. On the other hand, the metabolic flux of reduced forms of N such as NH4+ and urea is expected to be higher at higher temperatures [7]. For example, at higher temperatures, the activity of GS that adds NH4+ to glutamate by using ATP to produce glutamine increases. Moreover, the activity of GOGAT that combines glutamine to 2-oxoglutarate using electrons can be higher at 30 °C compared to activity rates at lower temperatures [7,36]. All energy-consuming metabolism will increase the energy demand, thereby enhancing the capacity of photochemical use of absorbed light energy. This might partly explain why NH4+-treated sample showed four times higher Fv/Fm and three times higher rETRmax compared to NO3-treated cells at 30 °C (Figure 2 and Figure 5, Table 2). However, cells enriched with urea showed even higher estimates, implying that energy demand for metabolism could be relatively higher. Dinoflagellates have a urea cycle that helps reallocation of intracellular C and N [36] and several enzymes involved in the urea cycle have been identified in K. mikimotoi, suggesting that this species could also have a complete urea cycle [37]. The increased intracellular recycling of C and N from protein catabolism and photorespiration through the urea cycle could enhance overall metabolic flux, thus increasing the demand for chemical energy. To balance this demand, a higher proportion of absorbed light energy could be funneled into photochemistry, therefore increasing Fv/Fm and rETR. Moreover, generally, urease, which catalyzes the hydrolysis of urea, has a positive relationship with temperature [13,38].

4.3. Implications of Temperature Effects for Natural Assemblages

In the field, K. mikimotoi has been observed over a wide range of temperatures, 4–31 °C although some subspecies have narrower temperature ranges (e.g., Norway isolate: 10–25 °C) [1,2,39]. In culture experiments, it has been shown that K. mikimotoi cells can survive and grow well at 16, 20, 24, 28 °C [33,40], but not at 10 and 30 °C [35], suggesting that K. mikimotoi would have a relatively narrow optimum temperature for their growth [1,40]. In general, rising temperatures accelerate enzymatic reactions by increasing the proportions of molecules that have sufficient kinetic energy to react, thus increasing overall metabolic flux (the “pull” due to demand) (Figure 8) [41,42]. Indeed, the maximum specific growth rates were observed at 24 °C and 25 °C in the previously cited studies [33,35].
Karenia blooms that primarily occurs in the fall months rarely persist throughout hot summer months on the West Florida Shelf. The summers—during which water can >30 °C—may represent a thermal barrier for large blooms to be maintained. However, Karenia cells are occasionally found to sustain substantial blooms in extremely hot surface waters (>30 °C). Generally, West Florida Shelf is characterized by low ambient dissolved inorganic nutrients, but elevated nutrients, especially dissolved organic nutrients (e.g., urea) can occur nearshore [23]. Urea has been widely used as a fertilizer within Florida and some of this nutrient can be delivered to nearshore [43]. This raises the possibility that high temperature stress might be alleviated when urea is available because more photons can be processes photochemically, thus cells can operate photosynthesis more efficiently in very warm conditions with reduced organic nitrogen. Therefore, increased availability of urea might be able to support maintaining Karenia blooms under short-term heat stress.

Supplementary Materials

The following are available online at https://www.mdpi.com/article/10.3390/phycology2010002/s1 Figure S1: Quantum yield of regulated non-photochemical energy dissipation, YNPQ, as a function of irradiance for K. mikimotoi exposed to different temperatures (15, 20, 25, 30 °C) when pulsed with different nitrogen forms (NO3, NH4+, urea) and amounts (1, 5, 10, 20, 50 µM). Within each depicted irradiance level, the darker the color of the bars, the higher the enrichment with added N. YNPQ represents energy loss of excitation energy thorough harmless heat dissipation related to non-photochemical quenching, Figure S2: Quantum yield of non-regulated non-photochemical energy dissipation, YNO as a function of irradiance for K. mikimotoi exposed to different temperatures (15, 20, 25, 30 °C) when pulsed with different nitrogen forms (NO3, NH4, urea) and amounts (1, 5, 10, 20, 50 µM). Within each depicted irradiance level, the darker the color of the bars, the higher the enrichment with added N. YNO represents the sum of non-regulated heat dissipation and fluorescence emission (“primarily constitutive losses”), Table S1: Original data of YII, YNPQ, YNO, 1-qP, and rETR, Table S2: rETR parameters, including initial slope of the light curve, alpha; saturation irradiance, Ik; rETRmax and, photoinhibition parameter, beta, as calculated using the R package ‘phytotools’.

Author Contributions

Conceptualization, S.H.A. and P.M.G.; methodology, S.H.A. and P.M.G.; formal analysis, S.H.A.; investigation, S.H.A. and P.M.G.; resources, P.M.G.; data curation, S.H.A.; writing—original draft preparation, S.H.A.; writing—review and editing, S.H.A. and P.M.G.; supervision, P.M.G.; project administration, P.M.G.; funding acquisition, P.M.G. All authors have read and agreed to the published version of the manuscript.

Funding

This study was funded by the NOAA National Centers for Coastal Ocean Science Competitive Research under award NA19NOS4780183.

Institutional Review Board Statement

Not applicable.

Informed Consent Statement

Not applicable.

Data Availability Statement

The data are contained within the article or Supplementary Material.

Acknowledgments

The authors thank Cynthia Heil and Stacie Flood (Mote Marine Laboratory) for assistance with culture growth, and Todd Kana (Bay Instruments LLC) for assistance with customizing the temperature units for incubation and for use of the Imaging PAM. This is Contribution number 6078 from the University of Maryland Center for Environmental Science and 1006 from the NOAA ECOHAB Program.

Conflicts of Interest

The authors declare no conflict of interest.

References

  1. Brand, L.E.; Campbell, L.; Bresnan, E. Karenia: The biology and ecology of a toxic genus. Harmful Algae 2012, 14, 156–178. [Google Scholar] [CrossRef]
  2. Li, X.; Yan, T.; Yu, R.; Zhou, M. A review of karenia mikimotoi: Bloom events, physiology, toxicity and toxic mechanism. Harmful Algae 2019, 90, 101702. [Google Scholar] [CrossRef] [PubMed]
  3. Haywood, A.J.; Steidinger, K.A.; Truby, E.W.; Bergquist, P.R.; Bergquist, P.L.; Adamson, J.; MacKenzie, L. Comparative morphology and molecular phylogenetic analysis of three new species of the genus Karenia (Dinophyceae) from New Zealand. J. Phycol. 2004, 40, 165–179. [Google Scholar] [CrossRef]
  4. Lenes, J.M.; Heil, C.A. A historical analysis of the potential nutrient supply from the N2 fixing marine cyanobacterium Trichodesmium spp. to Karenia brevis blooms in the eastern Gulf of Mexico. J. Plankton Res. 2010, 32, 1421–1431. [Google Scholar] [CrossRef] [Green Version]
  5. Weisberg, R.H.; Zheng, L.; Liu, Y.; Lembke, C.; Lenes, J.M.; Walsh, J.J. Why no red tide was observed on the West Florida Continental Shelf in 2010. Harmful Algae 2014, 38, 119–216. [Google Scholar] [CrossRef]
  6. Weisberg, R.H.; He, R. Local and deep-ocean forcing contributions to anomalous water properties on the West Florida Shelf. J. Geophys Res. Oceans 2003, 108, 3184. [Google Scholar] [CrossRef]
  7. Glibert, P.M.; Wilkerson, F.P.; Dugdale, R.C.; Raven, J.A.; Dupont, C.L.; Leavitt, P.R.; Parker, A.E.; Burkholder, J.M.; Kana, T.M. Pluses and minuses of ammonium and nitrate uptake and assimilation by phytoplankton and implications for productivity and community composition, with emphasis on nitrogen-enriched conditions. Limnol. Oceanogr. 2016, 61, 165–197. [Google Scholar] [CrossRef]
  8. Gao, Y.; Smith, G.J.; Alberte, R.S. Nitrate reductase from the marine diatom Skeletonema costatum (biochemical and immunological characterization). Plant Physiol. 1983, 103, 1437–1445. [Google Scholar] [CrossRef] [Green Version]
  9. Kristiansen, S. The temperature optimum of the nitrate reductase assay for marine phytoplankton. Limnol. Oceanogr. 1983, 28, 776–780. [Google Scholar] [CrossRef]
  10. Lomas, M.W.; Glibert, P.M. Temperature regulation of nitrate uptake: A novel hypothesis about nitrate uptake and reduction in cool-water diatoms. Limnol. Oceanogr. 1999, 44, 556–572. [Google Scholar] [CrossRef]
  11. Lomas, M.W.; Glibert, P.M. Interactions between NH4+ and NO3 uptake and assimilation: Comparison of diatoms and dinoflagellates at several growth temperatures. Mar. Biol. 1999, 133, 541–551. [Google Scholar] [CrossRef]
  12. Clayton, J.R., Jr.; Ahmed, S.I. Detection of glutamate synthase (GOGAT) activity in phytoplankton: Evaluation of cofactors and assay optimization. Mar. Ecol. Prog. Ser. 1986, 32, 115–122. [Google Scholar] [CrossRef]
  13. Fan, C.; Glibert, P.M.; Alexander, J.; Lomas, M.W. Characterization of urease activity in three marine phytoplankton species, Aureococcus anophagefferens, Prorocentrum minimum, and Thalassiosira weissflogii. Mar. Biol. 2003, 142, 949–958. [Google Scholar] [CrossRef]
  14. Genty, B.; Briantais, J.; Baker, N.R. The relationship between the quantum yield of photosynthetic electron transport and quenching of chlorophyll fluorescence. Biochim. Biophys. Acta 1989, 990, 87–92. [Google Scholar] [CrossRef]
  15. Murchie, E.H.; Lawson, T. Chlorophyll fluorescence analysis: A guide to good practice and understanding some new applications. J. Exp. Bot. 2013, 64, 3983–3998. [Google Scholar] [CrossRef] [Green Version]
  16. Kana, T.M.; Geider, R.J.; Critchley, C. Regulation of photosynthetic pigments in micro-algae by multiple environmental factors: A dynamic balance hypothesis. New Phytol. 1997, 137, 629–638. [Google Scholar] [CrossRef]
  17. Ras, M.; Steyer, J.; Bernard, O. Temperature effect on microalgae: A crucial factor for outdoor production. Rev. Environ. Sci. Bio. 2013, 12, 153–164. [Google Scholar] [CrossRef] [Green Version]
  18. Peers, G.; Truong, T.B.; Ostendorf, E.; Busch, A.; Elrad, D.; Grossman, A.R.; Hippler, M.; Niyogi, K.K. An ancient light-harvesting protein is critical for the regulation of algal photosynthesis. Nature 2009, 462, 518–521. [Google Scholar] [CrossRef]
  19. Perozoni, F.; Beghini, G.; Cazzaniga, S.; Ballottari, M. Clamydomonas reinhardtii LHCSR1 and LHCSR3 proteins involved in photoprotective non-photochemical quenching have different quenching efficiency and different carotenoid affinity. Sci. Rep. 2020, 10, 21957. [Google Scholar] [CrossRef]
  20. Huang, K.; Feng, Q.; Zhang, Y.; Ou, L.; Cen, J.; Lu, S.; Qi, Y. Comparative uptake and assimilation of nitrate, ammonium, and urea by dinoflagellate Karenia mikimotoi and diatom Skeletonema costatum s.l. in the coastal waters of the East China Sea. Mar. Pollut. Bull. 2020, 155, 111200. [Google Scholar] [CrossRef]
  21. Zhang, Q.; Rencheng, Y.; Jiangjing, S.; Tian, Y.; Yunfeng, W.; Mingjiang, Z. Will harmful dinoflagellate Karenia mikimotoi grow phagotrophically? Chin. J. Oceanol. Limn. 2011, 29, 849–859. [Google Scholar] [CrossRef]
  22. Zhang, Q.; Song, J.; Yu, R.; Yan, T.; Wang, Y.; Kong, F.; Zhou, M. Roles of mixotrophy in blooms of different dinoflagellates: Implications from the growth experiment. Harmful Algae 2013, 30, 10–26. [Google Scholar] [CrossRef]
  23. Heil, C.A.; Dixon, L.K.; Hall, E.; Garrett, M.; Lenes, J.M.; O’Neil, J.M.; Walsh, B.M.; Bronk, D.A.; Killberg-Thoreson, L.; Hitchcock, G.L.; et al. Blooms of Karenia brevis (Davis) G. Hansen & Ø. Moestrup on the West Florida Shelf: Nutrient sources and potential management strategies based on a multi-year regional study. Harmful Algae 2014, 38, 127–140. [Google Scholar]
  24. Glibert, P.M.; Burkholder, J.M.; Kana, T.M.; Alexander, J.; Skelton, H.; Shilling, C. Grazing by Karenia brevis on Synechococcus enhances its growth rate and may help to sustain blooms. Aquat. Microb. Ecol. 2009, 44, 17–30. [Google Scholar] [CrossRef] [Green Version]
  25. Jeong, H.J.; Park, J.Y.; Nho, J.H.; Park, M.O.; Ha, J.H.; Seong, K.A.; Jeng, C.; Seong, C.N.; Lee, K.Y.; Yih, W.H. Feeding by red-tide dinoflagellates on the cyanobacterium Synechococcus. Aquat. Microb. Ecol. 2005, 41, 131–143. [Google Scholar] [CrossRef] [Green Version]
  26. Guillard, R.R. Culture of phytoplankton for feeding marine invertebrates. In Culture of Marine Invertebrate Animals; Smith, W.L., Chanley, M.H., Eds.; Plenum Press: New York, NY, USA, 1975; pp. 29–60. [Google Scholar]
  27. Schreiber, U.; Bilger, W.; Neubauer, C. Chlorophyll fluorescence as a non-intrusive indicator for rapid assessment of in vivo photosynthesis. In Ecophysiology of Photosynthesis; Schulze, E., Caldwell, M.M., Eds.; Springer: Berlin/Heidelberg, Germany, 1994; pp. 49–70. [Google Scholar]
  28. Kramer, D.M.; Johnson, G.; Kiirats, O.; Edwards, G.E. New fluorescence parameters for the determination of QA redox state and excitation energy fluxes. Photosynth. Res. 2004, 79, 209–218. [Google Scholar] [CrossRef] [PubMed]
  29. Platt, T.; Gallegos, C.L.; Harrison, W.G. Photoinhibition of photosynthesis in natural assemblages of marine phytoplankton. J. Mar. Res. 1980, 38, 687–701. [Google Scholar]
  30. Maxwell, K.; Johnson, G. Chlorophyll fluorescence-a practical guide. J. Exp. Bot. 2000, 51, 659–668. [Google Scholar] [CrossRef] [PubMed]
  31. Glibert, P.M.; Middelburg, J.J.; McClelland, J.W.; Zanden, M.J.V. Stable isotope tracers: Enriching our perspectives and questions on sources, fates, rates, and pathways of major elements in aquatic systems. Limnol. Oceanogr. 2019, 64, 950–981. [Google Scholar] [CrossRef] [Green Version]
  32. Padfield, D.; Yvon-Durocher, G.; Buckling, A.; Jennings, S.; Yvon-Durocher, G. Rapid evolution of metabolic traits explains thermal adaptation in phytoplankton. Ecol. Lett. 2015, 19, 133–142. [Google Scholar] [CrossRef] [Green Version]
  33. Shen, A.; Ma, Z.; Jiang, K.; Li, D. Effects of temperature on growth, photophysiology, Rubisco gene expression in Prorocentrum donghaiense and Karenia mikimotoi. Ocean Sci. J. 2016, 51, 581–589. [Google Scholar] [CrossRef]
  34. Hikosaka, K.; Ishikawa, K.; Borjigidal, A.; Muller, O.; Onoda, Y. Temperature acclimation of photosynthesis: Mechanisms involved in the changes in temperature dependence of photosynthetic rate. J. Exp. Bot. 2006, 57, 291–302. [Google Scholar] [CrossRef] [PubMed] [Green Version]
  35. Dai, A.Q.; Shi, X.Y.; Ding, Y.Y.; Tang, H.J.; Wang, L.S.; Wang, X.L. Effects of temperature on the growth and nitrate reductase activity of Chaetoceros curvisetus and Karenia mikimotoi. Prog. Biochem. Biophys. 2014, 41, 896–9003. [Google Scholar]
  36. Dagenais-Bellefeuille, S.; Morse, D. Putting N in dinoflagellates. Front. Microbiol. 2013, 4, 369. [Google Scholar] [CrossRef] [Green Version]
  37. Shi, X.; Xiao, Y.; Liu, L.; Xie, Y.; Ma, R. Transcriptome responses of the dinoflagellate Karenia mikimotoi driven by nitrogen deficiency. Harmful Algae 2021, 103, 101977. [Google Scholar] [CrossRef]
  38. Solomon, C.M.; Collier, J.L.; Berg, G.M.; Glibert, P.M. Role of urea in microbial metabolism in aquatic systems: A biochemical and molecular review. Aquat. Microb. Ecol. 2010, 59, 67–88. [Google Scholar] [CrossRef]
  39. Gentien, P. Bloom dynamics and ecophysiology of the Gymnodinium mikimotoi species complex. In Physiological Ecology of Harmful Algal Blooms; Anderson, D.M., Cembella, A.D., Hallegraeff, G.M., Eds.; Springer: Berlin/Heidelberg, Germany, 1998; pp. 155–173. [Google Scholar]
  40. Shen, A.; Yuan, X.; Liu, G.; Li, D. Growth interactions between the bloom-forming dinoflagellates Prorocentrum donghaiense and Karenia mikimotoi under different temperature. Thalassas 2014, 30, 33–45. [Google Scholar]
  41. Eppley, R.W. Temperature and phytoplankton growth in the sea. Fish. Bull. 1972, 70, 1063–1085. [Google Scholar]
  42. Marañón, E.; Lorenzo, M.P.; Cermeño, P.; Mouriño-Carballido, B. Nutrient limitation suppresses the temperature dependence of phytoplankton metabolic rates. ISME J. 2018, 12, 1836–1845. [Google Scholar] [CrossRef] [Green Version]
  43. Glibert, P.M.; Harrison, J.; Heil, C.; Seitzinger, S. Escalating worldwide use of urea—A global change contributing to coastal eutrophication. Biogeochemistry 2006, 77, 441–463. [Google Scholar] [CrossRef]
Figure 1. Schematic of the experimental design to measure 15N incorporation and photosynthesis-irradiance responses of K. mikimotoi exposed to different temperatures, N forms, and concentrations. Green tubes represent those enriched with urea; blue tubes—those enriched with NH4+; and red tubes—those enriched with NO3.
Phycology 02 00002 g001
Figure 2. Maximum photosystem II photochemical efficiency, Fv/Fm, of K. mikimotoi exposed to different temperatures (15, 20, 25, 30 °C) when pulsed with different nitrogen forms (NO3, NH4+, urea) and amounts (1, 5, 10, 20, 50 µM-N). Within each depicted temperature, the darker the color of the bars, the higher the enrichment with added N.
Phycology 02 00002 g002
Figure 3. Effective Photosystem II photochemical efficiency, YII, as a function of irradiance for K. mikimotoi exposed to different temperatures (15, 20, 25, 30 °C) when pulsed with different nitrogen forms (NO3, NH4+, urea) and amounts (1, 5, 10, 20, 50 µM-N). Within each depicted irradiance level, the darker the color of the bars, the higher the enrichment with added N.
Phycology 02 00002 g003
Figure 4. The rapid light responses of rETR of K. mikimotoi exposed to different temperatures (15, 20, 25, 30 °C) when pulsed with different nitrogen forms (NO3, NH4+, urea) and amounts (1, 5, 10, 20, 50 µM-N). For each depicted ETR curve, the darker the color of the lines, the higher the enrichment with added N.
Phycology 02 00002 g004
Figure 5. The rETRmax of K. mikimotoi exposed to different temperatures (15, 20, 25, 30 °C) when pulsed with different nitrogen forms (NO3, NH4+, urea) and amounts (1, 5, 10, 20, 50 µM). Within each depicted temperature, the darker the color of the bars, the higher the enrichment with added N.
Phycology 02 00002 g005
Figure 6. The extent of PSII reaction center closures, 1-qP, as a function of irradiance for K. mikimotoi exposed to different temperatures (15, 20, 25, 30 °C) when pulsed with different nitrogen forms (NO3, NH4+, urea) and amounts (1, 5, 10, 20, 50 µM-N). Within each depicted irradiance level, the darker the color of the bars, the higher the enrichment with added N.
Phycology 02 00002 g006
Figure 7. Atom percent enrichment of 15N for K. mikimotoi exposed to different temperatures (15, 20, 25, 30 °C) when pulsed with different nitrogen forms (NO3, NH4+, urea) and amounts (1, 5, 10, 20, 50 µM-N). For each depicted curve, the darker the color of the lines, the higher the enrichment with added N. Note that the scale of Y-axis is different.
Phycology 02 00002 g007
Figure 8. Conceptual figure representing push and pull of energy during photosynthesis and metabolic reactions associated with C and N assimilation.
Phycology 02 00002 g008
Table 1. Analysis of variance (ANOVA) results testing N form effects at each temperature.
ANOVA (N form Effects)
Fv/FmrETRmax
F(df = 2)p-valueF (df = 2)p-value
15 °C1.3290.3014.9010.028
20 °C0.3290.7263.9420.048
25 °C1.3610.2933.2380.075
30 °C25.58<0.00112.850.001
Table 2. The averaged Fv/Fm and rETRmax (note that only the statistical results for the ANOVA at 15, 20, 25 oC are shown here). Significant results are shown in bold.
NO3NH4+Urea
Fv/FmrETRmaxFv/FmrETRmaxFv/FmrETRmax
15 °C0.41 ± 0.0111.2 ± 2.00.43 ± 0.0315.6 ± 3.00.43 ± 0.0214.1 ± 1.6
20 °C0.43 ± 0.0311.6 ± 1.40.44 ± 0.0314.0 ± 1.70.42 ± 0.0214.1 ± 1.7
25 °C0.45 ± 0.0210.1 ± 2.20.47 ± 0.0213.0 ± 2.00.46 ± 0.0112.7 ± 1.8
30 °C0.02 ± 0.030.9 ± 0.80.07 ± 0.032.4 ± 0.70.17 ± 0.043.1 ± 0.6
ANOVA (temperature effects at 15–25 °C)
F (df = 2)3.9350.8563.3681.6137.4851.192
p-value0.0490.4490.0690.2400.0080.337
Publisher’s Note: MDPI stays neutral with regard to jurisdictional claims in published maps and institutional affiliations.

