Article

Exploring Interactions Between Pre-Grazing Sward Height and Energy Supplementation on Beef Cattle Responses

by
João Ricardo Rebouças Dórea
1,2,
Diogo Fleury Azevedo Costa
3,4,
Luis Agostinho Neto
3,
Bárbara Martins Brixner
3,
Althieres José Furtado
3,
Vinicius Nunes Gouvêa
5,
Guilherme Lobato Menezes
1,
Sila Carneiro Da Silva
3,
Alexandre Vaz Pires
3 and
Flávio Augusto Portela Santos
3,*
1
Department of Animal and Dairy Sciences, University of Wisconsin-Madison, Madison, WI 53706, USA
2
Department of Biological Systems Engineering, University of Wisconsin-Madison, Madison, WI 53706, USA
3
Department of Animal Science, University of Sao Paulo, Piracicaba 13418-900, SP, Brazil
4
Institute for Future Farming Systems, CQUniversity, Rockhampton, QLD 4701, Australia
5
Texas A&M AgriLife Research, Amarillo, TX 79106, USA
*
Author to whom correspondence should be addressed.
Ruminants 2026, 6(3), 84; https://doi.org/10.3390/ruminants6030084 (registering DOI)
Submission received: 5 August 2026 / Revised: 6 September 2026 / Accepted: 17 September 2026 / Published: 21 September 2026

Simple Summary

Efficient pasture management combined with strategic supplementation can be important tools for improving beef production from tropical grasslands while reducing nutrient losses to the environment. This study investigated whether pasture height and energy supplementation with ground corn influence cattle grazing behavior and feed utilization. Cattle grazed tropical pastures managed at either 25 or 35 cm pre-grazing height and received either no energy supplement or ground corn equivalent to 0.6% of their body weight. Cattle grazing at a 25 cm pre-grazing height consumed more forage and nutrients and spent less effort searching for grazing stations. Providing ground corn reduced forage intake but increased total feed intake and the amount of feed digested. Supplementation also improved nitrogen utilization, increasing nitrogen retention by the animal and reducing urinary nitrogen losses. These strategies can help farmers increase the efficiency and sustainability of beef production from intensively managed tropical pastures.

Abstract

This study evaluated the interaction between energy supplementation and pre-grazing sward height on grazing behavior, nutrient intake, digestion, and nitrogen metabolism of cattle. Eight rumen-cannulated Nellore steers (24 mo; 343 ± 7.4 kg BW) grazed palisade grass (Urochloa brizantha cv. Marandu) managed at 25 or 35 cm pre-grazing height until a 15 cm post-grazing target. Treatments were arranged in a 2 × 2 factorial structure: two sward heights and two supplementation levels (mineral supplement only or ground corn at 0.6% BW, DM basis). The experiment was conducted as two replicated 4 × 4 Latin squares, with eight animals, four treatments, and four experimental periods. An interaction (p = 0.02) showed that supplementation reduced grazing time only at 35 cm. Steers grazing 25 cm swards spent less time grazing, rested more, took fewer steps, had higher bite rates, and consumed more forage (p < 0.05). Supplementation reduced forage intake but increased total DM intake, improved forage NDF and total DM digestibility, increased microbial protein synthesis, enhanced nitrogen retention, reduced ruminal ammonia-N, urinary N losses, and the acetate:propionate ratio (p ≤ 0.05). Steers grazing 25 cm swards also exhibited greater ruminal ammonia-N, urinary N excretion, and nitrogen retention. Managing pastures at 25 cm improved forage harvesting efficiency, while energy supplementation enhanced rumen fermentation, nitrogen utilization, and overall grazing efficiency, with potential environmental benefits.

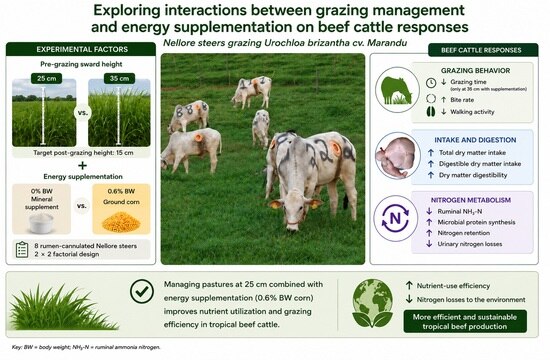
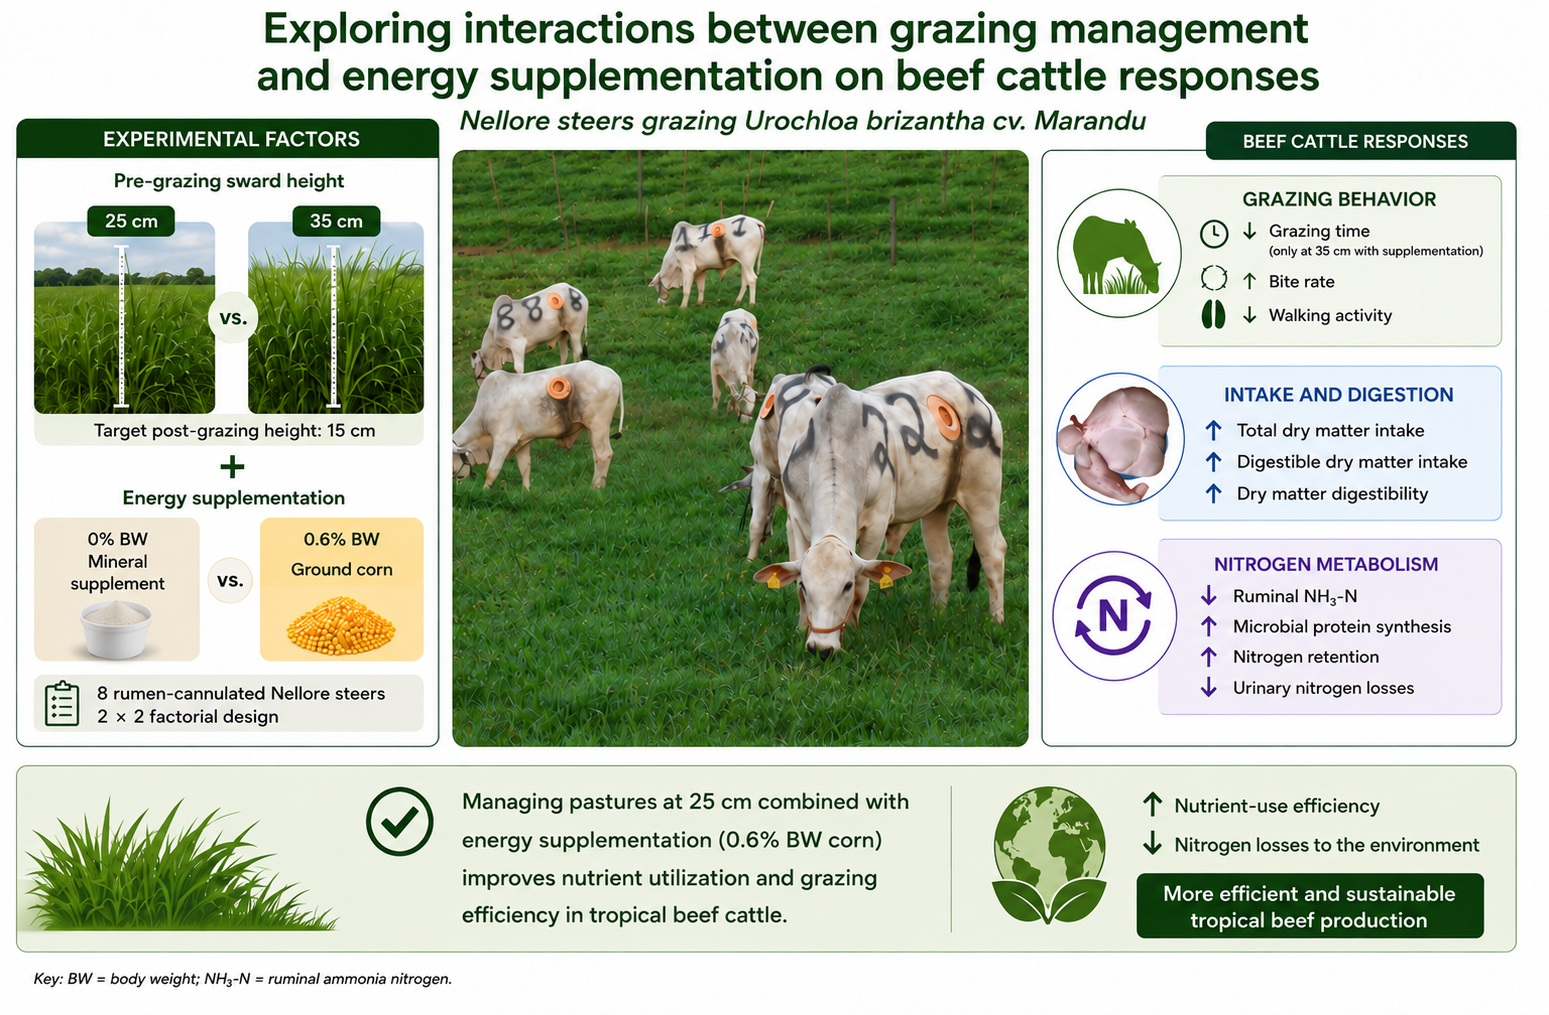
Graphical Abstract

1. Introduction

Forage intake in ruminants is primarily regulated by two mechanisms: (1) the physical limitation imposed by rumen fill when consuming low-quality forages, and (2) physiological feedback from absorbed nutrients in high-energy diets [1]. In cattle grazing tropical grasses, physical regulation is the predominant mechanism controlling forage intake [2]. However, forage must first be harvested before rumen fill becomes limiting, and the sward structure, including height, density, and leaf-to-stem ratio, strongly influences harvesting efficiency and, consequently, intake [3]. Indeed, Hodgson et al. [4] demonstrated that sward structure can have a greater effect on forage intake than the ruminal regulatory mechanisms described by Conrad et al. [1].
Even under well-managed conditions where tropical pastures present optimal structure and high crude protein (CP) contents, animal performance often remains constrained by energy intake rather than protein supply [5]. This limitation arises from the high fiber content and low particle fragility of tropical forages, which reduce passage rate and increase rumen fill time. Energy supplementation with concentrates can therefore serve as a strategic tool to enhance total energy intake, stocking rate, and animal performance in grazing systems [6].
Dorea et al. [7] evaluated the interaction between a low level (0.3% BW) of ground corn supplementation and sward structure (sward height: 25- and 35 cm) in beef steers grazing high-quality tropical pastures, using the same experimental area, animals, and research team as in the present study, and reported no significant interactions on grazing behavior, intake, or nutrient utilization. In the latter study, supplementation at 0.3% of BW had a similar impact on cattle grazing behavior and intake across contrasting pre-grazing sward heights (25 and 35 cm), even though these heights likely offered different grazing horizons. Because both treatments shared the same post-grazing stubble height (15 cm), animals grazed through canopies with distinct structural arrangements, encountering a higher proportion of stems and less favorable leaf distribution in the taller pastures [7], which would be expected to impose greater challenges to efficient harvesting. Under these conditions, the effect of a higher supplementation level is still unknown. Increasing the supplement to 0.6% of BW, particularly with a high-energy feed such as ground corn, may produce different outcomes by likely amplifying the substitution effect, altering the balance between concentrate and forage intake, and modifying how sward structure influences grazing behavior and energy acquisition. We hypothesized that the use of ground corn as supplement fed at 0.6% BW would increase dietary energy intake and nutrient supply, while potentially reducing forage intake through a greater substitution effect, and that these responses would depend on sward height because differences in sward structure may alter the accessibility and selection of herbage. From a practical perspective, determining whether cattle can maintain or improve nutrient intake and performance with moderate energy supplementation across contrasting sward heights may help define more efficient combinations of supplementation level and pasture management for beef production in well-managed tropical pastures.
Given these findings, higher energy supplementation levels warrant investigation under different sward structures to determine whether increased dietary energy can maximize intake and metabolic efficiency in well-managed pastures. In this context, the objective of the present study was to evaluate the effects of feeding an energy supplement at 0 or 0.6% BW, double the level used by Dorea et al. [7], and its interaction with grazing management on grazing behavior, nutrient intake, and metabolism of beef cattle.

2. Materials and Methods

2.1. Study Site, Animals, and Experimental Area

The study was conducted in Piracicaba, São Paulo, Brazil (22°42′ S, 47°37′ W; 546 m a.s.l.). All experimental procedures involving animals were approved by the Animal Care and Use Committee of the Luiz de Queiroz College of Agriculture, University of São Paulo, and followed institutional and national guidelines for animal welfare.
The experiment was carried out from February to April 2011. Weather data for the experimental period were previously described in detail by Dorea et al. [7]. Eight 24-month-old rumen-cannulated Nellore steers (343 ± 7.4 kg BW) were used. The experimental area comprised 2 ha of palisade grass [Urochloa brizantha (Hochst. ex A. Rich.) Stapf. cv. Marandu] managed under rotational grazing and divided into 16 paddocks (1250 m2 each). A paddock in the current work is defined as an enclosed area of pasture used to manage grazing animals under controlled management conditions. Paddocks were fertilized with 40 kg N/ha per grazing cycle and grazed to a 15 cm post-grazing height. Each grazing cycle corresponded to the interval required for pastures to reach the assigned pre-grazing sward height, allowing multiple grazing events per paddock throughout the study.
To establish consistent differences between treatments, two target pre-grazing sward heights were defined: 25 and 35 cm, corresponding to 95% and 100% light interception, respectively [8]. Sward height was monitored daily (20 readings per paddock) using a ruler and an acetate sheet, following da Silva et al. [9].

2.2. Experimental Treatments and Management

Treatments followed a 2 × 2 factorial arrangement, combining two pre-grazing sward heights (25 and 35 cm) and two energy supplementation levels (0 or 0.6% BW of ground corn; mean particle size = 1.3 mm, as-fed basis). Each height treatment was randomly assigned to eight paddocks. Steers, two per treatment, were allocated by treatment group and grazed together within their assigned paddocks. The eight steers were distributed between two replicated 4 × 4 Latin squares, with four animals per square. Within each experimental period, one steer from each square was assigned to each of the four treatment combinations, and treatment assignments changed between periods according to the Latin-square sequence. Steers receiving the same treatment grazed together in the assigned paddock. Supplemented steers received ground corn individually in the central management area, whereas non-supplemented steers were provided access to empty feed bunks during the same period.
Forage mass and morphological composition were determined at the beginning and end of each grazing cycle. Samples were collected at three random points per paddock using a 0.5 m2 frame, cutting forage to ground level. Pre-grazing forage mass was used to adjust forage allowance to 6% of BW, ensuring consistent forage availability between treatments and eliminating confounding effects on intake, grazing behavior, and occupation period. Additional steers were temporarily introduced to adjust stocking rate as needed. Animals grazed each paddock from its designated pre-grazing height until reaching a 15 cm stubble height, with the occupation period varying according to the type of data collected.
The experimental period lasted 64 days, divided into four 16-day periods. Each period included 8 days for adaptation to treatments and marker dosing, followed by 8 days of sampling: fecal collections (days 9–13), grazing behavior (day 14), blood and urine sampling (day 15), and rumen fluid collection (day 16). Because treatment assignments changed between periods according to the Latin-square design, the first 8 days of each period were used for adaptation to the newly assigned treatment and marker administration. Steers were rotated among new paddocks for each collection phase: fecal sampling (second paddock), behavior observation (third paddock), blood and urine sampling (fourth paddock), and rumen collection (fifth paddock).
All animals had ad libitum access to water and a mineral supplement containing (g/kg): Ca, 60; P, 20; Na, 72; S, 4.2; and (mg/kg): Zn, 1400; Cu, 400; Co, 75; I, 50; Se, 10. Supplemented steers were individually fed daily at 1000–1040 h in a central management area near the paddocks. Non-supplemented steers had access to empty bunks during the same period. This management center was also used for marker infusion and for fecal, blood, urine, and rumen fluid sampling.

2.3. Forage Intake and Apparent Digestibility

The experimental procedures followed the protocol previously described by Dórea et al. [7], with modifications to the supplementation level evaluated in the present study. from fecal output and the estimated digestibility of the forage and supplement. Fecal output was quantified using chromium oxide (Cr2O3) as an external marker. From day 1 through day 13 of each experimental period, 10 g of Cr2O3 were supplied daily to each steer as two 5 g capsules. The capsules were introduced directly into the rumen twice daily, at approximately 1000 and 1700 h, with the morning dose administered immediately after the daily supplementation.
Feces were sampled directly from the rectum twice daily (1000 and 1700 h) on days 9 to 13, yielding approximately 200 g per collection per steer. After collection, samples were oven-dried at 55 °C for 72 h and subsequently ground to pass a 1 mm screen in a Wiley-type mill (MA-680; Marconi Ltd.a., Piracicaba, SP, Brazil). Equal portions from each collection were then combined to obtain a composite sample representative of each steer within each experimental period.
Apparent DM digestibility of the forage and supplement was calculated using indigestible neutral detergent fiber (iNDF) as an internal marker [10,11]. The iNDF content was obtained after 240 h of in situ ruminal incubation using samples incubated in rumen-cannulated steers. Fecal NDF was quantified following the procedures of Van Soest et al. [12], whereas nitrogen concentration was determined by combustion using a Leco FP-528 analyzer (LECO Corp., St. Joseph, MI, USA). The concentrations of the respective nutrients were combined with fecal output estimates to calculate nutrient digestibility.
For chromium analysis, a 0.3 g aliquot of dried feces was subjected to acid digestion with 6 mL of nitric acid and 2 mL of perchloric acid, followed by dilution with deionized water to a final volume of 30 mL [13]. Chromium was quantified by ICP-OES (5110; Agilent Technologies, Santa Clara, CA, USA). Daily fecal output was calculated from the amount of Cr2O3 supplied and its concentration in feces. Forage-derived fecal output was subsequently obtained by correcting total fecal output for the contribution of the supplement, which was estimated from supplement intake and its indigestibility. Forage DMI was then calculated from forage-derived fecal output and forage indigestibility.

2.4. Grazing Behavior

Grazing activity was evaluated on day 14 of each experimental period by four trained observers using continuous visual observations over 24 h. Animal activity was classified as grazing, ruminating, or resting, with grazing encompassing forage searching, prehension, mastication, and swallowing [14]. Observations were recorded at 5 min intervals, and the number of records assigned to each activity was converted to minutes per day according to the observation interval.
Bite rate was assessed by recording the time required for an animal to perform 20 bites, following the procedure described by Penning and Rutter [15]. A feeding station was defined as the area in which successive bites were taken before the animal moved to another location [16]. Mean residence time at a feeding station was calculated from observations of 10 consecutive stations. The number of steps taken between successive feeding stations was also recorded. While at a grazing station, animals remained stationary and therefore did not take steps that could be recorded. Daily step counts were estimated by multiplying the observed step rate between feeding stations by total daily grazing time.

2.5. Feed Sample Collection and Chemical Analysis

Forage availability and sward morphological composition were assessed at each grazing cycle immediately before and after grazing. Three sampling locations were randomly selected within each paddock, and forage was harvested to ground level using a 0.5-m2 frame. The harvested material was weighed, after which a representative 0.5 kg subsample was separated into leaf blades, stems (including leaf sheaths), and dead material. Tissue was classified as dead when more than 50% of its area showed senescence. Samples were subsequently dried at 55 °C for 72 h. Detailed information regarding pre- and post-grazing sward height, forage mass, and morphological composition is available in Dórea et al. [7].
Samples representative of the forage consumed by the animals were obtained from the grazing horizon before animal entry into each paddock during every grazing cycle. The sampled horizon corresponded to 15–25 cm in the 25 cm treatment and 15–35 cm in the 35 cm treatment. At each sampling event, material was collected at three randomly selected locations using a 0.5-m2 frame. Each batch of ground corn supplied to the animals was sampled separately. Feed samples were dried at 55 °C for 72 h and ground to pass a 1 mm screen using a Wiley-type mill (MA-680; Marconi Ltd.a., Piracicaba, SP, Brazil). Samples were subsequently combined by treatment for chemical analysis. Subsamples were further dried at 105 °C for 24 h to determine residual moisture.
Feed nitrogen concentration was quantified by combustion according to the Dumas procedure [17], and crude protein (CP) was estimated by multiplying nitrogen concentration by 6.25. Neutral detergent fiber (NDF), acid detergent fiber (ADF), and lignin were analyzed according to Van Soest et al. [12]. Sodium sulfite was omitted from all fiber analyses, whereas amylase was included only in the analysis of corn samples. Total digestible nutrients (TDN) were estimated according to Weiss et al. [18]. Additional analyses of forage samples included soluble nitrogen [19] and non-protein nitrogen (NPN) [20]. These measurements were used to characterize forage protein according to the Cornell Net Carbohydrate and Protein System [21]. Protein was partitioned into fractions A, B1, B2, B3, and C, while carbohydrate fractions were determined according to the procedures previously described by Dórea et al. [7].

2.6. Microbial Protein Synthesis and Nitrogen Efficiency

Nitrogen intake (NI) was calculated from the contribution of forage and supplement. Nitrogen retention was obtained by subtracting urinary and fecal N losses from total NI, and N retention efficiency was expressed relative to mean NI.
Microbial protein synthesis was estimated from urinary purine derivatives (PD) following Stangassinger et al. [22]. Spot urine was obtained by spontaneous voiding on day 15 of each experimental period, approximately 3 h after supplementation. A 10 mL aliquot of each sample was acidified with 40 mL of 0.036 N H2SO4 to reduce the pH below 3.0 and stored at −20 °C [23]. Creatinine, allantoin, and uric acid were quantified by high-performance liquid chromatography (HPLC; Class-VP, version 5.03; Shimadzu Scientific Instruments Inc., Columbia, MD, USA), according to Pimpa et al. [24], while urinary N was determined by the micro-Kjeldahl procedure [17].
Daily urine volume was estimated from urinary creatinine concentration assuming a creatinine excretion rate of 0.213 mmol/kg BW per day [25]. Purine derivative excretion was calculated from the combined urinary excretion of allantoin and uric acid and expressed as mmol/day. Microbial N flow to the intestine was estimated from absorbed microbial purines using the equations and endogenous PD correction factors proposed by Chen and Gomes [26] for zebu cattle. Microbial efficiency (MicEf) was calculated by dividing microbial protein synthesis (g/day) by total digestible nutrient intake (kg/day) and expressed as g microbial protein/kg total digestible nutrients (TDN).

2.7. Rumen Fluid and Blood Samples

Rumen fluid was sampled for determination of ruminal pH, ammonia-N (N–NH3), and volatile fatty acids (VFA). Sampling was performed on day 16 of each experimental period at 0, 2, 4, 6, and 8 h after supplementation. Approximately 100 mL of fluid was collected from three locations within the ventral sac using a PVC probe equipped with multiple lateral openings and connected to a syringe through an internal hose, as described by Danes et al. [5]. Ruminal pH was measured immediately after collection using a portable pH meter (Digimed DM22; Digicrom Analítica Ltd.a., São Paulo, Brazil). Samples were then frozen at −20 °C until laboratory analysis.
After thawing, rumen fluid was centrifuged at 15,000× g for 30 min at 4 °C. The resulting supernatant was used for VFA determination by gas chromatography [27] and for N–NH3 analysis using the phenol–hypochlorite procedure [28].
Blood was collected from the coccygeal vein on day 15 of each experimental period, 4 h after supplementation, into lithium-heparin vacuum tubes (Vacuette; Greiner Bio-One, Americana, SP, Brazil). Samples were centrifuged at 3000× g for 20 min at 4 °C, and the recovered plasma was stored at −20 °C until analysis. Plasma glucose was measured using an automatic biochemical analyzer (YSI 2700 Select Biochemistry Analyzer; Yellow Springs Instrument Co. Inc., Yellow Springs, OH, USA).

2.8. Statistical Analysis

The study was conducted as a replicated 4 × 4 Latin square, with eight steers assigned to four treatments across four experimental periods. Statistical analyses were conducted using the MIXED procedure of SAS, version 9.4 (SAS Institute Inc., Cary, NC, USA). Forage characteristics, grazing behavior, nitrogen metabolism, blood variables, and microbial protein synthesis were analyzed considering pre-grazing sward height (25 or 35 cm), energy supplementation (0 or 0.6% of BW), and their interaction as fixed effects. Latin square, experimental period, and animal nested within Latin square were included as random effects. For ruminal pH, VFA, and N–NH3, sampling time and its interaction with treatment were additionally included as fixed effects. Latin square, period, and animal nested within Latin square were retained as random effects. Variables measured once within each experimental period contributed one observation per animal × treatment combination. For variables repeatedly measured over time, an AR(1) covariance structure was selected according to the Akaike information criterion [29]. Least-squares means were compared using Tukey’s adjustment, and effects were considered statistically significant when p ≤ 0.05.

3. Results and Discussion

The chemical composition of the experimental pastures and concentrate (Table 1), and the forage mass and morphological composition of pastures have been described previously by Dórea et al. [7], as both studies were conducted concomitantly using the same experimental area and animals. The characterization of pastures indicated that morphological composition of pastures managed at a pre-grazing height of 25 cm (95% light interception) had a greater proportion of leaf blades (44.4 vs. 38.0% of DM), which was reflected in their nutritional value, with lower NDF concentration (58.8 vs. 63.4% of DM), higher crude protein concentration (13.9 vs. 11.0% of DM), and greater total digestible nutrients (57.3 vs. 54.9% of DM) than pastures managed at 35 cm. Protein fraction composition was broadly similar between treatments, although the 25 cm sward contained a greater proportion of the rapidly degradable B1 fraction (12.7 vs. 7.6% of CP) and a lower proportion of the B2 fraction (37.8 vs. 49.6% of CP) [7].

3.1. Grazing Behavior

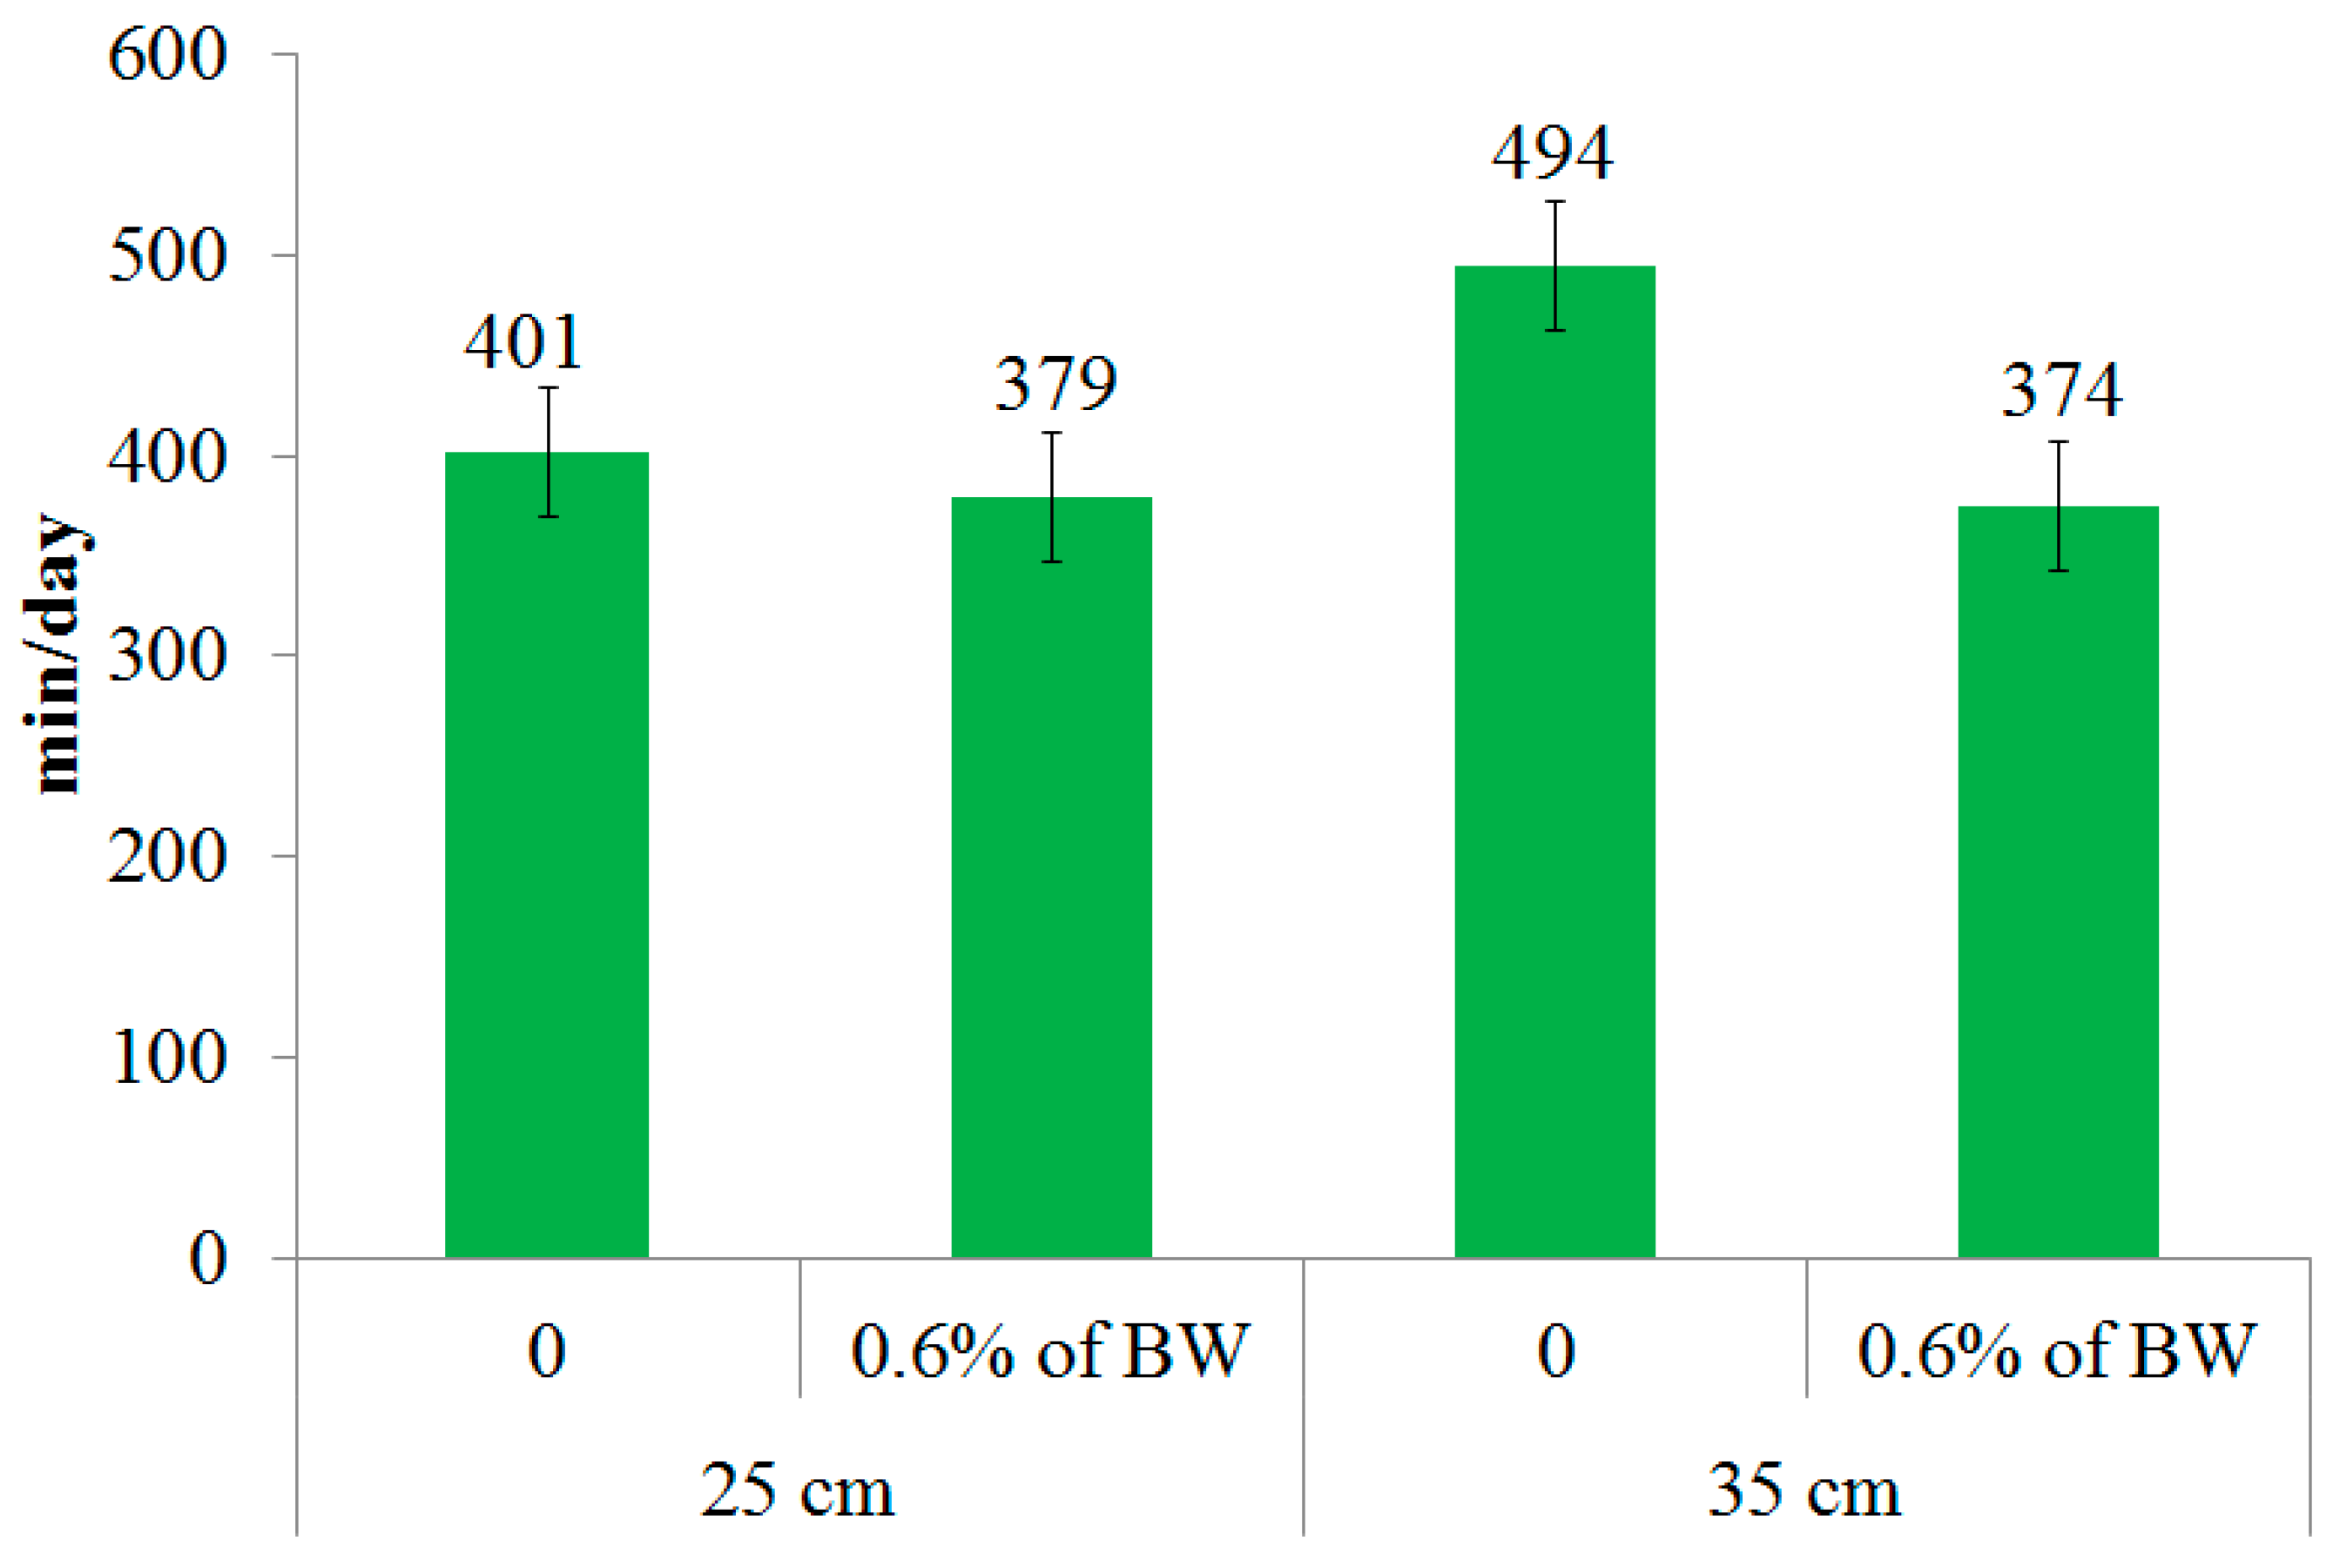
An interaction between grazing management and energy supplementation was observed only for grazing time (p = 0.02; Table 2; Figure 1). Steers grazing pastures managed at a 35 cm pre-grazing sward height reduced their grazing time by 24.3% (from 494 to 374 min/d; p < 0.05) when supplemented with 0.6% of BW. In contrast, supplementation did not affect grazing time for animals grazing at the 25 cm sward height. Dorea et al. [7] also reported a reduction in grazing time with lower supplementation levels (0.3% BW), although the interaction between supplementation and grazing height was not significant. Together, these results suggest that when a greater amount of concentrate (0.6% BW) is provided, particularly in pastures of lower nutritive value, animals compensate by decreasing the time spent grazing, likely partially substituting pasture intake with concentrate to meet energy requirements more efficiently.
It is important to note, however, that the pasture managed at a 35 cm sward height would not be characterized as having low nutritive value based on its chemical composition (CP = 11.0%, NDF = 63.4%, iNDF = 3%). Nonetheless, the taller canopy, 10 cm higher than the 25 cm treatment, imposed a harvesting constraint due to its structural characteristics, which hindered forage prehension and manipulation [30]. This physical limitation likely contributed to the observed reductions in bite rate and increases in the number of feeding stations and steps between them. Under such structural conditions, where harvesting efficiency rather than nutritive value restricts intake, the animals did not exhibit the same compensatory behavioral response observed under more optimal grazing conditions (25 cm sward height) when rapidly digestible energy was provided as a supplement at 0.6% BW.
In tropical grasses, high fiber content and low particle fragility are the primary factors contributing to rumen fill, which physically limits forage intake [31]. Nevertheless, sward structure also plays a critical role in determining harvesting efficiency and intake [4]. In the present study, cattle grazing at a 25 cm sward height spent 21% more time resting (p = 0.01), had 51.5% higher bite rates (p = 0.04), and took 31.3% fewer steps between feeding stations, resulting in 22.9% fewer total daily steps compared with those grazing at 35 cm (Table 2). Similar findings were reported by Dorea et al. [7], reinforcing the consistent influence of sward height and structural characteristics on grazing behavior. The lower bite rate and increased number of steps between feeding stations observed in animals grazing taller (35 cm) pastures indicate that these animals spent more time searching for suitable feeding sites, reflecting greater selectivity and higher foraging effort in response to reduced forage accessibility and nutritive value.
The grazing behavior of supplemented animals was also altered with the inclusion of 0.6% BW of concentrate. In this study, supplemented steers showed a 20% reduction in steps between feeding stations, a 21% decrease in steps per minute, and a 33% decrease in total daily steps compared with non-supplemented animals. These changes indicate that non-supplemented animals needed to visit more feeding stations and travel longer distances to meet their energy requirements. Our findings agree with those of Glienke et al. [32], who observed that non-supplemented beef heifers covered greater distances and visited more feeding stations per minute, whereas supplementation reduced locomotion and foraging effort. In Dórea et al. [7], supplementation at a lower level (0.3% BW) also reduced grazing time but did not affect other grazing behavior variables such as resting time, bite rate, or number of steps, indicating a more limited behavioral response at that inclusion level. Together, these results support the interpretation that increasing energy supply via supplementation can progressively modify grazing behavior by partly replacing pasture intake with concentrate, with stronger effects on locomotion and space use when the supplementation level is increased to 0.6% BW.

3.2. Intake and Digestibility

Feed intake and digestibility were not affected by any interaction between grazing management and the level of energy supplementation (p > 0.13). Cattle grazing pastures managed at a 25 cm sward height exhibited significantly greater intakes of forage, total DM, digestible DM, NDF, and CP compared with animals grazing 35 cm pastures (Table 3).
Pastures grazed at 25 cm contained more leaves (44.4% vs. 38.0% of forage DM), fewer stems (17.5% vs. 18.2% of forage DM), and less dead material (38.1% vs. 43.9% of forage DM) [7], together with lower NDF concentration and higher total digestible nutrients (Table 1). These characteristics likely facilitated forage harvesting, increased bite rate, and improved harvesting efficiency, thereby contributing to the greater forage and total DM intake observed in steers grazing the 25 cm sward. According to Galli et al. [33], eating behavior is influenced by structural characteristics of the sward, such as height and bulk density, which are linked to changes in plant chemical composition, including fiber type, amount, and fracture resistance. The present findings align with those of Galli et al. [33], who reported a linear relationship between bite rate and DMI, reinforcing the connection between grazing behavior and higher intake. Similar outcomes were described by Gomes et al. [34] in mixed Urochloa brizantha–forage peanut pastures grazed at 95% or 100% light interception, where reductions of 25% in forage intake, 25.4% in total organic matter intake, 22% in NDF intake, and 48.2% in CP intake were observed. Although this study did not assess weight gain, the increased DMI associated with higher CP and digestible DM intake suggests potential for improved animal performance.
Moreover, greater forage DM and CP digestibility (p < 0.01) was observed when maintaining the pre-grazing sward height at 25 cm compared with 35 cm. However, digestibility of forage NDF, diet NDF, and diet DM was not affected by pasture management (p > 0.05; Table 4).
As reported by Dórea et al. [7], forages with a 25 cm pre-grazing sward height exhibited 3.4% and 67.3% higher protein fractions A and B1, respectively, than those managed at 35 cm. Furthermore, the combined carbohydrate fractions (A + B1) were 54.8% higher in pastures managed at 25 cm, which may explain the greater digestibility of DM and CP. In other rotational systems, such as elephant grass pastures, grazing at 95% light interception increased protein fractions (A + B1) by 5.19% and improved DM and CP digestibility without affecting NDF digestibility [35]. These results, along with those from previous studies, emphasize the importance of proper pasture management to maximize intake and ensure forage of higher nutritional quality.
An additional strategy to increase DMI is improving diet dry matter digestibility [36], which can be achieved through the inclusion of energy concentrates in the diet of grazing cattle. In this study, energy supplementation decreased forage DMI (p = 0.04) due to a substitution effect (p < 0.01), but increased total (p = 0.04) and digestible DMI (p = 0.03) by 8.8% and 29.4%, respectively (Table 3). Dórea et al. [7] found that inclusion of 0.3% BW of energy supplement reduced forage intake by 22.9% but did not affect total or digestible DMI. When the substitution effect is excessive, to the point that it does not result in an increase in total DMI, this outcome should be interpreted with caution, as the main benefit of supplementation under such circumstances lies in the potential to increase stocking rate [6]. If the stocking rate is not adjusted accordingly, the surplus forage that remains ungrazed may be lost through senescence and trampling, thereby reducing the nutritive value and overall efficiency of the grazing system [6]. Under conditions where pasture quality is already high and the supplement is rich in rapidly fermentable carbohydrates such as starch, even low supplementation levels may induce high substitution effect. Similar results were reported by Costa et al. [6], who evaluated pasture-grazed beef cattle supplemented at 0%, 0.3%, 0.6%, and 0.9% BW and observed a linear decrease in forage intake with increasing supplementation, accompanied by linear increases in total and digestible DMI. Those authors also reported a linear improvement in average daily gain. Together, these findings, along with the substitution effect observed in the present study, demonstrate the potential of strategic energy supplementation to increase stocking rate and beef production in tropical pastures, thereby enhancing productivity per area in regions where grain prices make this approach economically feasible.
Although an interaction between grazing management and energy supplementation was detected for grazing time, no significant interaction was observed for forage or total dry matter intake. This apparent discrepancy may, in part, be attributed to the greater variability inherent to intake estimation methods in grazing studies. Even with appropriate sample size and robust experimental design, as applied in the present study, the use of internal and external markers introduces additional sources of error, which can mask real biological effects. In contrast, grazing time represents a more direct and objective behavioral measure, typically characterized by lower variability compared with intake estimates derived from marker-based techniques.
Although energy supplementation increased digestible DMI, it decreased forage CP digestibility (p < 0.01). When corn was supplied at 0.6% of BW, overall DM digestibility increased (p < 0.01), whereas CP digestibility remained unaffected (Table 4). The reduction in forage CP digestibility observed with energy supplementation may be attributed to alterations in ruminal fermentation patterns. These changes can influence microbial populations, particularly protozoa, potentially reducing protein degradation and ruminal N–NH3 concentrations [37]. The reduction in apparent CP digestibility observed with energy supplementation may reflect a change in nitrogen partitioning rather than a true decrease in protein utilization.
Energy supplementation increased forage NDF digestibility (p = 0.01), with no effect on forage DM digestibility (p = 0.15). The improvement in NDF and total diet DM digestibility likely reflects the greater availability of fermentable substrate in the rumen, which supports enhanced microbial activity under a pH range favorable for cellulolytic bacteria growth [38].
Tropical pastures containing 11–14% CP typically provide rumen-degradable nitrogen in excess of the energy available for microbial growth, resulting in greater ruminal N–NH3 absorption, hepatic urea synthesis, and urinary nitrogen excretion. Supplementation with readily fermentable carbohydrate improves the synchronization between ruminal nitrogen and energy supply, increasing microbial nitrogen capture and reducing nitrogen losses through urine. Consequently, a greater proportion of nitrogen is incorporated into microbial biomass and excreted as fecal nitrogen, which lowers apparent CP digestibility despite potentially improving the efficiency of nitrogen utilization [39,40]. Together, these mechanisms help explain the observed increases in fiber and total DM digestibility associated with energy supplementation.

3.3. Rumen Fluid and Plasma Glucose

The sampling protocols used in the present study were based on established methods for grazing experiments. Nevertheless, measurements collected on a single day may not fully capture day-to-day biological variation. These considerations should be taken into account when interpreting the results. Higher ruminal N–NH3 concentrations were observed in cattle grazing pastures managed at a 25 cm sward height (p = 0.01; Table 5). This response is likely associated with the higher DMI and greater CP concentration of the forage in this study and corroborated by Fonseca et al. [41], as well as the higher solubility of CP fractions (A + B1).
These findings have important implications for the development of sustainable livestock systems and the reduction in greenhouse gas emissions [42]. Elevated ruminal N–NH3 concentrations in non-supplemented cattle can increase urinary nitrogen losses, as also observed in this study. In this context, supplementation may help mitigate excessive N–NH3 by promoting nitrogen dilution through higher total DMI and lower dietary CP concentration [43], while simultaneously providing a greater supply of rapidly fermentable substrate for microbial protein synthesis [44]. Together, these effects enhance nitrogen utilization efficiency and contribute to improved livestock sustainability.
In intensively managed tropical systems, nitrogen fertilization is widely employed to enhance forage productivity [45], increasing CP concentration in the pasture [41] and often elevating ruminal N–NH3 concentrations [46]. However, excessive nitrogen availability can result in inefficient utilization and greater urinary N losses, contributing to nitrous oxide (N2O) emissions [42]. Supplementation with energy concentrates can improve the synchrony between energy and nitrogen availability in the rumen, promoting microbial protein synthesis [46] and reducing N–NH3 accumulation through enhanced carbon skeleton availability [43]. Consequently, liver urea production and urinary N excretion are minimized, improving nitrogen retention and reducing environmental impact [37].
In steers supplemented with ground corn at 0.6% of BW, ruminal pH decreased (p < 0.01). However, this reduction did not negatively affect forage digestibility, as shown in the present study. Typically, cellulolytic bacterial populations are inhibited at pH values between 5.7 and 6.2 [38], which is lower than the levels observed here. Energy supplementation also significantly increased the ruminal molar proportion of propionate (p < 0.01) and decreased N–NH3, acetate, and the acetate-to-propionate (A:P) ratio (p < 0.01). Similar results were reported by Costa et al. [6], where increasing corn supplementation linearly raised propionate concentrations and reduced ruminal N–NH3 and the A:P ratio. Dórea et al. [7] observed comparable effects at a lower supplementation level (0.3% BW), with increased propionate and decreased N–NH3 and A:P ratio. These findings are consistent with the known fermentation characteristics of starch-rich feeds, which favor propionate production [47]. Despite these shifts in fermentation profiles, plasma glucose concentrations were not affected by energy supplementation (p = 0.76).

3.4. Microbial Protein Synthesis and Nitrogen Efficiency

There was no interaction (p > 0.05) between energy supplementation and grazing management for nitrogen utilization or microbial protein synthesis (Table 6). Cattle grazing pastures managed at a 25 cm pre-grazing sward height showed higher nitrogen intake (p = 0.01), greater nitrogen retention (p = 0.02), and improved nitrogen utilization efficiency (p = 0.05) compared with those grazing 35 cm pastures.
These outcomes can be attributed to the higher CP content and greater DMI associated with the 25 cm treatment, which together explain the elevated nitrogen intake. Furthermore, pastures managed at 25 cm contained 28% more soluble protein fractions (A + B1) than those managed at 35 cm [7], which may account for the higher ruminal N–NH3 concentrations observed. Despite this increase in ruminal N–NH3, animals grazing 25 cm pastures also exhibited greater nitrogen retention, likely reflecting their higher energy intake that favored microbial nitrogen assimilation. Nevertheless, as demonstrated in this study, balancing the dietary protein-to-energy ratio remains essential to reduce urinary nitrogen losses and mitigate N2O emissions, which are major contributors to greenhouse gas output [48].
As previously discussed, incorporating energy concentrates into supplementation programs can enhance nutrient use efficiency. In the present study, energy supplementation increased the efficiency of nitrogen utilization (p = 0.05) and microbial protein synthesis (p = 0.03), with a trend toward reduced urinary nitrogen excretion (p = 0.06). Costa et al. [49] and Ramalho et al. [50] demonstrated that tropical forages often provide adequate crude protein but insufficient metabolizable energy, so supplemental energy improves the capture and utilization of ruminal nitrogen by enhancing overall diet digestibility and reducing the mismatch between rumen-available nitrogen and fermentable energy. Almeida et al. [51] similarly reported a 9.3% improvement in nitrogen-use efficiency in cows supplemented with ground corn. This improvement likely results from an increased total DMI associated with a diet of lower crude protein concentration, which dilutes the dietary nitrogen content [43], combined with a higher supply of readily fermentable carbohydrates that promote microbial growth and protein synthesis in the rumen [44], as also evidenced in the present study. Grigsby et al. [52] also observed a reduction in ruminal N–NH3 concentrations in steers supplemented with soybean hulls, which was attributed to enhanced microbial utilization of ruminal N–NH3 for protein synthesis. The literature consistently indicates that microbial protein synthesis is optimized when the degradation of starch and protein is synchronized in the rumen [37]. In contrast to the present findings at 0.6% BW supplementation, Dórea et al. [7] reported no effects of 0.3% BW supplementation on urinary nitrogen or nitrogen retention, suggesting that higher energy inclusion levels may be required to achieve improved nitrogen balance in animals grazing high-quality tropical pastures. In Dórea et al. [7], feeding ground corn at 0,3% BW did not increase digestible DMI due to the high substitution rate, probably the major reason why urinary N and N retention were not affected.


4. Conclusions

An interaction between grazing management and energy supplementation was observed only for grazing time, indicating that the behavioral response to supplementation depended on sward height. Managing pastures at a 25 cm pre-grazing sward height increased DMI and DM and CP digestibility but also resulted in greater ruminal N–NH3 concentrations and urinary N excretion. Supplementation with ground corn at 0.6% BW reduced grazing time and forage intake while increasing total and digestible DMI and nitrogen retention. Overall, these results indicate that appropriate sward height management and moderate energy supplementation can improve nutrient use in cattle grazing high-producing tropical pastures, although their combination should be carefully managed to balance animal responses and potential nitrogen losses.

Author Contributions

Conceptualization, F.A.P.S. and J.R.R.D.; methodology, J.R.R.D.; software, J.R.R.D.; validation, J.R.R.D. and F.A.P.S.; formal analysis, J.R.R.D.; investigation, J.R.R.D.; resources, F.A.P.S.; data curation, J.R.R.D.; writing—original draft preparation, J.R.R.D.; writing—review and editing, J.R.R.D., D.F.A.C., L.A.N., B.M.B., A.J.F., V.N.G., G.L.M., S.C.D.S., A.V.P. and F.A.P.S.; supervision, F.A.P.S.; project administration, F.A.P.S.; funding acquisition, F.A.P.S. All authors have read and agreed to the published version of the manuscript.

Funding

This research was funded by Sao Paulo Research Foundation, grant number 11/13369-7.

Institutional Review Board Statement

The study was approved by the Animal Ethics Committee of Luiz de Queiroz College of Agriculture (Approval code: ESALQ/USP, approved on 29 September 2011).

Informed Consent Statement

Not applicable.

Data Availability Statement

The data presented in this study are available on request from the corresponding author. The data generated and/or analyzed during this study are not publicly available due to data management and custodianship considerations but may be made available from the first author upon reasonable request, subject to appropriate review.

Acknowledgments

The authors would like to thank the State of Sao Paulo Research Foundation (FAPESP, São Paulo, Brazil). They also extend their appreciation to the staff at the Department of Animal Science of the University of Sao Paulo, Piracicaba, Brazil, with special thanks to Carlos Cesar Alves for his assistance with laboratory analysis.

Conflicts of Interest

The authors declare no conflicts of interest.

Abbreviations

The following abbreviations are used in this manuscript:
BWBody weight
CPCrude protein
DMIDry matter intake
LILight interception
NDFNeutral detergent fiber
NINitrogen intake
N–NH3Ammonia nitrogen
N2ONitrous oxide
PDPurine derivatives
VFAVolatile fatty acids

References

  1. Conrad, H.R.; Pratt, A.D.; Hibbs, J.W. Regulation of feed intake in dairy cows. I. Change in importance of physical and physiological factors with increasing digestibility. J. Dairy Sci. 1964, 47, 54–62. [Google Scholar] [CrossRef] [Scilit]
  2. Poppi, D.; Minson, D.; Ternouth, J. Studies of cattle and sheep eating leaf and stem fractions of grasses. 2. Factors controlling the retention of feed in the reticulo-rumen. Aust. J. Agric. Res. 1981, 32, 109–121. [Google Scholar] [CrossRef] [Scilit]
  3. Da Silva, S.C.; Nascimento Júnior, D. Avanços na pesquisa com plantas forrageiras tropicais em pastagens: Características morfofisiológicas e manejo do pastejo. R. Bras. Zootec. 2007, 36, 121–138. [Google Scholar] [CrossRef] [Scilit]
  4. Hodgson, J.; Capriles, J.M.R.; Fenlon, J.S. The influence of sward characteristics on the herbage intake of grazing calves. J. Agric. Sci. 1977, 89, 743–750. [Google Scholar] [CrossRef] [Scilit]
  5. Danes, M.A.; Chagas, L.J.; Pedroso, A.M.; Santos, F.A. Effect of protein supplementation on milk production and metabolism of dairy cows grazing tropical grass. J. Dairy Sci. 2013, 96, 407–419. [Google Scholar] [CrossRef] [Scilit]
  6. Costa, D.F.A.; Correia, P.S.; Dorea, J.R.R.; De Souza, J.; Congio, G.F.d.S.; Vaz Pires, A.; Muniz Malafaia, P.A.; Drouillard, J.; Tadeu dos Santos Dias, C.; Luchiari-Filho, A.; et al. Strategic supplementation of growing cattle on tropical pastures improves nutrient use and animal performance, with fewer days required on the finishing phase. Anim. Prod. Sci. 2020, 61, 480–493. [Google Scholar] [CrossRef] [Scilit]
  7. Dórea, J.R.R.; Gouvêa, V.N.; Agostinho Neto, L.R.D.; Da Silva, S.C.; Brink, G.E.; Pires, A.V.; Santos, F.A.P. Beef cattle responses to pre-grazing sward height and low level of energy supplementation on tropical pastures. J. Anim. Sci. 2020, 98, skaa163. [Google Scholar] [CrossRef] [Scilit]
  8. Giacomini, A.A.; Da Silva, S.C.; Sarmento, D.O.L.; Zeferino, C.V.; Souza, S.J., Jr.; Trindade, J.K.; Guarda, V.D.A.; Sbrissia, A.F.; Nascimento, D., Jr. Components of the leaf area index of marandu palisadegrass swards subjected to strategies of intermittent stocking. Sci. Agric. 2009, 66, 721–732. [Google Scholar] [CrossRef] [Scilit]
  9. Da Silva, S.C.; Gimenes, F.M.A.; Sarmento, D.O.L.; Sbrissia, A.F.; Oliveira, D.E.; Hernandez-Garay, A.; Pires, A.V. Grazing behaviour, herbage intake and animal performance of beef cattle heifers on marandu palisade grass subjected to intensities of continuous stocking management. J. Agric. Sci. 2013, 151, 727–739. [Google Scholar] [CrossRef] [Scilit]
  10. Casali, A.O.; Detmann, E.; Valadares Filho, S.D.C.; Pereira, J.C.; Henriques, L.T.; Freitas, S.G.D.; Paulino, M.F. Influence of incubation time and particles size on indigestible compounds contents in cattle feeds and feces obtained by in situ procedures. R. Bras. Zootec. 2008, 37, 335–342. [Google Scholar] [CrossRef] [Scilit]
  11. Donnelly, D.M.; de Resende, L.C.; Cook, D.E.; Atalla, R.H.; Combs, D.K. A comparison of alkali treatment methods to improve neutral detergent fiber digestibility of corn stover. J. Dairy Sci. 2018, 101, 9058–9064. [Google Scholar] [CrossRef] [Scilit]
  12. Van Soest, P.J.; Robertson, J.B.; Lewis, B.A. Methods for dietary fiber, neutral detergent fiber, and nonstarch polysaccharides in relation to animal nutrition. J. Dairy Sci. 1991, 74, 3583–3597. [Google Scholar] [CrossRef] [Scilit]
  13. Vega, A.; Poppi, D.P. Extent of digestion and rumen condition as factors affecting passage of liquid and digesta particles in sheep. J. Agric. Sci. 1997, 128, 207–215. [Google Scholar] [CrossRef] [Scilit]
  14. Gibb, M.J. Animal grazing/intake terminology and definitions. In Proceedings of the 8th European Intake Workshop: Pasture Ecology and Animal Intake, Dublin, Ireland, 24–25 September 1996; pp. 21–37. [Google Scholar]
  15. Penning, P.D.; Rutter, S.M. Ingestive behaviour. In Herbage Intake Handbook, 2nd ed.; Penning, P.D., Ed.; British Grassland Society: Reading, UK, 2004; pp. 151–175. [Google Scholar]
  16. Ruyle, G.B.; Dwyer, D.D. Feeding stations of sheep as an indicator of diminished forage supply. J. Anim. Sci. 1985, 61, 349–353. [Google Scholar] [CrossRef] [Scilit]
  17. Association of Official Analytical Chemists (AOAC). Official Methods of Analysis, 15th ed.; AOAC Press: Arlington, VA, USA, 1990. [Google Scholar]
  18. Weiss, W.P.; Conrad, H.R.; Pierre, R.S. A theoretically based model for predicting total digestible nutrient values of forages and concentrates. Anim. Feed. Sci. Technol. 1992, 39, 95–119. [Google Scholar] [CrossRef] [Scilit]
  19. Krishnamoorthy, U.C.; Muscato, T.V.; Sniffen, C.J.; Van Soest, P.J. Nitrogen fractions in selected feedstuffs. J. Dairy Sci. 1982, 65, 217–225. [Google Scholar] [CrossRef] [Scilit]
  20. Licitra, G.; Hernandez, T.M.; Van Soest, P.J. Standardization of procedures for nitrogen fractionation of ruminant feeds. Anim. Feed. Sci. Technol. 1996, 57, 347–358. [Google Scholar] [CrossRef] [Scilit]
  21. Sniffen, C.J.; O’connor, J.D.; Van Soest, P.J.; Fox, D.G.; Russell, J.B. A net carbohydrate and protein system for evaluating cattle diets: II. Carbohydrate and protein availability. J. Anim. Sci. 1992, 70, 3562–3577. [Google Scholar] [CrossRef] [Scilit]
  22. Stangassinger, M.; Chen, X.B.; Lindberg, J.E.; Giesecke, D. Metabolism of purines in relation to microbial production. In Ruminant Physiology: Digestion, Metabolism, Growth and Reproduction, Proceedings of the 8th International Symposium on Ruminant Physiology, Willingen, Germany, 1994; von Engelhardt, W., Leonhard-Marek, S., Breves, G., Giesecke, D., Eds.; Enke: Stuttgart, Germany, 1995; pp. 387–406. [Google Scholar]
  23. Valadares, R.F.; Broderick, G.A.; Valadares Filho, S.C.; Clayton, M.K. Effect of replacing alfalfa silage with high moisture corn on ruminal protein synthesis estimated from excretion of total purine derivatives. J. Dairy Sci. 1999, 82, 2686–2696. [Google Scholar] [CrossRef] [Scilit]
  24. Pimpa, O.; Liang, J.B.; Jelan, Z.A.; Abdullah, N. Urinary excretion of duodenal purine derivatives in Kedah-Kelantan cattle. Anim. Feed. Sci. Technol. 2001, 92, 203–214. [Google Scholar] [CrossRef] [Scilit]
  25. Chizzotti, M.L.; Valadares Filho, S.C.; Valadares, R.F.D.; Chizzotti, F.H.M.; Tedeschi, L.O. Determination of creatinine excretion and evaluation of spot urine sampling in Holstein cattle. Livest. Sci. 2008, 113, 218–225. [Google Scholar] [CrossRef] [Scilit]
  26. Chen, X.B.; Gomes, M.J. Estimation of Microbial Protein Supply to Sheep and Cattle Based on Urinary Excretion of Purine Derivatives—An Overview of the Technical Details; Rowett Research Institute/International Feed Research Unit: Aberdeen, UK, 1992. [Google Scholar]
  27. Palmquist, D.L.; Conrad, H.R. Origin of plasma fatty acids in lactating cows fed high grain or high fat diets. J. Dairy Sci. 1971, 54, 1025–1033. [Google Scholar] [CrossRef] [Scilit]
  28. Chaney, A.L.; Marbach, E.P. Modified reagents for determination of urea and ammonia. Clin. Chem. 1962, 8, 130–132. [Google Scholar] [CrossRef] [Scilit]
  29. Wolfinger, R.D. Covariance structure selection in general mixed models. Commun. Stat. Simul. Comput. 1993, 22, 1079–1106. [Google Scholar] [CrossRef] [Scilit]
  30. Benvenutti, M.A.; Gordon, I.J.; Poppi, D.P. The effect of the density and physical properties of grass stems on the foraging behaviour and instantaneous intake rate by cattle grazing an artificial reproductive tropical sward. Grass Forage Sci. 2006, 61, 272–281. [Google Scholar] [CrossRef] [Scilit]
  31. Mertens, D.R.; Grant, R.J. Digestibility and intake. In Forages: The Science of Grassland Agriculture; Moore, K.J., Collins, M., Jerry Nelson, C., Redfearn, D.D., Eds.; John Wiley & Sons: New York, NY, USA, 2020; Volume 2, pp. 609–631. [Google Scholar]
  32. Glienke, C.L.; Rocha, M.G.D.; Roso, D.; Pötter, L.; Costa, V.G.D.; Machado, J.M. Ingestive behavior and displacement patterns of beef heifers on Italian ryegrass pasture. Rev. Bras. Zootec. 2010, 39, 247–254. [Google Scholar] [CrossRef] [Scilit]
  33. Galli, J.R.; Cangiano, C.A.; Pece, M.A.; Larripa, M.J.; Milone, D.H.; Utsumi, S.A.; Laca, E.A. Monitoring and assessment of ingestive chewing sounds for prediction of herbage intake rate in grazing cattle. Animal 2018, 12, 973–982. [Google Scholar] [CrossRef] [Scilit]
  34. Gomes, F.K.; Oliveira, M.D.; Homem, B.G.; Boddey, R.M.; Bernardes, T.F.; Gionbelli, M.P.; Lara, M.A.; Casagrande, D.R. Effects of grazing management in brachiaria grass-forage peanut pastures on canopy structure and forage intake. J. Dairy Sci. 2018, 96, 3837–3849. [Google Scholar] [CrossRef] [Scilit]
  35. Batalha, C.D.A.; Congio, G.F.D.S.; Santos, F.A.P.; Silva, S.C.D. Strategic grazing management decreases nitrogen excretion intensity of dairy cows. Sci. Agric. 2021, 79, e20200251. [Google Scholar] [CrossRef] [Scilit]
  36. Charmley, E.; Thomas, D.; Bishop-Hurley, G.J. Revisiting tropical pasture intake: What has changed in 50 years? Anim. Prod. Sci. 2023, 63, 1851–1865. [Google Scholar] [CrossRef] [Scilit]
  37. Bach, A.; Calsamiglia, S.; Stern, M.D. Nitrogen metabolism in the rumen. J. Dairy Sci. 2005, 8, 9–21. [Google Scholar] [CrossRef] [Scilit]
  38. Russell, J.B.; Dombrowski, D.B. Effect of pH on the efficiency of growth by pure cultures of rumen bacteria in continuous culture. Appl. Environ. Microbiol. 1980, 39, 604–610. [Google Scholar] [CrossRef] [Scilit]
  39. Carmona, P.; Costa, D.F.A.; Silva, L.F.P. Feed efficiency and nitrogen use rankings of Bos indicus steers differ on low and high protein diets. Anim. Feed. Sci. Technol. 2020, 263, 114493. [Google Scholar] [CrossRef] [Scilit]
  40. Silva, L.F.P.; Dixon, R.M.; Costa, D.F.A. Nitrogen recycling and feed efficiency of cattle fed protein-restricted diets. Anim. Prod. Sci. 2019, 59, 2093–2107. [Google Scholar] [CrossRef] [Scilit]
  41. Fonseca, N.V.B.; da Silva Cardoso, A.; Berça, A.S.; Dornellas, I.A.; Ongaratto, F.; Silva, M.L.C.; Ruggieri, A.C.; Reis, R.A. Effect of different nitrogen fertilizers on nitrogen efficiency use in Nellore bulls grazing on Marandu palisade grass. Livest. Sci. 2022, 263, 105012. [Google Scholar] [CrossRef] [Scilit]
  42. Gregorini, P.; Beukes, P.C.; Dalley, D.; Romera, A.J. Screening for diets that reduce urinary nitrogen excretion and methane emissions while maintaining or increasing production by dairy cows. Sci. Total Environ. 2016, 551, 32–41. [Google Scholar] [CrossRef] [Scilit]
  43. Bargo, F.; Varga, G.A.; Muller, L.D.; Kolver, E.S. Pasture intake and substitution rate effects on nutrient digestion and nitrogen metabolism during continuous culture fermentation. J. Dairy Sci. 2003, 86, 1330–1340. [Google Scholar] [CrossRef] [Scilit]
  44. Russell, J.B.; Martin, S.A. Effects of various methane inhibitors on the fermentation of amino acids by mixed rumen microorganisms in vitro. J. Anim. Sci. 1984, 59, 1329–1338. [Google Scholar] [CrossRef] [Scilit]
  45. Yarborough, J.K.; Vendramini, J.M.B.; Silveira, M.L.; Sollenberger, L.E.; Leon, R.G.; Sanchez, J.M.D.; Leite de Oliveira, F.C.; Kuhawara, F.A.; Gomes, V.; Cecato, U.; et al. Impact of potassium and nitrogen fertilization on bahiagrass herbage accumulation and nutrient concentration. Agron. J. 2017, 109, 1099–1105. [Google Scholar] [CrossRef] [Scilit]
  46. Poppi, D.P.; McLennan, S.R. Protein and energy utilization by ruminants at pasture. J. Anim. Sci. 1995, 73, 278–290. [Google Scholar] [CrossRef] [Scilit]
  47. Giuberti, G.; Gallo, A.; Masoero, F.; Ferraretto, L.F.; Hoffman, P.C.; Shaver, R.D. Factors affecting starch utilization in large animal food production system: A review. Starch 2014, 66, 72–90. [Google Scholar] [CrossRef] [Scilit]
  48. Boddey, R.M.; Casagrande, D.R.; Homem, B.G.; Alves, B.J. Forage legumes in grass pastures in tropical Brazil and likely impacts on greenhouse gas emissions: A review. Grass Forage Sci. 2020, 75, 357–371. [Google Scholar] [CrossRef] [Scilit]
  49. Costa, D.F.A.; Da Silva, S.C.; Bittar, C.M.; Takiya, C.; Dórea, J.R.R.; Del Valle, T.A.; Malafaia, P.; Santos, F.A.P. Citrus pulp-based supplement reduces the detrimental effects of high grazing pressure on the performance of beef cattle under a rotational system of Urochloa brizantha. Rev. Bras. Saúde Prod. Anim. 2019, 20, e0362019. [Google Scholar] [CrossRef] [Scilit]
  50. Ramalho, T.R.A.; Costa, D.F.A.; Da Silva, S.C.; Goulart, R.C.D.; Congio, G.F.; Santos, F.A.P. Supplementation of growing bulls grazing Panicum maximum cv. Coloniao increases average daily gain and does not impact subsequent performance in feedlot phase. Rev. Bras. Saúde Prod. Anim. 2020, 21, e2121202020. [Google Scholar] [CrossRef] [Scilit]
  51. Almeida, J.G.R.; Dall-Orsoletta, A.C.; Oziemblowski, M.M.; Michelon, G.M.; Bayer, C.; Edouard, N.; Ribeiro-Filho, H.M.N. Carbohydrate-rich supplements can improve nitrogen use efficiency and mitigate nitrogenous gas emissions from the excreta of dairy cows grazing temperate grass. Animal 2020, 14, 1184–1195. [Google Scholar] [CrossRef] [Scilit]
  52. Grigsby, K.N.; Kerley, M.S.; Paterson, J.A.; Weigel, J.C. Site and extent of nutrient digestion by steers fed a low-quality bromegrass hay diet with incremental levels of soybean hull substitution. J. Anim. Sci. 1992, 70, 1941–1949. [Google Scholar] [CrossRef] [Scilit]
Figure 1. Interaction between grazing management and energy supplementation on grazing time.
Ruminants 06 00084 g001
Table 1. Pre-grazing nutritive value (% DM) of Marandu Palisadegrass (Urochloa brizantha [Hochst. Ex A. Rich.] Stapf. cv. Marandu) grazed at two pre-grazing sward heights during the rainy season and of ground corn supplemented to cattle.
Management, cm
Variables2535Ground Corn 2
Crude protein13.911.09.35
Ether extract1.180.933.67
Neutral detergent fiber58.863.411.2
Acid detergent fiber33.135.92.93
Cellulose30.132.42.39
Lignin3.293.400.54
Ash9.979.340.90
Total digestible nutrients 157.354.987.3
1 Total digestible nutrients were estimated according to Weiss et al. [18]. 2 Dry matter content = 90%; Mean particle size = 1.3 mm.
Table 2. Effect of energy supplementation and grazing management on grazing behavior.
Management, cmSupplementation, % Body WeightSEMp-Value
Variables253500.6MSM × S
Grazing time, min/d390.1434.6447.8376.829.20.030.000.02
Ruminating time, min/d392.1441.7401.7432.036.40.240.470.09
Rest time, min/d607.7502.3543.5566.535.10.010.500.65
Bit rate, bites/min29.719.623.425.93.70.040.600.50
Feeding stations (FS)/min5.24.14.84.60.60.060.710.45
Steps between FS1.11.61.51.20.10.010.010.06
Steps/min6.06.57.05.50.60.360.030.61
Steps/day22442913308920682670.020.000.08
SEM = Standard error of the means, M = grazing management, S = supplementation, M × S = interaction between grazing management and supplementation, FS = Feeding station.
Table 3. Effect of energy supplementation and grazing management on forage, total, digestible, NDF and CP intakes and substitution rate.
Management, cmSupplementation, % Body WeightSEMp-Value
Variables25 cm35 cm00.6MSM × S
Forage DMI, % BW1.881.221.771.330.31<0.010.040.72
Total DMI, % BW2.181.521.771.930.33<0.010.040.72
Digestible DMI, % BW1.470.991.051.360.17<0.010.030.34
NDF DMI, % BW1.140.811.070.870.20.020.100.64
CP DMI, % BW0.2450.1790.2050.2200.04<0.010.920.94
Substitution rate 1,2--00.720.270.470.000.49
Forage DMI, kg/d6.444.186.074.560.77<0.010.020.70
Total DMI, kg/d7.475.216.076.610.74<0.010.040.69
Digestible DMI, kg/d5.043.393.604.660.41<0.010.050.60
NDF DMI, kg/d3.912.773.672.980.46<0.010.050.62
CP DMI, kg/d0.840.610.700.750.1<0.010.990.94
SEM = Standard error of the mean, 1 =kg of reduction on forage DMI for kg of supplemented fed, M = grazing management, S = supplementation, M × S = interaction between grazing management and supplementation, 2 =Forage DMI substitution was calculated as the reduction in forage DMI (kg DM) per kg of supplement DM consumed.
Table 4. Effect of energy supplementation and grazing management on forage and diet nutrients digestibility.
Management, cmSupplementation, % Body WeightSEMp-Value
Variables25 cm35 cm00.6MSM × S
Forage digestibility (%)
DM62.957.661.758.91.4<0.010.150.17
CP71.458.769.960.22.4<0.01<0.010.13
NDF65.264.462.766.81.30.580.010.79
Diet digestibility (%)
DM68.065.761.871.91.80.28<0.010.87
CP74.566.370.070.82.2<0.010.730.72
NDF64.563.462.765.21.20.440.080.95
SEM = Standard error of the means, M = grazing management, S = supplementation, M × S = interaction between grazing management and supplementation.
Table 5. Effect of energy supplementation and grazing management on rumen pH, N–NH3, volatile fatty acids (VFA) and plasma glucose.
Management, cmSupplementation, % Body WeightSEMp-Value
Variables25 cm35 cm00.6MSM × S
pH6.396.466.506.350.140.090.000.71
N–NH3, mg/dL12.0210.1112.609.381.190.010.000.07
Total VFA, mM142.83135.14135.13142.8411.880.360.360.36
VFA mol/100 mol
Acetate68.8568.8370.6966.990.780.990.000.34
Propionate20.8920.518.922.480.810.620.000.15
Butyrate10.6111.1711.1010.670.350.260.390.65
A:P3.483.643.943.180.140.270.000.19
Plasma glucose, mg/dL55.3454.8756.1355.831.760.870.760.32
SEM = Standard error of the means, M = grazing management, S = supplementation, M × S = interaction between grazing management and supplementation.
Table 6. Effects of energy supplementation and grazing management on nitrogen (N) intake, urinary N, fecal N, N retention (% N intake), microbial protein (MicP) and microbial efficiency (MicEf).
Management, cmSupplementation, % Body WeightSEMp-Value
Variables25 cm35 cm00.6MSM × S
N fecal 139.936.638.138.47.20.610.970.97
N urinary 141.533.240.734.02.40.020.060.30
N excretion 181.469.878.772.37.80.120.360.49
N intake 1135.098.7112.8121.114.40.010.540.99
N retention 153.628.934.248.68.70.020.160.58
N retention, % N intake39.829.330.239.33.10.050.050.88
MicP 1401.6376.8357.1421.424.50.380.030.41
MicEf, g/kg TDN108.2134.8124.4118.616.40.090.700.54
SEM = Standard error of the means, 1 g/day, M = grazing management, S = supplementation, M × S = interaction between grazing management and supplementation.
Disclaimer/Publisher’s Note: The statements, opinions and data contained in all publications are solely those of the individual author(s) and contributor(s) and not of MDPI and/or the editor(s). MDPI and/or the editor(s) disclaim responsibility for any injury to people or property resulting from any ideas, methods, instructions or products referred to in the content.