Article

Effects of Suffolk, Dorper, and Edilbay Crossbreeding on Lamb Performance and Meat Quality

Limited Liability Partnership “Kazakh Research Institute of Processing and Food Industry”, Almaty 050000, Kazakhstan
*
Author to whom correspondence should be addressed.
Ruminants 2026, 6(3), 83; https://doi.org/10.3390/ruminants6030083 (registering DOI)
Submission received: 28 August 2026 / Revised: 14 September 2026 / Accepted: 14 September 2026 / Published: 20 September 2026
(This article belongs to the Special Issue Nutrients and Feed Additives in Sheep and Goats)

Simple Summary

Sheep meat is an important source of high-quality animal protein, but its nutritional and sensory characteristics can vary depending on the genetic background of the animals. This study evaluated the growth performance, carcass characteristics, meat quality, and marbling of lambs produced from Kazakh Finewool ewes crossed with Suffolk, Dorper, and Edilbay rams under the same intensive feeding conditions. The aim was to determine whether the genetic background of the lambs affects their productive performance and the quality of the resulting meat. The lambs were monitored during a 90-day feeding period, and their live weight, weight gain, slaughter characteristics, chemical composition, and marbling were assessed. The results showed clear differences among the three groups. Kazakh Finewool × Suffolk lambs demonstrated the highest growth rate and final live weight, followed by the Dorper and Edilbay crosses. The Suffolk cross also showed a higher proportion of intramuscular fat, a trait generally associated with meat marbling in sheep meat quality research. These findings suggest that the choice of sire breed can substantially influence both lamb productivity and meat quality in the crossbred groups studied. Because each group was represented by only one sire housed in a single pen, these results should be regarded as preliminary observations for the specific groups evaluated, to be confirmed in larger trials with multiple sires and replicated pens, before being used to guide the selection of sheep genotypes for commercial production.

Abstract

Genetic background affects lamb growth, carcass characteristics, and meat quality and may determine the potential for producing well-marbled lamb meat. This single-site study compared growth performance, slaughter traits, and meat quality in 36 clinically healthy male lambs aged 3 months (n = 12 per genotype) from three crossbred genotypes: Kazakh Finewool × Suffolk, Kazakh Finewool × Dorper, and Kazakh Finewool × Edilbay. The lambs underwent 90 days of intensive fattening under identical housing and feeding conditions at DARA&CO LLP, Almaty Region. Growth performance, slaughter characteristics, physicochemical properties, color, pH, fatty acid, amino acid, mineral composition, and histological characteristics of the Longissimus dorsi muscle were evaluated. Marbling was assessed according to NY/T 630-2002. Kazakh Finewool × Suffolk lambs showed the highest average daily gain (294 g/day), dressing percentage (52.16%), marbling score (4.88 points), muscle area (16.40 cm2), and intramuscular fat content (11.44%) compared with Dorper and Edilbay crosses. Their meat also contained significantly higher levels of protein, zinc, and magnesium than the Dorper and Edilbay crosses (p < 0.05), with favorable pH (5.71) and color characteristics. Overall, the Kazakh Finewool × Suffolk cross showed the highest growth, carcass yield, and intramuscular fat deposition among the three crossbred groups evaluated. Because each group was represented by a single sire housed in a single pen, these findings should be interpreted as characteristics of the specific crossbred groups studied rather than as definitive breed-level effects, pending confirmation using multiple sires and replicated pens.

1. Introduction

Lamb meat quality is an important determinant of consumer acceptance and market value, with intramuscular fat (marbling) considered an important component of meat quality and carcass value [1,2]. Increasing interest in premium lamb production has therefore stimulated research into genotypes that combine desirable growth, carcass characteristics, and intramuscular fat deposition. For sheep-producing countries such as Kazakhstan, improving these traits through appropriate crossbreeding strategies may also contribute to the development of competitive lamb production systems [3].
Crossbreeding locally adapted breeds with specialized meat-type sires is widely used to improve growth performance, carcass yield, and meat quality in sheep [4,5]. Kazakh Finewool sheep represent an important maternal resource for such programs, while Suffolk, Dorper, and Edilbay breeds differ in growth potential, muscling, adaptability, and fat deposition characteristics [6,7]. However, comparative information on the performance and meat quality of Kazakh Finewool lambs crossed with these sire breeds under the same production conditions remains limited.
Suffolk is widely used as a terminal sire to improve growth rate, carcass characteristics, and meat quality. Previous studies of Suffolk crossbred lambs have reported improvements in body weight, dressing percentage, feed efficiency, and intramuscular fat compared with the corresponding dam lines [8,9]. Molecular studies have also identified genes and metabolic pathways potentially associated with differences in muscle growth and fat deposition in Suffolk-cross lambs [10]. These findings provide a basis for evaluating the effects of Suffolk genetics under local production conditions.
Dorper is another widely used meat breed, particularly in environments where adaptability and efficient meat production are important. Comparisons of Dorper-sired crossbred lambs with their dam lines have demonstrated differences in carcass characteristics, meat physicochemical properties, and fatty acid and amino acid profiles [11]. Such findings suggest that the effects of terminal sire breed may extend beyond growth and carcass yield to several aspects of meat quality.
Edilbay is a locally adapted fat-tailed breed of importance in Kazakhstan and neighboring regions because of its adaptation to arid and semi-arid conditions and its characteristic carcass fat deposition [12]. Previous research on Edilbay crossbreeding has indicated potential for improving productive and economic traits while retaining adaptation to local production environments [13]. Therefore, comparison of Edilbay with specialized terminal sire breeds such as Suffolk and Dorper may be useful for identifying crossbreeding strategies appropriate for Kazakhstani conditions.
Recent transcriptomic and metabolomic studies further indicate that sire genotype can influence muscle growth, lipid metabolism, and amino acid metabolism through differences in gene expression and metabolic pathways [14,15]. However, these molecular findings should be considered as a possible biological explanation for phenotypic differences rather than direct evidence from the present study.
Despite the growing body of research on crossbred lamb production, direct comparisons of Kazakh Finewool × Suffolk, Kazakh Finewool × Dorper, and Kazakh Finewool × Edilbay lambs under a common feeding and management system remain limited. In particular, comparative information integrating growth performance, slaughter characteristics, marbling, histological fat deposition, physicochemical properties, and fatty acid and amino acid composition is scarce for Kazakhstani production conditions. Addressing this gap may improve understanding of how sire breed affects the productive and meat-quality characteristics of lambs derived from a common maternal population.
The aim of this study was to compare the growth performance, slaughter characteristics, and meat quality traits of Kazakh Finewool × Suffolk, Kazakh Finewool × Dorper, and Kazakh Finewool × Edilbay lambs reared under identical fattening conditions, with particular emphasis on marbling, histological fat deposition, physicochemical properties, and fatty acid and amino acid profiles.

2. Materials and Methods

2.1. Experimental Animals and Study Design

Experimental studies were conducted from March to June 2026 at the facilities of DARA&CO LLP, located at 3/5 Rakhym Sabdenov Street, Nauryz microdistrict, Nauryzbay District, Almaty, Republic of Kazakhstan. The study included 36 clinically healthy male lambs aged 3 months, which were allocated into three crossbred groups of 12 animals each according to their parental breed combination and with consideration of age and initial live body weight. The animals were assigned to three crossbred groups according to their parental breed combination:
(1)
Group I—Kazakh Finewool × Suffolk crossbred lambs;
(2)
Group II—Kazakh Finewool × Dorper crossbred lambs;
(3)
Group III—Kazakh Finewool × Edilbay crossbred lambs.
The lambs were obtained from 45 unrelated purebred Kazakh Finewool ewes, with 15 ewes mated to each sire breed (Suffolk, Dorper, and Edilbay). The ewes were 13 months of age and nulliparous at the time of mating. Three purebred rams were used for mating, one Suffolk, one Dorper, and one Edilbay ram, each 18 months of age. Thus, each crossbred group represented the progeny of a single sire. Before the experimental period, the animals were maintained under identical management conditions.
At 3 months of age, 12 male lambs from each crossbred group were randomly selected for the experiment. The intensive finishing period lasted 90 days, from 3 to 6 months of age. The 90-day finishing period was selected to provide a standardized intensive finishing period from the post-weaning stage to a common slaughter age of 6 months, thereby allowing growth performance, carcass characteristics, and meat quality traits to be compared under identical feeding and management conditions.
All animals were maintained under identical housing conditions. Each crossbred group was housed in one pen containing 12 lambs. Each pen measured 3 × 4 m, providing a total floor area of 12 m2, equivalent to 1.0 m2 per lamb. The same complete feed ration was provided to all groups. The animals had free access to drinking water throughout the experimental period.
At the end of the 90-day finishing period, when the lambs were approximately 6 months of age, slaughter was performed under controlled conditions. Before slaughter, feed was withheld for 12 h, while drinking water remained available ad libitum. Following transport to the slaughter facility, the lambs underwent a 2-h lairage period before slaughter. Animals were electrically stunned and immediately exsanguinated.
After dressing, the head, skin, feet, gastrointestinal tract, and internal organs were removed from the carcass. Hot carcass weight (HCW) was recorded immediately after dressing. For Edilbay-cross lambs, the fat tail was retained and included in the carcass weight. The carcasses were subsequently chilled at 2–4 °C for 24 h, after which cold carcass weight (CCW) was recorded. Calculation of carcass and meatiness indicators The dressing percentage, meat-to-bone ratio, and meatiness coefficient were calculated using the following formulas:
The dressing percentage, meat-to-bone ratio, and meatiness coefficient were calculated using the following equations:
DP = Wc Wpre × 100
where DP is the dressing percentage (%), WC is the carcass weight (kg), and Wpre is the pre-slaughter live weight (kg).
MBR = Wm Wb
where MBR is the meat-to-bone ratio, Wm is the total meat weight, including muscle and associated fat (kg), and Wb is the total bone weight (kg).
Km = Wmus Wb
where Km is the meatiness coefficient, Wmus is the muscle tissue weight (kg), and Wb is the bone weight (kg).
All carcass weights were recorded individually for each animal. The calculated indicators were used for comparison among the three crossbred groups. All experimental procedures involving animals, including slaughter and carcass processing, were performed in accordance with GOST 31777-2012 “Sheep and Goats for Slaughter. Mutton, Lamb, and Goat Meat in Carcasses. Specifications” [16] and the veterinary-sanitary legislation of the Republic of Kazakhstan. Ethical approval for the study was obtained from the Local Bioethics Committee of LLP “Kazakh Research Institute of Processing and Food Industry” (Protocol No. 119, 8 April 2025). The Committee determined that all experimental procedures were conducted in accordance with accepted principles of humane animal care and welfare (see Supplementary Material, File S1).

2.2. Feeding and Experimental Diet

The complete compound feed used in the experiment was developed and produced at the LLP “Kazakh Research Institute of Processing and Food Industry” (Almaty, Republic of Kazakhstan) in accordance with GOST 10199-2017 [17]. The preparation of the compound feed involved grinding, mixing, and extrusion using a PD-400 pneumatic grinder, an SG-400 mixer, and a PE-170 grain extruder, respectively (Agrotechservice-12 LLP, Kostanay, Kazakhstan). The ingredient composition, nutritional value, vitamin and mineral composition, amino acid profile, microbiological characteristics, and physicochemical properties of the complete compound feed are presented in Table 1.
The complete feed was offered to the lambs twice daily, in the morning and evening, at a predetermined daily allowance. Although the lambs were housed in groups, feed was provided individually to each animal. The amount of feed offered was weighed immediately before each feeding using a calibrated electronic scale. Feed refusals were collected and weighed before the subsequent feeding. Daily individual feed intake was calculated as the difference between the amount of feed offered and the amount of feed refused. The amount of feed offered and feed refusals were recorded throughout the 90-day finishing period. Although the 12 lambs of each genotype shared a common pen, each animal was fed from an individually assigned trough that was accessible to only one lamb during feeding, which allowed the amount offered and refused to be attributed to that specific animal despite the group housing. Feed offered and refusals were weighed on an as-fed basis and converted to a dry-matter basis using the measured dry-matter content of the complete feed (92.49%, Table 2) to calculate the daily dry matter intake (DMI) reported for each animal.
Feed conversion ratio (FCR) was calculated as the ratio of total feed consumed to total live-weight gain during the 90-day feeding period and was expressed as kg feed/kg live-weight gain. Average daily gain (ADG) was calculated from individual live-weight measurements as total live-weight gain divided by the number of feeding days. No predefined target ADG was established before the experiment; therefore, ADG was calculated retrospectively from the observed live-weight measurements.
Quality assessment of the compound feed was carried out at the accredited Testing Center of LLP “Kazakh Research Institute of Livestock and Feed Production” (Almaty, Kazakhstan) in accordance with GOST 32040-2012 [18].
Vitamin, mineral, toxicological, microbiological, and amino acid analyses of the compound feed, as well as physicochemical and proximate composition analyses of meat samples, were performed at the Research Laboratory for Food Quality and Safety Assessment of Almaty Technological University (Almaty, Kazakhstan). Vitamin contents were determined according to GOST R 54635-2011 [19], GOST R 54634-2011 [20], and GOST 31483-2012 [21]. Mineral elements were analyzed according to GOST 32343-2013 [22], toxic elements according to GOST 30178-96 [23], and amino acid composition according to GOST R 55569-2013 [24]. The amino acid composition of the complete feed is presented in Table 3.
Microbiological analyses of feed and meat samples included detection of Escherichia coli according to GOST R 53913-2010 [25], total viable count (TVC) according to GOST 10444.15-94 [26], Coliform bacteria (BGKP) according to GOST 31747-2012 [27], Staphylococcus aureus according to GOST 31746-2012 [28], and molds and yeasts according to GOST 10444.12-2013 [29]. Vitamin, mineral, and microbiological characteristics of the complete feed are presented in Table 4.

2.3. Comprehensive Assessment of the Physicochemical and Chemical Properties of Meat

Meat quality analyses were performed at LLP “Kazakh Research Institute of Processing and Food Industry” (Almaty, Kazakhstan). Intramuscular fat (IMF) content was determined using a Soxhlet fat extraction system (Beger, Polzela, Slovenia) according to GOST 23042–2015 [30]. The extracted lipids were recovered using a rotary evaporator (IKA RV 3 eco, IKA-Werke, Staufen im Breisgau, Germany) equipped with a heating bath (IKA HB eco, IKA-Werke, Staufen im Breisgau, Germany). Prior to extraction, meat samples were freeze-dried using a lyophilizer (ALPHA 1–2 LDplus, Martin Christ, Osterode am Harz, Germany) and homogenized with an analytical mill (IKA A11 basic, IKA-Werke, Staufen im Breisgau, Germany).
Muscle pH was measured using a portable pH meter (Testo 205, Testo SE & Co. KGaA, Lenzkirch, Germany) in accordance with ISO 2917:1999 [31].
Meat color characteristics (L*, a*, and b*) were determined on the cut surface of the Longissimus dorsi muscle 24 h postmortem using a portable Minolta Chroma Meter CR-400 (Konica Minolta, Tokyo, Japan) according to ISO 11664-4:2019 [32]. Before measurement, the samples were allowed to bloom for 30 min at 4 °C to allow oxygenation of myoglobin. The instrument was calibrated against a standard white calibration tile according to the manufacturer’s instructions. The CIELAB color parameters were recorded, including lightness (L*), redness (a*), and yellowness (b*). Chroma (C*) and hue angle (h°) were calculated from the measured a* and b* values. Three measurements were taken at different locations on the cut surface of each muscle sample, and the mean value was used for statistical analysis.
Additional physicochemical analyses of lamb meat were conducted at the Research Laboratory for Food Quality and Safety Assessment of Almaty Technological University (Almaty, Kazakhstan). Protein content was determined according to GOST 25011–2017 [33], fat content according to GOST 23042–2015 [30], moisture content according to GOST 33319–2015 [34], ash content according to GOST 31727–2012 [35], acid value according to GOST R 55480–2013 [36].
Following slaughter, carcasses were chilled at 0–4 °C for 24 h. Samples of the m. Longissimus dorsi muscle were excised from the loin region between the 12th and 13th ribs. Visible subcutaneous fat and connective tissue were carefully removed before analysis.
The meat samples were divided into portions for determination of intramuscular fat, physicochemical composition, pH, color characteristics, histological examination, fatty acid composition, and marbling evaluation.
Visual marbling was assessed on the cross-section of the m. Longissimus dorsi muscle according to the Agricultural Industry Standard of the People’s Republic of China, NY/T 630–2002 “Lamb and Mutton Evaluation and Grading” [37]. The assessment was performed by a panel of 18 independent experts in meat science and meat technology from Kazakhstan, including specialists holding doctoral degrees and academic qualifications. The degree of visible intramuscular fat deposition was evaluated using the five-point ordinal marbling scale specified in NY/T 630–2002, with higher scores indicating a greater degree of marbling. The samples were coded before evaluation, and the assessors were blinded to the genotype and experimental group of the animals. Each assessor independently assigned a marbling score to each sample. The final marbling score for each animal was calculated as the mean score assigned by the 18 assessors.
Histological evaluation of the m. Longissimus dorsi muscle was performed to assess the distribution and deposition of intramuscular adipose tissue among the different crossbred groups. Histological identification was carried out in accordance with GOST 34989–2023, “Meat and Meat Products. General Requirements and Procedure for Identification of Composition by Histological Method” [38].
Muscle samples were sectioned using a semi-automatic rotary microtome (M530, Medite, Burgdorf, Germany). Histological sections were prepared at a thickness of 5 µm, with three sections obtained from each animal. For histological examination, the sections were stained with Ehrlich’s alum hematoxylin (CAS No. 517-28-2) and eosin (CAS No. 17372-87-1) according to the hematoxylin–eosin staining procedure specified in GOST 34989–2023 [38]. To facilitate the identification of adipose tissue, sections were additionally stained with Sudan III in accordance with the corresponding procedure of GOST 34989–2023 [38]. Briefly, sections were treated with 70% ethanol for 0.5–1 min, stained with Sudan III solution for 25 min, rinsed in 70% ethanol for 1–5 s, and subsequently counterstained with hematoxylin–eosin.
Ten randomly selected microscopic fields per section were examined at 100× magnification using a Biomed EX30-B biological microscope (Ningbo Sunny Instruments Co., Ltd., Yuyao, Zhejiang, China). According to GOST 34989–2023 [38], adipose tissue stained with Sudan III was identified by its orange-red coloration, whereas cell nuclei stained blue and the cytoplasm exhibited varying shades of red. The localization, distribution, and relative accumulation of intramuscular adipocytes between muscle fibers were evaluated microscopically.
The amino acid and fatty acid compositions of lamb meat were determined at the Research Laboratory for Food Quality and Safety Assessment of Almaty Technological University (Almaty, Kazakhstan). Amino acid composition was analyzed according to GOST R 55569–2013 [24], while fatty acid composition was determined by gas chromatography in accordance with GOST 34191–2017 [39]. For fatty acid analysis, intramuscular lipids were extracted from approximately 10 g of muscle tissue using a chloroform–methanol mixture (2:1, v/v). The extracted lipids were converted to fatty acid methyl esters (FAMEs) by base-catalyzed transmethylation using KOH in methanol. FAMEs were analyzed by gas chromatography using an Agilent 6890 GC system (Agilent Technologies, Andover, Minnesota, USA) equipped with a flame-ionization detector and a DB-23 capillary column (60 m × 0.25 mm, 0.25 µm film thickness). Helium was used as the carrier gas. The GC oven temperature was programmed from 50 °C to 230 °C using a temperature gradient. Individual fatty acid methyl esters were identified by comparing their retention times with those of a certified reference standard (Supelco 37-Component FAME Mix, Merck KGaA, Darmstadt, Germany) [40].

2.4. Statistical Analysis

Results are presented as mean ± standard error (SE) unless otherwise indicated. Feed composition and laboratory analytical values are presented as mean ± standard deviation (SD), where applicable. Each crossbred group comprised 12 animals. Individual animal measurements were used as the experimental unit for individual-level traits, including live body weight, carcass traits, meat quality characteristics, and individual feed intake. Because each crossbred group was housed in a single pen, pen effects could not be separated from crossbred-group effects and this represents a limitation of the experimental design. This limitation particularly affects growth-performance and individual feed-intake traits, for which all animals within a genotype shared common pen conditions; consequently, the corresponding p-values are subject to a risk of pseudo-replication and should be interpreted as descriptive comparisons specific to this experimental setting rather than as evidence of independently replicated genotype-level effects. For carcass and meat-quality traits measured on individually slaughtered and sampled animals, animal-level analysis is more directly justified as a descriptive comparison, although the same caution regarding confounding of sire and pen effects with crossbred group applies to all traits reported in this study. Prior to analysis, all datasets were checked for normality of distribution using the Shapiro–Wilk test and for homogeneity of variances using Levene’s test. Differences among the three crossbred groups (Kazakh Finewool × Suffolk, Kazakh Finewool × Dorper, and Kazakh Finewool × Edilbay) were evaluated by one-way analysis of variance (ANOVA), with crossbred group as the fixed factor. When the overall F-test was significant, means were compared pairwise using Duncan’s multiple range test. Differences were considered statistically significant at p < 0.05, and significant differences among genotypes are indicated in the corresponding tables by different superscript letters (a, b, c) within the same row. Although the marbling score was recorded on a five-point ordinal scale, it was analyzed as a continuous variable because it represented the mean of 18 independent assessor ratings per sample, which approximates a continuous distribution and satisfied the normality and homogeneity-of-variance criteria described above; this approach is consistent with common practice for averaged multi-rater ordinal scores in meat-quality research, although the ordinal origin of the underlying scale should be considered when interpreting the results. The same statistical procedure was applied to the fatty acid and amino acid profiles, using individual muscle samples obtained from the 12 animals in each crossbred group; because a large number of individual fatty acids and amino acids were compared, no correction for multiple comparisons was applied, and the corresponding p-values should therefore be interpreted with appropriate caution rather than as fully independent tests. All statistical analyses were performed using IBM SPSS Statistics (version 26.0, IBM Corp., Armonk, NY, USA).


3. Results

3.1. Growth Performance

The growth performance, slaughter characteristics, and meat productivity of lambs with different genotypes were evaluated to determine the effects of genotype on productive traits. The results are presented in Table 5.
The Kazakh Finewool × Suffolk cross exhibited the highest productive performance throughout the experimental period. Their final live weight reached 52.70 ± 0.60 kg, exceeding that of the Kazakh Finewool × Dorper (49.00 ± 0.52 kg) and Kazakh Finewool × Edilbay (46.19 ± 0.54 kg) groups. The Suffolk cross also demonstrated the greatest total weight gain over the 90-day trial (26.47 ± 0.25 kg) and the highest overall average daily gain (294 ± 4.43 g/day).
Average dry matter intake (DMI) was similar among the crossbred groups, with values of 1.80 ± 0.18, 1.80 ± 0.14, and 1.80 ± 0.17 kg/day for the Kazakh Finewool × Suffolk, Kazakh Finewool × Dorper, and Kazakh Finewool × Edilbay groups, respectively. All lambs were offered the same predetermined daily feed allowance regardless of genotype, and refusals remained minimal in all three groups throughout the trial; the similar mean DMI values therefore primarily reflect the common feed allowance and near-complete consumption of the ration rather than an absence of genotype differences in feed intake capacity. Despite the comparable DMI, feed conversion efficiency differed among genotypes, reflecting differences in how efficiently the similar amounts of feed consumed were converted into live-weight gain rather than differences in intake per se. The Kazakh Finewool × Suffolk lambs showed the most favorable feed conversion ratio (FCR), at 6.12 ± 1.20 kg dry matter/kg live-weight gain, followed by the Kazakh Finewool × Dorper group (7.09 ± 1.40 kg dry matter/kg live-weight gain), whereas the Kazakh Finewool × Edilbay group had the highest FCR (8.11 ± 1.80 kg dry matter/kg live-weight gain). Thus, the Suffolk cross demonstrated the most efficient utilization of feed for live-weight gain, consistent with its higher overall average daily gain.
The superior growth performance was reflected in the slaughter characteristics. The Kazakh Finewool × Suffolk lambs produced the heaviest hot carcasses (26.71 ± 0.61 kg) and the highest dressing percentage (52.16 ± 0.67%), whereas the corresponding values were lower in the Kazakh Finewool × Dorper (48.03 ± 0.76%) and Kazakh Finewool × Edilbay (46.81 ± 0.71%) crossbreds. In addition, the Suffolk cross exhibited the highest meat-to-bone ratio (77.5:22.5) and the greatest meatiness coefficient (3.44), indicating superior carcass conformation.
Differences were also observed in meat quality traits. The Longissimus dorsi eye muscle area was largest in the Suffolk cross (16.40 cm2), followed by the Dorper (13.04 cm2) and Edilbay (11.23 cm2) groups. Likewise, the visual marbling score was highest in the Suffolk cross (4.88 ± 0.11 points), compared with 3.95 ± 0.10 and 2.74 ± 0.09 points in the Dorper and Edilbay crosses, respectively.

3.2. Marbling and Histological Characteristics

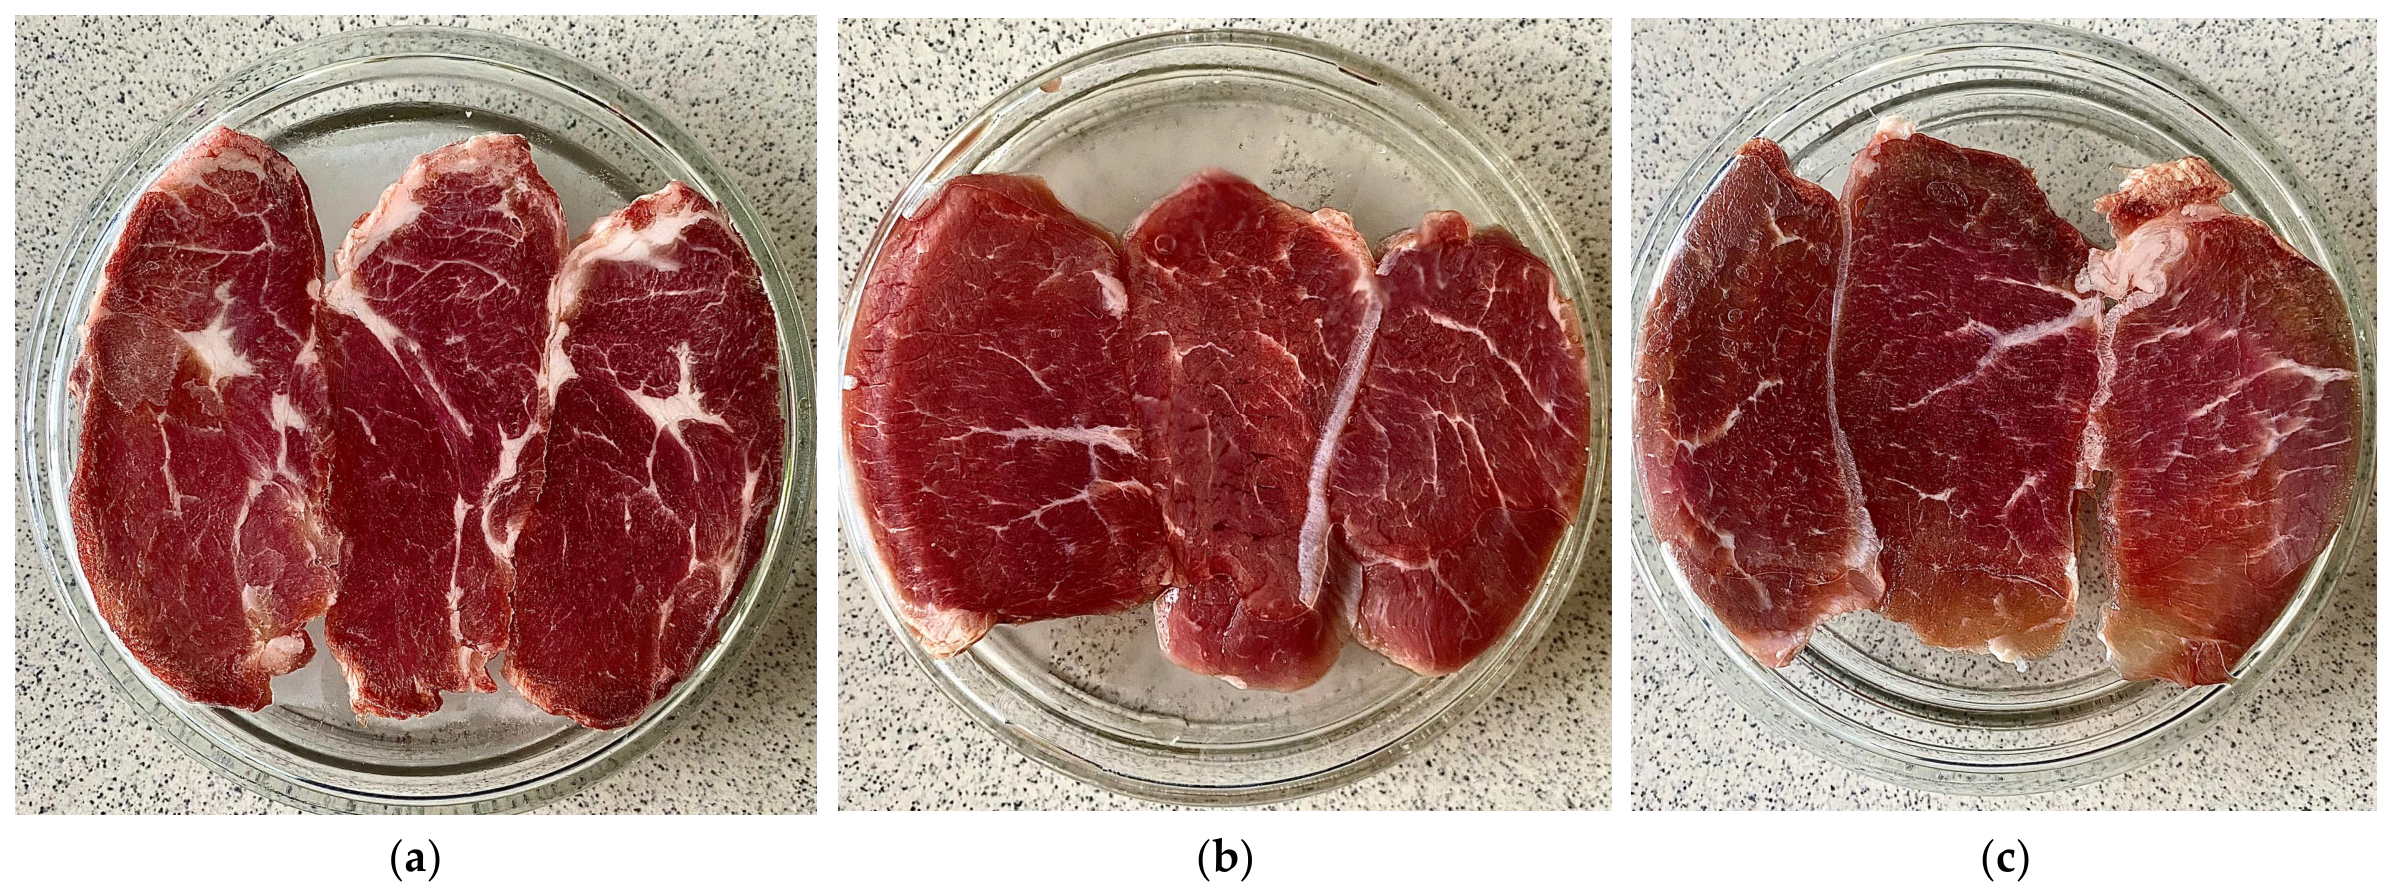
The Kazakh Finewool × Suffolk lambs exhibited the most pronounced and uniformly distributed intramuscular fat, corresponding to the highest visual marbling score (4.88 points). The Kazakh Finewool × Dorper lambs showed a moderate degree of visible marbling (3.95 points), whereas the Kazakh Finewool × Edilbay lambs had the lowest marbling score (2.74 points), with less visible intramuscular fat deposition (Figure 1).
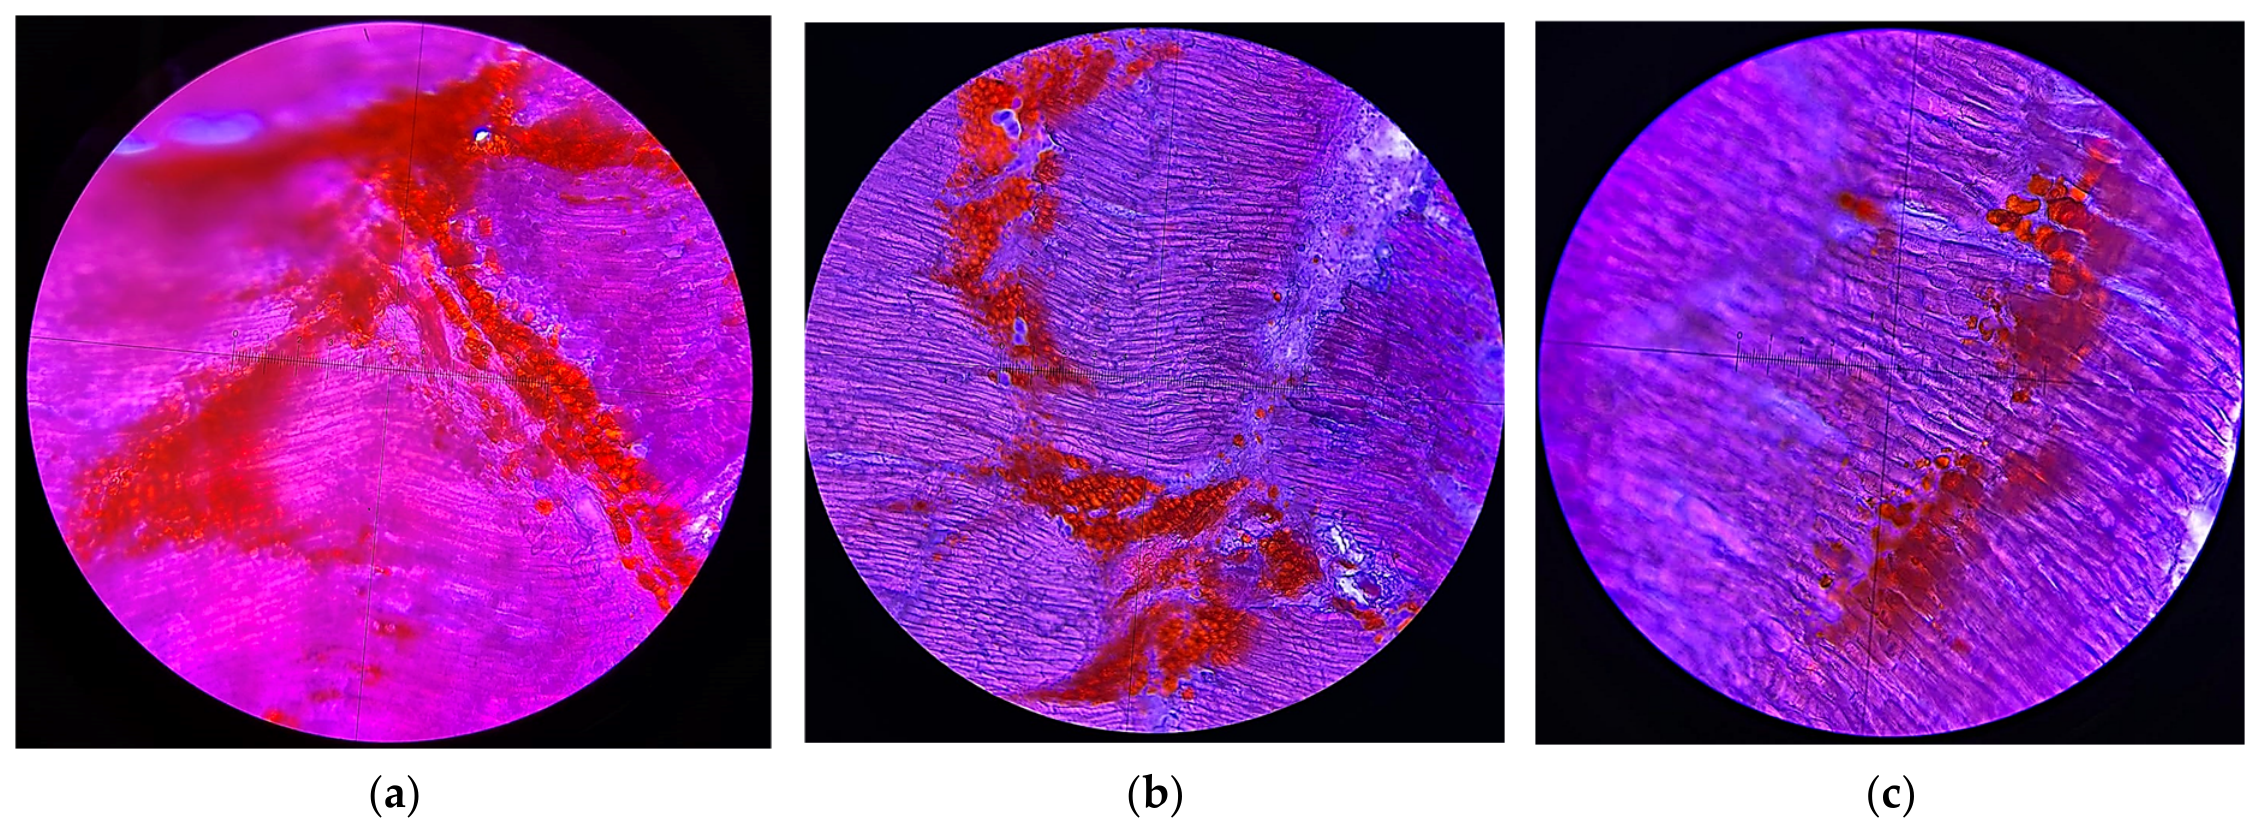
Histological examination revealed a greater number and more extensive distribution of adipose deposits between muscle fiber bundles in the Kazakh Finewool × Suffolk lambs. In the Kazakh Finewool × Dorper group, adipose tissue was present but appeared less extensively distributed, with smaller deposits between muscle fibers. The Kazakh Finewool × Edilbay lambs showed the lowest apparent abundance of intramuscular adipose tissue, with isolated fat deposits and a greater predominance of muscle tissue (Figure 2).

3.3. Proximate and Physicochemical Composition of Lamb Meat

The Kazakh Finewool × Suffolk cross exhibited the highest protein (20.39%) and fat (11.44%) contents and the lowest moisture content (66.93%) among the three crossbred groups (Table 6). The Kazakh Finewool × Edilbay cross showed the lowest protein (18.72%) and fat (7.12%) contents and the highest moisture content (73.37%), while the Kazakh Finewool × Dorper group showed intermediate values.
Ash content was highest in the Suffolk cross (1.24%), followed by the Dorper (0.95%) and Edilbay (0.79%) crosses. The acid value of fat was 0.88, 0.87, and 0.75 mg KOH/g fat in the Suffolk, Dorper, and Edilbay groups, respectively.

3.4. Meat pH

The ultimate muscle pH measured at 24 h postmortem was 5.71 ± 0.03 in the Kazakh Finewool × Suffolk group, 5.72 ± 0.04 in the Kazakh Finewool × Dorper group, and 5.70 ± 0.02 in the Kazakh Finewool × Edilbay group (Table 7). No statistically significant differences were observed among the three crossbred groups.

3.5. Instrumental Color Characteristics

The Kazakh Finewool × Dorper lambs exhibited the highest lightness (L* = 47.80 ± 1.10) and redness (a* = 26.80 ± 0.90), whereas the Kazakh Finewool × Suffolk group showed the lowest values for both parameters (44.20 ± 1.20 and 25.30 ± 1.00, respectively) (Table 8). The Kazakh Finewool × Edilbay group showed intermediate values of L* = 45.80 ± 1.10 and a* = 25.90 ± 0.90.
No statistically significant differences were observed among the three crossbred groups for yellowness (b*), chroma (C*), or hue angle (h°).

3.6. Vitamin, Mineral, and Microbiological Characteristics

Vitamin concentrations showed relatively small numerical differences among the three crossbred groups (Table 9). Vitamin E content ranged from 0.34 to 0.41 mg/100 g, while vitamins B1, B2, B3, B5, and B6 showed similar values across groups.
The Kazakh Finewool × Suffolk lambs showed the highest concentrations of zinc (3.03 mg/100 g), magnesium (26.91 mg/100 g), potassium (387.60 mg/100 g), calcium (10.45 mg/100 g), phosphorus (193.65 mg/100 g), sodium (134.39 mg/100 g), copper (0.21 mg/100 g), and iron (2.59 mg/100 g). The Kazakh Finewool × Dorper group showed intermediate values, whereas the Kazakh Finewool × Edilbay group generally had the lowest concentrations.
Total viable count ranged from 1.4 × 10² to 2.1 × 10² CFU/g across the three crossbred groups.

3.7. Fatty Acid Composition of Lamb Meat

The fatty acid composition of the Longissimus dorsi muscle differed among the crossbred groups for several individual fatty acids (Table 10).
The concentrations of C16:0 and C18:0 were significantly different among the groups (p < 0.05), with the highest C16:0 concentration observed in the Kazakh Finewool × Dorper lambs and the highest C18:0 concentration in the Kazakh Finewool × Suffolk lambs. The concentration of C16:1 was also significantly higher in the Dorper group than in the Edilbay group, while the Suffolk group showed an intermediate value (p < 0.05).
Among the polyunsaturated fatty acids, C18:3 n-3 and C20:5 n-3 differed significantly among the crossbred groups (p < 0.05). The concentration of CLA (c9, t11) was higher in the Dorper and Edilbay groups than in the Suffolk group (p < 0.05). For CLA (t9, t11), the Dorper group had a higher concentration than the Suffolk group, whereas the Edilbay group showed an intermediate value.
The proportions of total saturated fatty acids (SFAs), monounsaturated fatty acids (MUFAs), and polyunsaturated fatty acids (PUFAs), as well as the PUFA/SFA and n-6/n-3 ratios, are presented in Table 10. The n-6/n-3 ratio ranged from 5.01 to 10.03 among the crossbred groups, while the MUFA/SFA ratio showed the highest numerical values in the Kazakh Finewool × Suffolk and Kazakh Finewool × Edilbay groups.

3.8. Amino Acid Composition of Lamb Meat

The amino acid composition of lamb meat was determined to evaluate the nutritional quality of muscle proteins in the different genetic groups. Essential and non-essential amino acids were quantified in the Longissimus dorsi muscle, and the results are summarized in Table 11.
The Kazakh Finewool × Suffolk lambs exhibited the highest arginine concentration (2.250 ± 0.900 g/100 g protein), whereas lysine content was greatest in the Kazakh Finewool × Edilbay group (2.206 ± 0.750 g/100 g protein). Tyrosine, methionine, valine, leucine + isoleucine, alanine, and glycine also tended to be slightly higher in the Edilbay cross compared with the other genotypes.
Among the essential amino acids, lysine, leucine + isoleucine, phenylalanine, threonine, methionine, and valine were present at comparable concentrations in all groups, indicating that genotype had only a limited effect on the overall amino acid profile of lamb meat. Likewise, non-essential amino acids, including proline, serine, alanine, and glycine, showed relatively small variations among the three genetic groups.
Overall, the results demonstrate that lamb meat from all crossbred genotypes represents a valuable source of high-quality protein containing a balanced spectrum of essential and non-essential amino acids. The observed differences among genotypes were relatively small and are unlikely to substantially influence the biological value of the meat protein.
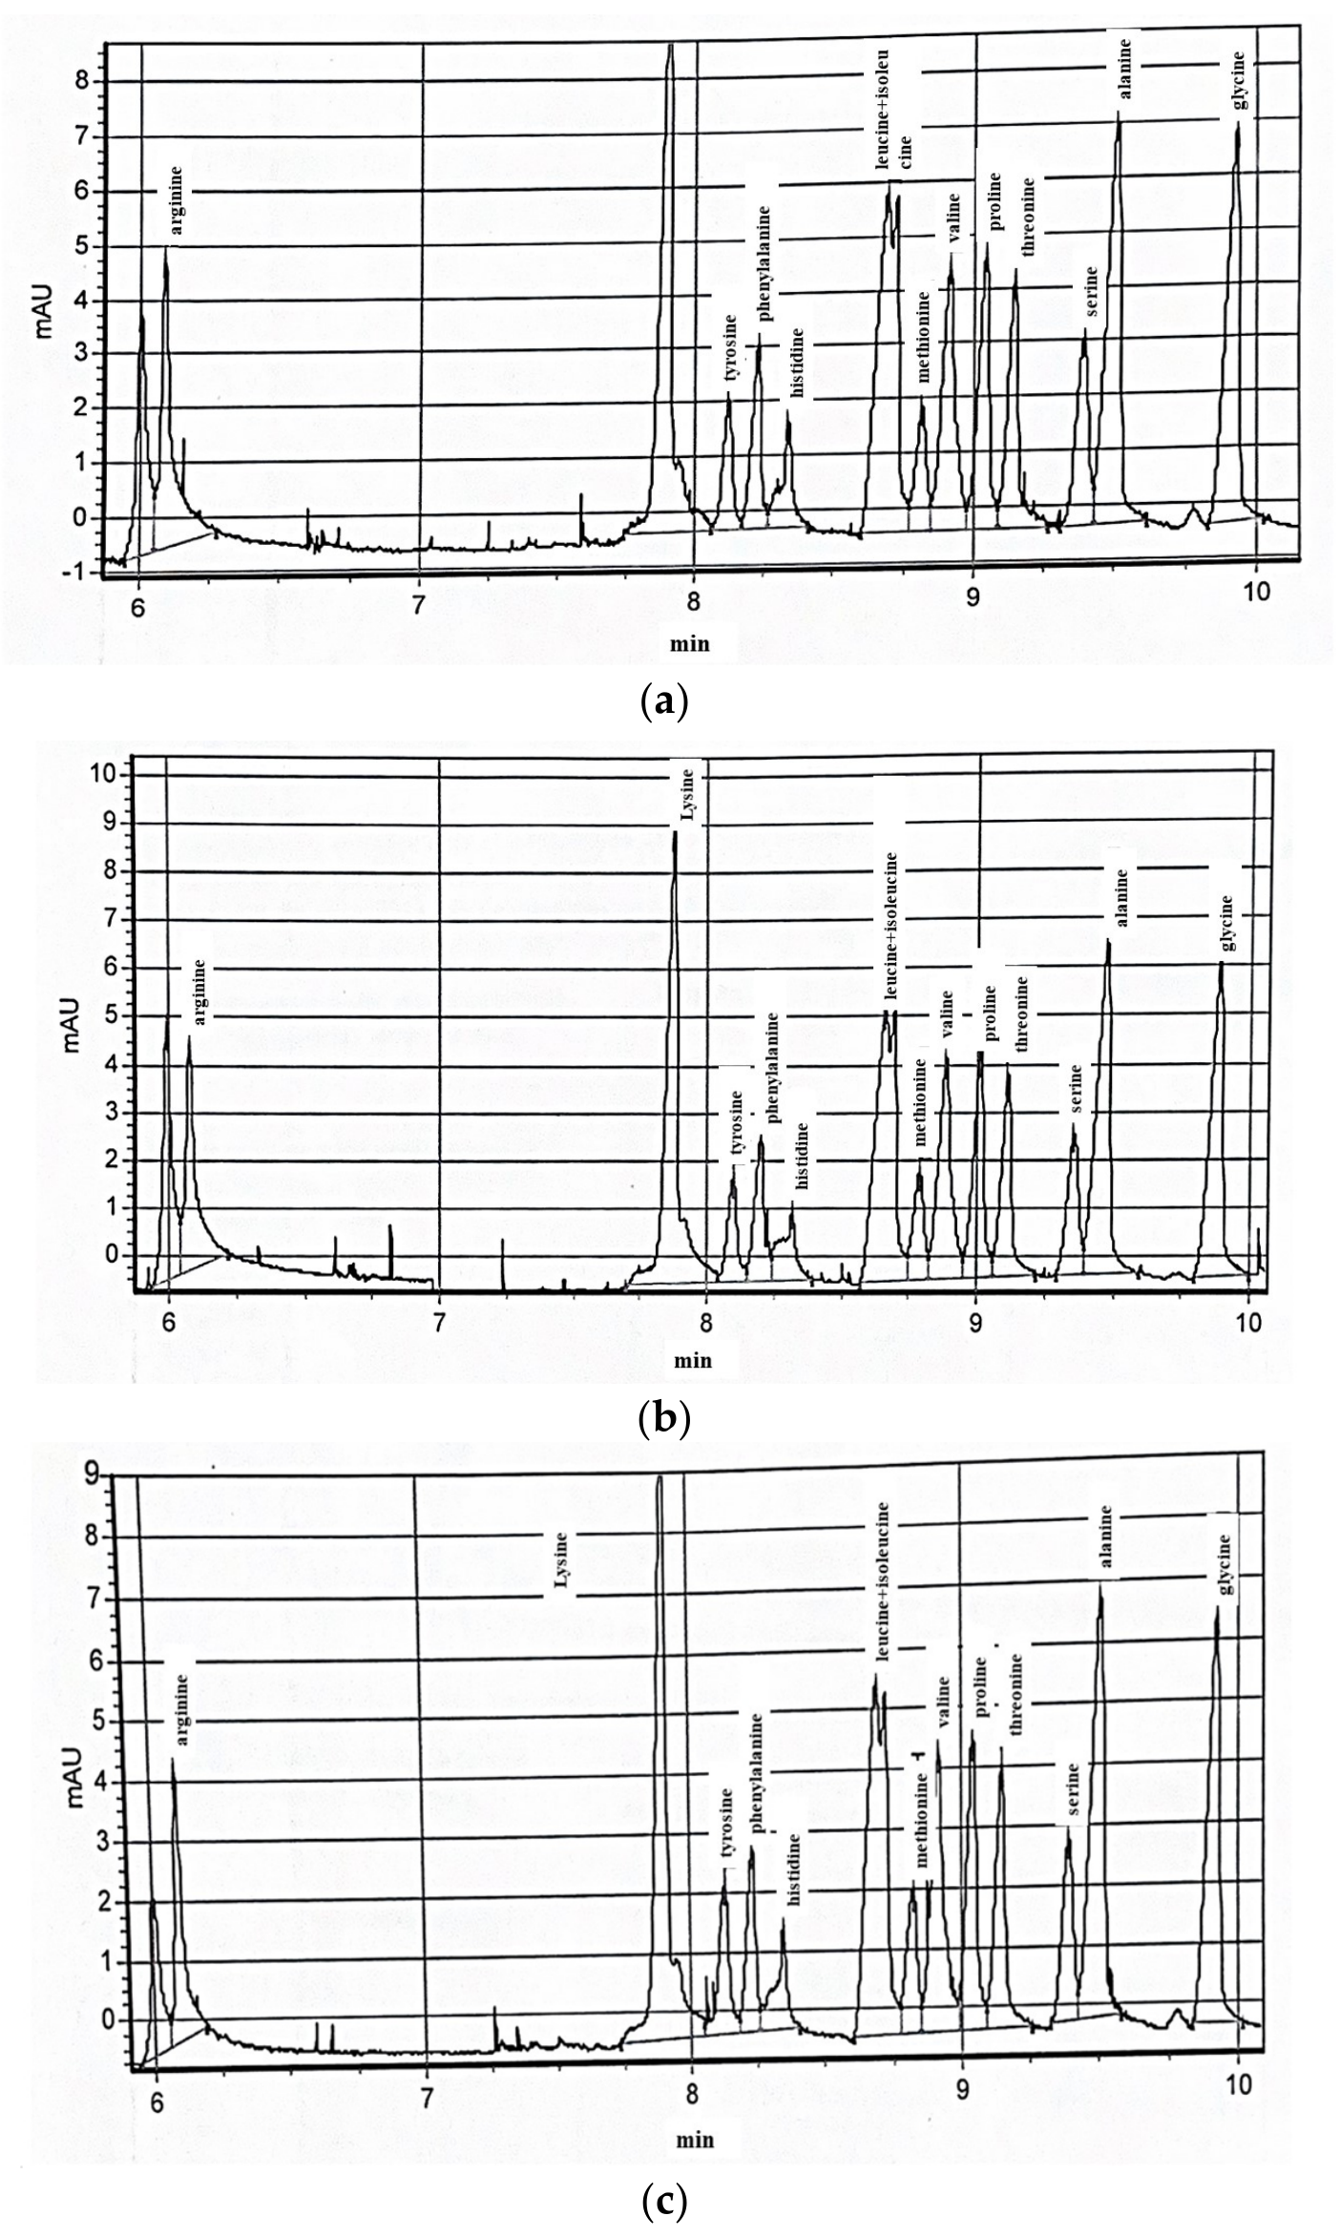
The chromatograms of the Kazakh Finewool × Suffolk (Figure 3a), Kazakh Finewool × Dorper (Figure 3b), and Kazakh Finewool × Edilbay (Figure 3c) crosses exhibited similar qualitative profiles across all experimental groups, indicating the presence of the same major amino acids in the muscle tissue. Differences among the chromatograms were primarily associated with the relative peak intensities, reflecting quantitative variations in amino acid concentrations rather than differences in amino acid composition. These observations are consistent with the analytical results presented in Table 11, where only moderate genotype-dependent differences were detected in the concentrations of individual amino acids. Overall, the chromatographic analysis confirms that the protein fraction of lamb meat from all three crossbred genotypes possesses a comparable amino acid composition with a balanced distribution of essential and non-essential amino acids.

4. Discussion

4.1. Growth Performance, Carcass Characteristics, and Intramuscular Fat Deposition

The present study showed clear differences among the evaluated crossbred groups in growth performance, carcass characteristics, and intramuscular fat deposition when crossed onto a common Kazakh Finewool dam line under identical intensive fattening conditions. The Kazakh Finewool × Suffolk lambs had the highest final live weight, average daily gain, hot carcass weight, and dressing percentage. The overall average daily gain was 294 g/day in the Suffolk group, compared with 254 and 222 g/day in the Dorper and Edilbay groups, respectively. This pattern is consistent with the well-documented use of Suffolk as a terminal sire breed for improving growth rate and carcass yield in crossbreeding programs [9,11]. The magnitude of the difference observed in the present study is also comparable to improvements reported for White-Headed Suffolk × Small-Tailed Han crossbreds, in which crossbred offspring showed greater body weight and feed efficiency than the purebred dam line [11]. However, because each crossbred group in the present study was represented by progeny from a single sire, the observed differences should be interpreted as responses of the evaluated crossbred groups rather than as definitive breed-level effects.
The higher slaughter performance observed in the Kazakh Finewool × Suffolk group, including hot carcass weight, dressing percentage, and meatiness coefficient, is consistent with previous reports indicating that Suffolk and other specialized meat-type sires can improve carcass yield and conformation relative to less specialized genetic backgrounds [5,9]. The Dorper cross showed intermediate values for most growth and carcass traits. This is in agreement with previous studies reporting beneficial effects of Dorper sires on carcass performance in breeds adapted to arid and semi-arid environments, although the magnitude and direction of effects may vary among dam breeds and production systems [13]. The comparatively lower growth and carcass values observed in the Edilbay cross may partly reflect the breed’s dual-purpose and fat-tailed characteristics, which have been shaped by selection for adaptation, production of tail fat, and performance under local environmental conditions [9]. Thus, the present findings indicate differences in productive performance among the evaluated crosses, while the relative importance of growth, carcass yield, and local adaptation may depend on the production system.
A notable finding was the greater intramuscular fat deposition observed in the Kazakh Finewool × Suffolk lambs. The Suffolk cross had the highest visual marbling score and the highest measured fat content, and histological examination showed more numerous and more extensively distributed adipose deposits between muscle fiber bundles. The convergence of visual, quantitative, and histological observations supports the presence of differences in intramuscular fat deposition among the evaluated crossbred groups. Previous studies have identified genetic variation in intramuscular fat deposition among sheep breeds and crossbreeding combinations [1,2]. Molecular studies have also identified candidate genes and metabolic pathways potentially associated with differences in adipose deposition in Suffolk-crossbred lambs, including PIK3R1, PPARA, AMPK, and PI3K–Akt-related signaling [12,14,15]. Although the present study did not include gene-expression, genomic, or transcriptomic analyses, these findings provide a possible biological context for the observed phenotypic differences. Therefore, the molecular mechanisms underlying the greater intramuscular fat deposition observed in the Suffolk cross remain to be directly investigated.

4.2. Meat Physicochemical Properties, Colour, Micronutrients, and Fatty Acid Composition

The physicochemical composition of the meat generally corresponded to the observed differences in fat deposition. The Kazakh Finewool × Suffolk group exhibited the highest protein and fat contents and the lowest moisture content, whereas the Edilbay group showed the lowest protein and fat contents and the highest moisture level. The concurrent increase in protein and fat contents in the Suffolk group may reflect differences in overall muscle composition associated with its greater growth and fat deposition. However, because protein, lipid, and moisture represent interrelated components of muscle composition, these results do not by themselves demonstrate greater efficiency of muscle protein accretion. The relationship between intramuscular lipid deposition and muscle composition has been documented in previous studies of lamb meat [1,2].
The acid values measured in the three crossbred groups were within the range observed under the conditions of the present study. The absence of pronounced differences in acid value suggests that the greater fat content observed in the Suffolk group was not accompanied by a marked difference in the measured hydrolytic lipid parameter at the time of analysis. Further studies incorporating acid value and changes during refrigerated storage would be useful for determining whether differences in intramuscular fat deposition affect the storage stability of lamb meat [8].
Ultimate muscle pH values were similar among the three crossbred groups, ranging from 5.70 to 5.72. The absence of significant differences in ultimate pH suggests that crossbred group had little effect on this postmortem quality parameter under the standardized management and slaughter conditions used in the present study. Similar observations have been reported in comparisons of Small-Tailed Han sheep and terminal-sire crossbreds, in which genotype effects were more apparent for carcass yield and composition than for ultimate pH [13]. Because DFD and PSE characteristics were not directly assessed using a combination of pH, colour, water-holding capacity, and other relevant measurements, the present pH results should not be interpreted as direct evidence of the absence of these quality defects.
Instrumental colour measurements showed that meat from the Kazakh Finewool × Dorper lambs had higher L* and a* values than meat from the Suffolk group, whereas b*, chroma, and hue angle did not differ significantly among the crossbred groups. The colour differences observed despite similar ultimate pH values suggest that factors other than postmortem acidification may contribute to the variation among groups. Possible explanations include differences in muscle fibre characteristics, myoglobin concentration, surface reflectance, or intramuscular fat content. However, these factors were not directly measured in the present study and should therefore be considered hypotheses for future investigation rather than demonstrated mechanisms. The vitamin E concentration was also numerically higher in the Dorper group; however, the relationship between vitamin E concentration and meat colour or pigment stability cannot be established from the present data alone.
Differences in mineral composition were more apparent than differences in vitamin concentrations. The Kazakh Finewool × Suffolk group showed the highest numerical concentrations for several measured minerals, including zinc, magnesium, potassium, calcium, phosphorus, sodium, copper, and iron. These differences may be related to variation in muscle composition among the crossbred groups. However, the present study did not directly assess mineral metabolism, mineral retention, or metabolic activity, and therefore the mechanisms responsible for the observed differences remain uncertain. In contrast, the relatively small differences observed for several B-group vitamins and vitamin E may partly reflect the common dietary supply, because all animals received the same compound feed ration. In addition, mineral concentrations expressed on a fresh-weight basis may be influenced by differences in moisture and fat content. Consequently, the mineral results should be interpreted as compositional differences rather than direct evidence of greater nutritional value.
The fatty acid profile showed genotype-dependent differences in several individual fatty acids, particularly within the monounsaturated and polyunsaturated fractions, while the overall qualitative composition was broadly similar among the three crossbred groups. This pattern is consistent with previous reports indicating that sire genotype can influence lipid-related metabolic pathways and fatty acid composition in crossbred sheep [14,15]. Several individual fatty acids differed significantly among the groups, whereas the proportions of total saturated fatty acids (SFA), monounsaturated fatty acids (MUFA), and polyunsaturated fatty acids (PUFA) showed less pronounced variation. The n-6/n-3 ratio also varied among the groups. These findings indicate that sire-cross combination can influence the relative distribution of individual fatty acids in lamb muscle. However, the present study was not designed to establish the nutritional superiority of any crossbred group, and the fatty acid results should therefore be interpreted primarily as compositional differences.

4.3. Amino Acid Composition, Practical Implications, and Study Limitations

The amino acid composition of lamb muscle was broadly similar among the three crossbred groups, although significant differences were observed for a limited number of individual amino acids. Differences were detected for histidine, the combined leucine and isoleucine content, and glycine, whereas no significant differences were observed for several other measured amino acids. The comparable qualitative chromatographic profiles further indicate that the overall amino acid composition was relatively stable among the evaluated groups. These findings suggest that the crossbred group had a limited effect on the measured amino acid composition under the feeding conditions used in the present study. However, the data do not allow direct conclusions regarding the biological value, digestibility, or overall nutritional superiority of the meat proteins.
From a practical perspective, the higher growth performance, carcass yield, and marbling observed in the Kazakh Finewool × Suffolk group indicate potential value for production systems targeting heavier carcasses and greater intramuscular fat deposition. The Dorper cross showed intermediate performance for several traits, whereas the Edilbay cross retained the characteristics associated with the local fat-tailed genetic background. These differences may be relevant when selecting crossbreeding strategies according to specific production objectives. However, economic superiority among the genotypes cannot be established from the present data because a formal economic analysis incorporating feed, labour, input, carcass-value, and other production costs and returns was not conducted. Similarly, the present study does not provide sufficient evidence to establish genotype-specific advantages for premium or export markets.
This study has several limitations that should be considered when interpreting the results. The trial was conducted at a single site over one 90-day fattening period, and the findings should therefore be confirmed across multiple seasons, locations, and larger cohorts before broad extrapolation to commercial Kazakhstani sheep production. Each crossbred group was represented by progeny from a single sire, and each group was housed in a single pen; consequently, sire-specific and pen effects could not be separated from crossbred-group effects. The observed differences should therefore be interpreted as responses of the evaluated crossbred groups rather than definitive breed-level effects. Although individual animal measurements were used for the evaluated traits, the use of one pen per crossbred group limits the ability to distinguish animal-level variation from pen-level effects. In addition, the study was limited to three crossbred groups and 12 animals per group.
The histological evaluation provided morphological evidence of differences in adipose deposition but was not based on quantitative image-analysis measurements of adipocyte number, area, or volume. The study also did not directly assess candidate genes, gene expression, or metabolic pathways implicated in intramuscular fat deposition [12,14,15]. Furthermore, sensory characteristics, instrumental tenderness, cooking loss, water-holding capacity, consumer acceptance, and meat colour stability during storage were not evaluated. These parameters would be valuable for determining whether the observed differences in composition and marbling translate into measurable eating-quality differences.
Future studies should therefore include multiple sires per breed and replicated pens per crossbred group to improve the ability to distinguish genetic, sire, and pen effects. Larger multi-season and multi-location trials, combined with quantitative histological image analysis, genomic or transcriptomic approaches, sensory and consumer evaluation, and measurements of meat storage stability, would provide stronger evidence for the biological and practical significance of the differences observed among Kazakh Finewool × Suffolk, Kazakh Finewool × Dorper, and Kazakh Finewool × Edilbay lambs.

5. Conclusions

Under the identical intensive fattening conditions used in this study, the Kazakh Finewool × Suffolk lambs showed the highest growth performance, carcass yield, meatiness coefficient, and visual marbling score among the evaluated crossbred groups. The higher intramuscular fat content and histological evidence of greater adipose deposition further supported the observed differences in marbling. Differences among the crossbred groups were also observed in several physicochemical, mineral, fatty acid, and amino acid traits, whereas ultimate pH showed no significant differences.
Overall, the results indicate that the Kazakh Finewool × Suffolk cross has potential for improving growth performance, carcass characteristics, and intramuscular fat deposition under intensive finishing conditions. However, because the study used a single sire per breed and a single pen per crossbred group, these findings should be considered specific to the evaluated crossbred groups and require confirmation using multiple sires, replicated pens, and larger multi-site studies.

6. Patents

The feeding approach and feed formulation used in the present study are related to the technologies protected by the following patents:
  • Patent No. 11654, “Method of Feeding Lambs to Produce Marbled Meat”, 12 May 2025.
  • Patent No. 12491, “Composition of Feed for Young Sheep”, 28 January 2026.
These patents are directly related to the feeding and feed-composition aspects of the present study. Patent No. 11654 concerns the feeding approach aimed at promoting marbling in lambs, whereas Patent No. 12491 concerns the composition of the feed used for young sheep. Their inclusion is intended to transparently disclose the intellectual property underlying the feeding technology applied in the study.

Supplementary Materials

The following supporting information can be downloaded at: https://www.mdpi.com/article/10.3390/ruminants6030083/s1, File S1: The approval statement of the Local Bioethics Committee.

Author Contributions

Conceptualization, G.K. and U.C.; methodology, G.K., U.C. and Q.S.; investigation, A.A. and Q.S.; formal analysis, A.A. and G.Z.; data curation, A.A.; writing—original draft preparation, A.A.; writing—review and editing, G.K., U.C. and G.Z.; supervision, U.C.; project administration, G.K. All authors have read and agreed to the published version of the manuscript.

Funding

This research was funded by the Ministry of Agriculture of the Republic of Kazakhstan, grant number BR24892775, under the Scientific and Technical Program “Development of Technology for the Comprehensive and Deep Processing of Agricultural Raw Materials for the Production of Food Products Ensuring High Quality and Safety of Manufactured Products”.

Institutional Review Board Statement

The animal study protocol was approved by the Local Bioethics Committee of the Kazakh Research Institute of Processing and Food Industry (Protocol No. 119, 8 April 2025). The Committee confirmed that the study complied with applicable ethical standards for the humane treatment and welfare of animals. All procedures involving animals were conducted in accordance with the national legislation of the Republic of Kazakhstan regulating animal welfare, including the Law of the Republic of Kazakhstan “On Responsible Treatment of Animals” (No. 97-VII ZRK) and the Law of the Republic of Kazakhstan “On Biological Safety” (No. 122-VII ZRK). The feeding trial was conducted from March to June 2026 at the facilities of DARA&CO LLP, located at 3/5 Rakhym Sabdenov Street, Nauryz Microdistrict, Nauryzbay District, Almaty, Republic of Kazakhstan. Animal management and slaughter procedures were performed in accordance with GOST 31777–2012 “Sheep and Goats for Slaughter. Mutton, Lamb and Goat Meat in Carcasses” [16]. All procedures were consistent with standard commercial livestock practices, and no additional invasive experimental interventions were applied beyond routine animal husbandry and slaughter operations. The approval statement of the Local Bioethics Committee is provided in Supplementary Material File S1.

Informed Consent Statement

Not applicable. The study did not involve human participants.

Data Availability Statement

The data presented in this study are available from the corresponding author upon reasonable request.

Acknowledgments

During the preparation of this manuscript, the authors used ChatGPT (GPT-5.6, OpenAI) for language editing, improvement of English grammar, and refinement of scientific wording. The authors have reviewed and edited the output and take full responsibility for the content of this publication.

Conflicts of Interest

Authors Gulmira Kenenbay, Urishbay Chomanov, Gulzhan Zhumaliyeva, Qabylgazy Seitpan, and Arailym Abilda were employed by LLP “Kazakh Research Institute of Processing and Food Industry”. The authors declare that the research was conducted in the absence of any commercial or financial relationships that could be construed as a potential conflict of interest.

References

  1. Tan, Z.; Jiang, H. Molecular and cellular mechanisms of intramuscular fat development and growth in cattle. Int. J. Mol. Sci. 2024, 25, 2520. [Google Scholar] [CrossRef] [Scilit] [PubMed]
  2. Hocquette, J.F.; Gondret, F.; Baéza, E.; Médale, F.; Jurie, C.; Pethick, D.W. Intramuscular fat content in meat-producing animals: Development, genetic and nutritional control, and identification of putative markers. Animal 2010, 4, 303–319. [Google Scholar] [CrossRef] [Scilit] [PubMed]
  3. Torres, R.N.S.; Ghedini, C.P.; Chardulo, L.A.L.; Baldassini, W.A.; Curi, R.A.; Pereira, G.L.; Schoonmaker, J.P.; Almeida, M.T.C.; Costa, C.; Machado Neto, O.R. Potential of different strategies to increase intramuscular fat deposition in sheep: A meta-analysis study. Small Rumin. Res. 2024, 234, 107258. [Google Scholar] [CrossRef] [Scilit]
  4. Kenenbay, G.S.; Chomanov, U.C.; Zhumaliyeva, G.E.; Seitpan, Q.M.; Kramsakova, Z.B.; Abilda, A.S. Effect of functionally enriched compound feed on intramuscular fat deposition and meat quality in lambs. Sci. Food 2026, 20, 562–578. [Google Scholar] [CrossRef] [Scilit]
  5. Kenenbay, G.S.; Chomanov, U.C.; Kramsakova, Z.B.; Abilda, A.S. Marbling and meat quality of Kazakh Finewool purebred and Suffolk × Finewool crossbred sheep on an intensive fattening diet. Processes 2025, 13, 2874. [Google Scholar] [CrossRef] [Scilit]
  6. Lunesu, M.F.; Battacone, G.; Mellino, M.R.; Carta, S.; Pulina, G.; Nudda, A. The heavy suckling lamb of Sarda dairy sheep and its crossbreed with Dorper rams: Performance, meat quality and consumer perceptions. Meat Sci. 2023, 204, 109234. [Google Scholar] [CrossRef] [Scilit] [PubMed]
  7. Heimbuch, M.L.; Van Buren, J.B.; Epperson, B.S.; Jepsen, S.M.; Oliver, K.F.; A Nasados, J.; A Vinci, D.; Larson, M.; E Konetchy, D.; Price, W.J.; et al. Evaluation of growth, meat quality, and sensory characteristics of wool, hair, and composite lambs. J. Anim. Sci. 2023, 101, skad076. [Google Scholar] [CrossRef] [Scilit] [PubMed]
  8. Ren, G.; Wang, Y. Evaluation of meat quality in Duhu hybrid lambs reared in different conditions. Foods 2024, 13, 3969. [Google Scholar] [CrossRef] [Scilit] [PubMed]
  9. Quan, K.; Li, J.; Han, H.; Liu, K.; Shi, H.; Wang, H.; Jin, M.; Sun, W.; Wei, C. Two-generation crossbreeding of White-headed Suffolk and Small-tailed Han sheep: Heterosis, sustainable production traits, and morphological features in central China. Animals 2025, 15, 1071. [Google Scholar] [CrossRef] [Scilit] [PubMed]
  10. Fu, L.; Shi, J.; Meng, Q.; Tang, Z.; Liu, T.; Zhang, Q.; Cheng, S. Verification of key target molecules for intramuscular fat deposition and screening of SNP sites in sheep from Small-tailed Han sheep breed and its cross with Suffolk. Int. J. Mol. Sci. 2024, 25, 2951. [Google Scholar] [CrossRef] [Scilit] [PubMed]
  11. Xiao, C.; Liu, Y.; Zhao, W.; Liang, Y.; Cui, C.; Yang, S.; Fang, W.; Miao, L.; Yuan, Z.; Lin, Z.; et al. The comparison of meat yield, quality, and flavor between Small-tailed Han sheep and two crossbred sheep and the verification of related candidate genes. Front. Nutr. 2024, 11, 1399390. [Google Scholar] [CrossRef] [Scilit] [PubMed]
  12. Dossybayev, K.; Amandykova, M.; Orakbayeva, A.; Adylkanova, S.; Kozhakhmet, A.; Yergali, K.; Kulboldin, T.; Kulataev, B.; Torekhanov, A. Genome-wide association studies revealed several candidate genes of meat productivity in Saryarka fat-tailed coarse-wool sheep breed. Genes 2024, 15, 1549. [Google Scholar] [CrossRef] [Scilit] [PubMed]
  13. Gorlov, I.F.; Slozhenkin, M.I.; Magomadov, T.A.; Yuldashbayeva, A.Y.; Shakhbazov, O.P.; Rajabov, R.G. Economic and biological features of sheep obtained from crossing the Edilbaev breed with a Dorper. Russ. Agric. Sci. 2024, 50, 41–44. [Google Scholar] [CrossRef] [Scilit]
  14. Zhang, L.; An, X.; Xu, Z.; Niu, C.; Geng, Z.; Zhang, J.; Shi, H.; Chen, Z.; Zhang, R.; Yue, Y. Transcriptome–metabolome analysis reveals that crossbreeding improves meat quality in Hu sheep and their F1-generation sheep. Foods 2025, 14, 1384. [Google Scholar] [CrossRef] [Scilit] [PubMed]
  15. Chen, B.; Yue, Y.; Li, J.; Liu, J.; Yuan, C.; Guo, T.; Zhang, D.; Yang, B.; Lu, Z. Transcriptome–metabolome analysis reveals how sires affect meat quality in hybrid sheep populations. Front. Nutr. 2022, 9, 967985. [Google Scholar] [CrossRef] [Scilit] [PubMed]
  16. GOST 31777–2012; Sheep and Goats for Slaughter. Mutton, Lamb and Goat Meat in Carcasses. Specifications. Interstate Council for Standardization, Metrology and Certification: Moscow, Russia, 2012.
  17. GOST 10199–2017; Compound Feed Concentrates for Sheep and Goats. General Technical Specifications. Interstate Council for Standardization, Metrology and Certification: Moscow, Russia, 2017.
  18. GOST 32040–2012; Feeds, Compound Feeds and Feed Raw Materials. Method for Determination of Crude Protein, Crude Fiber, Crude Fat and Moisture Using Near-Infrared Spectroscopy. Interstate Council for Standardization, Metrology and Certification: Moscow, Russia, 2012.
  19. GOST R 54635–2011; Functional Food Products. Method for Determination of Vitamin A. Federal Agency on Technical Regulation and Metrology: Moscow, Russia, 2011.
  20. GOST R 54634–2011; Functional Food Products. Method for Determination of Vitamin E. Federal Agency on Technical Regulation and Metrology: Moscow, Russia, 2011.
  21. GOST 31483–2012; Premixes. Determination of Vitamins B1 (Thiamine Hydrochloride), B2 (Riboflavin), B3 (Nicotinic Acid and Nicotinamide), B5 (Pantothenic Acid), B6 (Pyridoxine), B9 (Folic Acid) and C (Ascorbic Acid) by Capillary Electrophoresis. Interstate Council for Standardization, Metrology and Certification: Moscow, Russia, 2012.
  22. GOST 32343–2013 (ISO 6869:2000); Feeds and Compound Feeds. Determination of Calcium, Copper, Iron, Magnesium, Manganese, Potassium, Sodium and Zinc by Atomic Absorption Spectrometry. Interstate Council for Standardization, Metrology and Certification: Moscow, Russia, 2013.
  23. GOST 30178–96; Raw Materials and Food Products. Atomic Absorption Method for Determination of Toxic Elements. Interstate Council for Standardization, Metrology and Certification: Moscow, Russia, 1996.
  24. GOST R 55569–2013; Feeds, Compound Feeds and Feed Raw Materials. Method for Determination of Amino Acid Composition by Capillary Electrophoresis. Interstate Council for Standardization, Metrology and Certification: Moscow, Russia, 2013.
  25. GOST R 53913–2010; Microbiology of Food and Animal Feeding Stuffs. Horizontal Method for Detection of Escherichia coli O157. Federal Agency on Technical Regulation and Metrology: Moscow, Russia, 2010.
  26. GOST 10444.15–94; Food Products. Methods for Determination of Mesophilic Aerobic and Facultative Anaerobic Microorganisms. Interstate Council for Standardization, Metrology and Certification: Moscow, Russia, 1994.
  27. GOST 31747–2012; Food Products. Methods for Detection and Enumeration of Coliform Bacteria. Interstate Council for Standardization, Metrology and Certification: Moscow, Russia, 2012.
  28. GOST 31746–2012; Food Products. Methods for Detection and Enumeration of Coagulase-Positive Staphylococci and Staphylococcus aureus. Interstate Council for Standardization, Metrology and Certification: Moscow, Russia, 2012.
  29. GOST 10444.12–2013; Microbiology of Food and Animal Feeding Stuffs. Methods for Detection and Enumeration of Yeasts and Molds. Interstate Council for Standardization, Metrology and Certification: Moscow, Russia, 2013.
  30. GOST 23042–2015; Meat and Meat Products. Methods for Determination of Fat. Standartinform: Moscow, Russia, 2019.
  31. ISO 2917:1999; Meat and Meat Products—Measurement of pH (Reference Method). International Organization for Standardization: Geneva, Switzerland, 1999.
  32. ISO 11664-4:2019; Colorimetry—Part 4: CIE 1976 L*a*b* Colour Space. International Organization for Standardization: Geneva, Switzerland, 2019.
  33. GOST 25011–2017; Meat and Meat Products. Methods for Determination of Protein. Standartinform: Moscow, Russia, 2018.
  34. GOST 33319–2015; Meat and Meat Products. Method for Determination of Moisture Content. Standartinform: Moscow, Russia, 2019.
  35. GOST 31727–2012; Meat and Meat Products. Method for Determination of Ash Content. Standartinform: Moscow, Russia, 2013.
  36. GOST R 55480–2013; Animal and Vegetable Fats and Oils. Determination of Acid Value and Acidity. Standartinform: Moscow, Russia, 2014.
  37. NY/T 630–2002; Lamb and Mutton Evaluation and Grading. Ministry of Agriculture of the People’s Republic of China: Beijing, China, 2002.
  38. GOST 34989–2023; Meat and Meat Products. General Requirements and Procedure for Identification of Composition by Histological Method. Standartinform: Moscow, Russia, 2023.
  39. GOST 34191–2017; Animal and Vegetable Fats and Oils. Determination of Fatty Acid Composition by Gas Chromatography. Standartinform: Moscow, Russia, 2018.
  40. Supelco® 37-Component FAME Mix; Certified Reference Standard for Fatty Acid Methyl Esters. Merck KGaA: Darmstadt, Germany, 2023.
Figure 1. Representative cross-sectional images of the m. Longissimus dorsi collected from the region between the 12th and 13th ribs of crossbred lambs: (a) Kazakh Finewool × Suffolk; (b) Kazakh Finewool × Dorper; and (c) Kazakh Finewool × Edilbay. Images were obtained from the cut surface of the muscle after 24 h of postmortem chilling at 0–4 °C.
Ruminants 06 00083 g001
Figure 2. Representative histological sections of the m. Longissimus dorsi collected from the region between the 12th and 13th ribs of crossbred lambs: (a) Kazakh Finewool × Suffolk; (b) Kazakh Finewool × Dorper; and (c) Kazakh Finewool × Edilbay. Sections were stained with Sudan III and Ehrlich hematoxylin. Images were acquired at ×100 magnification. The scale bar represents 100 μm. Adipose tissue is distributed between muscle fiber bundles.
Ruminants 06 00083 g002
Figure 3. Representative chromatograms of amino acid profiles in the Longissimus dorsi muscle of crossbred lambs: (a) Kazakh Finewool × Suffolk; (b) Kazakh Finewool × Dorper; and (c) Kazakh Finewool × Edilbay. Amino acids were identified and quantified according to GOST R 55569–2013.
Ruminants 06 00083 g003
Table 1. Feed composition.
IngredientContent, %
Barley18.72
Maize20.05
Alfalfa hay10.30
Sunflower meal25.14
Soybean meal6.10
Flaxseed meal2.59
Hemp meal2.50
Wheat germ3.78
Sprouted barley3.17
Rumen content0.62
Feed yeast1.84
Corn gluten1.33
Fish meal1.06
Meat and bone meal2.44
Salt0.36
Note: Values are expressed as percentages of the total feed composition on an as-fed basis. Undigested feed residues from the sheep rumen were collected and processed for incorporation into the feed formulation. The use of animal-derived feed ingredients, including fish meal and meat and bone meal, should be considered when developing an export-oriented lamb production system. Although these ingredients can be used as protein sources in animal diets, their acceptability may vary among importing countries depending on veterinary, sanitary, traceability, and feed-safety regulations. Therefore, for commercial implementation in specific export markets, the feed formulation should be reviewed against the requirements of the destination country, and alternative plant-based protein sources may be considered where necessary.
Table 2. Nutritional and energy characteristics of the feed.
IngredientValue
Initial moisture, %6.17
Hygroscopic moisture, %1.43
Total moisture, %7.51
Dry matter, %92.49
Crude protein, %19.46
Crude fat, %6.12
Crude fiber, %9.39
Nitrogen-free extract, %51.64
Sugars, %1.11
Starch, %28.46
Ash, %5.87
Calcium, %0.38
Phosphorus, %0.60
Feed units, per kg1.20
Digestible protein, g/kg138.17
Metabolizable energy, MJ/kg11.61
Energy feed unit, per kg1.16
Note: Values are expressed on an as-fed basis unless otherwise indicated. The calcium-to-phosphorus (Ca) ratio of the formulated feed was 0.63:1, calculated from the measured calcium (0.38%) and phosphorus (0.60%) concentrations. The calcium and phosphorus values reported in Table 2 refer to the complete formulated feed listed in Table 1, which was the sole feed provided to the lambs during the trial; no separate mineral or vitamin premix was added beyond the ingredients listed in Table 1, and the reported percentages are the directly measured analytical values (GOST 32343-2013), not a different reporting unit. The resulting Ca:P ratio of 0.63:1 is below the ratio generally recommended for growing lambs (approximately 1.5–2:1) and represents a limitation of the feed formulation used in this study rather than a measurement artifact. Because mineral balance was not experimentally adjusted or monitored beyond the analytical characterization presented here, the practical consequences of this ratio for skeletal development or performance under the conditions of the present trial could not be evaluated, and this remains an aspect of the feed formulation that should be corrected, for example, through calcium supplementation, in future studies.
Table 3. Amino acid composition of the feed.
Amino AcidConcentration, %
Alanine1.098 ± 0.275
Arginine0.898 ± 0.359
Valine1.247 ± 0.499
Histidine0.304 ± 0.152
Glycine1.297 ± 0.441
Leucine1.047 ± 0.272
Isoleucine1.054 ± 0.212
Lysine1.347 ± 0.458
Methionine0.459 ± 0.156
Proline1.096 ± 0.295
Serine0.698 ± 0.182
Tyrosine0.648 ± 0.195
Threonine0.798 ± 0.319
Phenylalanine0.748 ± 0.224
Note: Mean ± SD (standard deviation).
Table 4. Micronutrient and microbiological characteristics of the feed.
IndicatorValue
Vitamins
Vitamin A, mg/kg23.82 ± 0.02
Vitamin E, mg/kg54.47 ± 0.03
Vitamin B1, mg/100 g0.306 ± 0.061
Vitamin B2, mg/100 g0.153 ± 0.064
Vitamin B3, mg/100 g0.446 ± 0.089
Vitamin B6, mg/100 g0.319 ± 0.064
Minerals
Zinc (Zn), mg/100 g0.61 ± 0.009
Magnesium (Mg), mg/100 g143.33 ± 2.15
Potassium (K), mg/100 g581.41 ± 8.72
Sodium (Na), mg/100 g15.54 ± 0.23
Copper (Cu), mg/100 g1.01 ± 0.015
Microbiological characteristics
Escherichia coli, in 1.0 g of productNot detected
Coliform bacteria (BGKP), in 1.0 g of productNot detected
Staphylococcus aureus, in 1.0 g of productNot detected
Total viable count (TVC), CFU/g2.7 × 103
Molds, CFU/g13
Yeasts, CFU/g3
Note: Values are presented as mean ± SD.
Table 5. Growth performance, slaughter characteristics and meat productivity of lambs with different genotypes.
ParameterKazakh Finewool × SuffolkKazakh Finewool × DorperKazakh Finewool × Edilbay
Growth performance
Initial live weight, kg26.23 ± 0.35 a26.17 ± 0.36 a26.20 ± 0.38 a
Live weight after 45 days, kg39.46 ± 0.76 a37.67 ± 0.82 a35.69 ± 0.80 b
Final live weight after 90 days, kg52.70 ± 0.60 a49.00 ± 0.52 b46.19 ± 0.54 c
Weight gain during the first 45 days, kg13.23 ± 0.50 a11.50 ± 0.40 b9.49 ± 0.30 c
Weight gain during the second 45 days, kg13.24 ± 0.30 a11.33 ± 0.60 a10.50 ± 0.50 b
Total weight gain during the 90-day trial, kg26.47 ± 0.25 a22.83 ± 0.16 b19.99 ± 0.21 c
Average daily gain during the first 45 days, g/day294 ± 3.01 a256 ± 3.21 b211 ± 3.12 c
Average daily gain during the second 45 days, g/day294 ± 4.45 a252 ± 2.89 b233 ± 1.76 c
Overall average daily gain, g/day294 ± 4.43 a254 ± 3.01 b222 ± 4.21 c
Dry matter intake (DMI), kg/day1.80 ± 0.18 a1.80 ± 0.14 a1.80 ± 0.17 a
Feed conversion ratio (FCR), kg feed/kg live-weight gain6.12 ± 1.20 a7.09 ± 1.40 a8.11 ± 1.80 a
Slaughter characteristics
Pre-slaughter live weight, kg51.21 ± 0.62 a48.07 ± 0.57 b46.19 ± 0.69 b
Hot carcass weight, kg26.71 ± 0.61 a23.09 ± 0.56 b21.62 ± 0.60 b
Dressing percentage, %52.16 ± 0.67 a48.03 ± 0.76 b46.81 ± 0.71 b
Meat yield: bone yield, %77.5: 22.575.4: 24.672.6: 27.4
Meatiness coefficient3.44 ± 0.17 a3.07 ± 0.14 a2.65 ± 0.19 b
Longissimus dorsi eye area, cm216.40 ± 0.10 a13.04 ± 0.13 b11.23 ± 0.12 c
Marbling score (5-point scale)4.88 ± 0.11 a3.95 ± 0.10 b2.74 ± 0.09 c
Note: Values are presented as mean ± standard error (SE), n = 12. Different superscript lowercase letters within a row indicate statistically significant differences among genotypes (p ≤ 0.05). Statistical analysis was performed using one-way analysis of variance (ANOVA) followed by Duncan’s multiple range test.
Table 6. Physicochemical properties of lamb meat from different crossbred genotypes (mean ± SE, n = 12).
ParameterKazakh Finewool × SuffolkKazakh Finewool × DorperKazakh Finewool × Edilbay
Protein (%)20.39 ± 0.10 a19.67 ± 0.20 b18.72 ± 0.10 c
Fat (%)11.44 ± 0.20 a8.16 ± 0.30 b7.12 ± 0.20 c
Moisture (%)66.93 ± 0.60 a71.22 ± 0.50 b73.37 ± 0.50 c
Ash (%)1.24 ± 0.02 a0.95 ± 0.01 b0.79 ± 0.01 c
Fatty acid value (mg KOH/g fat)0.88 ± 0.07 a0.87 ± 0.06 a0.75 ± 0.05 a
Note: Values are presented as mean ± standard error (SE), n = 12; protein, fat, moisture, and ash contents are expressed as percentages of the fresh (raw) meat sample. Statistical significance was considered at p ≤ 0.05. Different superscript letters within the same row indicate statistically significant differences between groups (p ≤ 0.05).
Table 7. Muscle pH of the Longissimus dorsi muscle from different crossbred lambs (mean ± SE, n = 12).
GenotypepH (24 h Postmortem)
Kazakh Finewool × Suffolk5.71 ± 0.03
Kazakh Finewool × Dorper5.72 ± 0.04
Kazakh Finewool × Edilbay5.70 ± 0.02
Note: Values are presented as mean ± SE (standard error). pH was measured 24 h postmortem in the m. Longissimus dorsi muscle.
Table 8. Instrumental color parameters (CIE L*, a*, b*, chroma C*, and hue angle h°) of the Longissimus dorsi muscle from different crossbred lambs (mean ± SE, n = 12).
Color ParameterKazakh Finewool × SuffolkKazakh Finewool × DorperKazakh Finewool × Edilbay
L* (lightness)44.20 ± 1.20 a47.80 ± 1.10 b45.80 ± 1.10 b
a* (redness)25.30 ± 1.00 a26.80 ± 0.90 b25.90 ± 0.90 b
b* (yellowness)12.90 ± 0.6013.80 ± 0.7014.60 ± 0.70
C* (chroma)28.40 ± 1.1030.15 ± 1.0029.73 ± 1.00
h° (hue angle)27.80 ± 1.2028.60 ± 1.1029.40 ± 1.10
Note: Values are presented as mean ± SE (standard error). Different superscript letters within the same row indicate significant differences between genotypes (p < 0.05). Color parameters were measured according to the CIE L*a*b* color system (ISO 11664-4:2019).
Table 9. Vitamin, mineral, and microbiological characteristics of the Longissimus dorsi muscle from different crossbred lambs (mean ± SE, n = 12).
IndicatorKazakh Finewool × SuffolkKazakh Finewool × DorperKazakh Finewool × Edilbay
Vitamins, mg/100 g
Vitamin E0.37 ± 0.004 a0.41 ± 0.004 a0.34 ± 0.003 b
Vitamin B10.106 ± 0.021 a0.124 ± 0.025 a0.118 ± 0.023 a
Vitamin B20.171 ± 0.072 a0.173 ± 0.035 a0.170 ± 0.034 a
Vitamin B36.03 ± 1.20 a5.99 ± 1.19 a5.86 ± 1.17 a
Vitamin B50.675 ± 0.135 a0.671 ± 0.134 a0.692 ± 0.138 a
Vitamin B60.330 ± 0.060 a0.338 ± 0.070 a0.333 ± 0.060 a
Mineral elements, mg/100 g
Zinc3.03 ± 0.02 a2.74 ± 0.04 b2.52 ± 0.02 c
Magnesium26.91 ± 0.29 a22.09 ± 0.20 b20.54 ± 0.25 c
Potassium387.60 ± 4.15 a353.60 ± 3.76 b304.18 ± 4.03 c
Calcium10.45 ± 0.10 a9.40 ± 0.08 b9.02 ± 0.12 c
Phosphorus193.65 ± 2.01 a188.01 ± 1.64 a179.61 ± 1.58 b
Sodium134.39 ± 1.47 a125.87 ± 1.19 b115.80 ± 1.40 c
Copper0.21 ± 0.001 a0.17 ± 0.007 b0.15 ± 0.003 c
Iron2.59 ± 0.01 a2.50 ± 0.01 a2.33 ± 0.04 b
Microbiological indicators
Total viable count (TVC), CFU/g2.1 × 102 a1.4 × 102 a1.7 × 102 a
Escherichia coli, in 1.0 g of productNot detectedNot detectedNot detected
Coliform bacteria (BGKP), in 1.0 g of productNot detectedNot detectedNot detected
Staphylococcus aureus, in 1.0 g of productNot detectedNot detectedNot detected
Molds and yeasts, CFU/gNot detectedNot detectedNot detected
Note: Values are presented as mean ± SE (standard error). Vitamin and mineral contents are expressed as mg/100 g of meat. Total viable count (TVC) is expressed as CFU/g. The same microbiological panel applied to the feed (Table 4) was also applied to the meat samples; Escherichia coli, coliform bacteria, and Staphylococcus aureus were not detected in 1.0 g of product, and molds and yeasts were not detected, in any of the three crossbred groups. Different superscript letters within the same row indicate statistically significant differences between groups (p ≤ 0.05).
Table 10. Fatty acid composition of the Longissimus dorsi muscle from different crossbred lambs (mean ± SE, n = 12).
Fatty AcidsKazakh Finewool × SuffolkKazakh Finewool × DorperKazakh Finewool × Edilbay
C10:00.25 ± 0.01 A0.18 ± 0.01 B0.18 ± 0.01 B
C12:00.25 ± 0.01 A0.14 ± 0.01 B0.14 ± 0.01 B
C14:01.62 ± 0.121.26 ± 0.071.26 ± 0.07
C16:019.13 ± 0.43 A18.30 ± 0.50 AB17.40 ± 0.38 B
C16:11.48 ± 0.08 AB1.77 ± 0.06 A0.95 ± 0.05 B
C18:025.21 ± 0.54 B27.76 ± 0.84 AB28.21 ± 0.42 A
C18:133.83 ± 0.6132.73 ± 0.6634.83 ± 0.88
C18:2 n-67.36 ± 0.368.48 ± 0.377.59 ± 0.38
C18:3 n-6 (γ-linolenic acid)0.03 ± 0.0060.04 ± 0.0030.02 ± 0.003
C18:3 n-31.70 ± 0.035 A0.88 ± 0.040 B0.95 ± 0.038 B
C20:00.75 ± 0.009 A0.66 ± 0.006 AB0.51 ± 0.006 B
CLA (c9, t11)0.57 ± 0.043 B1.49 ± 0.035 A1.53 ± 0.049 A
CLA (t9, t11)0.03 ± 0.003 B0.06 ± 0.003 A0.05 ± 0.009 AB
C20:4 n-66.38 ± 0.585.41 ± 0.595.40 ± 0.59
C20:5 n-30.91 ± 0.035 A0.44 ± 0.118 B0.56 ± 0.066 AB
C22:00.20 ± 0.0060.16 ± 0.0140.15 ± 0.012
C22:10.03 ± 0.0030.02 ± 0.0030.01 ± 0.003
C22:6 n-30.26 ± 0.0290.23 ± 0.0400.27 ± 0.038
SFA47.41 ± 0.3248.46 ± 0.2947.85 ± 0.35
MUFA35.34 ± 0.2934.52 ± 0.3235.79 ± 0.38
PUFA17.25 ± 0.35 B17.02 ± 0.38 AB16.37 ± 0.35 A
PUFA n-614.38 ± 0.2915.48 ± 0.3214.59 ± 0.30
PUFA n-32.87 ± 0.10 A1.54 ± 0.09 B1.78 ± 0.09 B
MUFA/SFA0.75 ± 0.0140.71 ± 0.0120.75 ± 0.014
PUFA/SFA0.36 ± 0.0120.35 ± 0.0090.34 ± 0.009
PUFA n-6/n-35.01 ± 0.2010.03 ± 0.358.21 ± 0.29
Note: Values are expressed as percentages of total identified fatty acids and presented as mean ± standard error (SE, n = 12). SFA, saturated fatty acids; MUFA, monounsaturated fatty acids; PUFA, polyunsaturated fatty acids; CLA, conjugated linoleic acid. PUFA n-6/n-3 represents the ratio of total n-6 to total n-3 PUFA. Different superscript capital letters (A, B, AB) within the same row indicate significant differences among genotypes (p < 0.05); values sharing a letter (or sharing AB with either neighbor) are not significantly different.
Table 11. Amino acid composition of the Longissimus dorsi muscle from different crossbred lambs (g/100 g protein, mean ± SE, n = 12).
Amino AcidKazakh Finewool × SuffolkKazakh Finewool × DorperKazakh Finewool × Edilbay
Arginine2.250 ± 0.9002.143 ± 0.8571.618 ± 0.647
Lysine2.000 ± 0.6802.143 ± 0.7292.206 ± 0.750
Tyrosine0.763 ± 0.2290.843 ± 0.2531.103 ± 0.331
Phenylalanine0.975 ± 0.2931.100 ± 0.3301.015 ± 0.304
Histidine0.675 ± 0.338 b0.743 ± 0.371 ab0.750 ± 0.375 a
Leucine + Isoleucine1.500 ± 0.390 b1.571 ± 0.409 ab1.618 ± 0.421 a
Methionine0.663 ± 0.2250.729 ± 0.2480.809 ± 0.275
Valine1.375 ± 0.5501.429 ± 0.5711.618 ± 0.647
Proline1.088 ± 0.2831.171 ± 0.3051.176 ± 0.306
Threonine1.050 ± 0.4201.029 ± 0.4111.088 ± 0.435
Serine0.688 ± 0.1790.657 ± 0.1710.691 ± 0.180
Alanine1.375 ± 0.3581.429 ± 0.3711.471 ± 0.382
Glycine1.000 ± 0.340 b1.029 ± 0.350 b1.044 ± 0.355 a
Note: Amino acid composition was determined according to GOST R 55569–2013. Values are expressed as g/100 g protein and presented as mean ± standard error (SE), n = 12. Means with different superscript letters (a, b) within the same row differ significantly according to one-way ANOVA followed by Duncan’s multiple range test (p < 0.05). Means sharing at least one superscript letter are not significantly different.
Disclaimer/Publisher’s Note: The statements, opinions and data contained in all publications are solely those of the individual author(s) and contributor(s) and not of MDPI and/or the editor(s). MDPI and/or the editor(s) disclaim responsibility for any injury to people or property resulting from any ideas, methods, instructions or products referred to in the content.