
Investigation of Effects of Low Ruminal pH Values on Serum Concentrations of Macrominerals, Trace Elements, and Vitamins and Oxidative Status of Dairy Cows

 ,
,  , , ,
, , ,  ,
,
Simple Summary
Abstract
1. Introduction
2. Materials and Methods
2.1. Animals and Experimental Design
2.2. Blood Collection and Laboratory Analysis
2.3. Macro and Trace Element Analysis
2.4. Vitamin (A, D, E, and K) Analysis
2.5. Malondialdehyde (MDA) Determination
2.6. Glutathione (GSH) Determination
2.7. Data Analysis
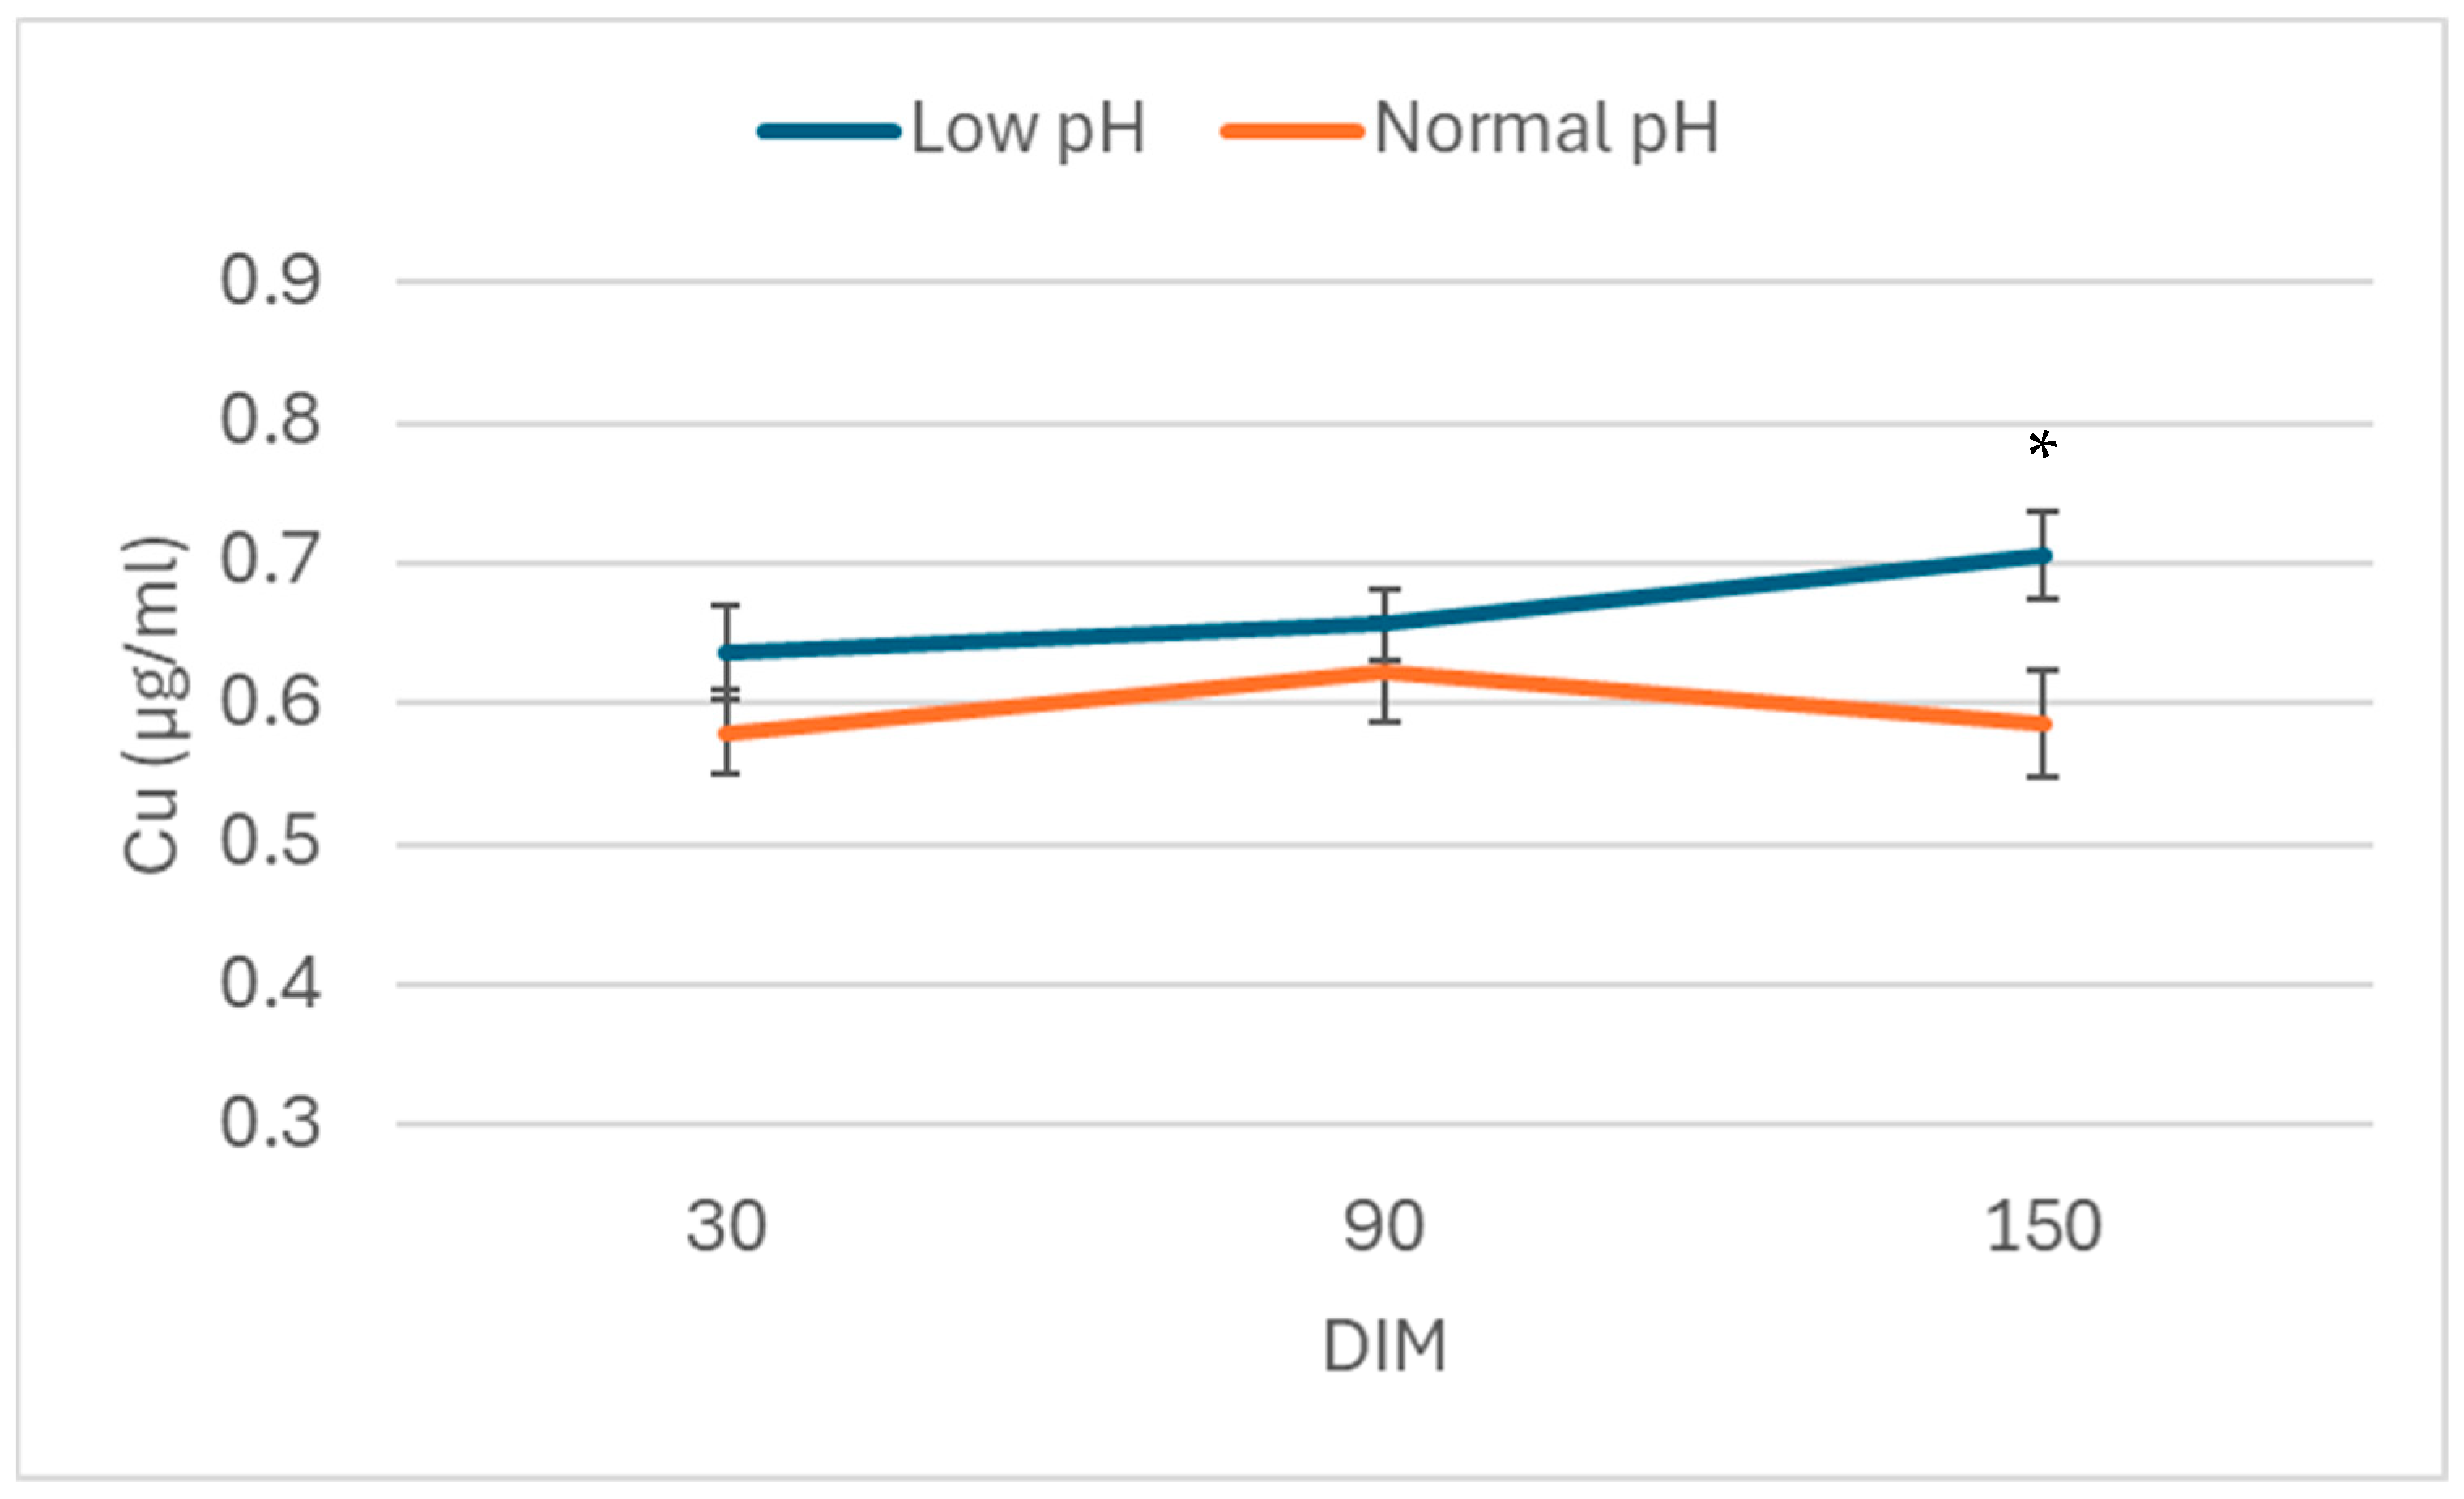
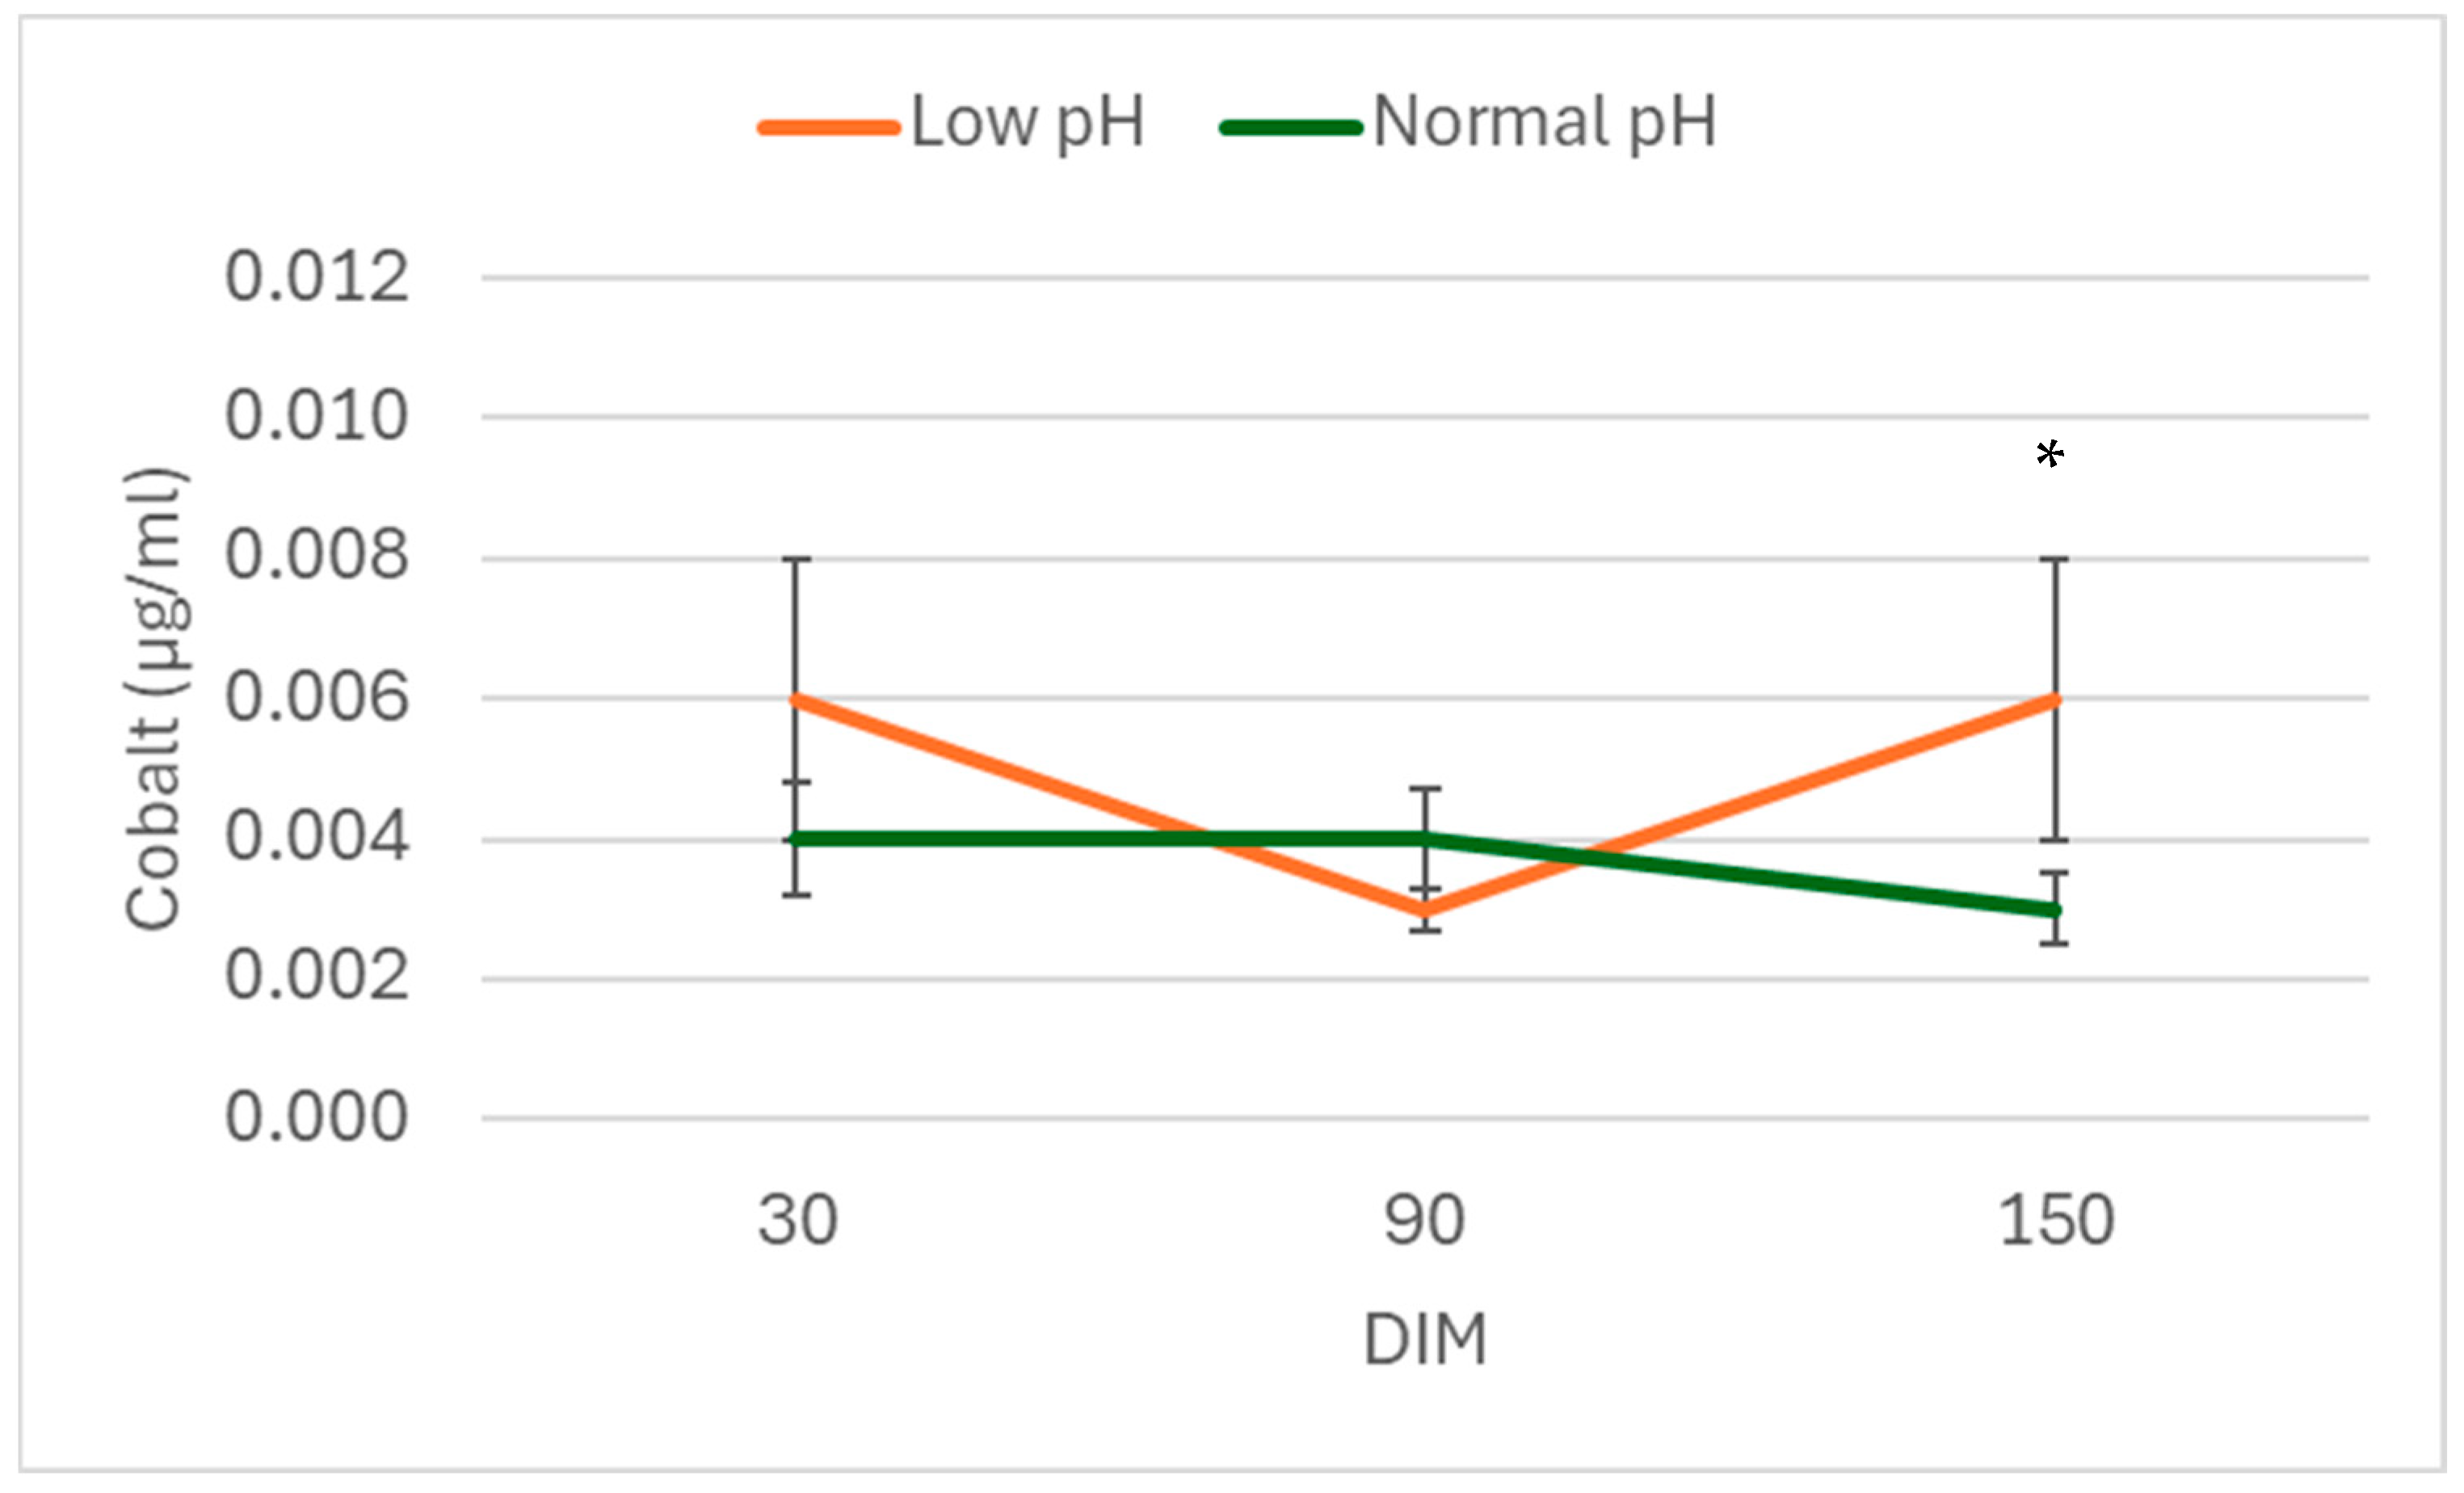
3. Results
4. Discussion
5. Conclusions
Author Contributions
Funding
Institutional Review Board Statement
Informed Consent Statement
Data Availability Statement
Conflicts of Interest
References
- Liu, K.; Zhang, Y.; Yu, Z.; Xu, Q.; Zheng, N.; Zhao, S.; Huang, G.; Wang, J. Ruminal Microbiota–Host Interaction and Its Effect on Nutrient Metabolism. Anim. Nutr. 2021, 7, 49–55. [Google Scholar] [CrossRef]
- Faniyi, T.O.; Owolabi, A.; Soyelu, O.T. Rumen pH and Microbial Shift: Implications for Ruminant Nutrition-a Review. Niger. J. Anim. Prod. 2024, 51, 103–120. [Google Scholar] [CrossRef]
- Elmhadi, M.E.; Ali, D.K.; Khogali, M.K.; Wang, H. Subacute Ruminal Acidosis in Dairy Herds: Microbiological and Nutritional Causes, Consequences, and Prevention Strategies. Anim. Nutr. 2022, 10, 148–155. [Google Scholar] [CrossRef] [PubMed]
- Kitkas, G.C.; Valergakis, G.E.; Kritsepi-Konstantinou, M.; Gelasakis, A.I.; Katsoulos, P.D.; Kalaitzakis, E.; Panousis, N.K. Association between Ruminal pH and Rumen Fatty Acids Concentrations of Holstein Cows during the First Half of Lactation. Ruminants 2022, 2, 382–389. [Google Scholar] [CrossRef]
- Spears, J.W. Trace Mineral Bioavailability in Ruminants. J. Nutr. 2003, 133, 1506S–1509S. [Google Scholar] [CrossRef]
- Underwood, E.J.; Suttle, N.F. The Mineral Nutrition of Livestock, 3rd ed.; CABI Publishing: Wallingford, UK, 1999; ISBN 978-0-85199-128-3. [Google Scholar]
- Tsuchiya, Y.; Ozai, R.; Sugino, T.; Kawashima, K.; Kushibiki, S.; Kim, Y.-H.; Sato, S. Changes in Peripheral Blood Oxidative Stress Markers and Hepatic Gene Expression Related to Oxidative Stress in Holstein Cows with and without Subacute Ruminal Acidosis during the Periparturient Period. J. Vet. Med. Sci. 2020, 82, 1529–1536. [Google Scholar] [CrossRef]
- Ma, N.; Abaker, J.A.; Wei, G.; Chen, H.; Shen, X.; Chang, G. A High-Concentrate Diet Induces an Inflammatory Response and Oxidative Stress and Depresses Milk Fat Synthesis in the Mammary Gland of Dairy Cows. J. Dairy Sci. 2022, 105, 5493–5505. [Google Scholar] [CrossRef] [PubMed]
- Koekkoek, W.A.C.; van Zanten, A.R. Antioxidant Vitamins and Trace Elements in Critical Illness. Nutr. Clin. Pract. 2016, 31, 457–474. [Google Scholar] [CrossRef]
- Dijkstra, J.; Ellis, J.L.; Kebreab, E.; Strathe, A.B.; López, S.; France, J.; Bannink, A. Ruminal pH Regulation and Nutritional Consequences of Low pH. Anim. Feed Sci. Technol. 2012, 172, 22–33. [Google Scholar] [CrossRef]
- Vargas, J.E.; López-Ferreras, L.; Andrés, S.; Mateos, I.; Horst, E.H.; López, S. Differential Diet and pH Effects on Ruminal Microbiota, Fermentation Pattern and Fatty Acid Hydrogenation in RUSITEC Continuous Cultures. Fermentation 2023, 9, 320. [Google Scholar] [CrossRef]
- Xu, Y.; Ding, Z. Physiological, Biochemical and Histopathological Effects of Fermentative Acidosis in Ruminant Production: A Minimal Review. Span. J. Agric. Res. 2011, 9, 414–422. [Google Scholar] [CrossRef]
- Chen, Y.-H.; Chen, Y.-M.; Tu, P.-A.; Lee, K.-H.; Chen, J.-Y.; Hsu, J.-T. Effect of Supplementing Vitamin E, Selenium, Copper, Zinc, and Manganese during the Transition Period on Dairy Cow Reproductive Performance and Immune Function. Vet. Sci. 2023, 10, 225. [Google Scholar] [CrossRef] [PubMed]
- El-Sayed, A.; Ebissy, E.; Mohamed, R.; Ateya, A. Effects of Antioxidant Vitamins (A, D, E) and Trace Elements (Cu, Mn, Se, Zn) Administration on Gene Expression, Metabolic, Antioxidants and Immunological Profiles during Transition Period in Dromedary Camels. BMC Vet. Res. 2024, 20, 101. [Google Scholar] [CrossRef]
- Yatoo, M.I.; Saxena, A.; Deepa, P.M.; Habeab, B.P.; Devi, S.; Jatav, R.S.; Dimri, U. Role of Trace Elements in Animals: A Review. Vet. World 2013, 6, 963–967. [Google Scholar] [CrossRef]
- Engle, T.E. Copper and Lipid Metabolism in Beef Cattle: A Review. J. Anim. Sci. 2011, 89, 591–596. [Google Scholar] [CrossRef]
- Gressley, T.F. Zinc, copper, manganese, and selenium in dairy cattle rations. In Proceedings of the 7th annual mid-Atlantic nutrition conference, Maryland, MD, USA, 26–27 March 2009; College Park: University of Maryland: Maryland, MD, USA. [Google Scholar]
- Kretsinger, R.H.; Uversky, V.N.; Permyakov, E.A. Encyclopedia of Metalloproteins; Springer: New York, NY, USA, 2013; ISBN 978-1-4614-1532-9. [Google Scholar]
- Malik, M.I.; Jonker, A.; Raboisson, D.; Song, B.; Rashid, M.A.; Sun, X. Effects of Dietary Chromium Supplementation on Blood Biochemical Parameters in Dairy Cows: A Multilevel Meta-Analytical Approach. J. Dairy Sci. 2024, 107, 301–316. [Google Scholar] [CrossRef]
- Wysocka, D.; Snarska, A.; Sobiech, P.H. Iron in Cattle Health. J. Elem. 2020, 25, 1175–1185. [Google Scholar] [CrossRef]
- Wang, R.L.; Liang, J.G.; Lu, L.; Zhang, L.Y.; Li, S.F.; Luo, X.G. Effect of Zinc Source on Performance, Zinc Status, Immune Response, and Rumen Fermentation of Lactating Cows. Biol. Trace Elem. Res. 2013, 152, 16–24. [Google Scholar] [CrossRef] [PubMed]
- Xu, N.N.; Yang, D.T.; Miao, C.; Valencak, T.G.; Liu, J.X.; Ren, D.X. Organic Zinc Supplementation in Early-Lactation Dairy Cows and Its Effects on Zinc Content and Distribution in Milk and Cheese. JDS Commun. 2021, 2, 110–113. [Google Scholar] [CrossRef] [PubMed]
- González-Montaña, J.-R.; Escalera-Valente, F.; Alonso, A.J.; Lomillos, J.M.; Robles, R.; Alonso, M.E. Relationship between Vitamin B12 and Cobalt Metabolism in Domestic Ruminant: An Update. Animals 2020, 10, 1855. [Google Scholar] [CrossRef]
- Hilal, E.Y.; Elkhairey, M.A.E.; Osman, A.O.A. The Role of Zinc, Manganse and Copper in Rumen Metabolism and Immune Function: A Review Article. Open J. Anim. Sci. 2016, 6, 304–324. [Google Scholar] [CrossRef]
- Khan, M.Z.; Huang, B.; Kou, X.; Chen, Y.; Liang, H.; Ullah, Q.; Khan, I.M.; Khan, A.; Chai, W.; Wang, C. Enhancing Bovine Immune, Antioxidant and Anti-Inflammatory Responses with Vitamins, Rumen-Protected Amino Acids, and Trace Minerals to Prevent Periparturient Mastitis. Front. Immunol. 2024, 14, 1290044. [Google Scholar] [CrossRef]
- Gürbüz, M.; Aktaç, Ş. Understanding the role of vitamin A and its precursors in the immune system. Available online: https://www.em-consulte.com/article/1526806/article/understanding-the-role-of-vitamin-a-and-its-precur (accessed on 28 June 2025).
- Jin, L.; Yan, S.; Shi, B.; Bao, H.; Gong, J.; Guo, X.; Li, J. Effects of Vitamin A on the Milk Performance, Antioxidant Functions and Immune Functions of Dairy Cows. Anim. Feed Sci. Technol. 2014, 192, 15–23. [Google Scholar] [CrossRef]
- Eder, K.; Grundmann, S.M. Vitamin D in Dairy Cows: Metabolism, Status and Functions in the Immune System. Arch. Anim. Nutr. 2022, 76, 1–33. [Google Scholar] [CrossRef] [PubMed]
- Kuhn, M.J.; Sordillo, L.M. Vitamin E Analogs Limit in Vitro Oxidant Damage to Bovine Mammary Endothelial Cells. J. Dairy Sci. 2021, 104, 7154–7167. [Google Scholar] [CrossRef]
- Xiao, J.; Khan, M.Z.; Ma, Y.; Alugongo, G.M.; Ma, J.; Chen, T.; Khan, A.; Cao, Z. The Antioxidant Properties of Selenium and Vitamin E.; Their Role in Periparturient Dairy Cattle Health Regulation. Antioxidants 2021, 10, 1555. [Google Scholar] [CrossRef]
- Bai, H.; Arai, H.; Ikuta, K.; Ishikawa, S.; Ohtani, Y.; Iwashita, K.; Okada, N.; Shirakawa, H.; Komai, M.; Terada, F.; et al. Effects of Dietary Vitamin K3 Supplementation on Vitamin K1 and K2 (Menaquinone) Dynamics in Dairy Cows. Anim. Sci. J. 2022, 93, e13680. [Google Scholar] [CrossRef] [PubMed]
- Kuroiwa, T.; Ohtani, Y.; Obara, Y.; Terada, F.; Watanabe, K.; Shirakawa, H.; Komai, M.; Satoh, H.; Sato, S.; Ichijo, T. Effect of Vitamin K3 Supplementation on Immunoglobulin G Concentration in Colostrum of Periparturient Holstein Dairy Cows. Anim. Sci. J. 2022, 93, e13706. [Google Scholar] [CrossRef]
- Kitkas, G.C.; Valergakis, G.E.; Karatzias, H.; Panousis, N. Subacute Ruminal Acidosis: Prevalence and Risk Factors in Greek Dairy Herds. Ir. J. Vet. Res. 2013, 14, 183–189. [Google Scholar] [CrossRef]
- National Research Council, Committee on Animal Nutrition, and Subcommittee on Dairy Cattle Nutrition. Nutrient Requirements of Dairy Cattle: Eighth Revised Edition; National Academies Press: Washington, DC, USA, 2021; ISBN 978-0-309-67777-6. [Google Scholar]
- Garrett, E.F.; Pereira, M.N.; Nordlund, K.V.; Armentano, L.E.; Goodger, W.J.; Oetzel, G.R. Diagnostic Methods for the Detection of Subacute Ruminal Acidosis in Dairy Cows. J. Dairy Sci. 1999, 82, 1170–1178. [Google Scholar] [CrossRef]
- Oetzel, G.R. Monitoring and Testing Dairy Herds for Metabolic Disease. Vet. Clin. N. Am. Food Anim. Pract. 2004, 20, 651–674. [Google Scholar] [CrossRef]
- Su, Q.; Rowley, K.G.; Balazs, N.D.H. Carotenoids: Separation Methods Applicable to Biological Samples. J. Chromatogr. B Analyt. Technol. Biomed. Life Sci. 2002, 781, 393–418. [Google Scholar] [CrossRef]
- Siluk, D.; Oliveira, R.V.; Esther-Rodriguez-Rosas, M.; Ling, S.; Bos, A.; Ferrucci, L.; Wainer, I.W. A Validated Liquid Chromatography Method for the Simultaneous Determination of Vitamins A and E in Human Plasma. J. Pharm. Biomed. Anal. 2007, 44, 1001–1007. [Google Scholar] [CrossRef]
- Draper, H.H.; Hadley, M. Malondialdehyde Determination as Index of Lipid Peroxidation. Methods Enzymol. 1990, 186, 421–431. [Google Scholar] [CrossRef] [PubMed]
- Khorrami, B.; Khiaosa-ard, R.; Zebeli, Q. Models to Predict the Risk of Subacute Ruminal Acidosis in Dairy Cows Based on Dietary and Cow Factors: A Meta-Analysis. J. Dairy Sci. 2021, 104, 7761–7780. [Google Scholar] [CrossRef] [PubMed]
- Martens, H.; Schweigel, M. Pathophysiology of Grass Tetany and Other Hypomagnesemias. Implications for Clinical Management. Vet. Clin. N. Am. Food Anim. Pract. 2000, 16, 339–368. [Google Scholar] [CrossRef]
- Plaizier, J.C.; Krause, D.O.; Gozho, G.N.; McBride, B.W. Subacute Ruminal Acidosis in Dairy Cows: The Physiological Causes, Incidence and Consequences. Vet. J. 2008, 176, 21–31. [Google Scholar] [CrossRef] [PubMed]
- Santschi, D.E.; Berthiaume, R.; Matte, J.J.; Mustafa, A.F.; Girard, C.L. Fate of Supplementary B-Vitamins in the Gastrointestinal Tract of Dairy Cows. J. Dairy Sci. 2005, 88, 2043–2054. [Google Scholar] [CrossRef]
- Steele, M.A.; AlZahal, O.; Hook, S.E.; Croom, J.; McBride, B.W. Ruminal Acidosis and the Rapid Onset of Ruminal Parakeratosis in a Mature Dairy Cow: A Case Report. Acta. Vet. Scand. 2009, 51, 39. [Google Scholar] [CrossRef]
- Gulhar, R.; Ashraf, M.A.; Jialal, I. Physiology, Acute Phase Reactants. In StatPearls; StatPearls Publishing: Treasure Island, FL, USA, 2025. [Google Scholar]
- Spiers, J.G.; Tan, L.S.; Anderson, S.T.; Hill, A.F.; Lavidis, N.A.; Chen, H.-J.C. Hepatic Homeostasis of Metal Ions Following Acute Repeated Stress Exposure in Rats. Antioxidants 2021, 11, 85. [Google Scholar] [CrossRef]
- Li, S.; Gozho, G.N.; Gakhar, N.; Khafipour, E.; Krause, D.O.; Plaizier, J.C. Evaluation of Diagnostic Measures for Subacute Ruminal Acidosis in Dairy Cows. Can. J. Anim. Sci. 2012, 92, 353–364. [Google Scholar] [CrossRef]
- Morar, D.; Văduva, C.; Morar, A.; Imre, M.; Tulcan, C.; Imre, K. Paraclinical Changes Occurring in Dairy Cows with Spontaneous Subacute Ruminal Acidosis under Field Conditions. Animals 2022, 12, 2466. [Google Scholar] [CrossRef]
- Danscher, A.M.; Li, S.; Andersen, P.H.; Khafipour, E.; Kristensen, N.B.; Plaizier, J.C. Indicators of Induced Subacute Ruminal Acidosis (SARA) in Danish Holstein Cows. Acta. Vet. Scand. 2015, 57, 39. [Google Scholar] [CrossRef] [PubMed]
- Knowlton, K.F.; Herbein, J.H. Phosphorus Partitioning During Early Lactation in Dairy Cows Fed Diets Varying in Phosphorus Content1. J. Dairy Sci. 2002, 85, 1227–1236. [Google Scholar] [CrossRef]
- Dias, R.S.; López, S.; Montanholi, Y.R.; Smith, B.; Haas, L.S.; Miller, S.P.; France, J. A Meta-Analysis of the Effects of Dietary Copper, Molybdenum, and Sulfur on Plasma and Liver Copper, Weight Gain, and Feed Conversion in Growing-Finishing Cattle1. J. Anim. Sci. 2013, 91, 5714–5723. [Google Scholar] [CrossRef]
- Clarke, N.J.; Laurie, S.H. The Copper-Molybdenum Antagonism in Ruminants. I. The Formation of Thiomolybdates in Animal Rumen. J. Inorg. Biochem. 1980, 12, 37–43. [Google Scholar] [CrossRef] [PubMed]
- McCaughern, J.H.; Mackenzie, A.M.; Sinclair, L.A. Dietary Starch Concentration Alters Reticular pH, Hepatic Copper Concentration, and Performance in Lactating Holstein-Friesian Dairy Cows Receiving Added Dietary Sulfur and Molybdenum. J. Dairy Sci. 2020, 103, 9024–9036. [Google Scholar] [CrossRef] [PubMed]
- Sheldon, I.M.; Noakes, D.E.; Rycroft, A.; Dobson, H. Acute Phase Protein Responses to Uterine Bacterial Contamination in Caftle after Calving. Vet. Rec. 2001, 148, 172–175. [Google Scholar] [CrossRef]
- Szczubial, M.; Dąbrowski, R.; Kankofer, M.; Bochniarz, M.; Albera, E. Concentration of Serum Amyloid A and Activity of Ceruloplasmin in Milk from Cows with Clinical and Subelinical Mastitis. Bull. Vet. Inst. Puławy 2008, 52, 391–395. [Google Scholar]
- Hellman, N.E.; Gitlin, J.D. Ceruloplasmin metabolism and function. Annu. Rev. Nutr. 2002, 22, 439–458. [Google Scholar] [CrossRef]
- Zhao, C.; Liu, G.; Li, X.; Guan, Y.; Wang, Y.; Yuan, X.; Sun, G.; Wang, Z.; Li, X. Inflammatory Mechanism of Rumenitis in Dairy Cows with Subacute Ruminal Acidosis. BMC Vet. Res. 2018, 14, 135. [Google Scholar] [CrossRef]
- Hussein, H.A.; Staufenbiel, R. Variations in Copper Concentration and Ceruloplasmin Activity of Dairy Cows in Relation to Lactation Stages with Regard to Ceruloplasmin to Copper Ratios. Biol. Trace Elem. Res. 2012, 146, 47–52. [Google Scholar] [CrossRef]
- Gaware, V.; Kotade, K.; Dhamak, K.; Somawanshi, S. Ceruloplasmin its role and significance: A review. Int. J. Biomed. Res. 2010, 5, 10–7439. [Google Scholar] [CrossRef]
- Kincaid, R.L.; Lefebvre, L.E.; Cronrath, J.D.; Socha, M.T.; Johnson, A.B. Effect of Dietary Cobalt Supplementation on Cobalt Metabolism and Performance of Dairy Cattle. J. Dairy Sci. 2003, 86, 1405–1414. [Google Scholar] [CrossRef]
- Kitkas, G.C.; Valergakis, G.E.; Kritsepi-Konstantinou, M.; Gelasakis, A.I.; Arsenos, G.; Kalaitzakis, E.; Panousis, N. Effects of Ruminal pH and Subacute Ruminal Acidosis on Milk Yield and Composition of Holstein Cows in Different Stages of Lactation. J. Hell. Vet. Med. Soc. 2019, 70, 1551–1560. [Google Scholar] [CrossRef]
- Schwalfenberg, G.K.; Genuis, S.J. Vitamin D, Essential Minerals, and Toxic Elements: Exploring Interactions between Nutrients and Toxicants in Clinical Medicine. Sci. World J. 2015, 2015, 318595. [Google Scholar] [CrossRef] [PubMed]
- Brewer, K.; Maylin, G.; Fenger, C.; Tobin, T. Cobalt Use and Regulation in Horseracing: A Review. Comp. Exerc. Physiol. 2016, 12, 1–10. [Google Scholar] [CrossRef]
- Guo, Y.; Xu, X.; Zou, Y.; Yang, Z.; Li, S.; Cao, Z. Changes in Feed Intake, Nutrient Digestion, Plasma Metabolites, and Oxidative Stress Parameters in Dairy Cows with Subacute Ruminal Acidosis and Its Regulation with Pelleted Beet Pulp. J. Anim. Sci. Biotechnol. 2013, 4, 31. [Google Scholar] [CrossRef]
- Abaker, J.A.; Xu, T.L.; Jin, D.; Chang, G.J.; Zhang, K.; Shen, X.Z. Lipopolysaccharide Derived from the Digestive Tract Provokes Oxidative Stress in the Liver of Dairy Cows Fed a High-Grain Diet. J. Dairy Sci. 2017, 100, 666–678. [Google Scholar] [CrossRef]
- Zhang, H.; Xue, Y.; Xie, W.; Wang, Y.; Ma, N.; Chang, G.; Shen, X. Subacute Ruminal Acidosis Downregulates FOXA2, Changes Oxidative Status, and Induces Autophagy in the Livers of Dairy Cows Fed a High-Concentrate Diet. J. Dairy Sci. 2023, 106, 2007–2018. [Google Scholar] [CrossRef] [PubMed]
- Colakoglu, H.E.; Yazlik, M.O.; Kaya, U.; Colakoglu, E.C.; Kurt, S.; Oz, B.; Bayramoglu, R.; Vural, M.R.; Kuplulu, S. MDA and GSH-Px Activity in Transition Dairy Cows Under Seasonal Variations and Their Relationship with Reproductive Performance. J. Vet. Res. 2017, 61, 497–502. [Google Scholar] [CrossRef] [PubMed]
- Younis, M.; El-Ashker, M.; El-Diasty, M.; Youssef, M.; El-khodery, S. Oxidative Stress in Transition Dairy Cattle: Current Knowledge and the Potential Impact of Supplementing Organic Trace Elements. Asian J. Res. Anim. Vet. Sci. 2021, 7, 1–21. [Google Scholar] [CrossRef]


| Parameters | Assigned Value |
|---|---|
| Plasma gas flow rate | 15 L/min |
| Argon carrier flow rate | 0.5 L/min |
| Sample flow rate | 1.51 L/min |
| The speed of the peristaltic pump | 100 rpm |
| RF power | 1150 W |
| Parameter | DIM | pH Status Mean | |||
|---|---|---|---|---|---|
| 30 | 90 | 150 | |||
| Ca (μg/mL) | Low pH | 90.03 ± 2.54 | 85.77 ± 2.45 | 90.41 ± 2.45 | 88.73 ± 1.44 |
| Normal pH | 83.27 ± 2.45 | 88.27 ± 2.59 | 89.67 ± 2.90 | 87.07 ± 1.53 | |
| DIM mean | 86.65 ± 1.77 | 87.02 ± 1.80 | 90.04 ± 1.90 | ||
| P (μg/mL) | Low pH | 117.47 ± 7.34 | 144.51 ± 7.20 | 162.56 ± 7.07 | 141.51 ± 4.16 |
| Normal pH | 115.83 ± 7.07 | 145.14 ± 7.48 | 152.06 ± 8.37 | 137.68 ± 4.42 | |
| DIM mean | 116.65 ± 5.10 A | 144.82 ± 5.19 B | 157.31 ± 5.48 B | ||
| Mg (μg/mL) | Low pH | 20.78 ± 0.67 | 20.70 ± 0.66 | 21.35 ± 0.65 | 20.95 ± 0.38 |
| Normal pH | 20.72 ± 0.65 | 21.34 ± 0.68 | 19.23 ± 0.77 | 20.43 ± 0.40 | |
| DIM mean | 20.75 ± 0.47 A | 21.02 ± 0.48 A | 20.29 ± 0.502 A | ||
| K (μg/mL) | Low pH | 108.04 ± 6.69 | 120.07 ± 6.69 | 103.85 ± 6.43 | 110.65 ± 3.81 |
| Normal pH | 94.58 ± 6.55 | 111.90 ± 6.55 | 102.25 ± 7.52 | 102.91 ± 4.00 | |
| DIM mean | 101.31 ± 4.68 | 115.98 ± 4.68 A | 103.05 ± 4.94 | ||
| Parameter | DIM | pH Status Mean | |||
|---|---|---|---|---|---|
| 30 | 90 | 150 | |||
| Cr (μg/mL) | Low pH | 0.032 ± 0.010 | 0.032 ± 0.010 | 0.039 ± 0.009 | 0.034 ± 0.006 |
| Normal pH | 0.036 ± 0.009 | 0.027 ± 0.010 | 0.020 ± 0.011 | 0.028 ± 0.006 | |
| DIM mean | 0.034 ± 0.007 | 0.029 ± 0.007 | 0.029 ± 0.007 | ||
| Mn (μg/mL) | Low pH | 0.004 ± 0.0006 | 0.003 ± 0.0006 | 0.005 ± 0.0006 | 0.004 ± 0.0004 |
| Normal pH | 0.003 ± 0.0006 | 0.004 ± 0.0006 | 0.004 ± 0.0007 | 0.004 ± 0.0004 | |
| DIM mean | 0.004 ± 0.0004 | 0.004 ± 0.0004 | 0.004 ± 0.0005 | ||
| Se (μg/mL) | Low pH | 0.457 ± 0.030 | 0.469 ± 0.029 | 0.483 ± 0.029 | 0.470 ± 0.017 |
| Normal pH | 0.399 ± 0.029 | 0.496 ± 0.030 | 0.459 ± 0.034 | 0.451 ± 0.018 | |
| DIM mean | 0.428 ± 0.021 | 0.483 ± 0.021 | 0.471 ± 0.022 | ||
| Zn (μg/mL) | Low pH | 0.507 ± 0.027 | 0.500 ± 0.026 | 0.572 ± 0.026 | 0.526 ± 0.015 |
| Normal pH | 0.464 ± 0.026 | 0.519 ± 0.027 | 0.500 ± 0.030 | 0.494 ± 0.016 | |
| DIM mean | 0.485 ± 0.019 | 0.510 ± 0.019 | 0.536 ± 0.020 | ||
| Parameter | DIM | pH Status Mean | |||
|---|---|---|---|---|---|
| 30 | 90 | 150 | |||
| Vit. A (μg/mL) | Low pH | 1.109 ± 0.141 | 1.042 ± 0.164 | 1.126 ± 0.128 | 1.092 ± 0.084 |
| Normal pH | 1.208 ± 0.148 | 1.318 ± 0.141 | 1.092 ± 0.164 | 1.206 ± 0.082 | |
| DIM mean | 1.158 ± 0.102 | 1.180 ± 0.108 | 1.109 ± 0.104 | ||
| Vit. D (μg/mL) | Low pH | 0.183 ± 0.025 | 0.178 ± 0.028 | 0.169 ± 0.022 | 0.177 ± 0.014 |
| Normal pH | 0.160 ± 0.025 | 0.209 ± 0.024 | 0.165 ± 0.028 | 0.178 ± 0.015 | |
| DIM mean | 0.171 ± 0.018 | 0.193 ± 0.018 | 0.167 ± 0.018 | ||
| Vit. E (μg/mL) | Low pH | 1.020 ± 0.121 | 1.195 ± 0.140 | 1.290 ± 0.114 | 1.168 ± 0.072 |
| Normal pH | 0.943 ± 0.129 | 0.900 ± 0.124 | 1.096 ± 0.140 | 0.980 ± 0.076 | |
| DIM mean | 0.982 ± 0.089 | 1.048 ± 0.093 | 1.193 ± 0.090 | ||
| Vit. K (μg/mL) | Low pH | 0.797 ± 0.110 | 0.715 ± 0.124 | 0.731 ± 0.099 | 0.748 ± 0.064 |
| Normal pH | 0.752 ± 0.112 | 0.856 ± 0.107 | 0.699 ± 0.124 | 0.769 ± 0.066 | |
| DIM mean | 0.774 ± 0.078 | 0.785 ± 0.082 | 0.715 ± 0.079 | ||
| MDA (μmol/L) | Low pH | 17.485 ± 1.155 | 15.526 ± 1.138 | 16.657 ± 1.155 | 16.556 ± 0.664 |
| Normal pH | 16.022 ± 1.414 | 14.500 ± 1.106 | 16.868 ± 1.254 | 15.797 ± 0.730 | |
| DIM mean | 16.753 ± 0.913 | 15.013 ± 0.793 | 16.763 ± 0.852 | ||
| GSH (μmol/L) | Low pH | 23.691 ± 2.962 | 23.018 ± 2.918 | 27.367 ± 2.962 | 24.692 ± 1.702 |
| Normal pH | 26.880 ± 3.628 | 21.562 ± 2.836 | 26.474 ± 3.216 | 24.972 ± 1.872 | |
| DIM mean | 25.285 ± 2.342 | 22.290 ± 2.035 | 26.921 ± 2.186 | ||
Disclaimer/Publisher’s Note: The statements, opinions and data contained in all publications are solely those of the individual author(s) and contributor(s) and not of MDPI and/or the editor(s). MDPI and/or the editor(s) disclaim responsibility for any injury to people or property resulting from any ideas, methods, instructions or products referred to in the content. |
© 2025 by the authors. Licensee MDPI, Basel, Switzerland. This article is an open access article distributed under the terms and conditions of the Creative Commons Attribution (CC BY) license (https://creativecommons.org/licenses/by/4.0/).
Share and Cite
Katsoulos, P.D.; Bilgiç, B.; Tarhan, D.; Ateş, F.; Ekin, S.; Kozat, S.; Dokuzeylül, B.; Or, M.E.; Kalaitzakis, E.; Valergakis, G.E.; et al. Investigation of Effects of Low Ruminal pH Values on Serum Concentrations of Macrominerals, Trace Elements, and Vitamins and Oxidative Status of Dairy Cows. Ruminants 2025, 5, 35. https://doi.org/10.3390/ruminants5030035
Katsoulos PD, Bilgiç B, Tarhan D, Ateş F, Ekin S, Kozat S, Dokuzeylül B, Or ME, Kalaitzakis E, Valergakis GE, et al. Investigation of Effects of Low Ruminal pH Values on Serum Concentrations of Macrominerals, Trace Elements, and Vitamins and Oxidative Status of Dairy Cows. Ruminants. 2025; 5(3):35. https://doi.org/10.3390/ruminants5030035
Chicago/Turabian StyleKatsoulos, Panagiotis D., Bengü Bilgiç, Duygu Tarhan, Fatma Ateş, Suat Ekin, Süleyman Kozat, Banu Dokuzeylül, Mehmet Erman Or, Emmanouil Kalaitzakis, Georgios E. Valergakis, and et al. 2025. "Investigation of Effects of Low Ruminal pH Values on Serum Concentrations of Macrominerals, Trace Elements, and Vitamins and Oxidative Status of Dairy Cows" Ruminants 5, no. 3: 35. https://doi.org/10.3390/ruminants5030035
APA StyleKatsoulos, P. D., Bilgiç, B., Tarhan, D., Ateş, F., Ekin, S., Kozat, S., Dokuzeylül, B., Or, M. E., Kalaitzakis, E., Valergakis, G. E., & Panousis, N. (2025). Investigation of Effects of Low Ruminal pH Values on Serum Concentrations of Macrominerals, Trace Elements, and Vitamins and Oxidative Status of Dairy Cows. Ruminants, 5(3), 35. https://doi.org/10.3390/ruminants5030035