1. Introduction
Since the first mentions of the electromagnetic radiation (EMR) effect when loading non-piezoelectric materials [
1] to the present day, there are many studies on the relationship between EMR and geodynamic manifestations in rock masses. Most of the works on the topic electromagnetic radiation associated with multiscale failure in mines, that is, the relationship between EMR and changes in the stress strain state (SSS) in underground workings, is devoted to EMR measurements in coal mines, mine workings and laboratory tests on coal samples. The basis of these works is the control and forecast of mining-induced stress field propagation [
2], precursors for rock, coal and gas outbursts [
3,
4], the catastrophic displacements of massifs and active faults [
5,
6], EM characteristics of rocks and main influencing factors [
7,
8].
There are relatively few works on EMR registration in transport tunnels, but they sound quite convincing and allow for reliance on the results of EMR registration when assessing the change in the SSS of the “tunnel lining-enclosing rock mass” system with a high level of manmade interference, and even create systems for continuous monitoring of EMR–same as the EMR monitoring systems in coal mines [
9,
10]. Applications of EMR have proved their use and reliability even for railway and auto tunnels in use.
It was shown in [
6] that the regional stress field induces a secondary stress field around the space of the local railway tunnel. As a result of the highest shear stresses, micro-cracks are formed that emit EMR. From EMR measured along the cross-section and the long axis of the tunnel, the regional stress field is determined by a correlation of detected impulses per time with stresses calculated from the orientation of the tunnel, its diameter, and topographic load.
For tunnels in use in [
11], one of the conclusions is as follows: The EMR signals radiating from rocks effectively reflect the rock stress state. A combination of EMR testing with traditional methods can quickly and effectively find the stress field distribution in a tunnel, which can be used to retrieve information regarding the underground structure.
Examples presented by [
12] show EMR determinations and their results that can be interpreted in terms of recent stresses and their spatial distribution. These results are useful for solving problems of applied geology, for example, stress concentrations in tunnel walls which may lead to failures.
This paper [
12] also raises the questions of EMR variations in time: Detailed measurements over time intervals of hours showed variations, which may be relatively small and perhaps related to earth tides. However, there are also more intense disturbances, which may last for seconds but may also cover periods of hours. These disturbances, sometimes called “spherics”, call for continuous observations of EMR signals. Such observations may help to show whether EMR variations are related to variations in lithospheric stress at different time scales and may reflect stress variations during and between earthquake events.
Studies of variations in EMR signals of various levels (from daily to seasonal and annual) are extremely important for the developed geodynamic monitoring systems. A clear fixation of such variations allows us to understand the mode of existence of the enclosing massif and the tunnel in it. And according to anomalous deviations from the steady-state, one can draw conclusions about anomalous changes in the SSS, leading to geodynamic phenomena. However, to make predictions, it is necessary to set criteria for such deviations that are possible only with ultra-long-term observations calculated in decades.
Examples of EMR variations registration and the connection of their deviations with large geodynamic events are described in the “Catalogue of impulse earthquake precursors” [
13], which holds the results of EMR observations in seismically active regions of the globe and the results of satellite observations when flying over earthquake regions. Also, recent publications confirm the sensitivity in registering EMR deviations with earthquakes in various parts of the globe [
14,
15,
16].
Similar data were obtained in general by us during surveys (before the construction of mountain tunnels in the Southwestern part of the North Caucasus), during the construction process, as well as at the stage of the ongoing operation of these tunnels. From 2009 to 2013, EMR registration in the worked-out area of the tunnels, as well as on the surface above them, was conducted manually (with a portable recording device). From December 2013 to the present (nine years), data on the course of EMR variations have been obtained during registration in the mode of continuous automated monitoring. During the period 2009–2021, EMR observations were made in moments of earthquakes with magnitudes M = 4.3–4.7, both in manual mode and in monitoring mode (measurements before and after an earthquake from several hours to several months).
Also, in the first approximation, the relationships between the EMR of the rocks and the stress-strain state of permanent linings of transport tunnels were obtained with long-term observations of these parameters.
The purpose of this work is to show that over nine years of observations, the stress-strain state in the tunnel lining-enclosing rock mass system changed insignificantly; stress decay is noted. No major geodynamic events were noted in the enclosing massifs during the observation period. At the same time, cyclical seasonality is noted in the EMR data, which is strongly correlated with the temperature regime in the tunnel. Based on a comprehensive interpretation of monitoring data, it is concluded that EMR is associated with the phenomenon of closing and opening of micro-defects in the enclosing massifs and tunnel lining concrete structures under the influence of temperature changes.
2. Instrumentation and EMR Imaging
Registration of EMR parameters was carried out using Angel-type equipment. A detailed description of the equipment and comparison with other equipment is given in [
17]. Registration of EMR is carried out on an open channel in the frequency band 900–230,000 Hz. The exposure time of one measurement is 5–20 s. Signal sampling frequency is 1,250,000 Hz.
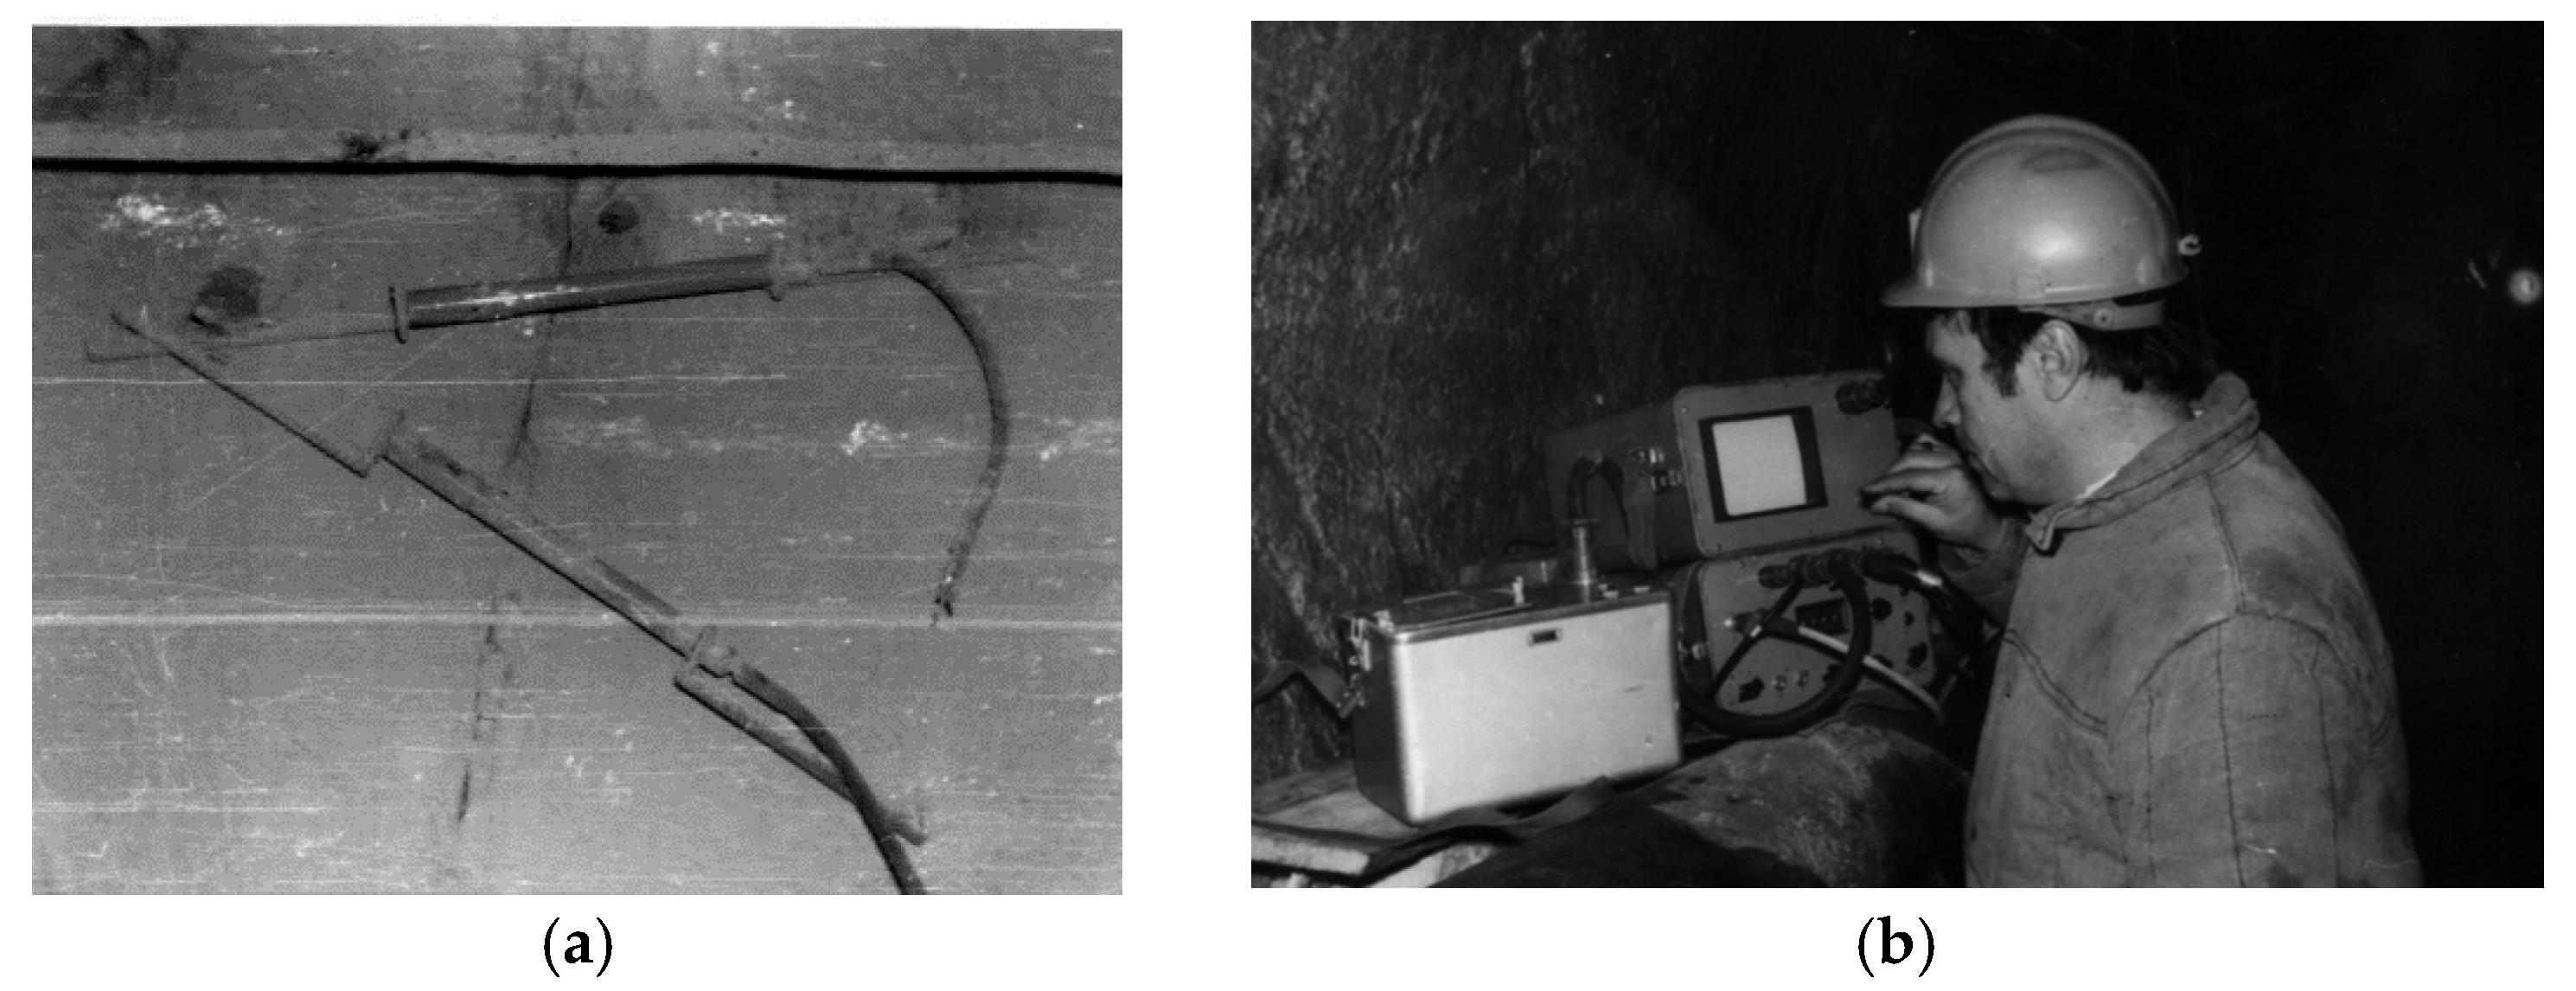
The receiving antenna is made in the form of a cylinder of a radio-transparent material; one end of the cylinder is filled with a compound, and the antenna cable is fixed on the other end by a pressure seal. Inside the cylinder is a magnetic antenna made of thermostable ferrite. The antenna consists of an electromagnetic circuit placed in a slit screen and a preamplifier. The passband is 5000–150,000 Hz and the resonance frequency is 25,000 Hz.
A general view of the equipment is shown in
Figure 1a,b.
The EMR data from the recording equipment is subjected to Fast Fourier Transform and filtering. Signals that may be associated with the destruction of rocks of the enclosing massif are visualized in the form of spectrograms. This is used to monitor and predict the condition of rock masses and concrete structures. In
Section 2.1 and
Section 2.2, some examples of processing the recorded data at different scale levels are presented.
2.1. Laboratory Tests Scale
Numerous laboratory studies have shown that the EMR is associated with the development of micro-fracturing processes and occurs during material failure. This feature of EMR anomalies is similar both at the level of laboratory tests and for large-scale studies, including explosions and earthquakes.
We also carried out our own laboratory tests, the results of which are described in more detail in [
18]. For some demonstrations, the results of electromagnetic signal visualization from the instantaneous destruction of the two different rock samples (8 cm in height and 3 cm in diameter) are presented in
Figure 2a,b and the concrete cube (10 cm × 10 cm × 10 cm) in
Figure 2c.
Equipment of uniaxial compression presses the samples until they are completely destroyed; the standard antenna (
Figure 1) is located 1 m from the destroyed sample. The signal is measured continuously, and we obtain a spectrogram by the FFT method by which signals are noted that coincide with the visually observed crack propagation and the final destruction of the samples. Such signals for samples of various materials are shown in
Figure 2a–c.
In the first case (
Figure 2a), at the moment of destruction of a brittle material (granite sample), a 30–40 dB excess of amplitude in the 1~23 kHz range is observed, as well as a reduction in the radiation frequency. In the second case (
Figure 2b), at the moment of destruction of an elastic material (mudstone sample), the electromagnetic signal amplitude is amplified by dozens of decibels as well, but this time throughout the frequency range.
In the third case, the destruction of the concrete sample is observed in several stages. One of such stages (
Figure 2c) shows cracking in a concrete sample. For a time interval of 0.05 s, about 10 pulses occur. They can be traced up to frequencies of 80–100 kHz with an excess of amplitude 10–20 dB relative to the background level.
The differences in the electromagnetic response of the destroyed materials are mostly due to the heterogeneous composition of the sample.
2.2. Field Research Scale
Similar signals were also obtained during field studies in mine workings and tunnels. In full-scale experiments, in contrast to the measurements on samples, numerous signals from deforming inhomogeneities in the rock mass merge into a common integrated background, which is differentiable when visualizing the amplitude-frequency characteristics. By increasing the amplitude level at frequencies specific to the material, the intervals are determined where intense geodynamic processes are very likely to occur. In order to distinguish the geodynamic process from industrial interference, it is critical to take into account these interferences.
Figure 3 shows an example of the result of EMR registration in the adit of the railway tunnel (length 6686 m) in a massif of a complex geological and tectonic structure composed of fractured granite gneisses and granosyenites with gneissic granite dike bodies with small areas of highly fractured and crushed rocks.
A more simplified and ‘rougher’ way of processing the results of EMR registration is averaging each signal and extracting the amplitude parameter “A”, which is the average amplitude of the pulses recorded in a given time interval (10–80 s) in the frequency band 30–50 kHz.
The amplitude parameter “A” is calculated, in the selected recording interval, as the arithmetic mean of the absolute (rectified) values of the readings or their squares. Then, taking into account the gain, it is converted into microvolts. To unify the data, each value is normalized to the arithmetic mean for each data series to obtain the normalized parameter Anorm.
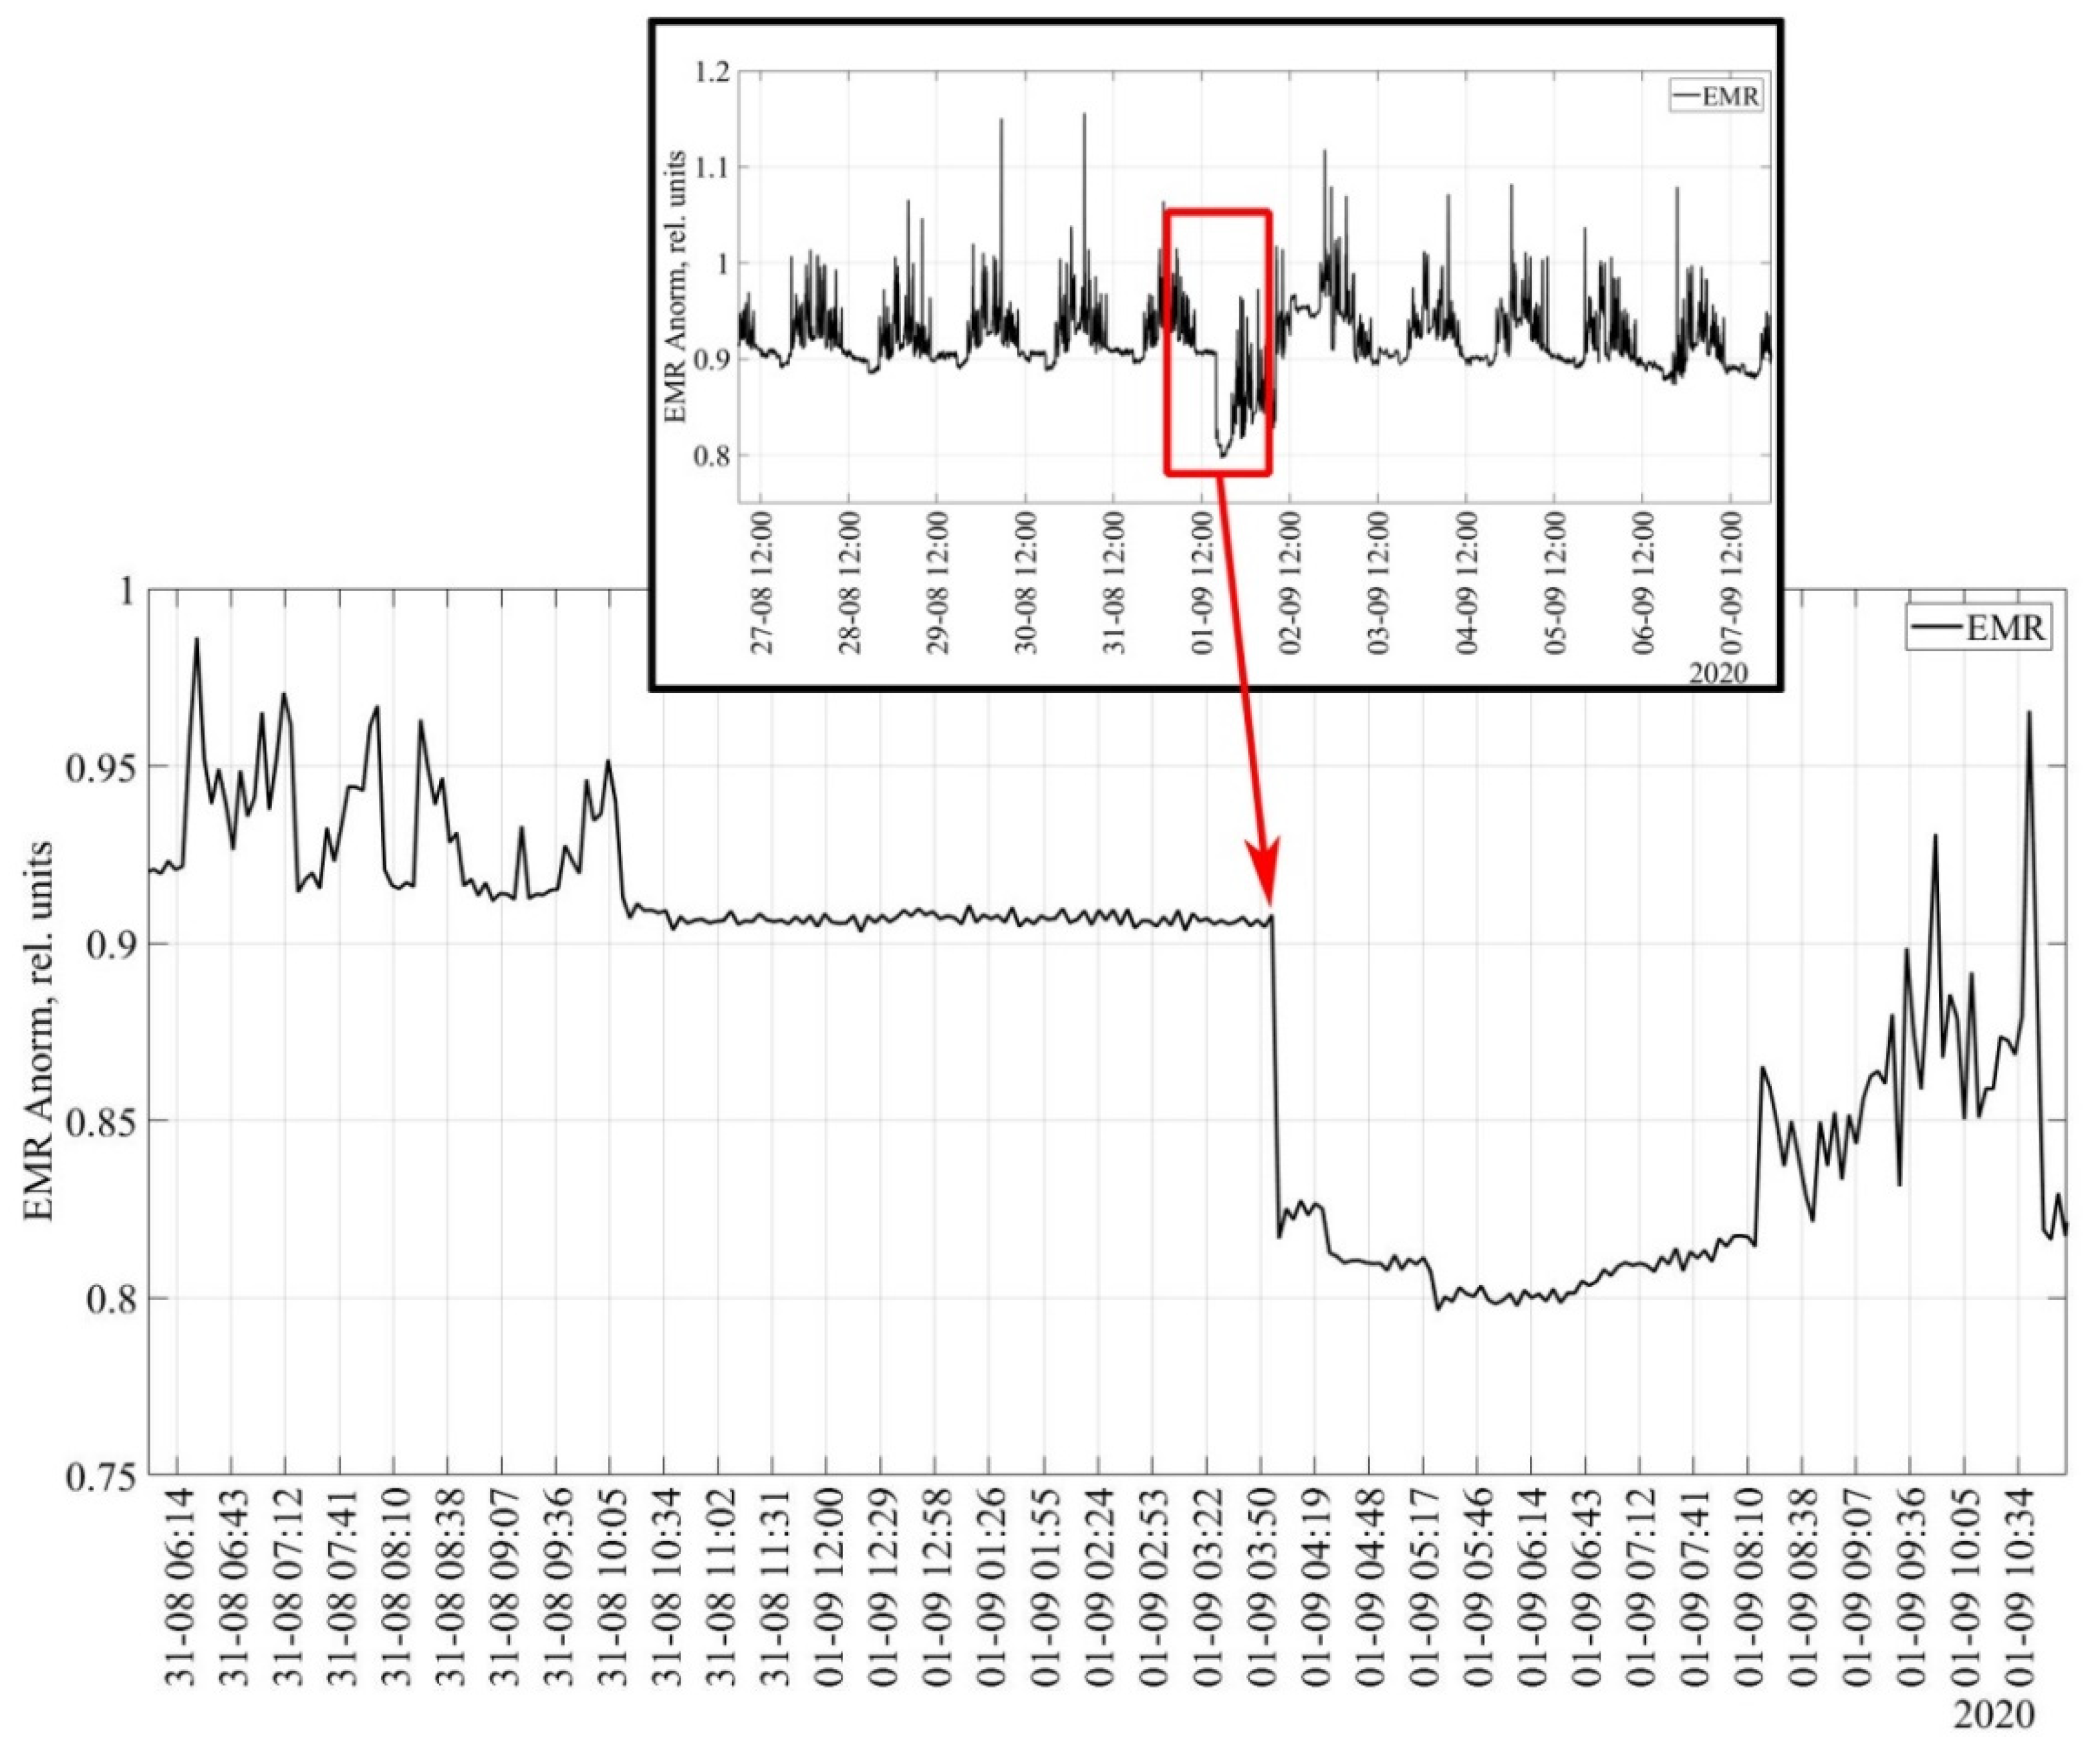
Thus, the issue of the efficiency of monitoring information transmission over telecommunication networks is solved, although with the loss of most of the information from the full spectrogram-the amount of memory occupied by the file during averaging is reduced by more than 1000 times. However, the problem of registering significant EMR anomalies with such an averaging scheme is still solved. An example is the behavior of the amplitude parameter “A” during seismic events (
Figure 4).
A similar case of “A” parameter response to an earthquake is shown in [
19], and attempts were made to search for predictive criteria for seismic events based on the data of the automated system of integrated geotechnical monitoring in transport tunnels in Sochi (North Caucasus). The case of the EMR registration during a sufficiently powerful earthquake (mb = 4.7) on 30 May 2012 was considered in detail.
The issue of stable recording of EMR during earthquakes is, of course, far from being resolved: for example, it is not clear why sometimes seismic events are reflected in the EMR field, and sometimes they are not; why some distant earthquakes can be registered, while events in the nearest zone may not be reflected in any way when registering EMR, etc. In general, the instability of fixing seismic events during EMR registration is noted by all researchers in this direction [
20], and there are many more questions than answers.
2.3. Automated System of Integrated Geotechnical Monitoring Using EMR Technology
While preparing the region’s infrastructure for the 2014 Winter Olympics in Sochi, a combined (road and rail) road Adler-Alpika Service mountain climatic resort with a total length of 48 km was built and put into operation. Construction was carried out from 2008 to 2013. During this time, 14 tunnels were built (six railway, three road and five auxiliary) with a total length of about 27 km, of which 10.3 km are railway, 6.7 km are highways, and about 10 km are auxiliary evacuation and service adits.
By the end of 2013, all control and measuring equipment was installed and put into operation, synchronization of all sensors installed in the structure was performed and registration of measured parameters was established in automatic mode. The processed information is displayed on the dispatch control panel (
Figure 5 in the form of a color scheme tied to the categories of geodynamic hazard; for each of the categories, a regulation on the actions of the tunnel service has been developed.
The purpose of developing an automated geotechnical monitoring system is to ensure the safe operation of tunnels based on data from continuous monitoring of the state of the tunnel lining-enclosing rock mass system and predicting the technical condition of tunnel structures. Integrated geotechnical monitoring ensures the safe operation of the tunnels, operational control over negative (man-made and natural) effects on the structures and the determination of qualitative and quantitative indicators of their impact on structures, as well as an online assessment of the geodynamic activity of the “tunnel lining-enclosing rock mass” system to predict changes in the stressed state of rocks near underground workings throughout their length.
2.3.1. Stress Strain State (SSS) Control Subsystem
Geomechanical studies of the SSS of a rock mass, supports and linings are the basis of geotechnical monitoring during the construction and subsequent operation of transport tunnels. Their results are necessary for assessing the risks and predicting damage and destruction of lining structures from high loads during SSS changes, including those after earthquakes. To control changes in the stress strain state of the tunnel structures, strain sensors are used that operate on the principle of standard string gauges (tensometers). All of them were installed in the concrete lining at the construction stage and were included in the work immediately after the erection of supports and linings. Currently, all “Olympic” tunnels are equipped with automated systems for recording changes in the stress strain state of the tunnel linings.
2.3.2. Electromagnetic Radiation (EMR) Control Subsystem
An automated system for recording natural EMR, as a component of a general monitoring system, was created for the operational control of changes in the stress-strain state of rocks near the underground workings. This is an experimental system that has not been used in tunnels before.
The site for registration of natural electromagnetic radiation consists of a registration unit and a unit of sensors-registers of impulses (‘Angel’ type equipment), which include a magnetic antenna and a signal selection and amplification circuit. EMR sensors use ferrite rods made of thermo stable ferrite as receiving magnetic antennas.
The sensor block is installed with the axis perpendicular to the wall in a horizontal hole drilled in the tunnel lining. After installing the sensor unit in the well, the interval between its body and the well wall is filled with a compound with a non-conductive composition of the components. In the registration unit, primary data processing is carried out using a low-pass filter, high-pass filter and subsequent saving of the results of input indicators in non-volatile memory up to 6144 values. The telemetry part is implemented through the RS485 interface and its further conversion to Ethernet. The ‘TunnelMonitor’ app on the server polls the registration blocks by sending a packet of commands in the hexadecimal system to ip addresses, after which, in turn, it receives a response in the form of a data packet, and the same app performs secondary processing and saves the received information to the database and also compares it with calculated threshold values.
3. Relationship between EMR, SSS Parameters and Tunnel Temperature
All the works noted above at different scale levels show a clear irrefutable relationship between the phenomena of SSS changes (geodynamics of a rock mass) and EMR radiation.
Natural electromagnetic radiation (EMR) impulses are emitted from rocks under stress; as a rule, the stronger the geodynamics, the more intense the radiation. The temperature in the tunnel also plays an important role in this process.
The paper [
21] presents the results of comprehensive observations of the tunnel lining of the Severo-Muysky tunnel during the construction of the section. In a few areas with a noticeable manifestation of deformations, measuring stations for concrete deformations of the tunnel lining and rock massif were equipped in 1981–1986 (
Figure 6).
The depth of the sections of the tunnel ranged from a few hundred meters to a kilometer. The longest observations (for five years) were carried out on the section of the tunnel from the side of the eastern portal at a two-kilometer interval. In this section, in the concrete of the lining, almost immediately after the formwork was removed, cracks of various directions were intensively manifested. To control the development of cracks, benchmarks were installed on their sides, and distances were measured using a comparator with an accuracy of 0.01 mm. At the same time, the air temperature was measured and profile measurements of the EMR were carried out using the device designed by the Tomsk Polytechnic Institute. The equipment recorded the intensity of counting radiation pulses in three mutually perpendicular directions relative to the axis of the tunnel by orienting the magnetic rod antenna. In addition, materials on the registration of local earthquakes by a local network of seismic stations were used for a comprehensive data analysis. As a result of the complex processing and analysis of measurement data, the time series of the data were obtained. The seasonality factor was noticeably manifested. In addition, in the temporal changes in deformations over time, there was clearly an accumulation of residual deformations in the concrete lining of the tunnel.
Changes in the air temperature in the tunnel were also carried out. The antiphase of changes in deformations and temperature in time and the seasonality of their fluctuations were noted. With an increase in temperature and heating of the lining and the enclosing rock mass, tensile deformations occur; existing cracks open, grow with forming new ones, since rock materials, and especially concrete, have much less resistance to tensile forces than to compressive ones. The cooling of the lining and the rock mass is accompanied by crack compression.
Based on the results of theoretical, laboratory, and field studies, it has been established that the EMR reflects the real process of changes in the stress-strain state in structural materials and rocks, especially during crack formation, including germination, braking, and the closing of existing cracks.
In [
22], attempts were made to establish a quantitative relationship between the EMR and SSS parameters during the development of very weak stresses that arise in the reinforced concrete lining of railway tunnels during construction, and the use of the EMR recording method to detect and control changes in the stress-strain state of the lining and the enclosing mass during stresses 5–20% of destructive.
A close correlation was obtained (the values of the correlation coefficients are 0.6–0.9) between the EMR intensity and the stress-strain state of the massif corresponding to the time intervals in which the highest rates of change in the stress-strain state were recorded [
22]. Such values were obtained for short-time series (measurements of EMR and SSS parameters for six sections in the tunnel under construction were carried out in manual mode once a day during 2012–2013).
This paper presents the results of the EMR registration obtained by the automated geotechnical monitoring system. Readings on a system of 76 EMR sensors in six railway tunnels and three road tunnels were automatically performed every one to four minutes from December 2013 to the present (nine years), and there were about 1000 SSS sensors in the reinforced concrete lining of the nine tunnels.
With such extensive material at our disposal, it is possible to study in more detail the relationships between EMR parameters and SSS changes, the stability of these relationships, and take into account the influence of impulse and constant industrial noise, daily, seasonal and annual variations. Thus, the purpose of this work is to consider, as a first approximation, the results of these long-term observations and evaluate the hypothesis about the correspondence of EMR to changes in the stress-strain state of the “tunnel lining-enclosing rock mass” system in various mining and geological conditions. The implementation of such an analysis became possible only after the creation and long-term operation of an automated system for integrated geotechnical monitoring.
4. Experimental Plots in Tunnels and Main Results of Observations
As a result of the installation, commissioning and research work, a system of synchronous observations of natural electromagnetic radiation was organized at a distributed network of stations (the network length is about 48 km), the continuous recording of which has been conducted from December 2013 to the present. All received information is subjected to preliminary processing, taking into account which types of variations of natural electromagnetic radiation are selected. An informative indicator of electromagnetic radiation of rocks is the averaged value of the amplitudes that exceed the significance levels, which are much higher than the noise level in the tunnel section of interest. The next stage of processing is the selection of informative areas of the field registration in real-time, the determination of the spatial location of the source of electromagnetic disturbances, and the determination of the spatiotemporal shift of propagation characteristics (taking into account a fixed frequency).
This paper presents the results of observations for two of the most demonstrative sections of the “Olympic” tunnels and only for the system of railway tunnels, where regular electromagnetic interference (passages of electric trains) is relatively easy to take into account in the analysis and interpretation of data. In order to smooth the data and improve the accuracy of the data without distorting the trend signal, the graphs below apply a digital Savitzky-Golay filter to the EMR data.
As a demonstration, the following railway tunnels and their individual intervals with sections of EMR and SSS sensors are selected.
First experimental plot
Railway double-track tunnel No. 6 of a horseshoe shape with a total length = 433 m.
The layout of the sensors in the permanent lining of railway tunnel No. 6 is shown in
Figure 7.
Point +223 m from the southern portal is equipped with SSS sensors; Point +243 m from the southern portal is equipped with EMR sensors.
Section depth is ~38 m.
The site is completely located in deluvial deposits, represented by carbonaceous silty schist of dark gray, black color, thin-medium platy, and is oily to the touch. It ranges from highly fractured to split, mostly crumpled, in some places frayed and schistose with quartz-carbonate veinlets, sometimes reaching a thickness of up to 10 cm. Water inflow is moderate. From weakly stable to completely unstable. Protodyakonov’s coefficient 0.8–1.5–70%, 1.5–2.5–30%.
Second experimental plot
Railway single-track tunnel No. 5 of a round shape, total length = 2910.2 m.
The layout of the sensors in the permanent lining of the railway tunnel No. 5 is shown in
Figure 8.
Point +730 m from the southern portal is equipped with SSS sensors.
Section depth with sensors ≈ 70 m.
Geological structure: silty-pelitic tuffs, massively layered, brown, fissured. Medium strength medium stability. Protodiakonov coefficient 2–4.
Five meters to the south is the boundary of a small (10 m) tectonic zone. It contains tuffs, tuff breccias of the porphyrite suite, which are greenish-gray or brown. The rocks are crushed, ground down to grus, clays are light gray and brown with inclusions of grus and crushed stone. Protodyakonov’s coefficient ranges from 0.8–1 to 1.5. Breeds are low-moisture.
Point +845 m from the southern portal is equipped with an EMR sensor.
Section depth with sensor ≈ 108 m.
Geological structure: augite porphyrites of medium strength, strong and stable. Fractured. The cracks are filled with hematite and carbonate. Protodyakonov’s coefficient 3–5. The rocks are naturally wet.
Point +1083 is equipped with SSS sensors.
Section depth ≈ 100 m.
The section is located in a zone of tectonic disturbance, represented by gray-green mental stone porphyrites with reddish-cherry hematite deposits on the planes of cracks, olivine inclusions up to 0.5 cm. Protodyakonov’s coefficient is from 1–2 to 3–4. The rocks are naturally wet.
5. Stress-Strain State and EMR Long-Term Registration Results
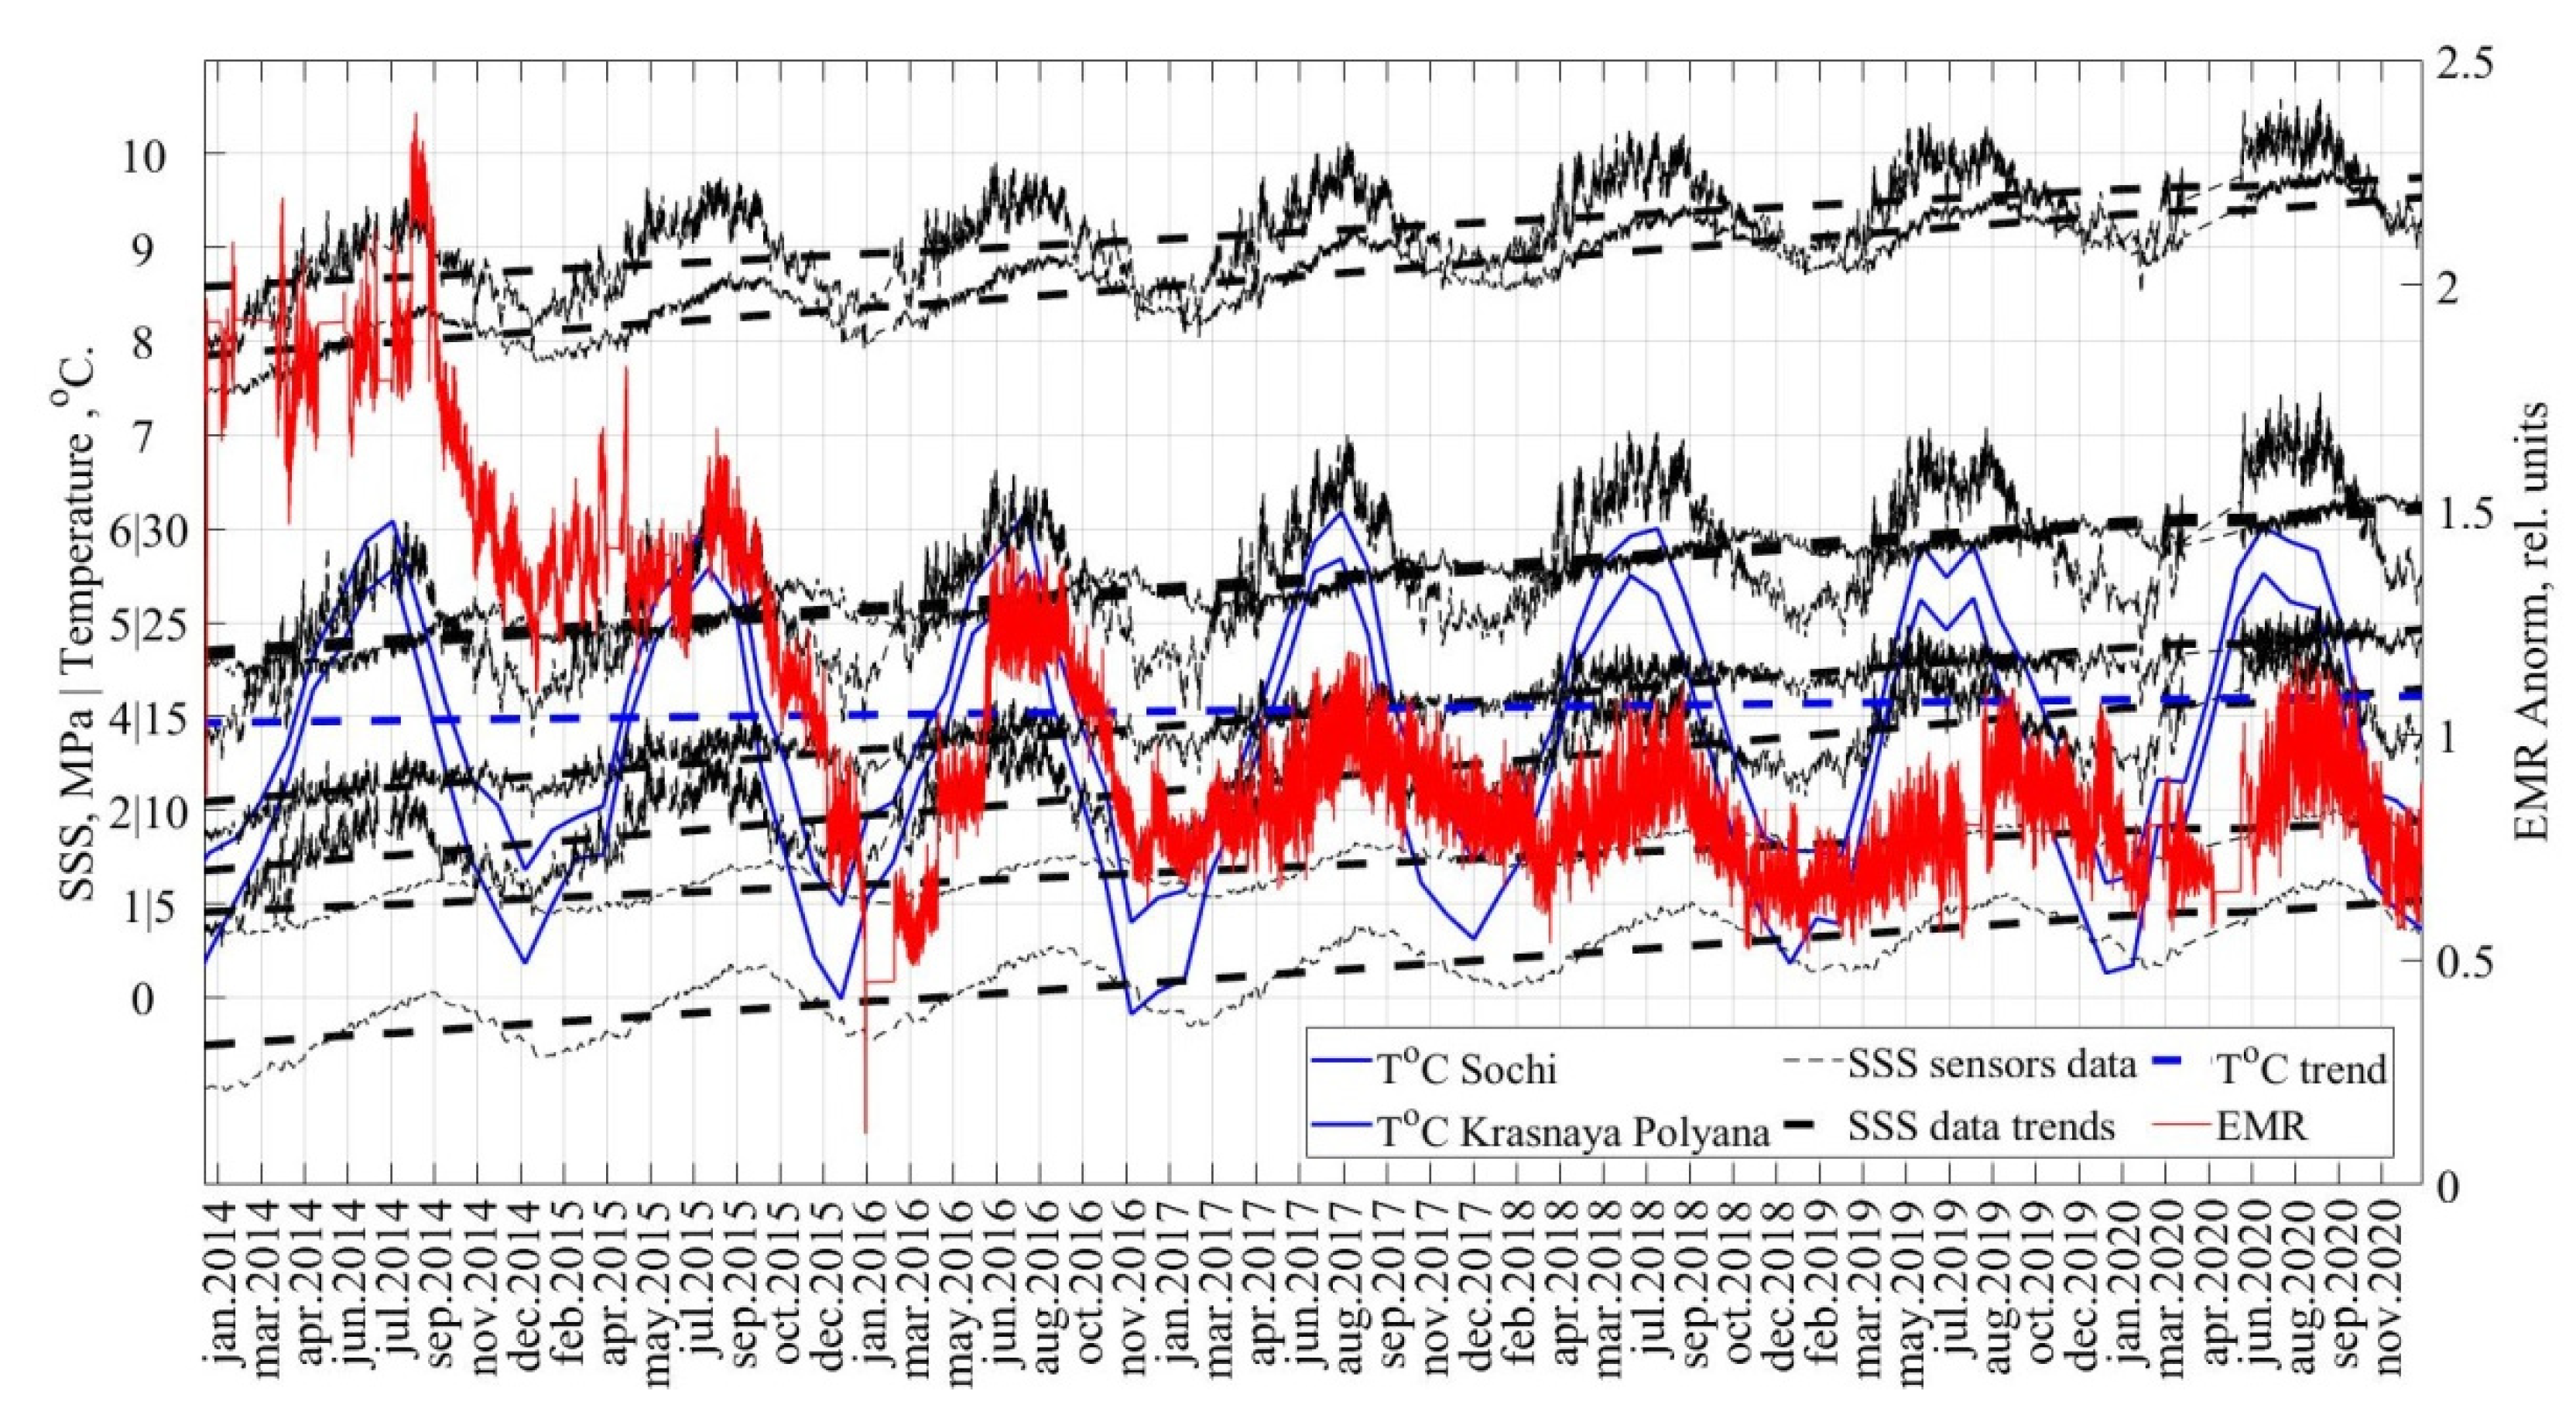
Figure 9 shows the results of joint processing of EMR and SSS data of the “tunnel lining-enclosing rock mass” system for the first section in railway tunnel No. 6. The time interval of measurements is shown from December 2013 to February 2021.
Air temperature graphs are also given for two meteorological stations: one (at the beginning of the tunnel route) in Sochi (Krasnodar Territory, Russia): latitude 43.58, longitude 39.77, altitude 132 m; two (at the end of the tunnel route) in Krasnaya Polyana (Krasnodar Territory, Russia): latitude 43.68, longitude 40.20, altitude 567 m.
Trend lines are drawn for the SSS and air temperature graphs.
Temperature fluctuations in the values of SSS sensors are within 1–2 MPa with a clearly defined seasonality. There is an unconditional direct dependence of the SSS data on the air temperature (and, accordingly, the temperature of the tunnel lining). This is explained by the processes of seasonal compression and stretching of strings in measuring string strain gauges. According to the trend lines for SSS sensors, it can be concluded that the stresses in the lining gradually increase with subsequent stabilization.
Analyzing the EMR graphs, it can be noticed that seasonal EMR fluctuations are identical throughout the entire observation period but differ in intensity at the beginning of the measurements.
At the beginning of the operation, the tunnel and the enclosing massif seek the equilibrium. There are more accumulated charges on the sides of micro-cracks, micro-defects, micro-heterogeneities, fractures, and, for the first time, they are actively compensated. The high intensity of EMR at the beginning of the operation of the tunnel is also affected by the fact that the lining is made of monolithic reinforced concrete. At the beginning of the operation, stresses in the monolithic reinforced concrete lining of the tunnel develop more intensively.
Furthermore, from December 2017 to the present, a stabilized course of EMR is observed with minima and maxima sustained in intensity and frequency.
At the beginning of the measurements, the EMR minima are quite sharp; since 2017, the minima have been extended for several months.
EMR minima were observed:
- -
in January 2014, January 2015, January 2016;
- -
from December 2016 to January 2017 to June 2017;
- -
from January 2018 to May 2018;
- -
from November 2018 to June 2019;
- -
from January 2020 to June 2020.
The EMR minima at the beginning of the measurements quite clearly coincide with the temperature minima; after three years of operation, the EMR minima stretch from the temperature minimum to the beginning of summer.
EMR charts show local and major highs. EMR maxima are observed:
- -
in March–April 2014;local;
- -
in August 2014; major;
- -
in February–April 2015; local;
- -
in August 2015; the major one;
- -
in May–June 2016; local;
- -
in July–August 2016; the major one;
- -
in January 2017; local;
- -
August 2017, August 2018, August 2019, August 2020; major.
Local EMR maxima are associated with a sharp temperature drop, while the main EMR maxima are associated with maximum temperatures.
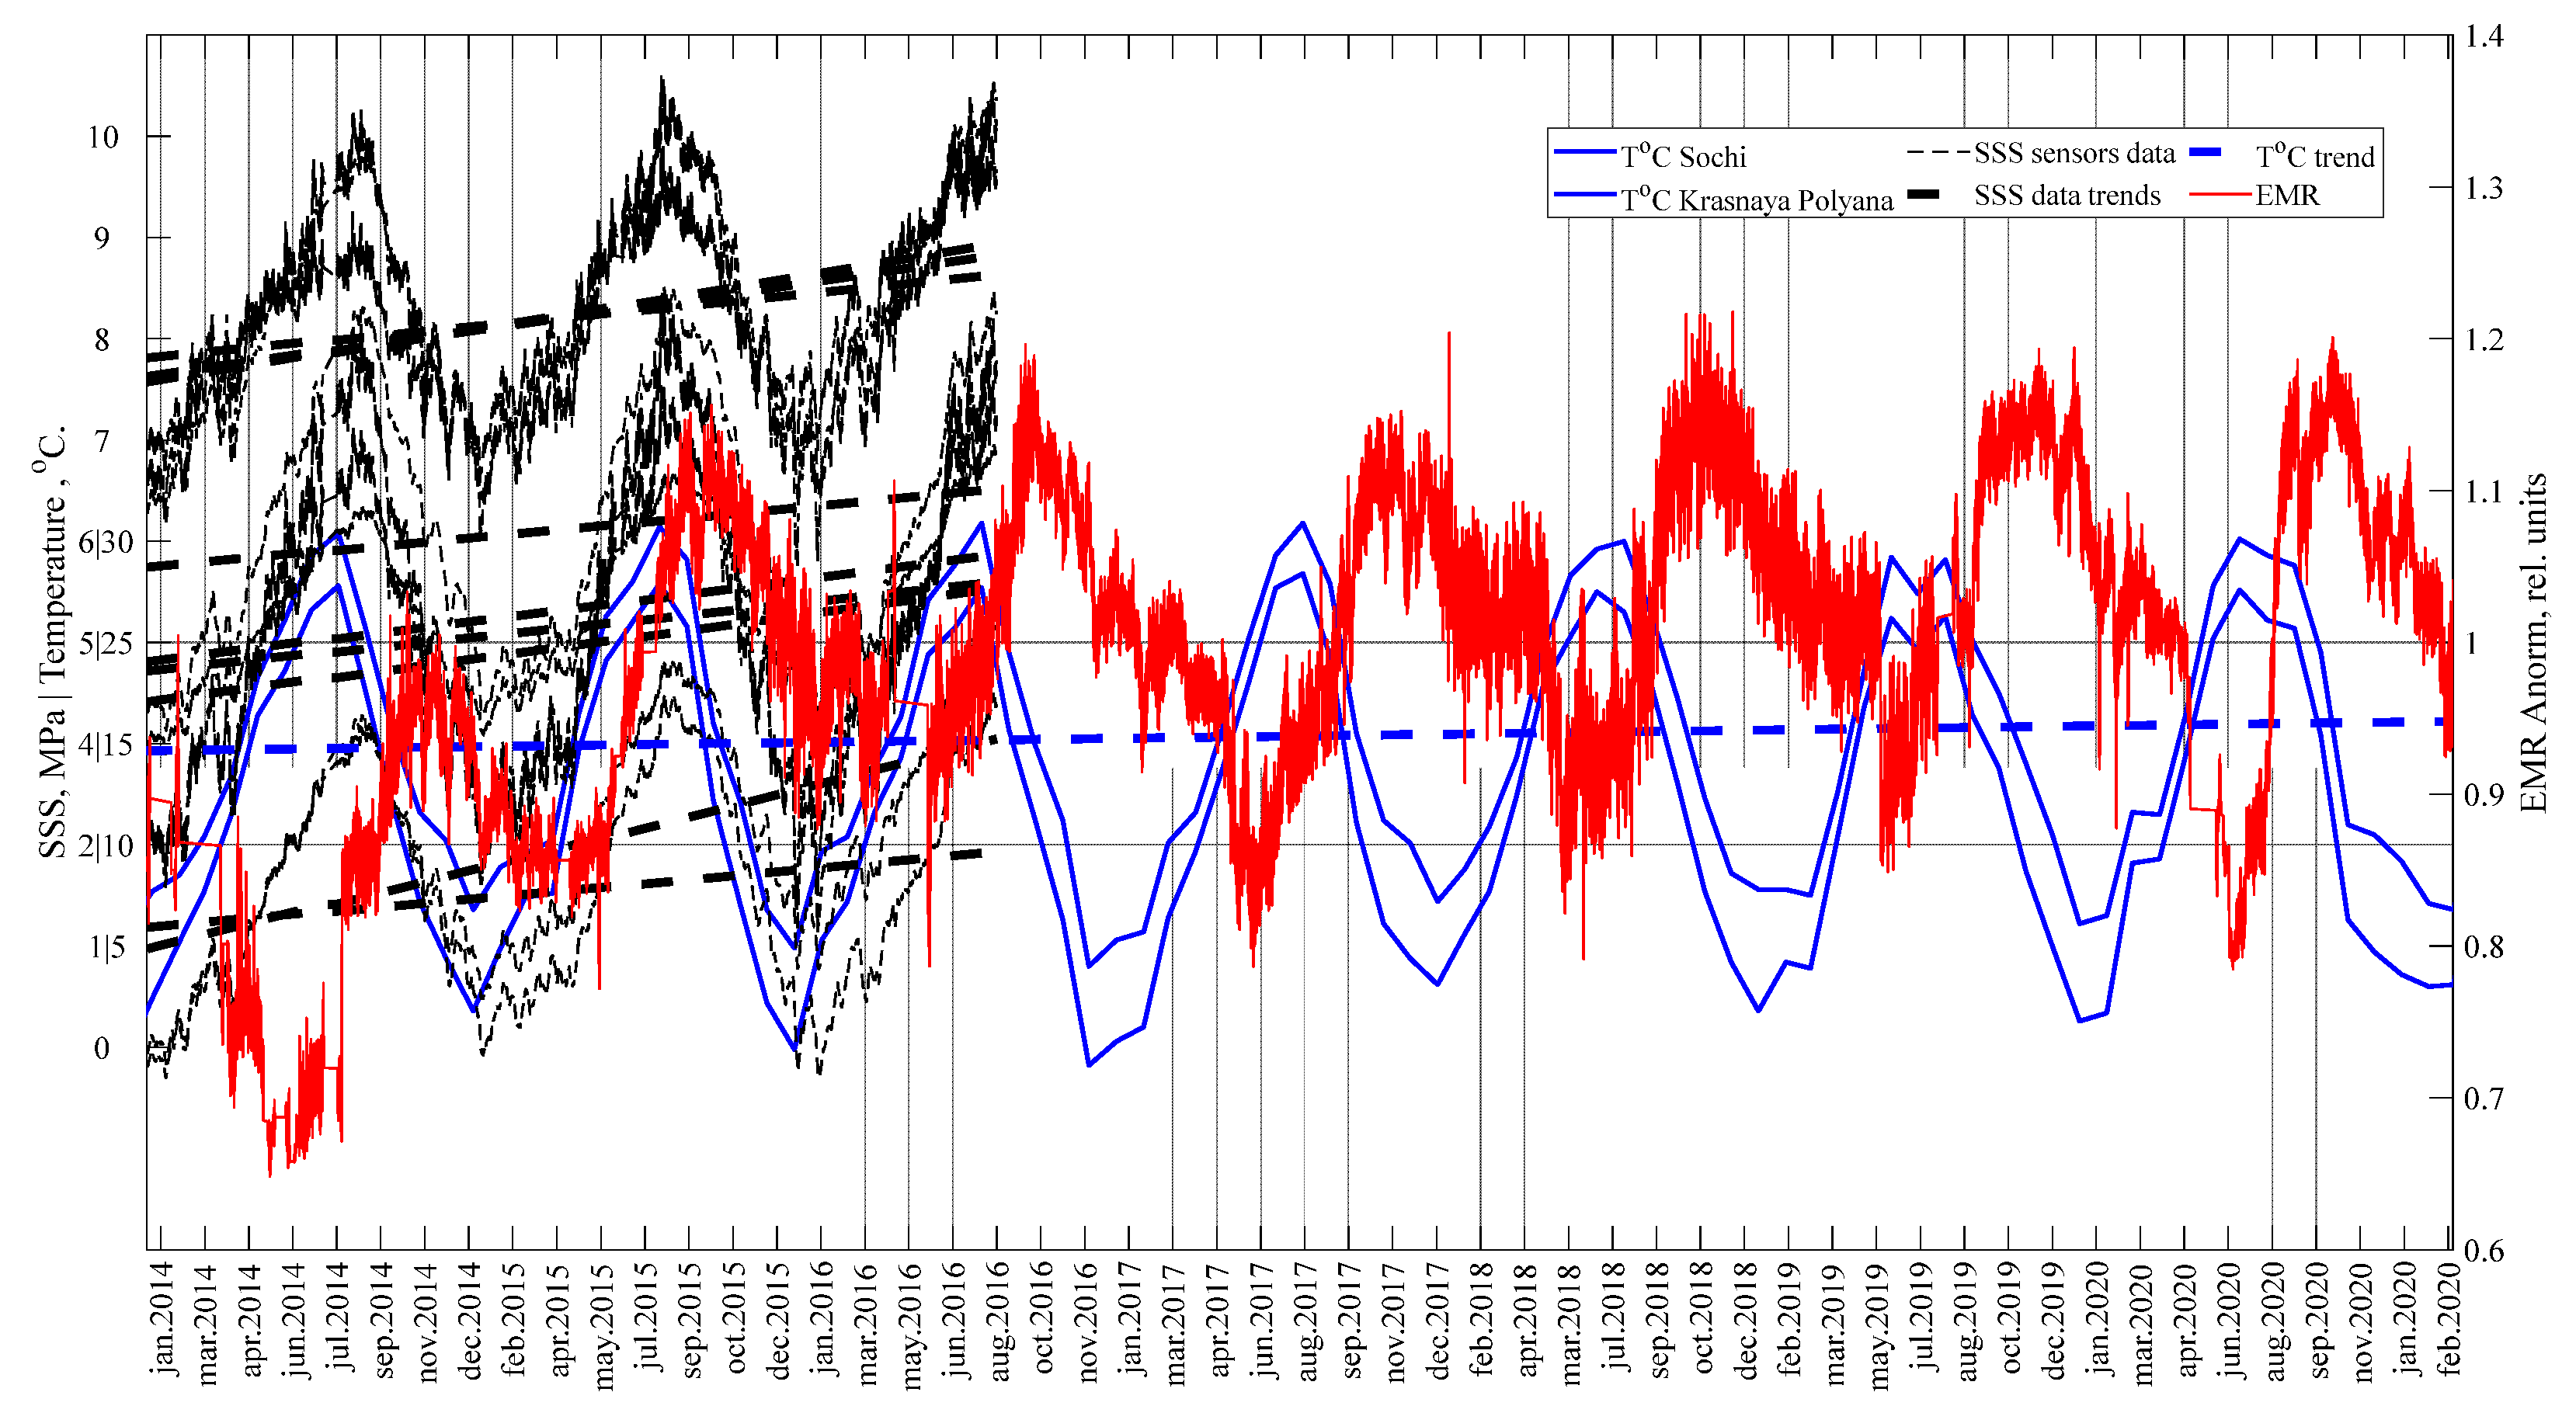
Figure 10 shows the results of the joint recording of EMR and SSS data of the tunnel lining-enclosing rock mass system for the second section in railway tunnel No. 5. The time interval of measurements is shown from December 2013 to February 2021 (for EMR) and from December 2013 to March 2016 (for SSS), until the SSS sensors fail in this section. In addition, this shows that observations of the stressed state of the tunnel lining are possible to assess only by the EMR data, when at the beginning these readings are calibrated against the SSS sensors. Air temperature graphs are the same as in the previous case. Trend lines are drawn for the SSS and air temperature graphs.
Fluctuations in the values of SSS sensors are in the range of 3–4 MPa with a clearly defined seasonality. There is an unconditional direct dependence of the SSS data on the air temperature (and, accordingly, the temperature of the tunnel lining). As in the first case, excluding temperature fluctuations along the trend lines for SSS sensors, we can conclude that the stresses in the lining gradually increase with subsequent stabilization. Here, as well as for the first section under consideration, at the beginning of the measurements, the behavior of the EMR, which is uncharacteristic for the rest of the observation period, is observed. Here, the EMR level, in contrast to the first section, is lowered. Stabilization and exit to the usual course of EMR lows and highs are observed here after a year of registration. It shows that at the beginning of the operation of the tunnel, the precast concrete lining is subjected to less impact than the monolithic reinforced concrete lining.
Since the beginning of the measurements in December 2013, a decrease in the EMR intensity to the minimum values in May–June 2014 has been recorded, that is, the minimum EMR is reached one to two months earlier than the maximum temperature values are reached. It is probable that the closure of existing micro-defects in the nearest rock mass adjacent to the tunnel has ended here and that a further increase in air temperature no longer leads to high EMR values.
After the start of the decrease in temperature, the increase in EMR continues.
A local increase in EMR is recorded at the moment of reaching the maximum temperature values, but the absolute annual maximum of EMR (in October-November 2014) is still observed only three to four months after reaching the temperature maxima, while the values of the SSS sensors begin to decrease almost synchronously with the decrease in temperature.
With the beginning of the ‘cooling’, tensile deformations and separation of microdefects in the tunnel lining-enclosing rock mass system lead to an increase in EMR. After prolonged compression, separation of existing micro-defects in rocks begins again.
From the minimum values in January 2015, the air temperature begins to rise, which is noted at the beginning of this process by local elevated EMR values, and already after 15–20 days to decrease to a minimum, which remains for EMR for the next four months.
A local increase in EMR may indicate that during the change in the sign of deformation (from tension to compression), micro-defects and fractures close again. And the subsequent stabilization and a local minimum of EMR within four months indicate that the micro-defects are again completely closed and that the existing charges on their sides were compensated.
The next increase in EMR begins in May 2015 from the minimum values to the maximum in September–December 2015; just as in the previous year, the maximum EMR is reached about a month after reaching the maximum temperature values observed in August 2015.
Furthermore, for one more year, the joint behavior of the parameters of the air temperature, SSS, and EMR is similar until the failure of SSS sensors in this section at maximum values in August 2016.
Subsequent fluctuations in EMR testify to the further preservation of the identified cyclicity.
EMR minima were observed:
- -
at the beginning of measurements “stretched” in April–July 2014, March–June 2015, December–May 2016;
- -
furthermore “pointy” steadily in May–June 2017, 2018, 2019, 2020.
- -
EMR maxima were observed:
- -
October–November 2014;
- -
September–December 2015;
- -
September–November 2016;
- -
November–December 2017;
- -
October–December 2018;
- -
October–December 2019 and January 2020;
- -
September–November 2020.
The difference in the course of EMR processes depending on the temperature in the first and second cases can be due to a number of factors.
1. The difference between the building structures of the tunnels in cases 1 and 2 (
Figure 7 and
Figure 8). In the first case, the lining is reinforced concrete monolithic; it is made on site, the reinforcement cage is installed, then the formwork is installed and the subsequent pouring with concrete takes place (there are more possible micro-defects in the structure). In the second case, the lining is prefabricated, and it consists of separate reinforced concrete blocks, which are manufactured at the factory in special vibroforms (there are fewer microdefects in the structure). Perhaps, in the first case, the opening-closing reaction of microdefects is more pronounced when the temperature changes with a minimum delay.
2. The difference in the geological structure of the enclosing massif in the first and second cases. It is likely that the reaction in which the EMR of various types of rocks occurs to temperature changes is different.
6. Discussion
Taking into account the peculiarities of the location of stationary EMR sensors in the tunnel lining-enclosing rock mass system, it can be assumed that the change in temperature regime, against which the micro-defects and micro-fractures existing in the rocks periodically close and open, is of decisive importance in the formation of seasonal variations.
It is known from the fundamentals of rock mechanics [
23] that the stress state of rocks around mine workings is determined by several factors. The first group of factors consists of the spatial and geometrical parameters of the workings under consideration. The second group includes the deformation characteristics of rocks in the immediate vicinity of the working contour since it is this massif that perceives additional loads during the formation of workings. The third group of factors covers the features of the natural stress field in the intact massif, i.e., before excavation.
Finally, the fourth group of factors is made up of the characteristics of the impact on the rocks around the working in the process of its excavation and further exploitation. The most important among the factors of this group are dynamic loads, as well as changes in the properties of rocks under the influence of the movement of water and air and changes in the temperature regime.
According to long-term observations in the tunnels under consideration, it is possible to exclude the influence of any anomalous changes in the stress state of rocks around the tunnels on EMR data. Stress-strain state monitoring data show a smooth trend with subsequent stabilization based on the results of long-term observations without any geodynamic processes in the nearest rock massifs.
The tunnel lining material-concrete-laboratory experiments [
24] also show changes in the EMR characteristics after exposure to elevated temperatures. Those experiments on EMR from concrete specimens show for specimens after being heated to different temperatures that the EMR waveforms are similar in shape but differ in intensity.
The influence of temperature effects on the stress-strain state of tunnel linings is presented in [
25], here a mechanism for changing crack opening is given, which clearly correlates with a change in air temperature in the tunnel; with a decrease in temperature, cracks open, and with an increase in temperature, they close.
Based on the results of long-term observations, it is proposed that a mechanism of EMR while compression and extension of micro-defects in the lining and rock mass around the tunnel. Schematically, such a mechanism can be represented as a diagram shown in
Figure 11.
The observed relationship between EMR and temperature is not direct, but indirect through a change in the characteristics of the rocks adjacent to the tunnel lining, namely, through the processes of their compression and tension, leading to the closure and opening of micro-defects and micro-fractures existing in rock massifs and in the linings itself.
The reasons for which EMR may occur during the separation of micro-defects may be different, and here we can speak only of hypotheses. For example, the triboelectric effect may appear here.
Also, on the contacts of microdefects, an electric charge can accumulate due to the capillary effect and the movement of groundwater along these micro-defects and micro-heterogeneities that also occurs with its seasonality.
Other Possible Causes of EMR Cycling
In general, the seasonality and cyclicity of EMR in long-term observations are associated with various factors. Thus, in [
26] it is shown that a significant proportion of registered electromagnetic pulses originate in the earth’s crust and are excited by poorly studied, highly stable daily and annual rhythms of crustal movement. According to the authors, it is these types of motion that activate mechanoelectrical transformations in rocks, determine the appearance of EMR in the range of very low frequencies, daily and annual field variations. The arguments in favor of the lithospheric origin of many recorded pulses are the multifaceted relationships of electromagnetic fields with the processes of earthquake preparation, their energy, and distance, the high correlation of diurnal field variations, and the seismic activity of the region.
In [
27] a spectral analysis of the long-term time series of the natural impulsive electromagnetic field of the Earth and seismicity using the example of the Baikal region was undertaken. The results of the analysis are compared with well-known spectral characteristics of the tidal waves of the Moon and the Sun. A conclusion is made about the probable absence of a direct connection between the detected rhythms and the gravitational influence. Similar conclusions are given in [
28].
Currently, studies of variations in natural electromagnetic radiation EMR in the North Caucasus are carried out in a continuous mode using a regional network of 10 stations. In [
29] it is demonstrated that a clearly pronounced seasonal cyclicity of EMR intensity changes at three observation points-Estosadok, Elbrussky and Dargavs (that is, the closest to the route of the Olympic tunnels). This pattern is also observed in the data from other registrars of the regional network. The increase in the average daily value of the number of impulses in the North Caucasus region begins in October/November and continues until May, reaching a maximum in December/January, while the seasonal minimum falls on August/September. Intermediate local maxima are also noticeable in March/April.
In [
29], based on the analysis of the spectral characteristics of diurnal and seasonal EMR variations in the North Caucasus region, a relationship with gravitational tidal effects was established. It is assumed that the source of background diurnal variations in EMR can be mechanoelectric transformations in mobile blocks of the earth’s crust under the influence of cyclic tidal forces, and the change in amplitude up to the disappearance of the diurnal variation can be caused by a decrease in the mobility of blocks due to their consolidation, anomalous and seasonal amplitudes of variations, apparently, are modulated by endogenous processes.
It is not possible at this stage to confirm or disprove such a view according to our data when registering in the tunnels. A feature of the EMR field recorded in underground workings using the Angel equipment is that in most cases the registration is carried out under conditions of natural and man-made interference and in the so-called nearest zone of the radiation source, which extends from the source to a distance of up to three wavelengths. A direct analogy here is acoustic emission (AE) technology, a method that has long been used for geophysical monitoring of underground structures [
30], as well as sound metering in the form of seismic tomography when monitoring underground structures with a signal generated by a tunnel boring machine [
31].
In our opinion, in the nearest zone, the EMR sources are deforming micro-defects in the reinforced concrete lining of the tunnel and in the rocks of the nearest enclosing massif. According to our data, there are no other reasons for the cyclicity of the EMR data during measurements in tunnels.
At the same time, the facts of registration of large anomalies of the EMR field under the influence of large earthquakes in the region make it possible to assume that global mechanoelectromagnetic processes also make some contribution to the overall course of the EMR of rock masses.
7. Conclusions
The results of long-term registration of the EMR by the automated geotechnical monitoring system reflect cyclical changes in the properties of the rock mass adjacent to the tunnels in close relationship with the temperature regime. Moreover, in two different areas and conditions, it is shown that this relationship is not direct and not constant; it may depend on the structural composition of the host rocks, materials, and structures of the lining of railway tunnels, various mechanisms of closing and opening of micro-defects for a particular host massif, etc.
A scheme of the EMR cyclicity in the tunnel lining-enclosing rock mass system is proposed. In a stable compressed state, minima of EMR pulses are fixed, and when the rock massif and the lining material are stretched, electrical charges are separated on the edges of micro-defects, and EMR increases; complete separation of the edges of micro-defects leads to the termination of intense EMR. This process proceeds in the opposite direction during the compression of micro-defects and micro-fractures in the rock mass and lining. The periods of compression and expansion are closely related to temperature fluctuations; in connection with this, the seasonality of EMR appears.
For more confident conclusions, it is necessary to continue the analysis of data on the automated system of the geotechnical monitoring of tunnels. At the moment, we are analyzing all of the other experimental sections (sensors in the amount of 76 EMRs and about 1000 SSSs) and making a mutual link between them in order to come to some kind of unified hypothesis.
It is necessary to study in more detail the issues of the emergence and development of cyclicity and seasonality in EMR data, including in connection with ground-based measurements using the regional network.
Carry out detailed processing of monitoring data using mathematical statistics methods. Identify quantitative relationships between EMR, SSS parameters, and temperature. And also follow the EMR response to earthquakes in different areas of underground structures.
The question of the impact and accounting for man-made interference also remains open. A useful signal can often not be distinguished from a random impulse (not regular interference). However, this article just makes it possible to see on a large data series that, despite a large amount of man-made interference in the existing transport (railway) electrified tunnels, it is possible to register the EMR of the tunnel lining-enclosing rock mass system.
An important aspect is the confirmation of the possibility of controlling the current dynamics of the rocks and the tunnel structures. Identifying a stable cyclicity corresponds to the normal functioning of the tunnel lining-enclosing rock mass systems. It is particularly important to take into account the predictive nature of EMR, warning of precursors of heavy geodynamic events before they occur.
It should also be noted that the presented results are based on averaged data. Spectrograms of the EMR signals provide more complete information for each measurement, clearly reflecting the structure of the radiation and, consequently, the dynamics of the geomechanical process in the rock mass. We now use spectrogram data when studying the processes of sample deformation of various materials and during single measurements in tunnels, but not in the mode of full-fledged continuous monitoring. This work is ongoing, and the EMR that occurs in the subsequent stages of the life of the experimental underground structures will be assessed in the future.


