Article

Degradation of Passive Thermal Performance in Colonial School Buildings Under Climate Change: Implications for Cognitive Function


by
Wiwik Budiawan
*,
Heru Prastawa
,
Massadhib Abiyyu Hermanto
and
Nada Syarifah Rahadi
Department of Industrial Engineering, Faculty of Engineering, Universitas Diponegoro, Semarang 50275, Indonesia
*
Author to whom correspondence should be addressed.
Architecture 2026, 6(3), 119; https://doi.org/10.3390/architecture6030119
Submission received: 20 May 2026 / Revised: 9 July 2026 / Accepted: 16 July 2026 / Published: 28 July 2026

Abstract

This study investigates the degradation of indoor environmental performance in a colonial-era school building under current tropical climate conditions and its implications for occupant comfort and cognitive function. A field study involving 30 students over 18 days was conducted, integrating environmental measurements, subjective responses, and cognitive tests (attention and working memory). Results indicate that indoor air temperature, relative humidity, and illuminance exceeded recommended standards, resulting in elevated PMV (≈1.5) and PPD (>50%), reflecting thermally uncomfortable conditions. Statistical analysis revealed significant negative relationships between thermal stress indicators (PMV and HSSI) and cognitive performance (r up to −0.94). In contrast, lighting showed no significant effect, likely due to the measured illuminance at the representative measurement point. These findings suggest that passive design strategies in colonial buildings are no longer sufficient under current climatic conditions and may compromise learning performance. The study highlights the need for adaptive design interventions to maintain indoor environmental quality in tropical educational buildings.

1. Introduction

Semarang City (Indonesia) was utilized as a center of governance and trade during the Dutch colonial period. As a result, numerous Dutch colonial buildings were constructed throughout the city. Dutch colonial buildings were constructed with adaptations to Indonesia’s tropical climate to ensure both thermal and lighting comfort for their occupants [1]. Climatic adaptations included the incorporation of numerous large openings to facilitate air circulation and natural lighting [2], high ceilings to allow the accumulation of warm air, and double-layered roofs with ventilated cavities to enable the inflow and outflow of hot air, among other features [3]. To this day, several of these colonial buildings remain in use, with some functioning as educational facilities. In the context of building engineering, these features represent passive design strategies intended to support indoor environmental performance.
In educational buildings, maintaining adequate indoor environmental performance is essential to support occupants’ activities, including learning performance. However, due to the impacts of climate change, the effectiveness of these architectural adaptations in maintaining thermal comfort is increasingly being called into question. The National Oceanic and Atmospheric Administration (NOAA) reported a continuous increase in global temperatures. Similarly, Meteorology, Climatology, and Geophysical Agency stated that the average temperature in Indonesia has been increasing by 0.6 °C every 30 years [4]. Colonial school buildings in tropical regions were historically designed to provide acceptable indoor environmental conditions through passive strategies such as high ceilings, large operable windows, verandas, and cross-ventilation. Previous studies have documented the effectiveness of these strategies under historical climatic conditions. However, increasing ambient temperatures associated with climate change may reduce the effectiveness of these passive design features, potentially leading to degraded thermal performance.
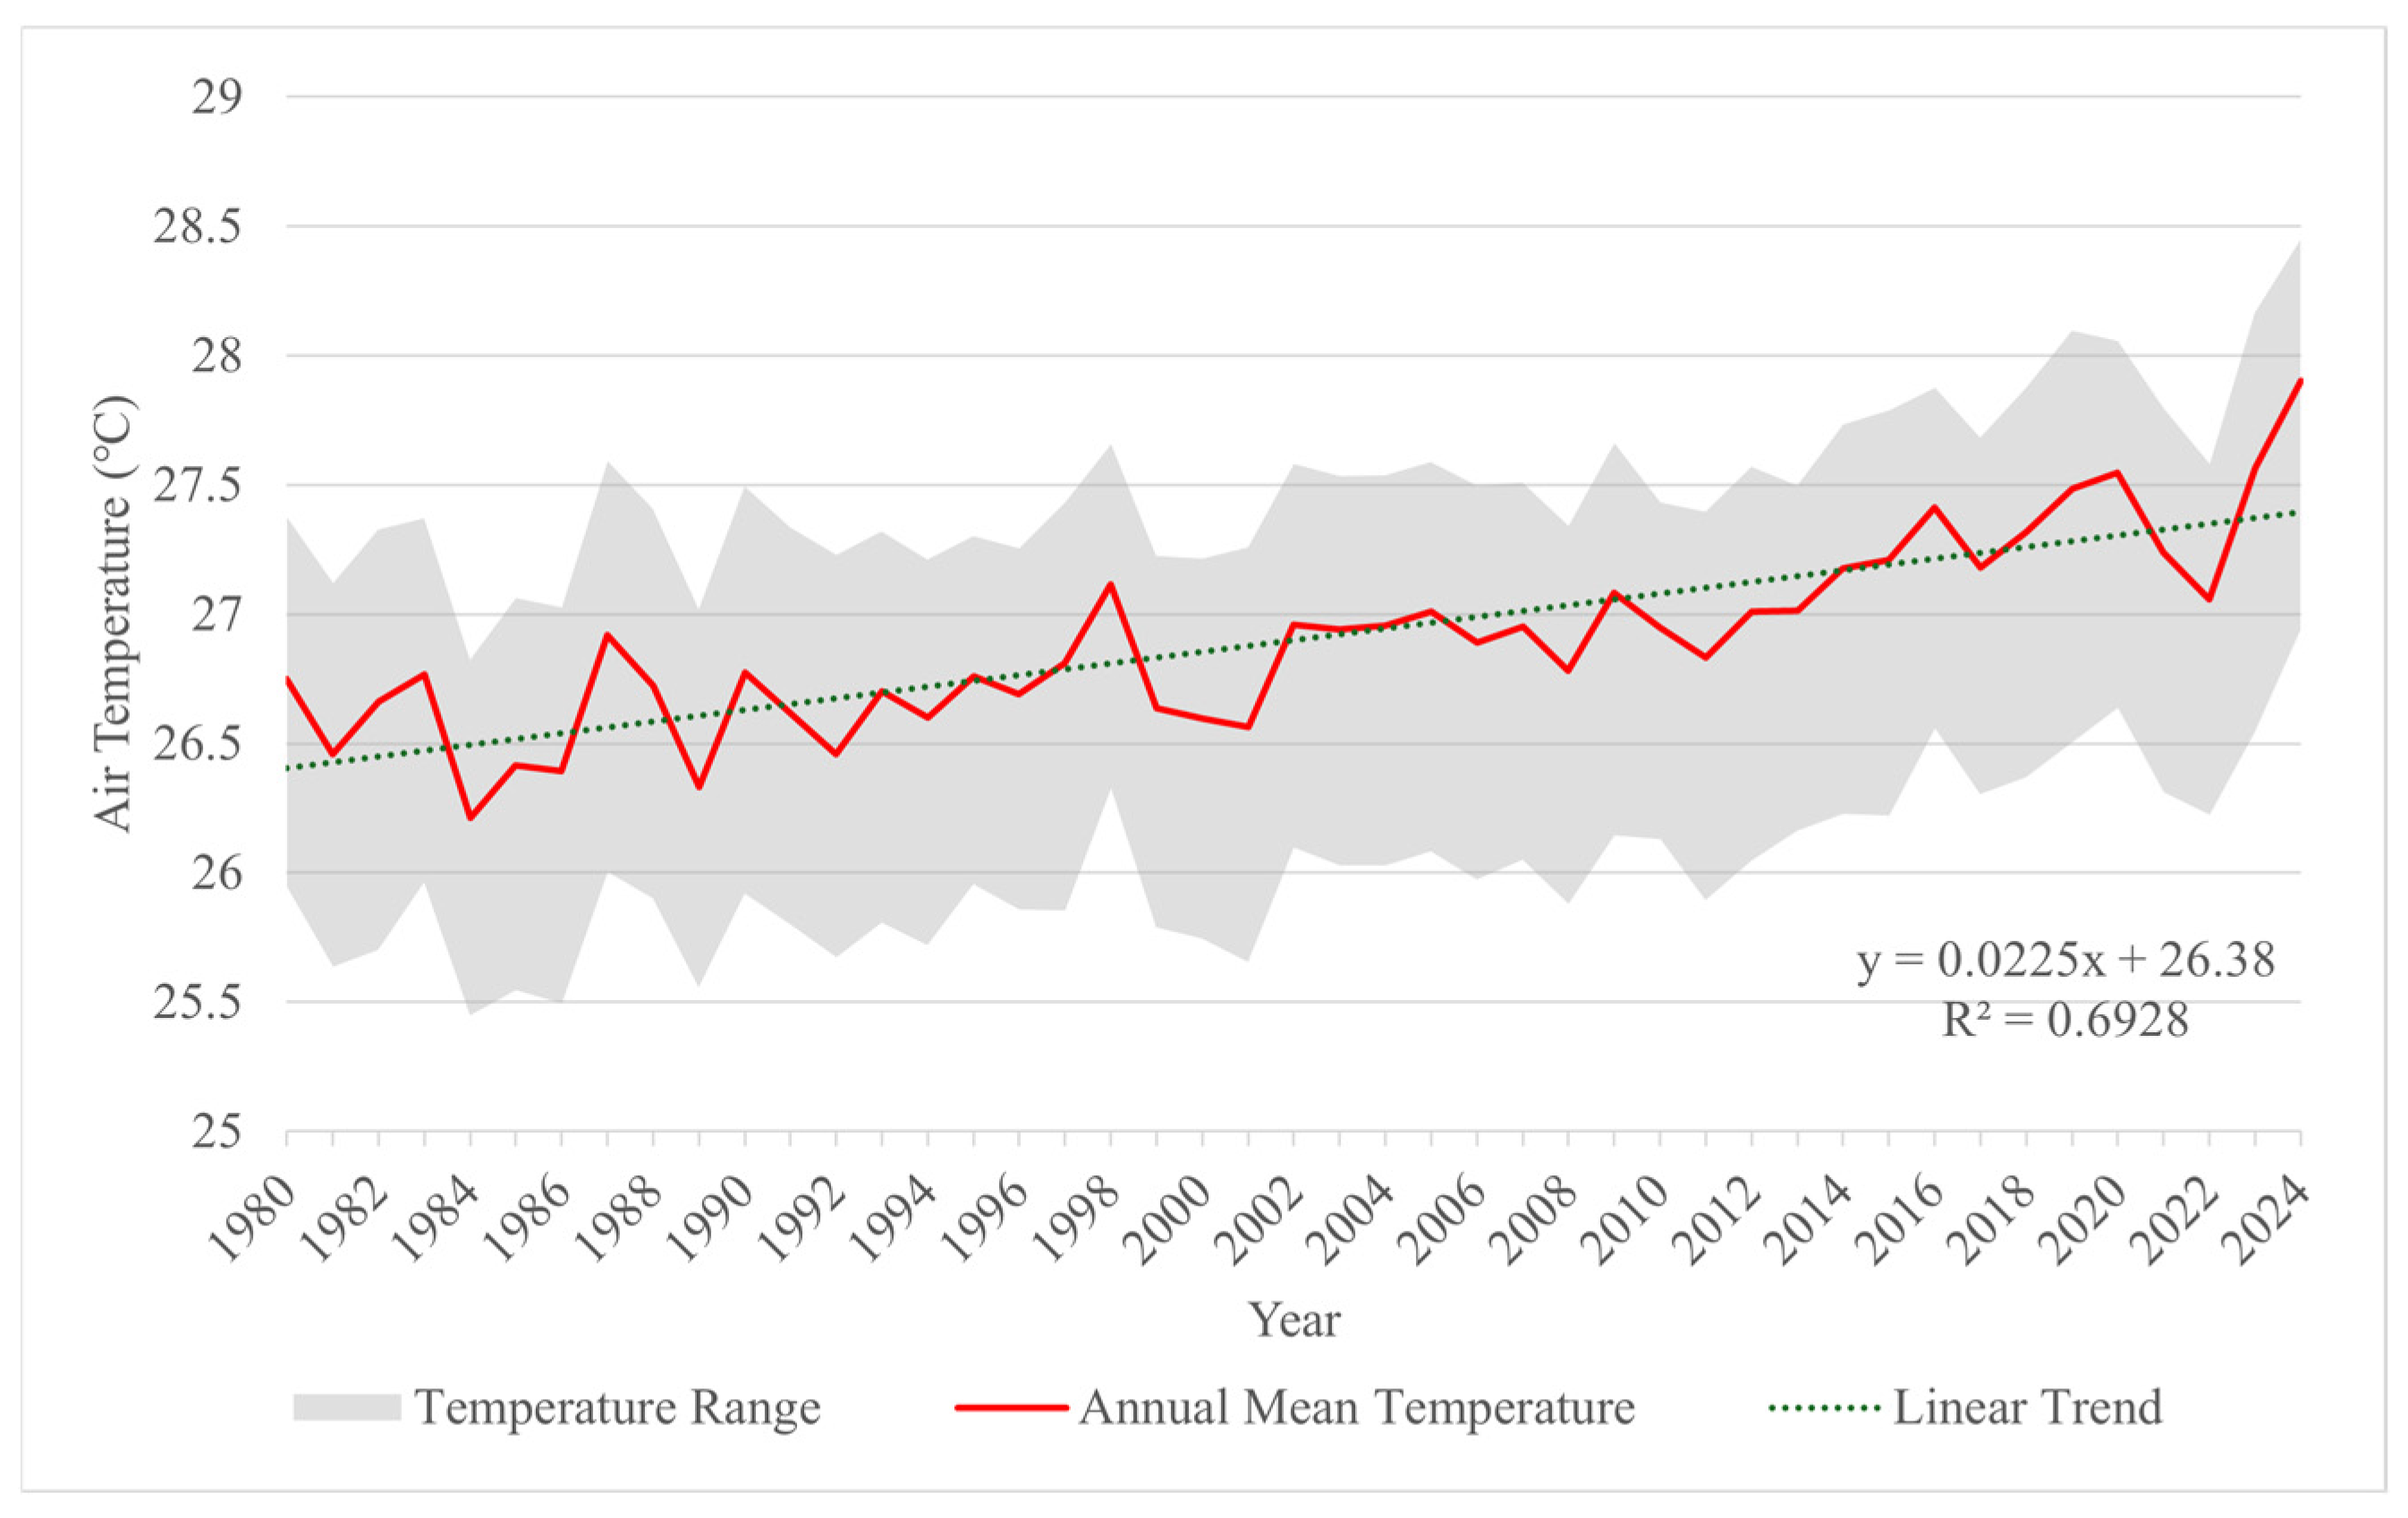
Figure 1 illustrates the historical trend of annual air temperature in the study area from 1980 to 2024 based on ERA5 reanalysis data [5]. The data indicate a long-term increase in annual mean air temperature of approximately 1 °C between 1980 and 2024, suggesting that colonial educational buildings currently operate under warmer climatic conditions than those experienced during much of their service life. These findings provide additional context for reassessing the environmental performance of colonial educational buildings under contemporary climatic conditions.
Although occupants may gradually adapt to warmer environments over time, previous studies suggest that elevated air temperatures may still be associated with reductions in cognitive performance even when thermal comfort is maintained [6]. This suggests that adaptation alone may not fully mitigate the impacts of warming indoor environments on occupants’ performance.
Despite the continued use of colonial educational buildings in tropical regions, limited studies have evaluated their current environmental performance and its implications for occupant comfort and cognitive functioning under contemporary climatic conditions. Previous studies have primarily focused either on thermal comfort in heritage and colonial buildings [7,8] or on the relationship between indoor environmental conditions and cognitive performance [9,10]. As a result, the combined assessment of indoor environmental parameters, occupants’ subjective comfort responses, and cognitive performance in colonial educational buildings remains insufficiently explored.
Thermal and lighting environments are essential factors that support occupants’ activities within a building, in this case, students’ learning activities in schools [11]. During learning activities, a series of cognitive processes occur in the human brain, commonly referred to as human information processing. This process describes how individuals perceive, think about, and respond to various stimuli in their environment [11]. Within this process, attention helps sustain the information processing cycle by ensuring clearer understanding, more accurate responses, and better-controlled behavior [12]. Additionally, working memory plays a role in the formation of new concepts and the level of attentional control [13]. Therefore, when students’ attention and working memory are suboptimal during learning, human information processing can be disrupted, leading to learning difficulties, misinterpretations, and inappropriate responses.
A study conducted at Yonsei University found that an individual’s attention ability is highly influenced by the room’s thermal conditions. The highest level of attention was observed at PMV +1, while the lowest levels of attention occurred at PMV +2 and +3 [14]. Furthermore, research conducted at North Dakota State University revealed that attention ability is influenced not only by temperature but also by lighting conditions. The study indicates that the highest attention performance occurred at temperatures ranging from 26 to 29 °C with illuminance levels between 600 and 900 lux [15]. It was also noted that lighting has a significant interactive effect on attention ability; brighter lighting can enhance students’ attention across various temperature conditions [15]. In addition, previous research found that subjects in a hyperthermic condition experienced a significant 12.22% decrease in working memory performance (t = 4.675, p = 0.002) compared to those in a normothermic condition [16].
Although previous studies have investigated thermal comfort in educational buildings and the influence of indoor environmental conditions on cognitive performance, several important gaps remain. First, limited studies have evaluated whether passive environmental strategies embedded in colonial educational buildings continue to perform effectively under contemporary climate conditions. Second, previous studies have generally examined thermal comfort or cognitive performance separately rather than integrating building environmental performance, occupants’ subjective responses, and cognitive outcomes within a single field investigation. Third, evidence from naturally ventilated colonial educational buildings in tropical regions remains scarce. These gaps motivate the present study.
Therefore, this study aims to evaluate the environmental performance of a colonial educational building in a tropical climate and examine its implications for occupant comfort and cognitive performance under current environmental conditions. Specifically, the study addresses the following research questions (RQ):
  • RQ1. To what extent do passive environmental design strategies in a colonial educational building maintain acceptable indoor environmental quality under current tropical climate conditions?
  • RQ2. What relationships exist between indoor thermal conditions, perceived heat strain, and occupants’ cognitive performance, particularly attention and working memory?
  • RQ3. What implications do the findings provide for adaptive retrofitting strategies aimed at improving the environmental performance of colonial educational buildings while preserving their architectural character?
The study assesses indoor thermal and visual environmental parameters, occupants’ subjective comfort responses, and cognitive performance to provide a comprehensive understanding of the current performance of colonial educational architecture. The findings are expected to contribute to the development of adaptive retrofitting and climate-responsive improvement strategies for existing colonial educational buildings in tropical regions.

2. Materials and Methods

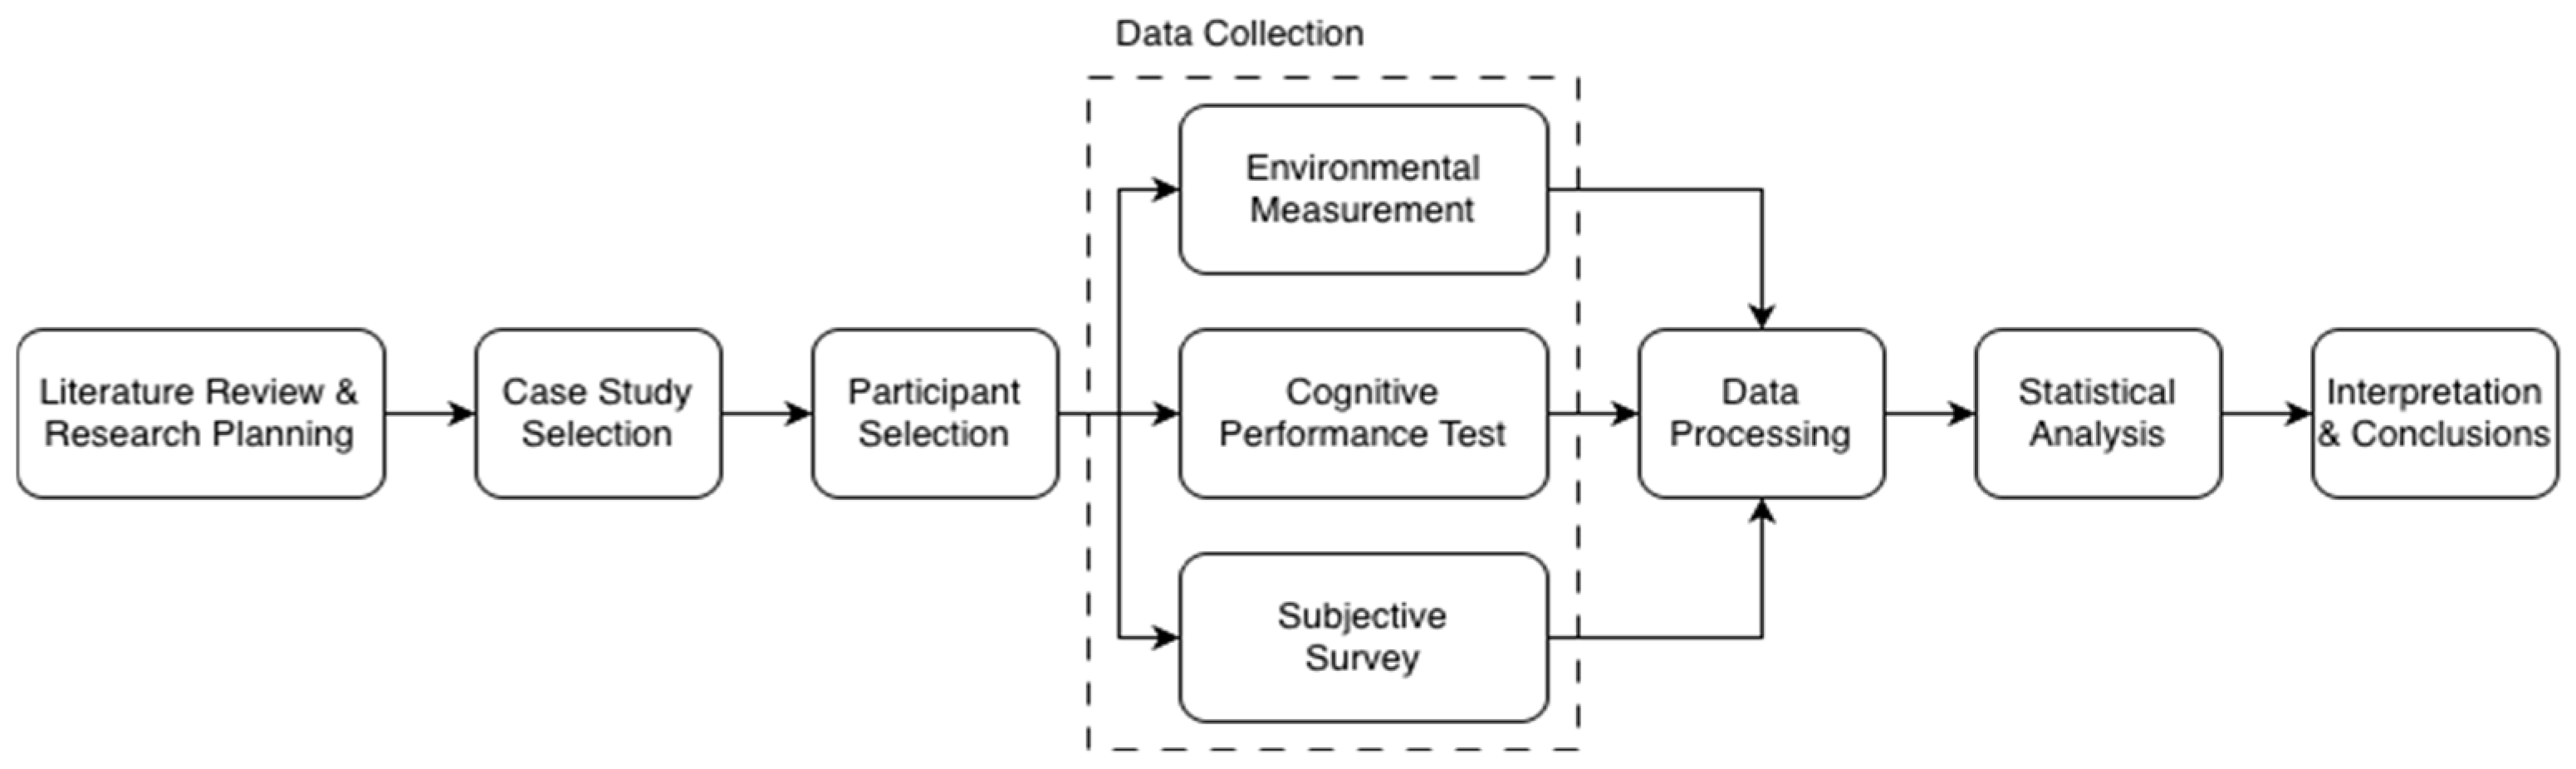
Figure 2 illustrates the overall research workflow adopted in this study. The research began with a literature review and research planning, followed by selecting a colonial school building as the case study and recruiting participating students. Data collection consisted of three parallel components: (1) environmental measurements, including air temperature, relative humidity, air velocity, and illuminance; (2) subjective surveys assessing thermal sensation, thermal comfort, and perceived heat strain; and (3) cognitive performance assessments measuring attention and working memory. The collected data were subsequently processed by calculating daily mean values for each measurement period before statistical analyses, including ANOVA and Pearson correlation, were conducted to examine the relationships between indoor environmental conditions, occupants’ perceptions, and cognitive performance. Finally, the findings were interpreted to evaluate the thermal performance of the colonial school building and its implications for occupant comfort and cognitive function under contemporary climate conditions.

2.1. Participants

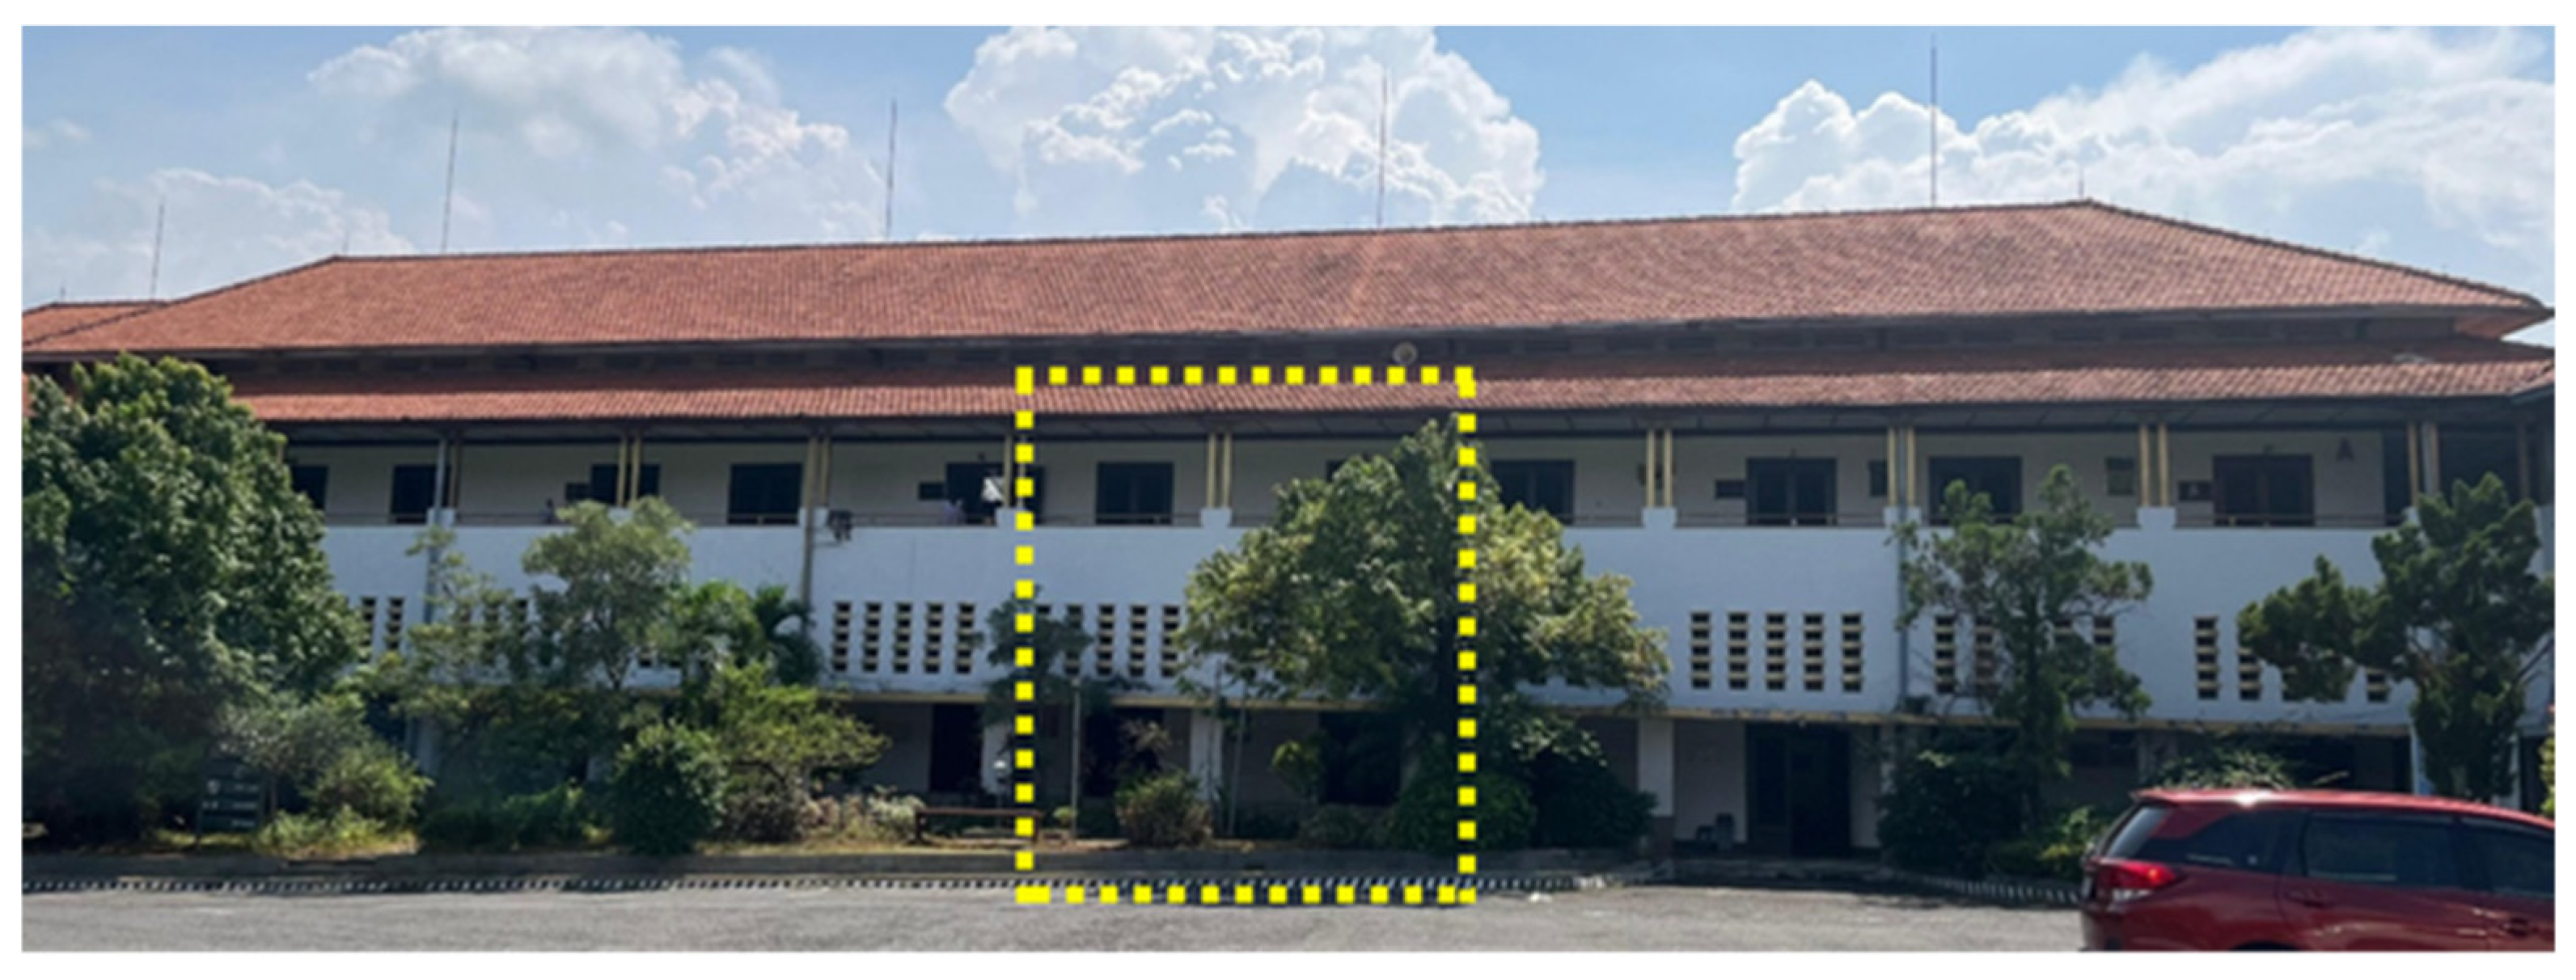
A total of 30 high school students (15 students in each class) with the distribution of 16 males (53.33%) and 14 females (46.67%) participated as respondents in this study. This field study was conducted in the classrooms of the colonial-building high school on the first and second floors in Semarang City, Central Java (6°58′32.402″ S, 110°25′7.173″ E), as shown in Figure 3. A purposive sampling technique was used to select participants based on specific criteria. The criteria include students currently engaged in classroom learning activities, students without Congenital Insensitivity to Pain with Anhidrosis (CIPA), students with no prior caffeine intake, and students willing to participate and follow the research procedures as respondents.

2.2. Instruments

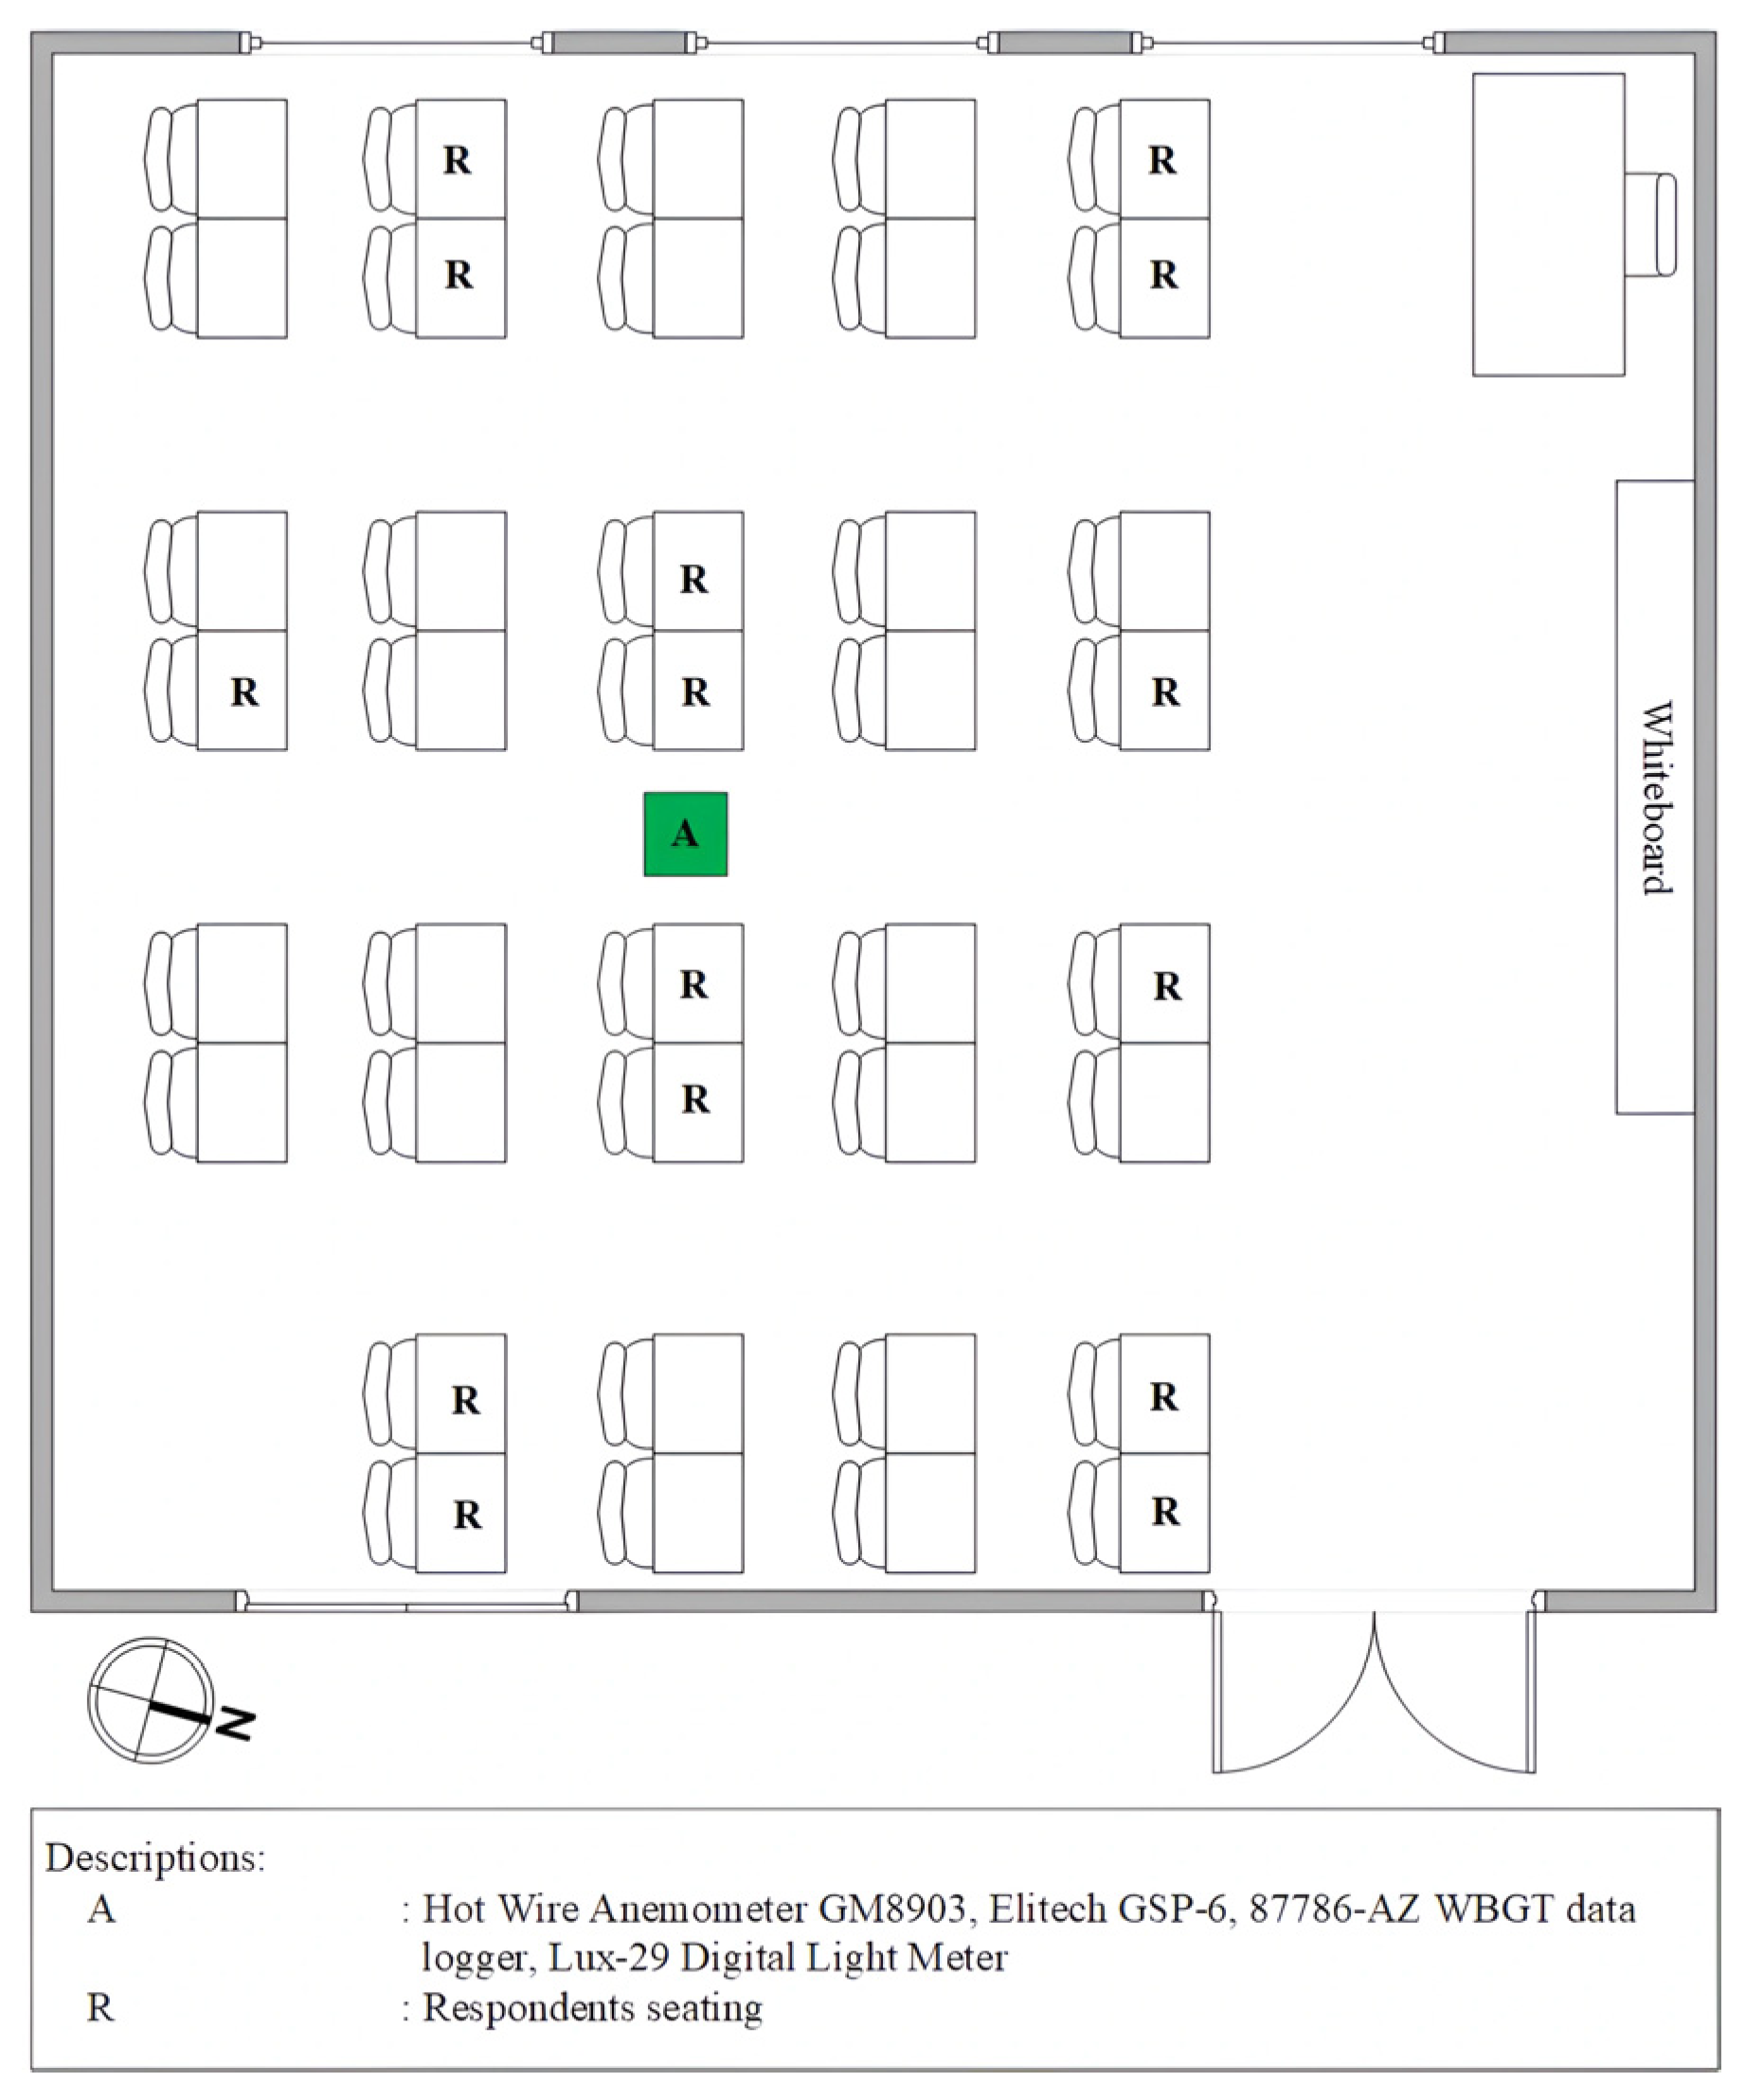
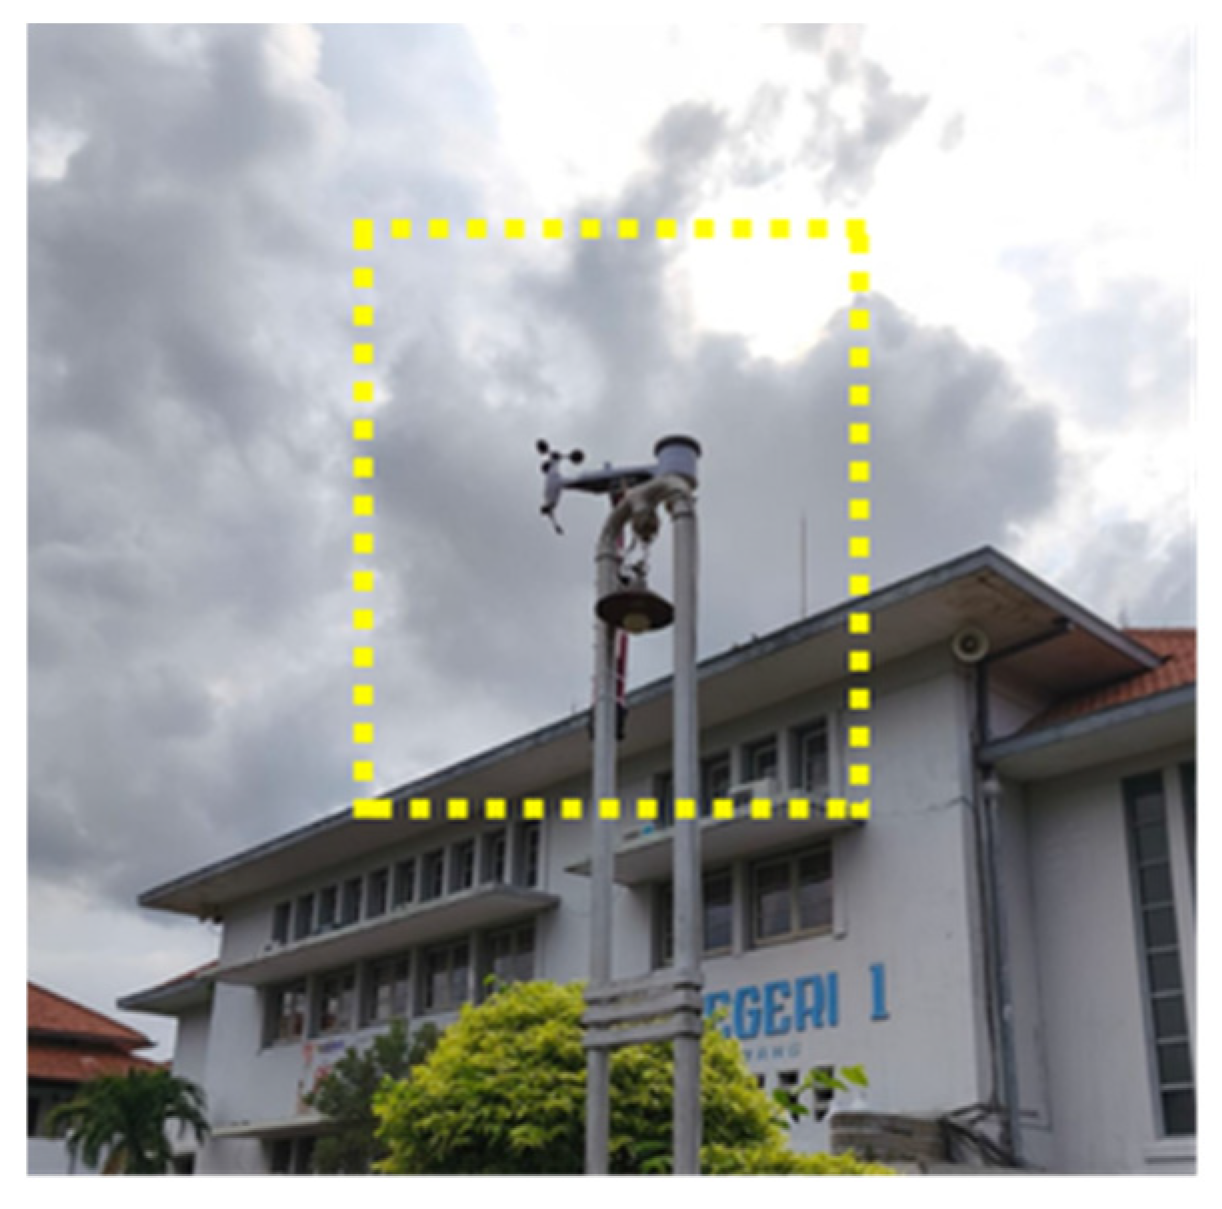
Data collection involved measuring several physical environmental factors, including air temperature, relative humidity, air velocity, mean radiant temperature, and illuminance. The utilized instruments are shown in Table 1. Indoor air temperature (Ta) and relative humidity (Rh) were measured using an Elitech GSP-6 (Elitech Technology Inc., Milpitas, CA, USA), air velocity (Va) was measured using a Hot Wire Anemometer GM89003 (Benetech, Jinan, China), and illuminance (lux) was measured using a Lux-29 Digital Light Meter with Data Logging (Lutron Electronic Enterprise Co., Ltd., Taipei, Taiwan). In addition, outdoor air temperature and relative humidity were recorded using a Wireless Weather Station MISOL-2320 instrument (MISOL, Shenzhen, China). Except for the wireless weather station, all physical parameter-measuring instruments were placed in the center of the classroom at a height of 1.1 m [17], as shown in Figure 4. The wireless weather station was positioned in an open outdoor area near the study building at the height of 3 m above ground level (Figure 5). The instruments used in this study were calibrated before installation.

2.3. Research Design

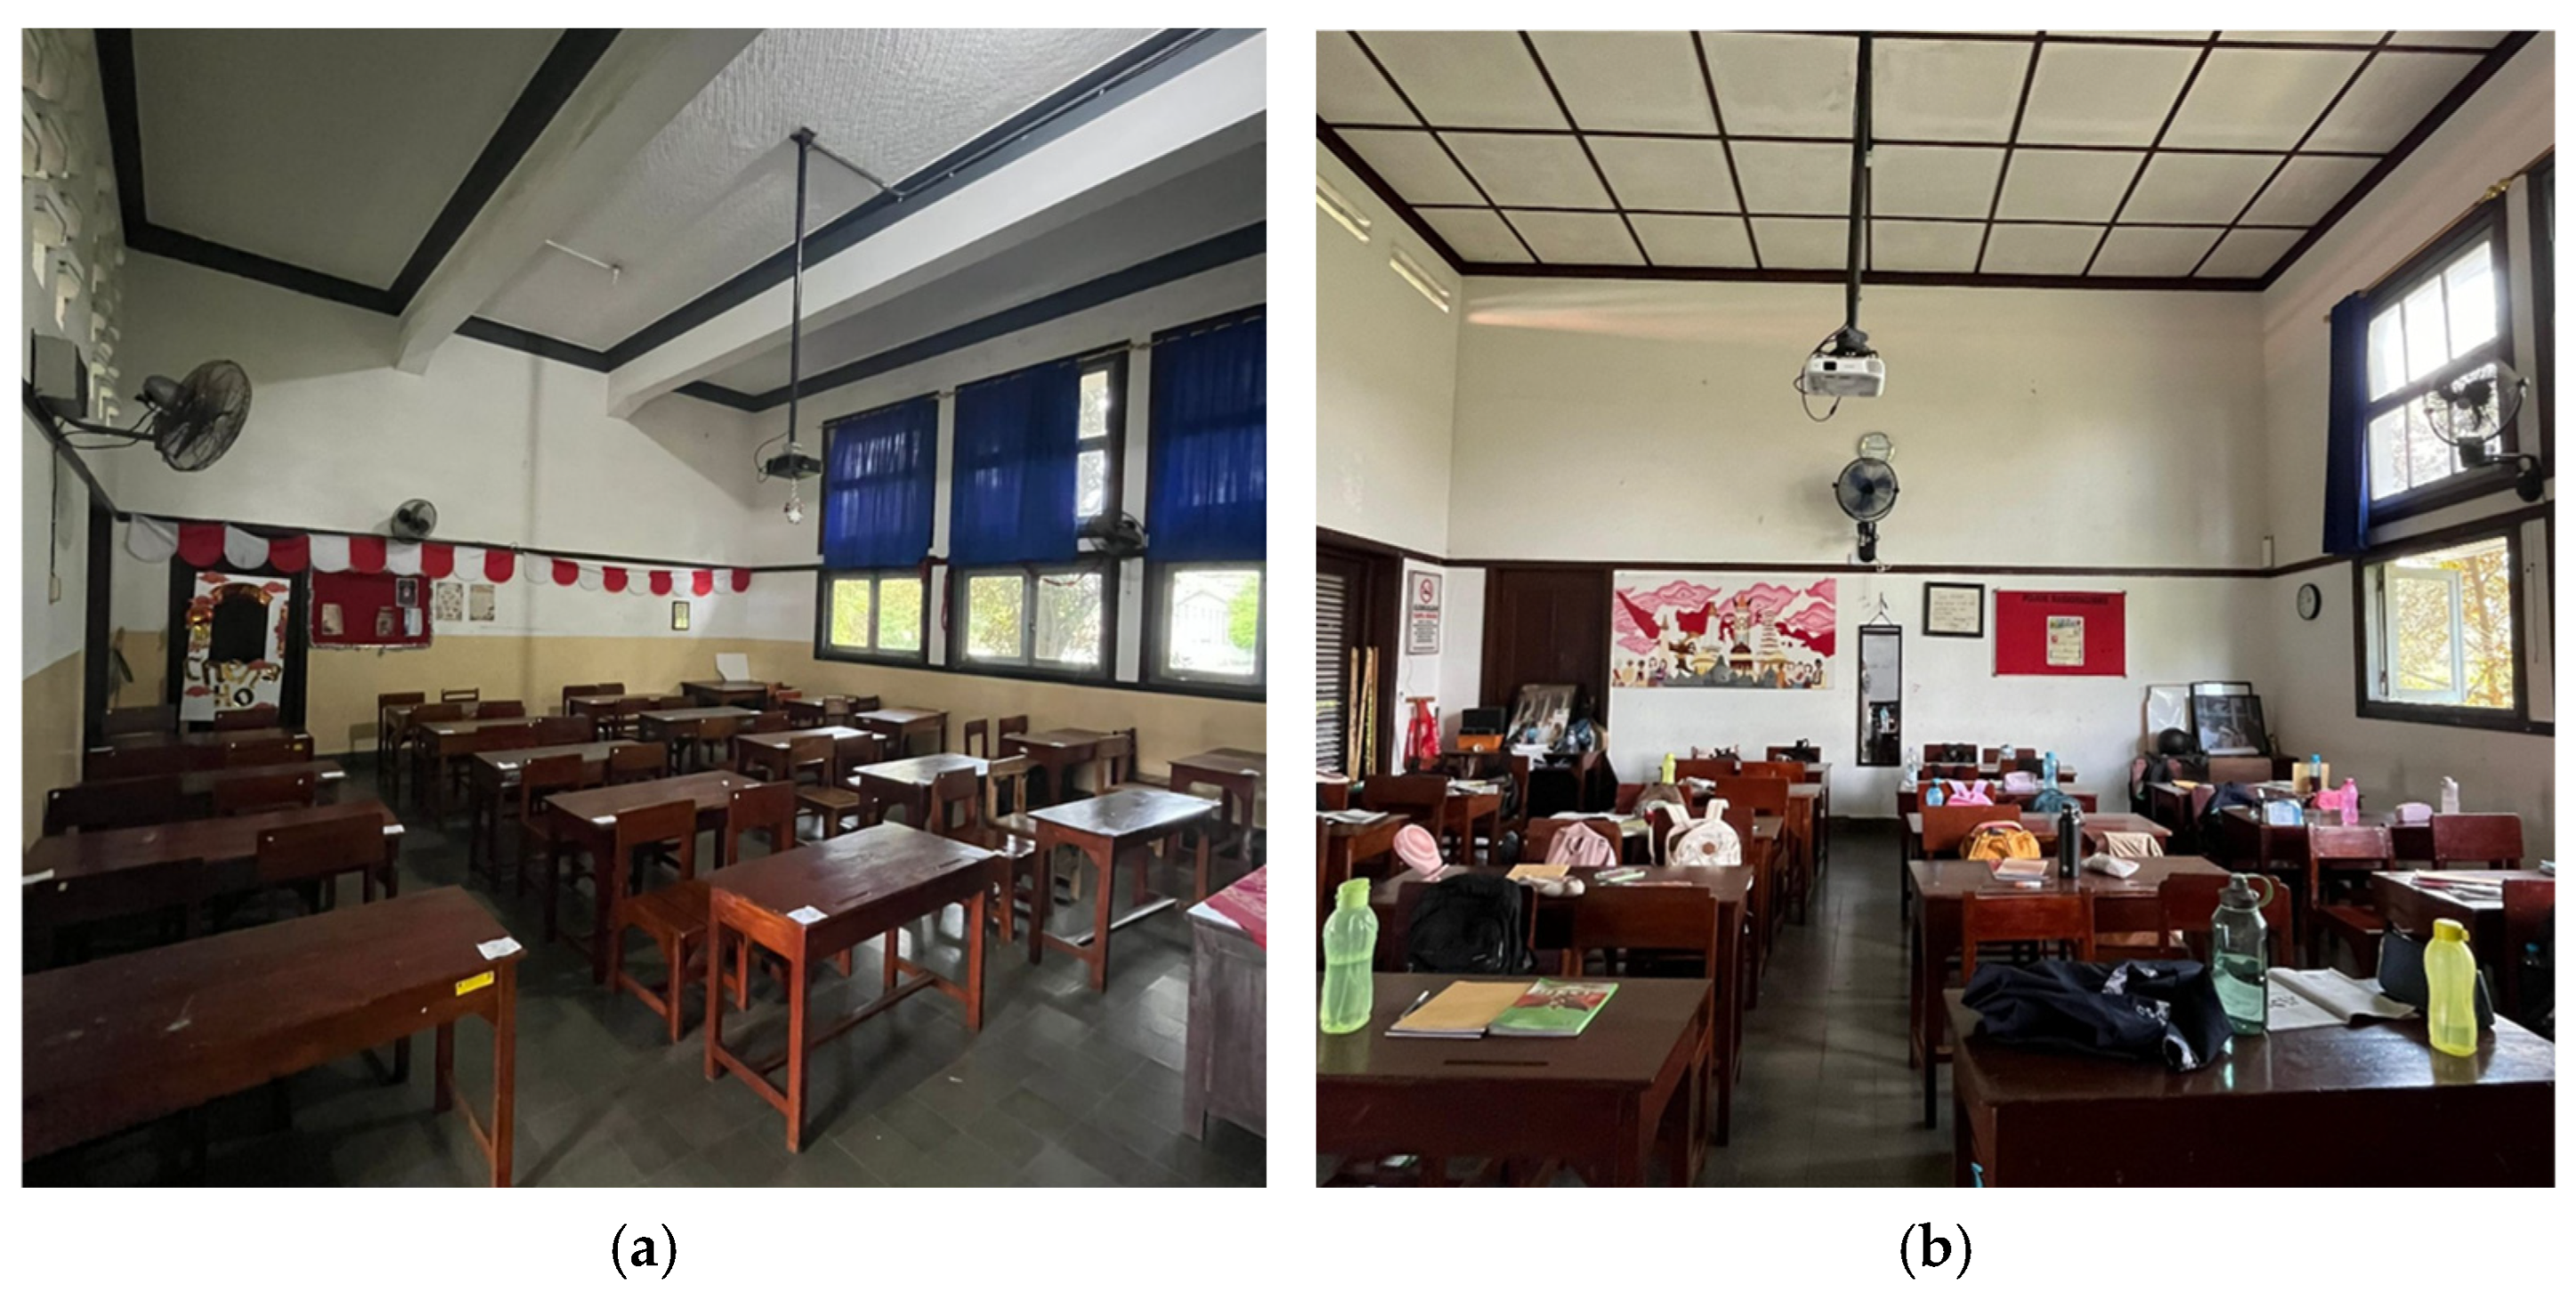
The classes used in this study are located in the center of the building, and each has dimensions of 8 × 7.5 × 5 m, as shown in Figure 6. According to Putra [18], rooms situated in the central part of a building tend to have a more uniform temperature distribution, making them more representative of the building’s overall thermal characteristics. Therefore, these classrooms were selected to represent the building’s indoor environmental performance. The study was carried out from 20 January to 17 February 2025, excluding national holidays and weekends. Prior to data collection, the purpose of this study was explained to the participants. In this study, the students had an 8 h school time starting from 7 a.m. to 3.30 p.m.
Data collection procedures included the physical parameter measurements, subjective responses, and cognitive performances. The environmental parameters were measured continuously during school hours, from morning until dismissal, to obtain a comprehensive overview of fluctuations in indoor thermal and lighting conditions in the classroom. Meanwhile, questionnaire and cognitive test data were collected at three time intervals periodically: morning, noon, and afternoon. This time division aimed to avoid students’ break periods, ensuring that the measurements accurately represented classroom learning activities, and because each time interval exhibited different environmental characteristics.

2.4. Thermal Comfort Assessment

This study used both objective and subjective parameters to evaluate thermal conditions as part of the indoor environmental performance assessment. ASHRAE questionnaires such as thermal sensation votes (TSV) (−3: cold to +3: hot), thermal comfort votes (TC) (−3: very uncomfortable to +3: very comfortable), thermal acceptability votes (TA) (+1: unacceptable and 0: acceptable), and thermal preference votes (TP) (−1: prefer cooler to +1: prefer warmer) were given out to participants at the designated measurement time to evaluate their subjective thermal comfort levels [17]. Although the classrooms were naturally ventilated, the Predicted Mean Vote (PMV) index was employed as an objective indicator of the indoor thermal environment rather than as the sole criterion for assessing thermal comfort. The PMV values were interpreted together with occupants’ subjective thermal sensation votes (TSV), thermal comfort votes (TCV), perceived heat strain, and cognitive performance to provide a comprehensive evaluation of indoor environmental conditions.
In addition, physical measurement results were used to further support the evaluation of thermal comfort levels. To compare subjective responses with objective environmental conditions, the Predicted Mean Vote (PMV) and predicted percentage of dissatisfied (PPD), developed by Fanger [19], were calculated at the same time intervals. The PMV and PPD equations used in this study are explained in (1) and (2). All the respondents were students who wore the same school uniform. Therefore, for the PMV calculations, the clothing insulation level was assumed to be 0.6 [17].
PMV = ( 0.303   ×   10 0.036 M   +   0.028 )   { ( M W ) 3.05   ×   10 3   ×   [ 5733 6.99   ( M W ) P a ] 0.42   ×   { ( M W ) 58.15 ] 1.7   ×   10 5   M   ( 5867 P a ) 0.0014   M   ( 34 t a ) 3.96   ×   10 8   F cl   ×   [ ( T cl   +   273 ) 4     ( M RT   +   273 ) 4 ]     F cl H c ( T cl     T a ) }
PPD = 100 95   ×   10 0.3353 × P M V 4 + 0.2179 × PMV 2
where PMV is the Predicted Mean Votes which scale from cold (−3) to hot (+3), M is the metabolic rate (W/m2), W is the effective mechanical power which is 0 for most activities (W/m2), Fcl is the clothing surface area factor, Ta is the air temperature (°C), TMRT is the mean radiant temperature (°C), Pa is the partial water vapor pressure (Pa), Hc is the convective heat transfer (W/m2K), and Tcl is the clothing surface temperature (°C). TMRT in the PMV formula was calculated using the globe temperature formula [20] elaborated in (3).
T M R T = T g + 273.15 4 + 1.1 × 10 8 V a 0.6 ε D 0.4 × T g T a 0.25 273.15
where Tg is the globe temperature (°C), Va is the air velocity (m/s), ε is black globe emissivity (0.95), D is the diameter of the black globe (0.15), and Ta is the air temperature (°C). Additionally, the heat strain score index (HSSI) questionnaires (Appendix A), developed by Dehghan [21] to assess heat strain levels subjectively, were used in this study to determine respondents’ heat strain levels.

2.5. Lighting Comfort Assessment

Lighting comfort level in this study was based on illuminance measurement and perceived lighting comfort level votes. The perceived lighting comfort was evaluated using the Lighting Comfort Vote (LCV) (−3: very uncomfortable to +3: very comfortable) and the Lighting Sensation Vote (LSV) (−3: very dark to +3: very bright) [22]. Moreover, the measured illuminance level would be compared to the Ministry of Health of the Indonesian Republic standards for classrooms (200–300 lux) [23]. Illuminance was measured at the geometric center of the occupied classroom using a lux meter placed at desk height. This location was selected to represent the typical visual environment students experience during classroom activities and to ensure consistent measurements across all observation periods. The primary objective of the illuminance measurement was to characterize representative lighting conditions within the occupied zone rather than to evaluate the spatial distribution or uniformity of daylight throughout the classroom.

2.6. Cognitive Test

Learning performance in this study was evaluated based on respondents’ attention and working memory. Attention ability was evaluated using the Stroop Task. The Stroop test measures selective visual attention, which helps individuals prioritize relevant information while ignoring irrelevant stimuli [15]. In this test, participants are instructed to press the corresponding key on the keyboard that matches the color of the displayed word. The written word itself differs from the font color, serving as a distractor or irrelevant information.
Working memory in this study was evaluated using the N-back test. The N-back test is a reliable method for measuring working memory capacity [24]. The correct percentage was recorded for both tests as dependent variables in this study. Additionally, cognitive tests in this study were conducted using web-based software (Psytoolkit version 3.7.0, https://www.psytoolkit.org/, accessed on 15 July 2026) developed by Stoet [25,26].

2.7. Statistical Analysis

Environmental and cognitive data were analyzed using JASP Version 0.95.4 [27]. Descriptive statistics are presented as mean, standard deviation, minimum, and maximum values. Since environmental conditions reflected classroom-level characteristics rather than individual-level exposures, repeated measurements from individual students within the same classroom and measurement period were aggregated into daily classroom-mean values. For each of the 18 observation days, separate daily averages were calculated for the morning, noon, and afternoon sessions for each classroom. These daily mean values were subsequently used as the unit of analysis in all inferential statistical analyses.
Differences in environmental parameters, subjective comfort responses, and cognitive performance across measurement times (morning, noon, and afternoon) and classroom floors were examined using two-way analysis of variance (ANOVA). When significant main effects were identified, Tukey’s honestly significant difference (HSD) post hoc test was applied for pairwise comparisons. Statistical significance was established at p < 0.05. Prior to ANOVA, the assumptions of normality and homogeneity of variances were evaluated using the Shapiro–Wilk and Levene’s tests, respectively. Simple linear regression was additionally used to visualize the relationships between PMV and cognitive performance variables.

2.8. Ethical Considerations

All the research procedures were approved by the Health Research Ethics Committee, Faculty of Public Health, Diponegoro University (Ethics Code: 76/EA/KEPK-FKM/2025). Before the study began, the necessary explanations were given to the teaching staff and students. The students were also assured that their personal information would be kept confidential.

3. Results

3.1. Physical Environment

A total of 18 observation days were included in the statistical analyses after excluding days with incomplete measurements caused by unexpected events (e.g., power outages). For inferential analyses, daily mean values for each classroom and each measurement period (morning, noon, and afternoon) were calculated and used as the analytical observations. This is due to missing data and an unpredictable event, such as an electricity blackout, that occurred during the research duration. During the measurement period, the maximum and minimum values of air temperature, relative humidity, and air velocity are shown in Table 2. Outdoor physical measurement was affected by unpredictable weather, hence the wide gap between the maximum and minimum values.
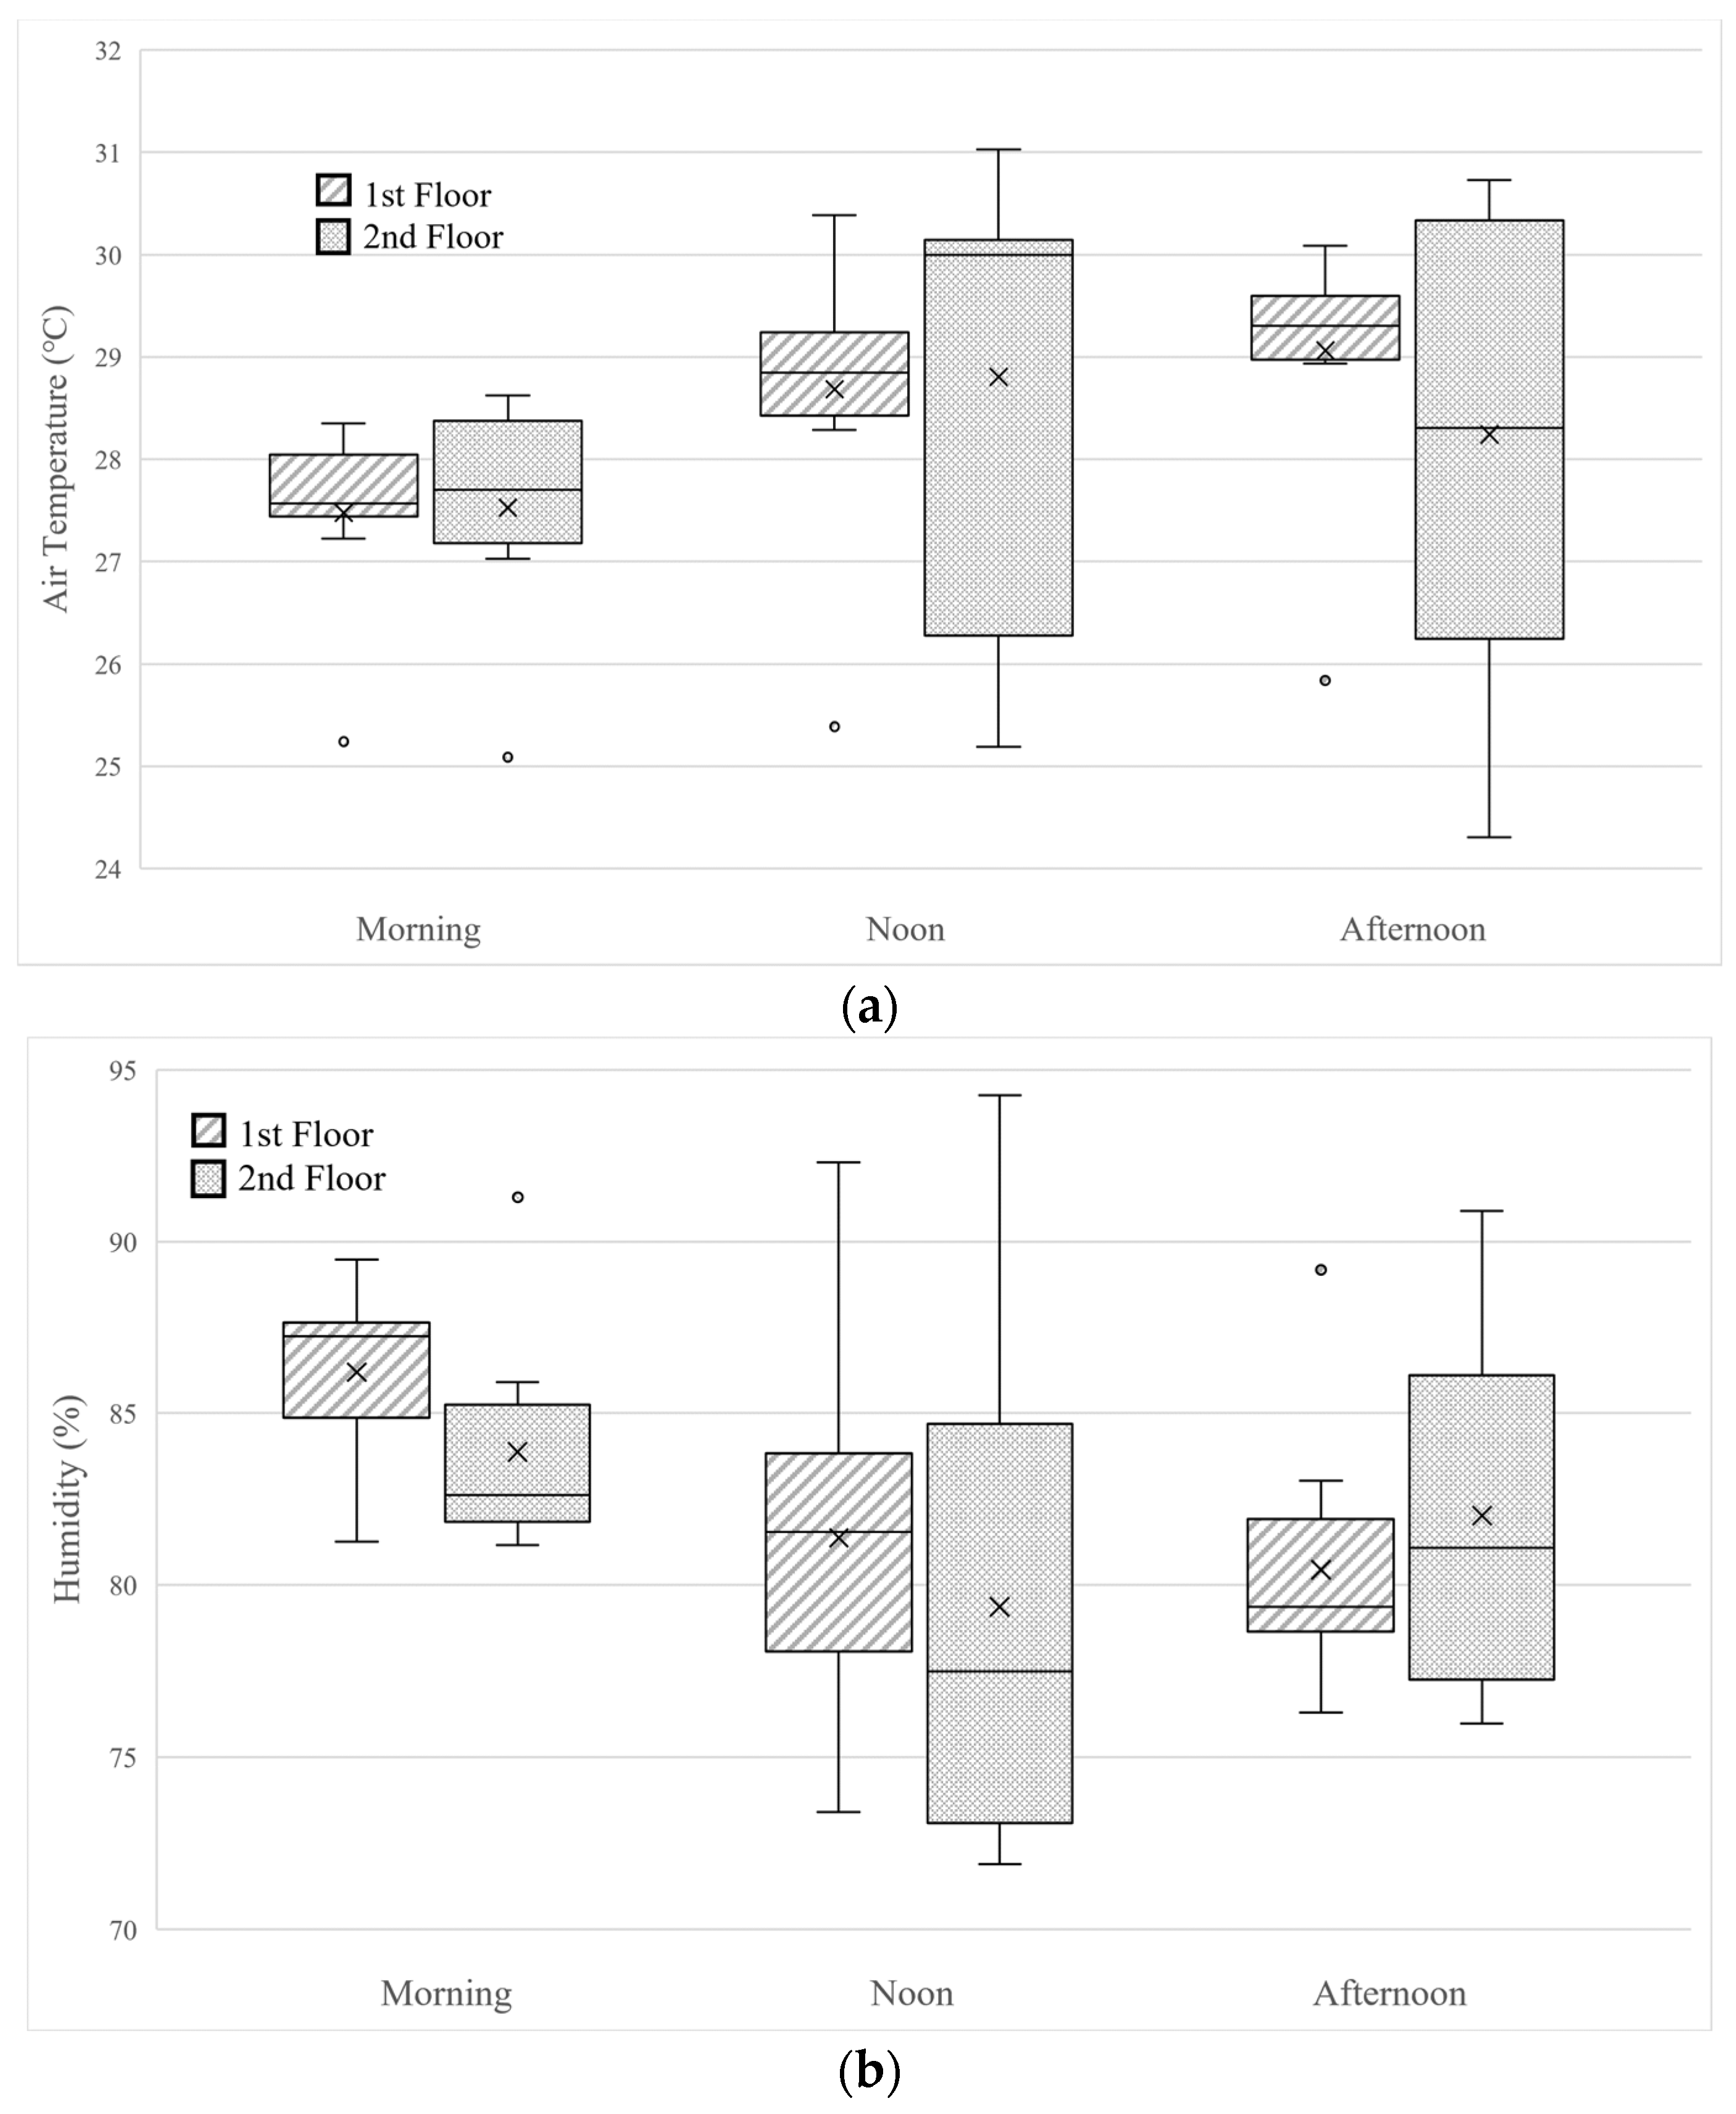
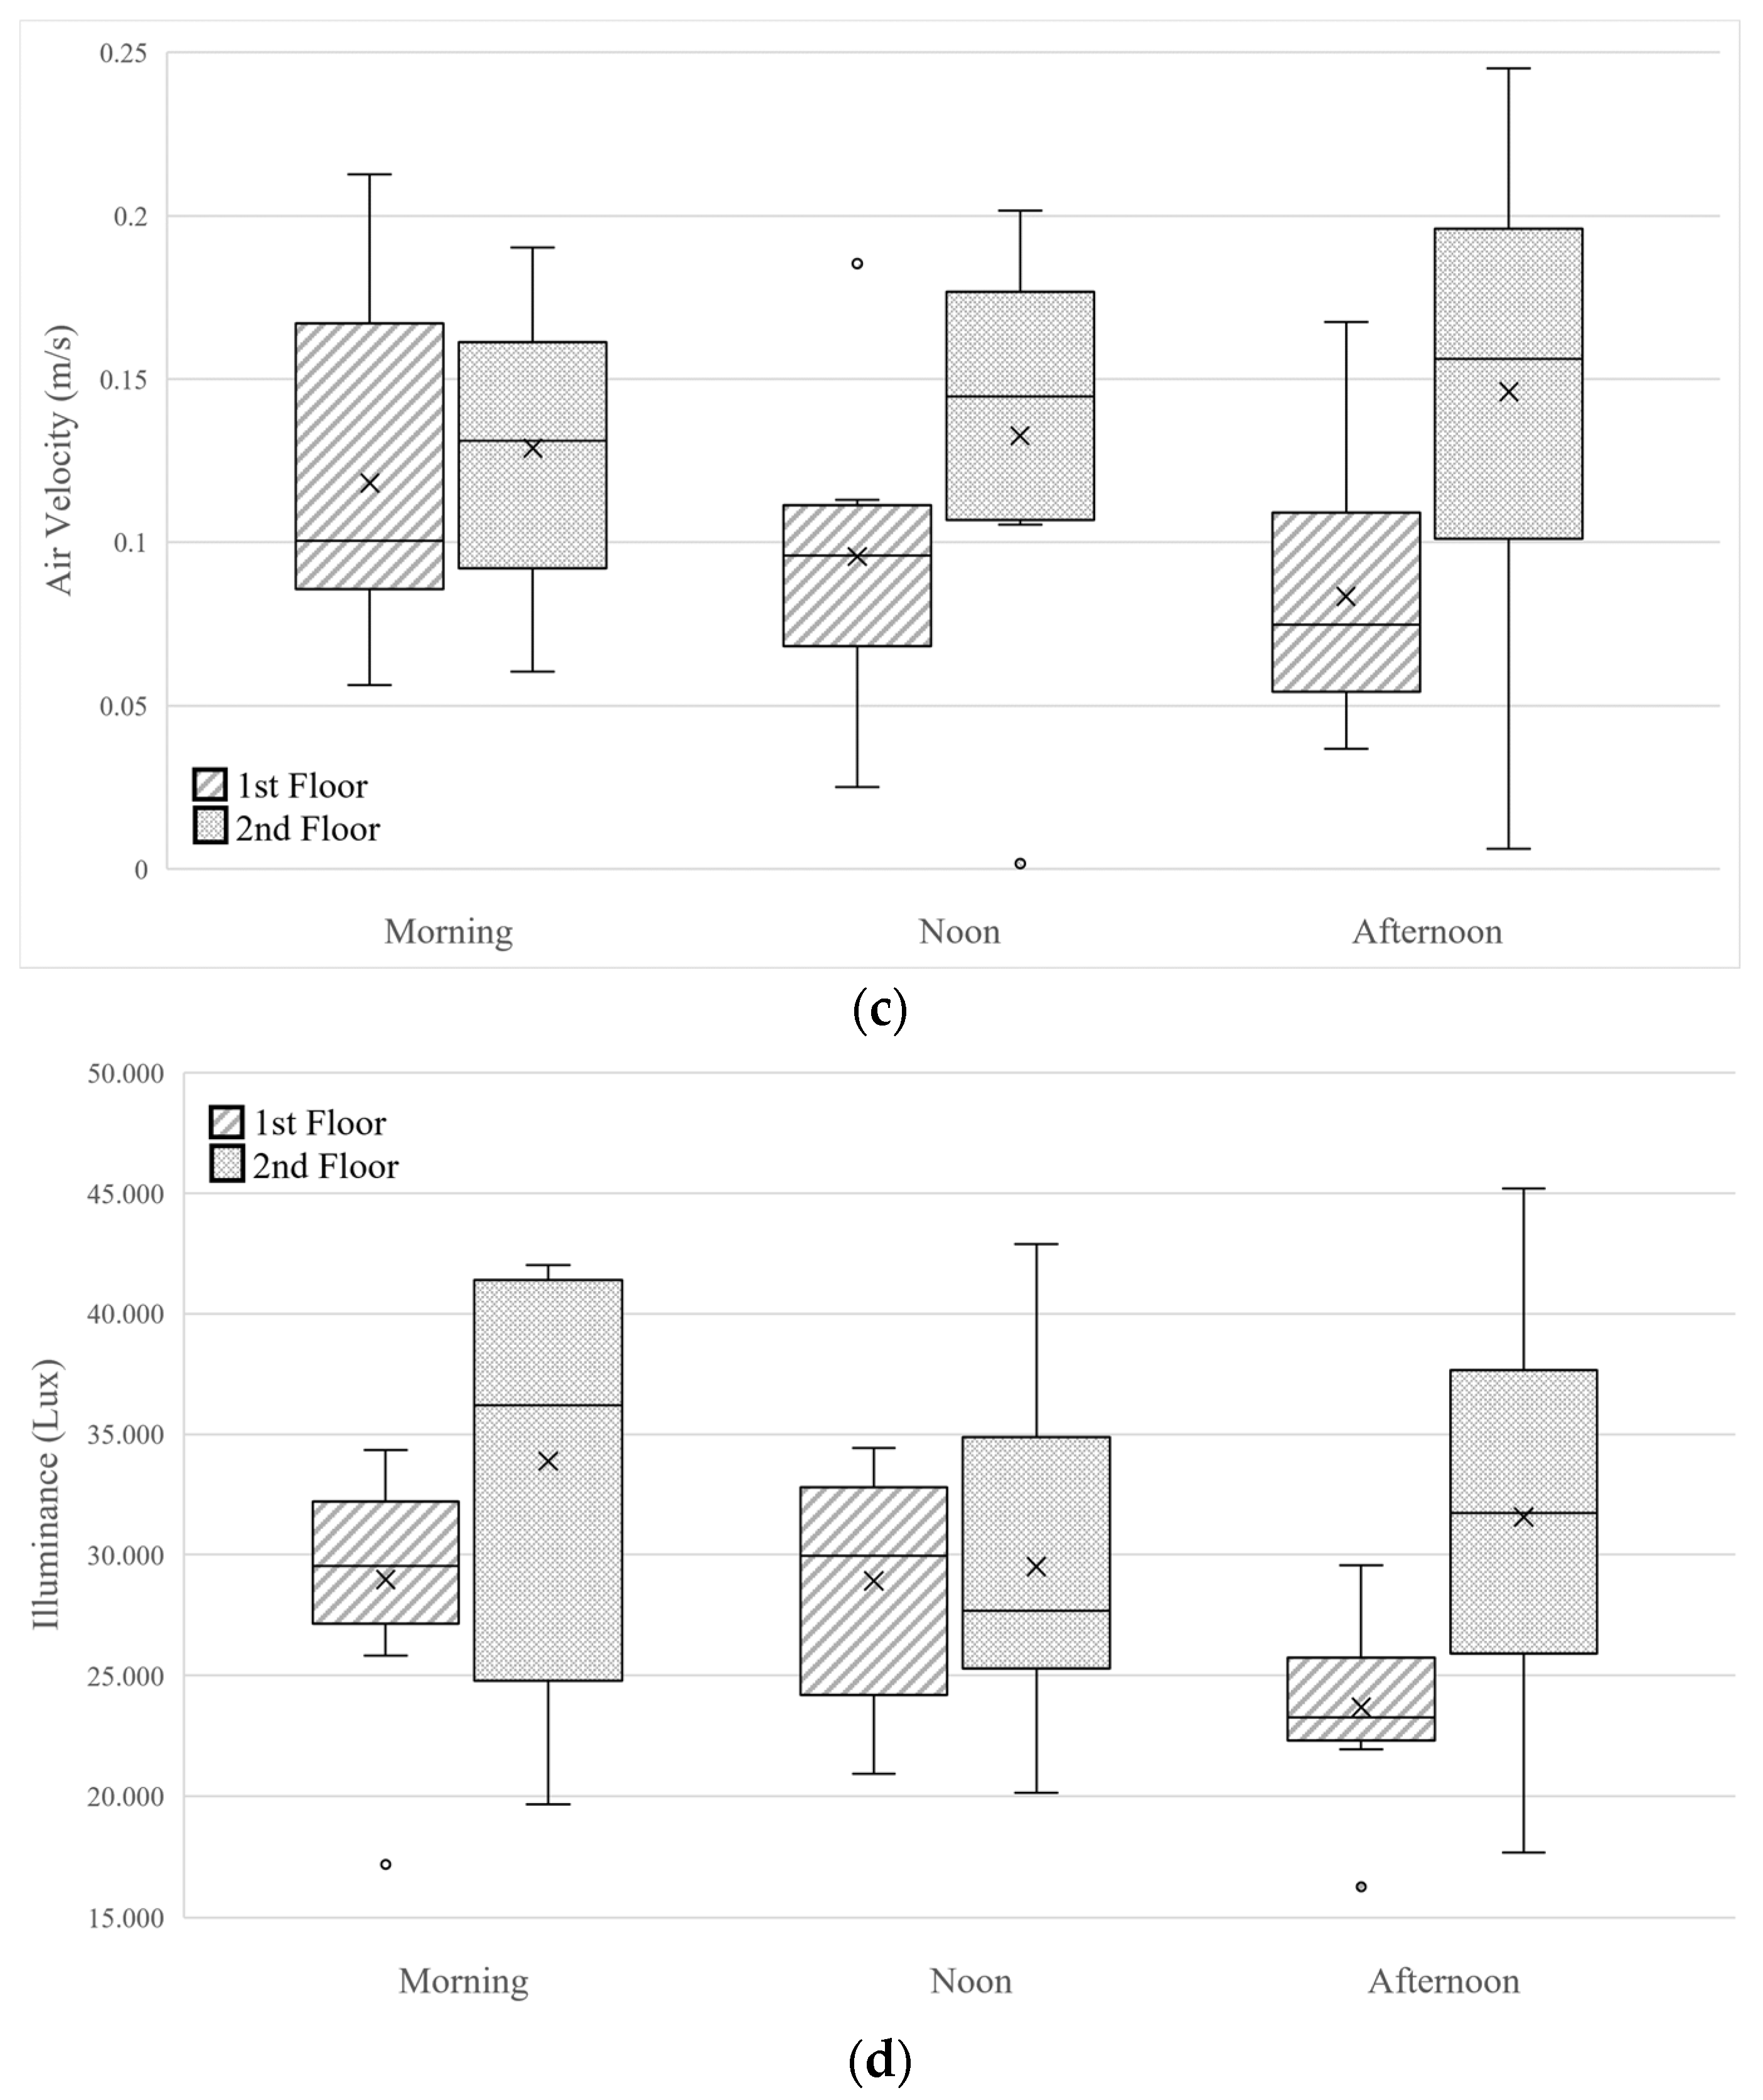
The indoor environment measurement results are shown in Figure 7. The indoor physical measurement results indicate that the average air temperature, relative humidity, and illuminance exceeded the regulatory thresholds. The air temperature threshold is set at 23–26 °C; relative humidity is set at 40–60% [28]; and illuminance is set at 200–300 lux [21]. In contrast, the air velocity measurement results remained within the government-regulated threshold of 0.15–0.5 m/s [29].
Prior to inferential analyses, all variables were examined for normality and homogeneity of variance. No substantial violations of Analysis of variance (ANOVA) assumptions were identified. ANOVA performed on the daily mean values collected over the 18-day observation period revealed a significant effect of time of day on air temperature (F (2, 48) = 3.515, p < 0.05), indicating that temperature varied across different periods. However, no significant differences were observed between floors (p > 0.05). Similar patterns were found for relative humidity, where time of day had a significant effect (F (2, 48) = 4.839, p < 0.05), but floor level did not (p > 0.05). Post hoc comparisons test indicated that relative humidity at noon and in the afternoon was significantly lower than in the morning (p < 0.05). In contrast, air velocity showed no significant variation across times of day (p > 0.05), but there was a significant difference between floors (F (1, 48) = 6.628, p < 0.05), suggesting spatial rather than temporal variation. Finally, illuminance differed significantly between floors (F (1, 48) = 6.670, p < 0.05), whereas no significant differences were detected across times of day (p > 0.05).
This study found that the sample classrooms in this colonial building, based on physical measurements, were unable to provide adequate thermal and lighting comfort. However, this finding still needs to be compared with respondents’ subjective responses, as acclimatization factors could affect occupants’ perceived thermal comfort.
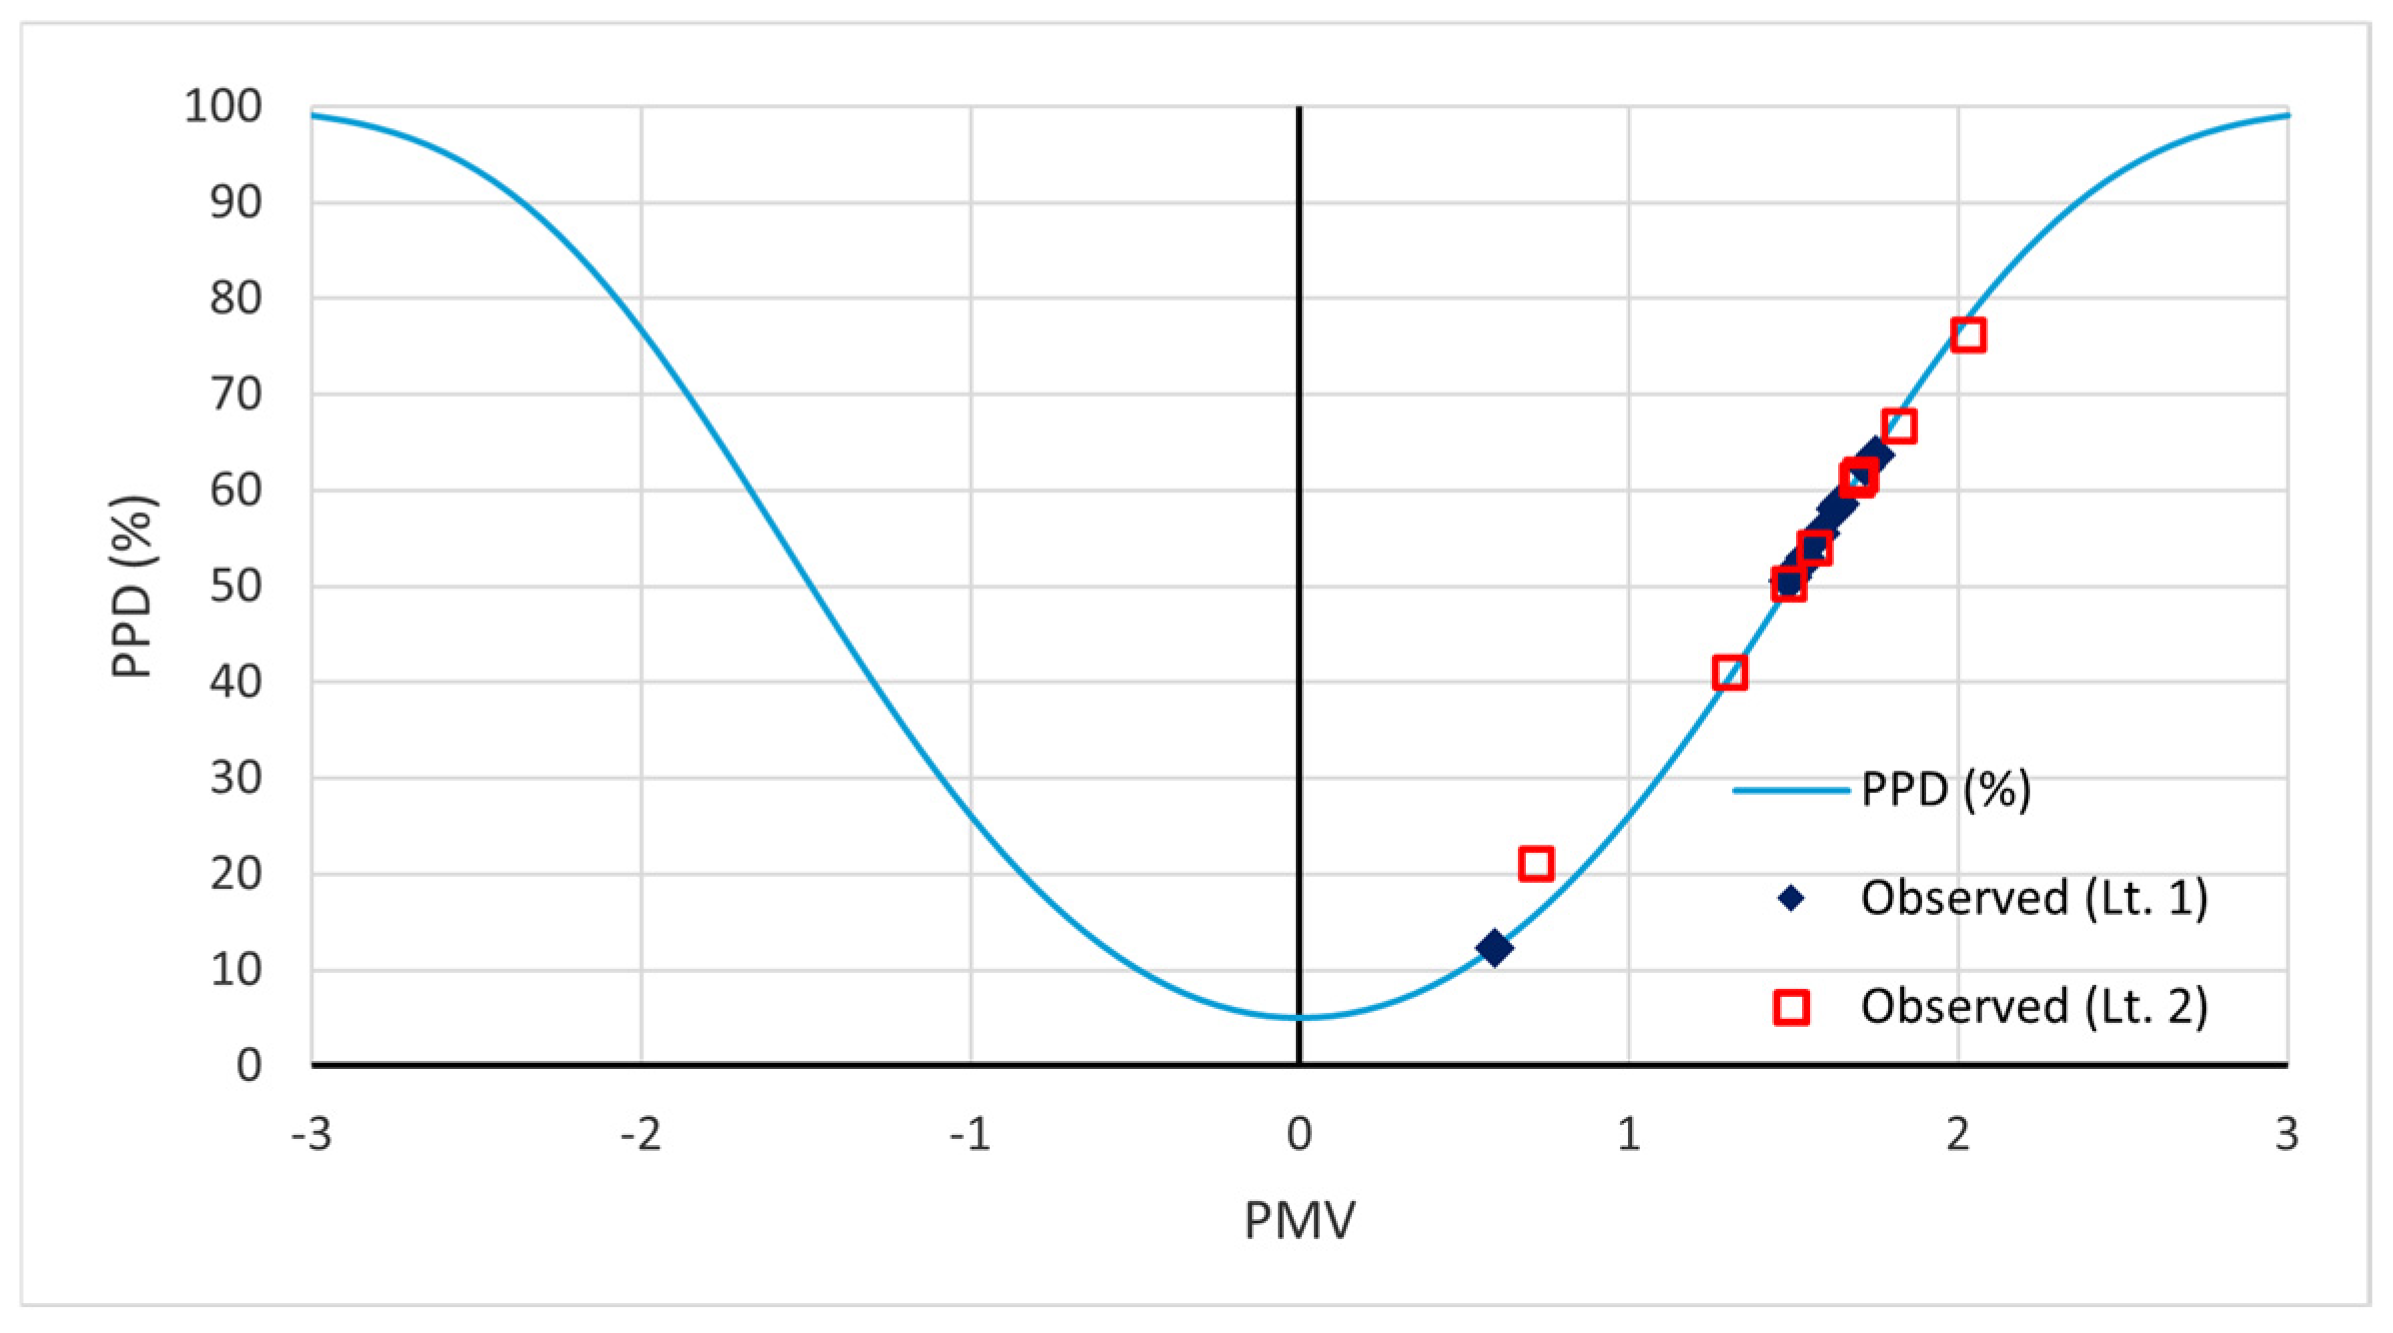
The calculation of PMV and PPD in this study is represented by the scatter plot points in Figure 8. PMV calculations showed that the average of PMV of the respondents on the first and second floors is 1.493 and 1.593, respectively. Additionally, the average PPD of the respondents on the first and second floors is 51.71% and 54.05%, respectively. Although the differences in PMV and PPD values between the two floors were not statistically significant (p > 0.05), the obtained values indicate a deviation from the thermal comfort range defined by ASHRAE Standard 55. According to this standard, thermal comfort is achieved when PMV values range between −0.5 and +0.5 and PPD values remain below 10% [18]. Therefore, the findings suggest that the occupants were likely to feel warm and dissatisfied with the classroom’s thermal environment.

3.2. Subjective Thermal Comfort

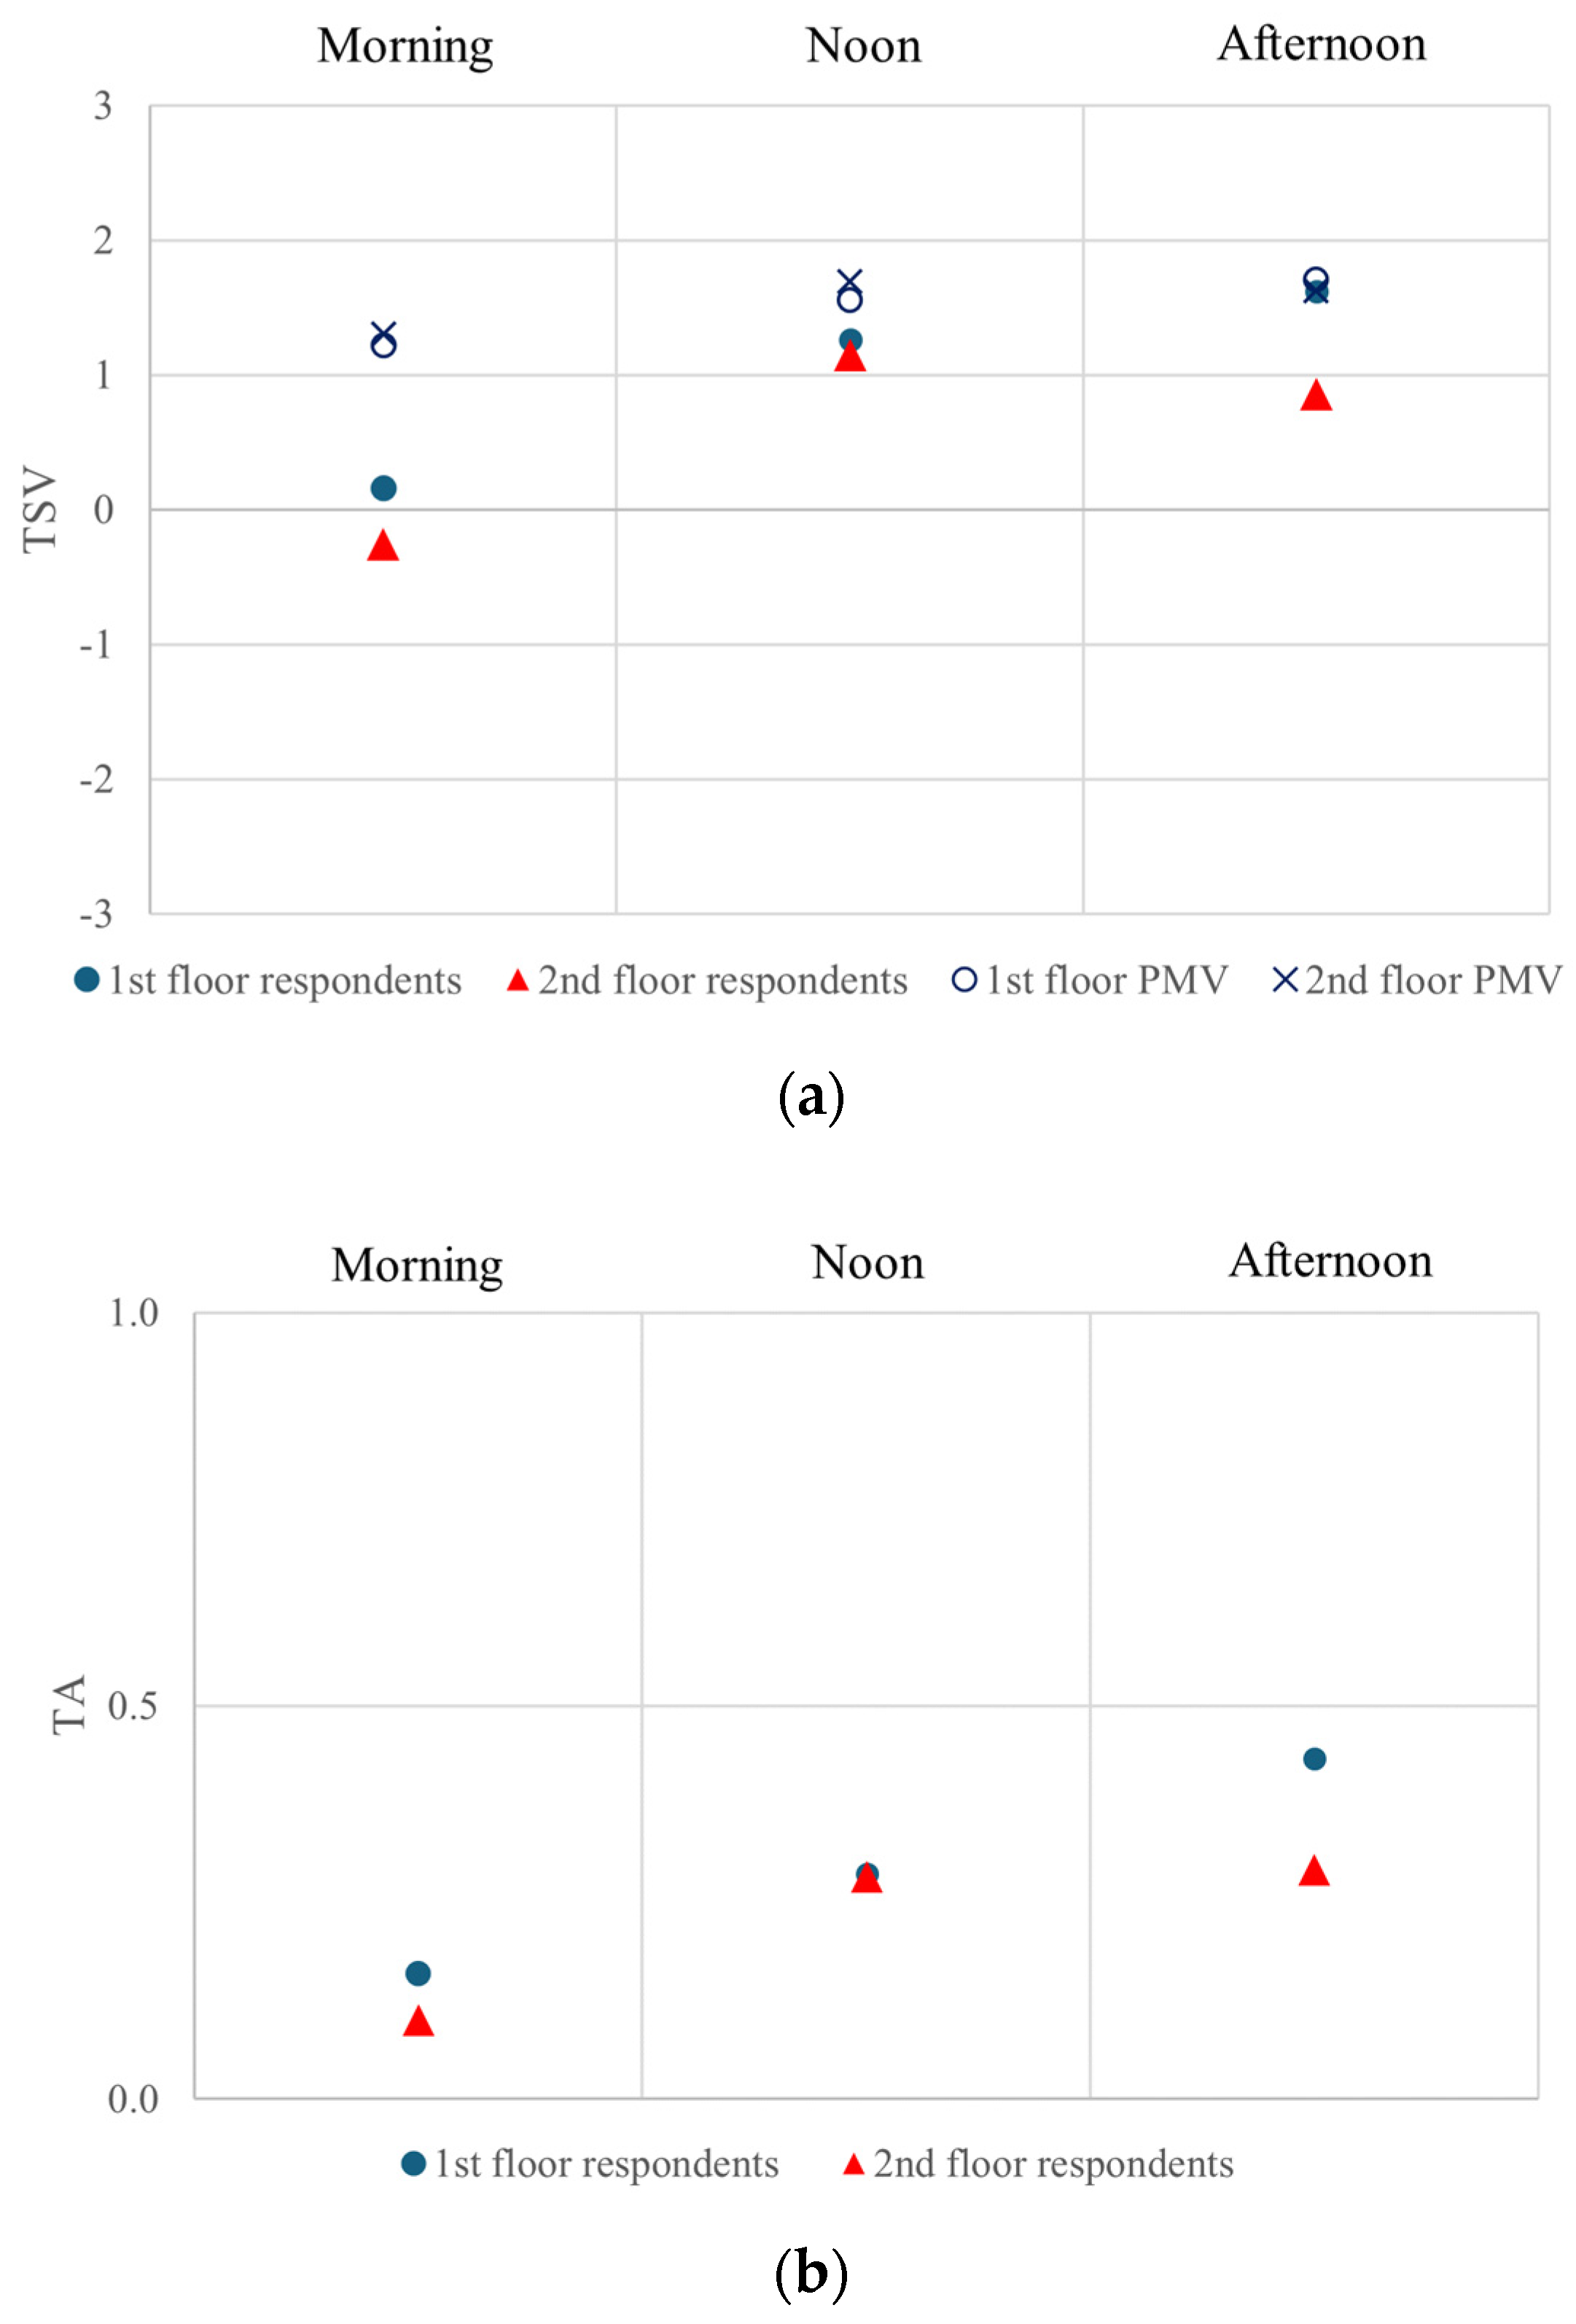
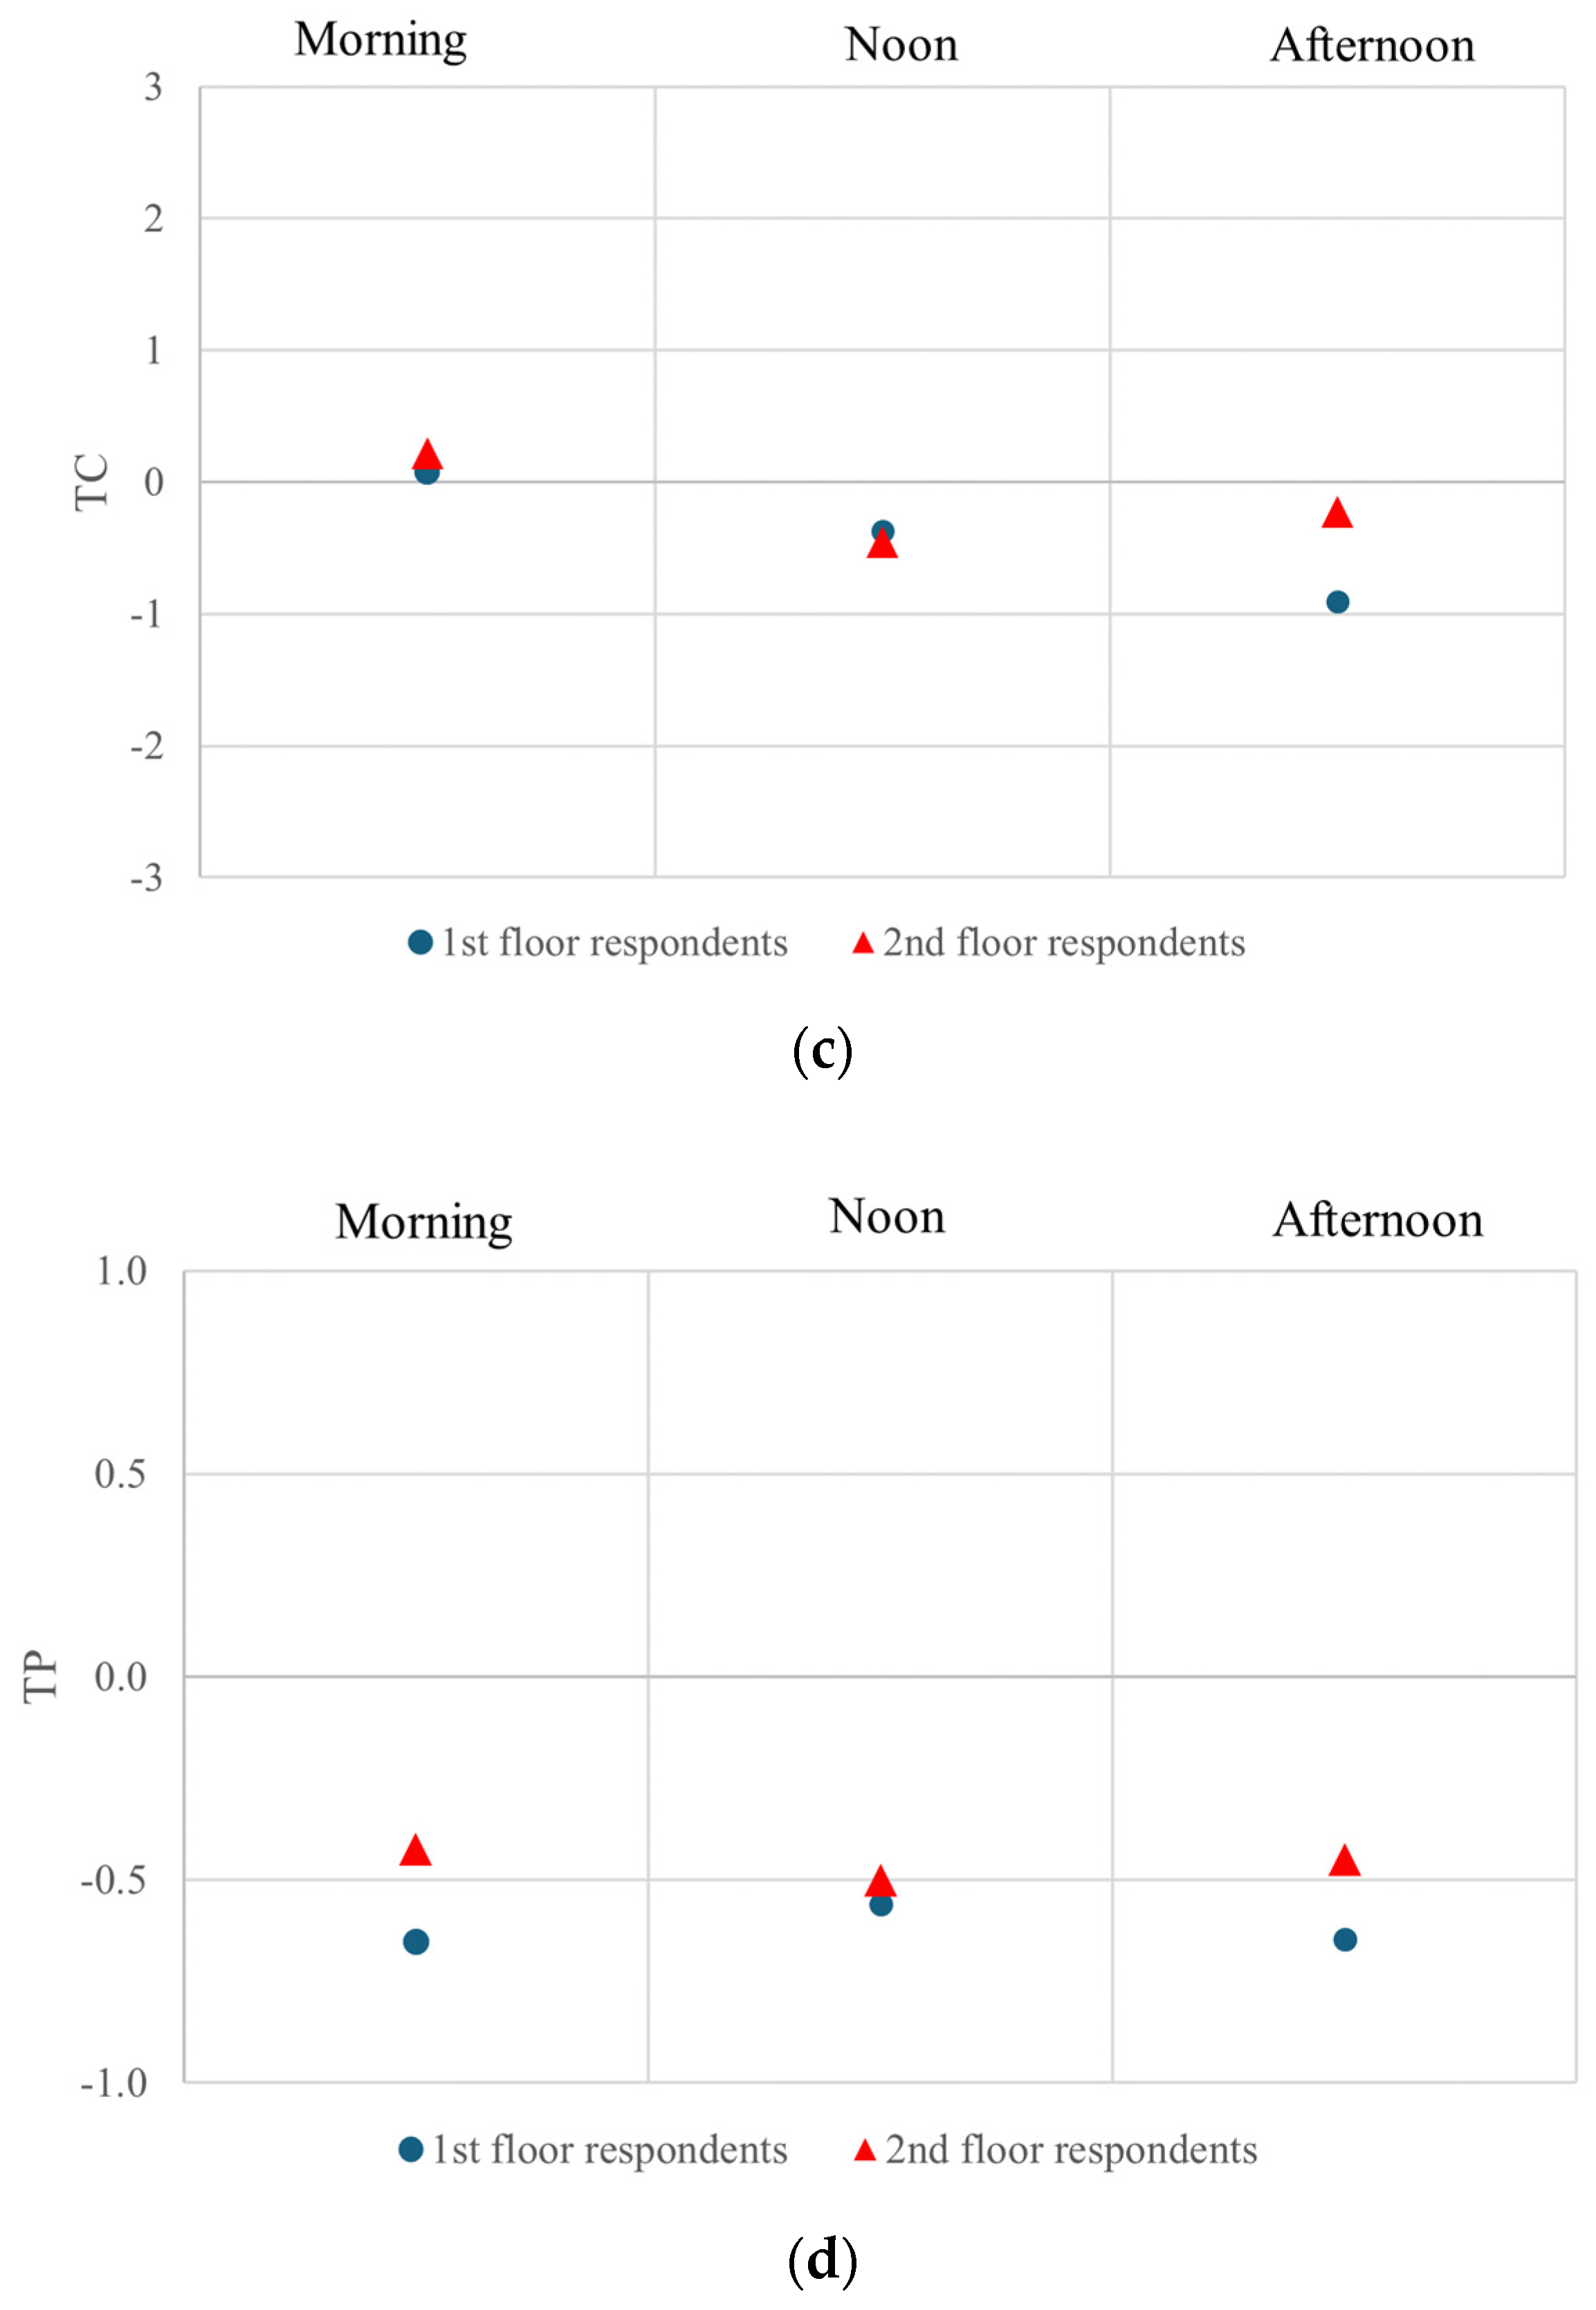
Subjective thermal comfort in this study was evaluated using TSV, TA, TC, and TP based on ASHRAE scales. A total of 810 data points were collected for this study. The mean value for each parameter on each floor can be seen in Figure 9. When compared, the TSV values for respondents on the first floor in the morning indicate a higher percentage feeling warm (39.34%) than for respondents on the second floor (30.84%). A similar pattern is observed at noon, where 78% of first-floor respondents tend to feel warm compared to 70.84% on the second floor. In the afternoon, 86.67% of respondents on the first floor also tend to feel warmer than those on the second floor (65.01%). Respondents on the first floor generally perceived the thermal condition to become hotter over time, in line with the increasing temperature (morning temperature: 27.48 °C; noon: 28.69 °C; afternoon: 29.06 °C). Meanwhile, respondents on the second floor felt that the thermal condition became warmer until noon but tended to feel cooler in the afternoon relative to their TSV at noon.
A total of 40.67% of respondents on the first floor reported feeling thermally uncomfortable in the morning, while 38.33% of those on the second floor felt the same. At noon, 54% of respondents on the first floor and 60% on the second floor tended to feel uncomfortable. In the afternoon, 71.33% of respondents on the first floor and 52.51% on the second floor reported feeling thermally uncomfortable. The number of respondents on the first floor who felt thermally uncomfortable continued to increase with the rise in average indoor air temperature. Although the majority of respondents on the second floor also tended to feel uncomfortable, their number decreased by 7.49%.
The TP values of respondents on both the first and second floors, whether it is in the morning, noon, or afternoon, show that the majority preferred a cooler temperature inside the classroom. In the morning, 70.67% of first-floor respondents and 52.5% of second-floor respondents preferred a cooler temperature. At noon, 64% of first-floor respondents and 58.33% of second-floor respondents expressed the same preference. In the afternoon, 74% of respondents on the first floor and 58.33% on the second floor preferred a cooler temperature. It can be observed that, on both floors, the number of respondents preferring a cooler temperature increased over time.
The TA values of respondents on both floors generally indicate that most participants could still tolerate the thermal environment. However, it can be observed that the number of respondents who could tolerate the thermal condition decreased as the indoor air temperature increased.
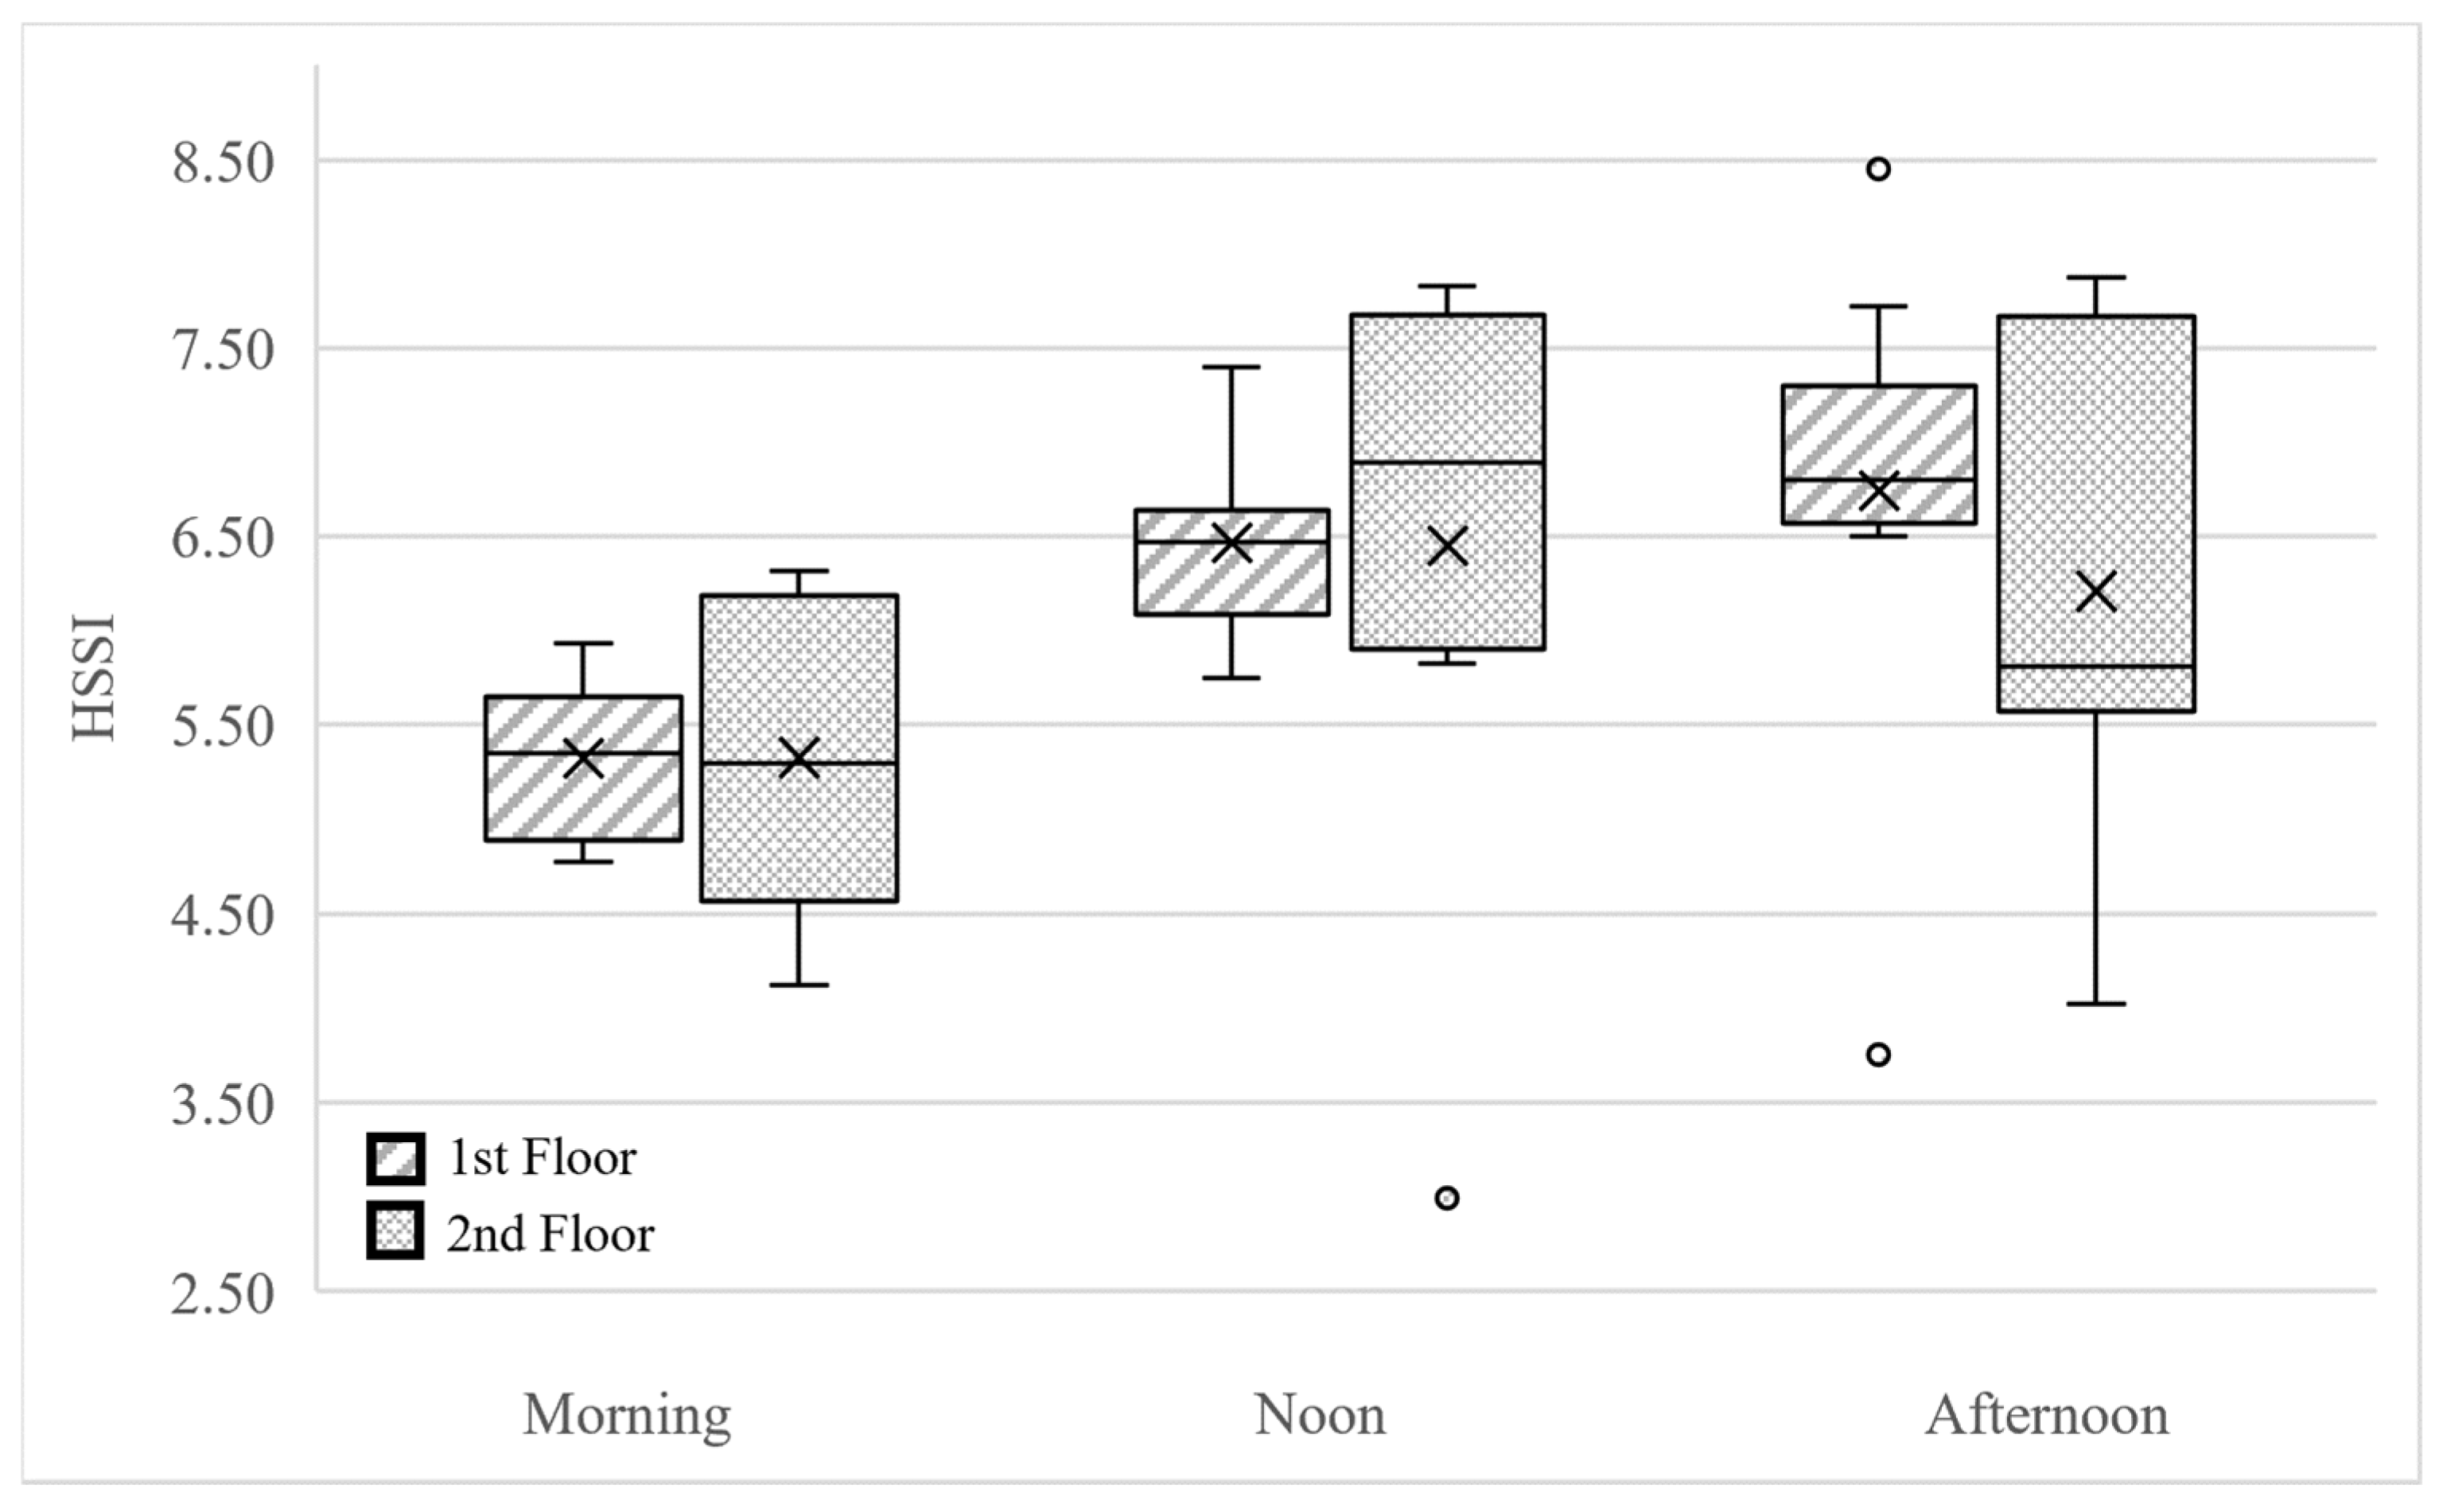
In addition to subjective thermal comfort responses, data on perceived heat strain levels were collected in this study. Perceived heat strain level data in this study were evaluated using HSSI questionnaires. The results can be seen in Figure 10. An HSSI final score below 13.5 indicates a very minimal or no risk of heat strain. Scores ranging from 13.6 to 18 suggest a potential risk of heat strain that may lead to heat-related illnesses (HRIs) and require immediate further assessment. Meanwhile, an HSSI score above 18 indicates a high likelihood of an ongoing HRI, necessitating prompt action to reduce the level of heat strain [21]. Analysis of variance (ANOVA) results show a significant difference in HSSI across times of day (F(2, 48) = 7.301; p < 0.05), but none was found between floors. Post hoc comparisons test indicated that HSSI at noon and in the afternoon was significantly higher than in the morning (p < 0.05). Thus, the finding shows that there was no potential risk of heat strain experienced by the classroom occupants during the study period. It can also be noted that the HSSI values for both floors showed an increasing trend, except for the occupants on the second floor in the afternoon.

3.3. Subjective Lighting Comfort

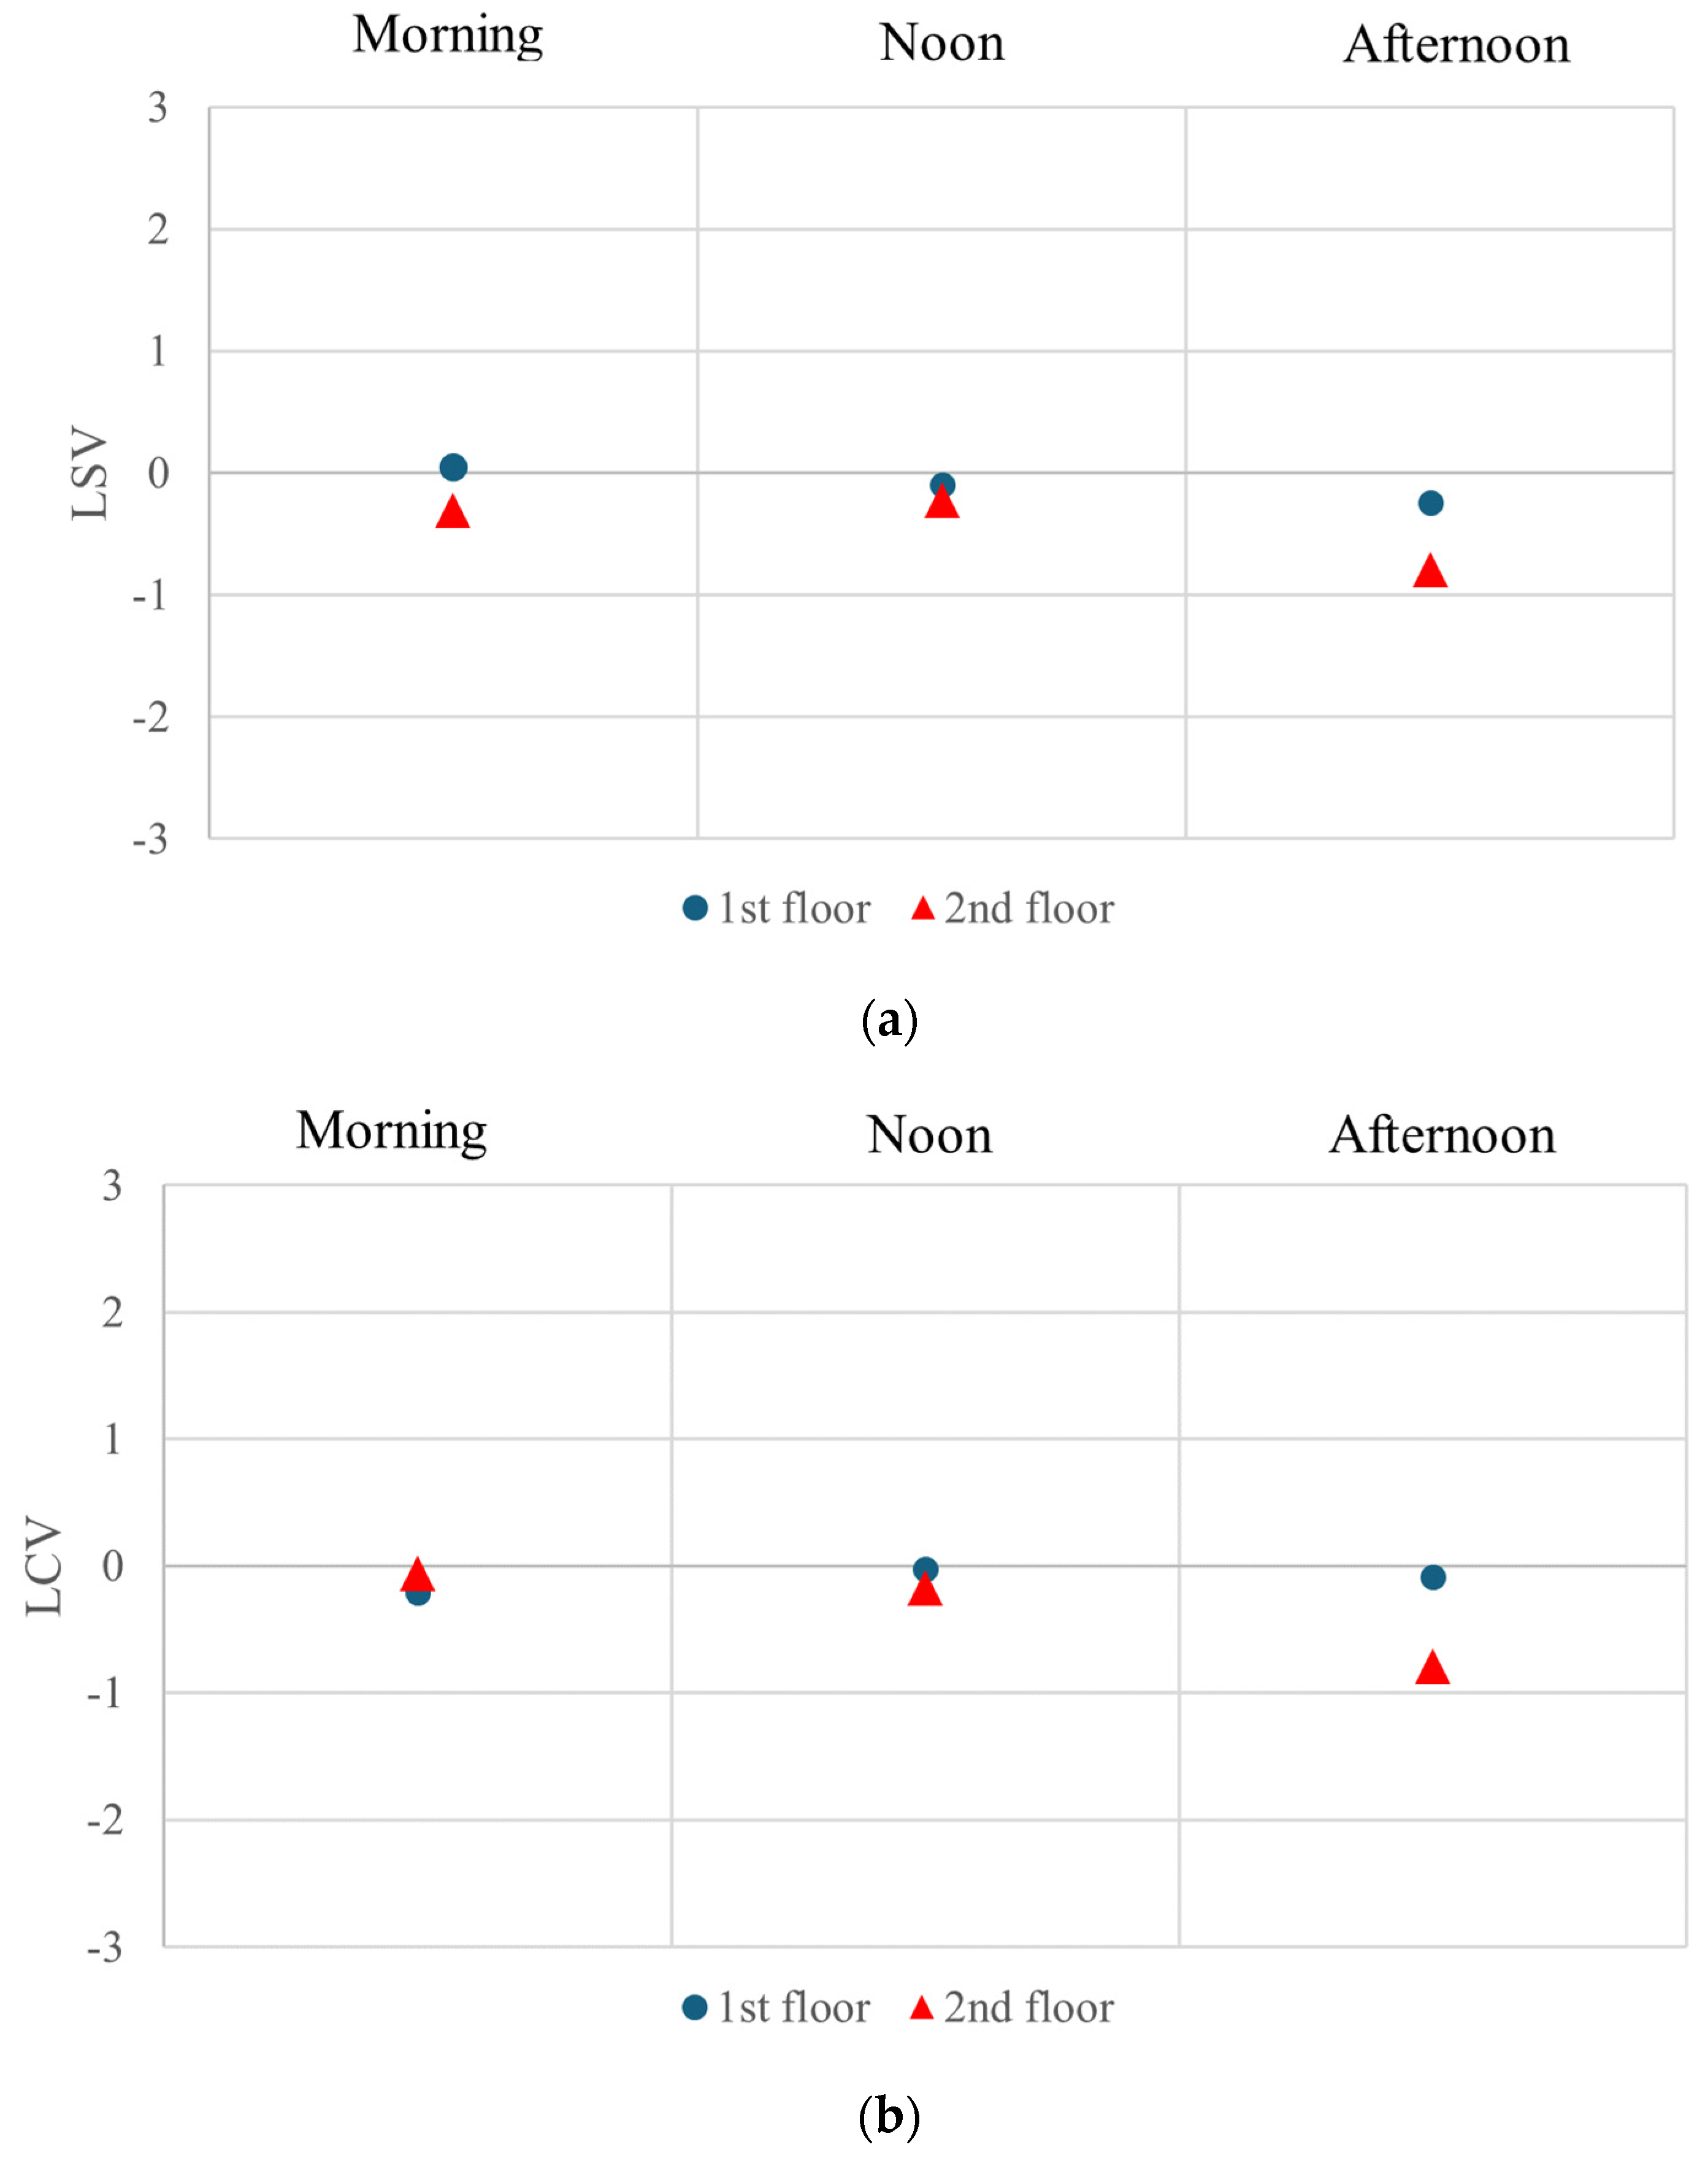
As shown in Figure 11, the analysis of subjective responses through the LSV and LCV questionnaires revealed that students on the second floor perceived the classroom as darker and less comfortable compared to those on the first floor. This contrasts with the measured illuminance results, which show that the second floor had higher light intensity. This perception mismatch may be attributed to visual adaptation, where occupants’ eyes adjust to dim environments and thus maintain a lower brightness perception even under increased illuminance [30]. Overall, both classrooms exhibited illuminance levels below the recommended standard, which likely contributed to reduced visual sensation and comfort among the respondents.

3.4. Learning Performance

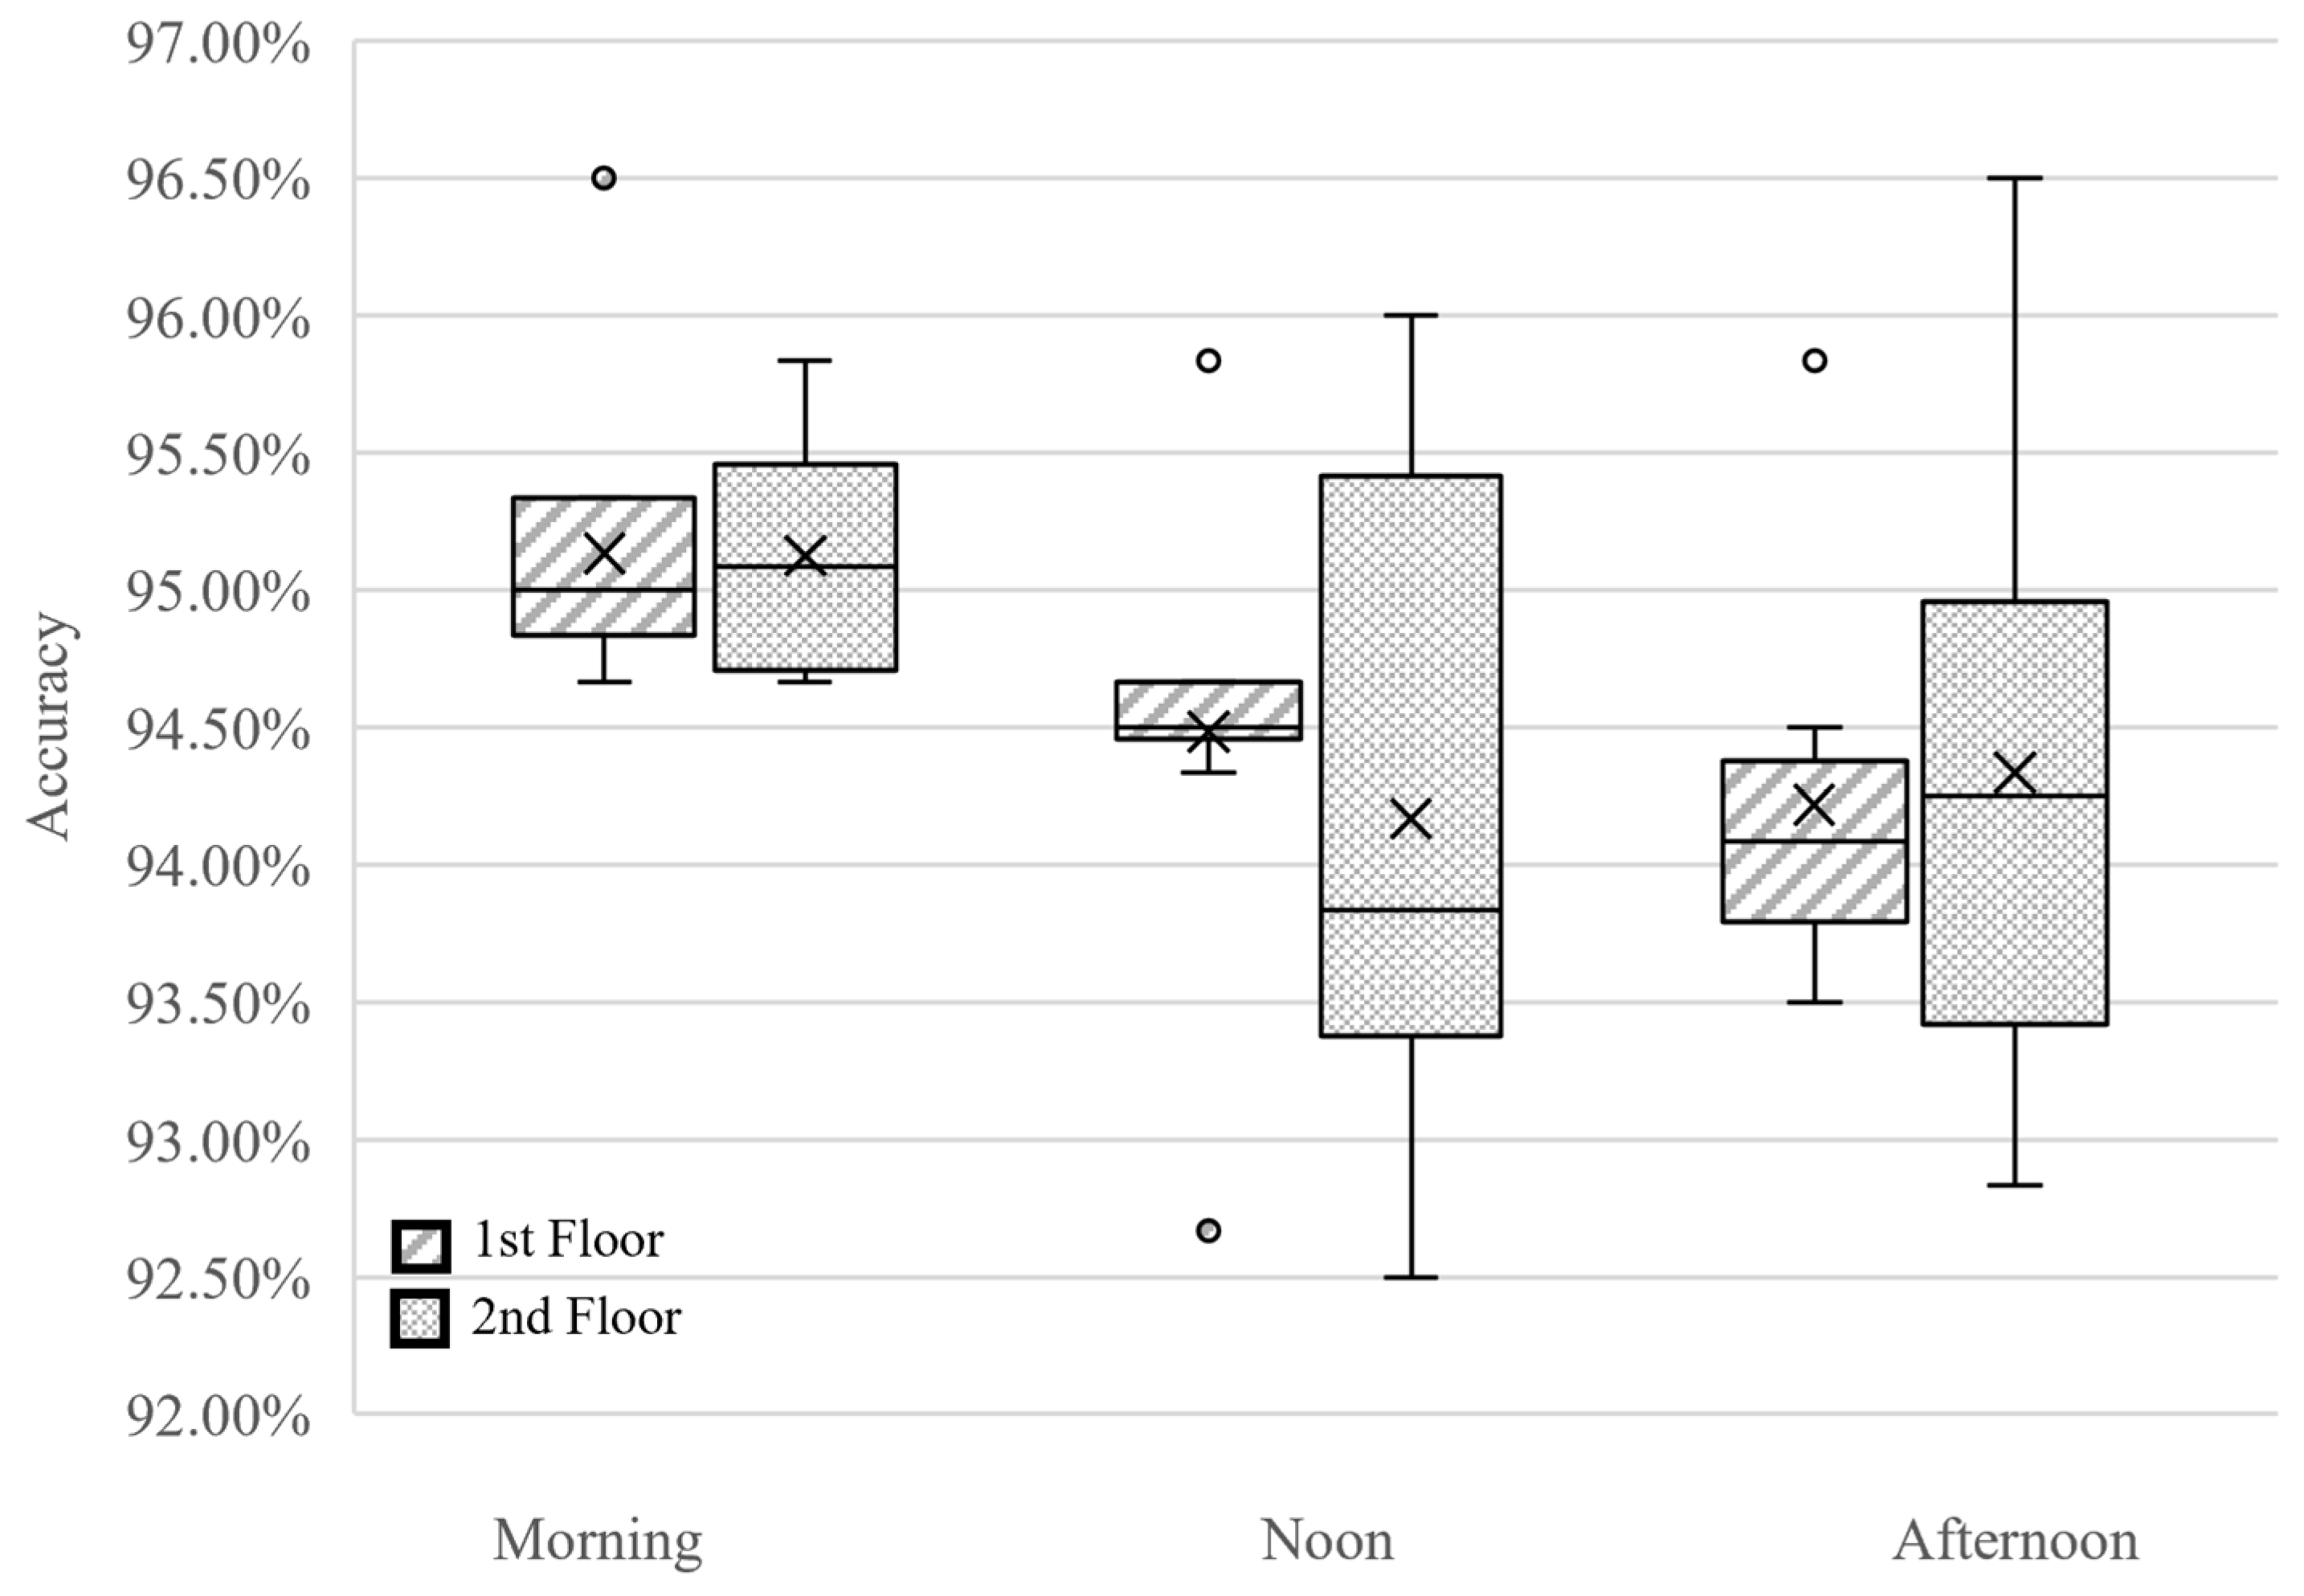
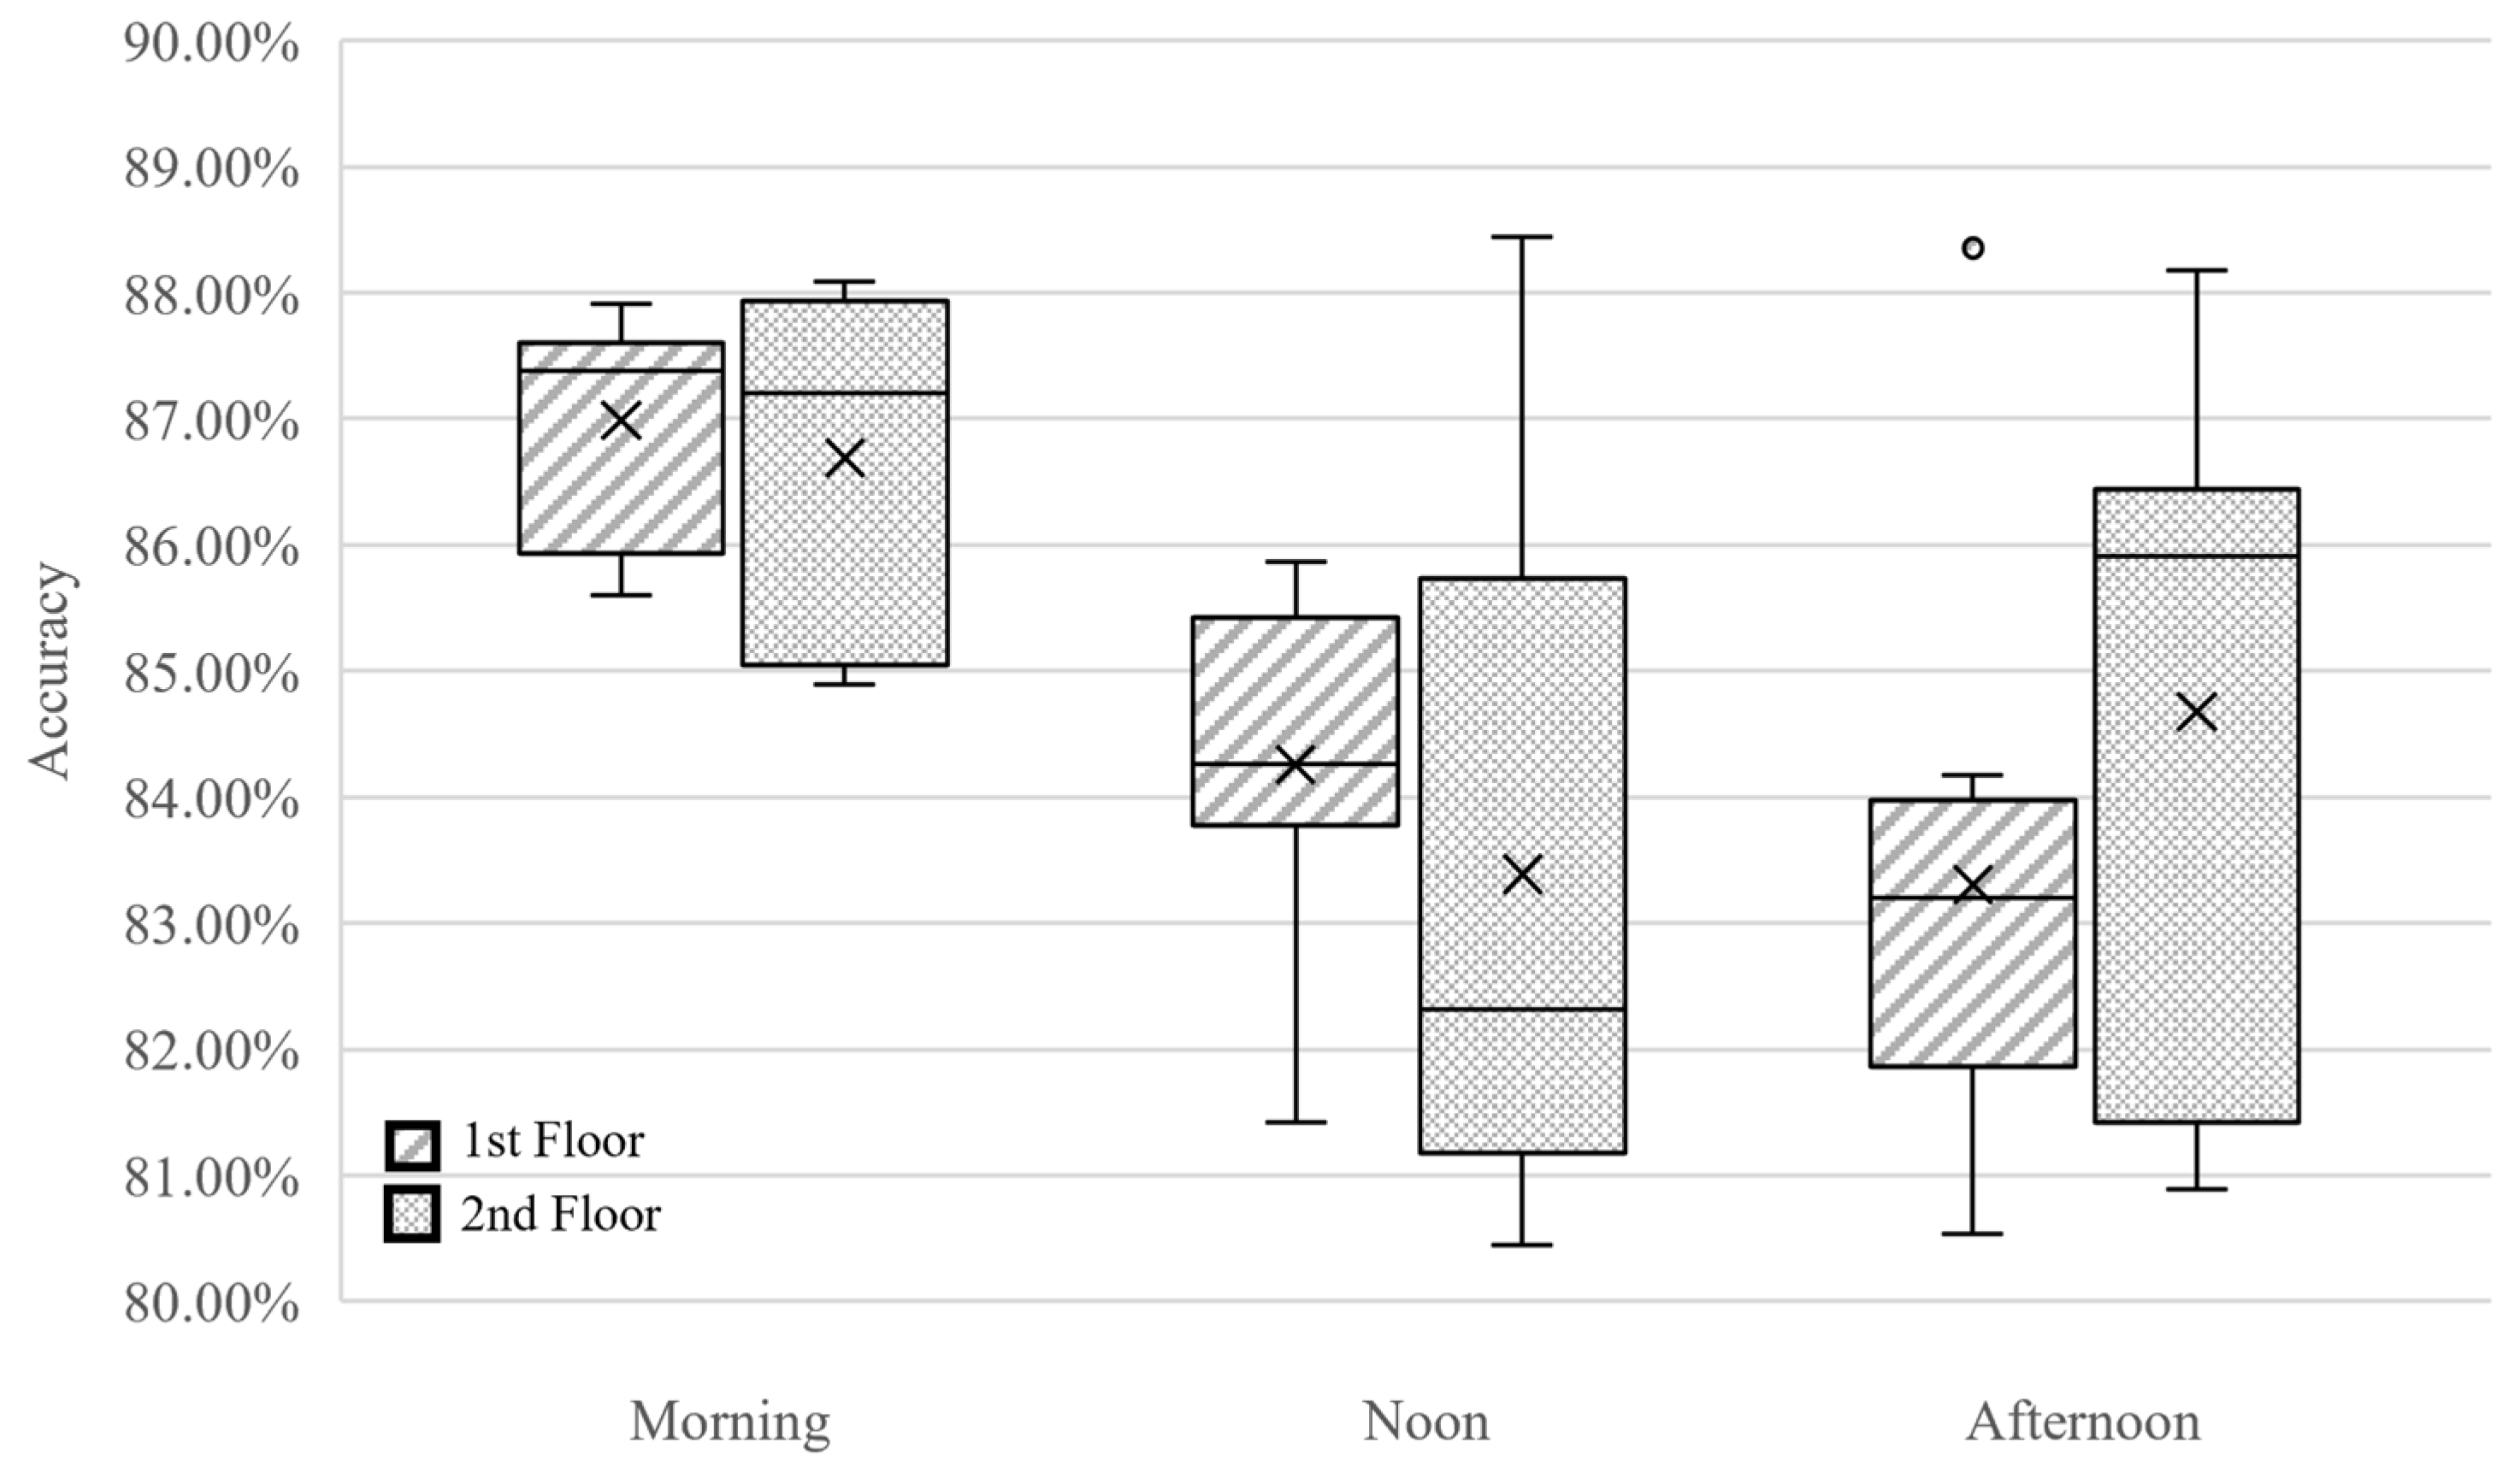
The learning performance evaluated in this study consisted of attention and working memory abilities, with the accuracy level used as the main performance parameter. A total of 810 data points were collected, with the measurement results of each learning performance parameter in each room shown in Figure 12 and Figure 13. For attention ability, accuracy in both classrooms declined as indoor temperature increased throughout the day. In the morning, both classrooms showed the highest level of attention, with an average accuracy of 95.13%. At noon, the first floor recorded a slightly higher accuracy (94.48%) compared to the second floor (94.17%). In the afternoon, attention accuracy was higher on the second floor (94.33%) than on the first floor (94.22%). However, the overall average showed that the first floor achieved a slightly higher accuracy (94.61%) than the second floor (94.54%).
The analysis of variance for attention performance indicated no significant differences between floors. In contrast, a significant effect of time of day was observed (F (2, 48) = 6.031, p < 0.05), suggesting that attention performance varied across different times of the day. Post hoc analysis further revealed that attention performance in the morning was significantly higher than during both noon and afternoon sessions (p < 0.05), while no significant difference was found between the noon and afternoon results. In addition to that, the working memory performance results show that the respondents’ average accuracy in the morning was the highest across the times of day at 86.99% and 86.69% for the first- and second-floor classrooms, respectively. Additionally, the first-floor classroom shows higher accuracy (84.26%) than the second floor (83.39%) at noon. However, the first-floor classroom shows lower accuracy (83.31%) than the second (84.68%) in the afternoon. The analysis of working memory performance revealed no significant differences between floors. In contrast, a significant effect of time of day was observed (F (2, 48) = 13.264, p < 0.001). Post hoc comparisons further showed that performance in the morning was significantly higher than in both noon and afternoon sessions (p < 0.001), whereas no significant difference was found between the noon and afternoon results. The classroom with higher air temperature and relative humidity, which also resulted in higher PMV values, showed lower attention and working memory ability. These results are supported by the correlation analysis presented in Table 3.
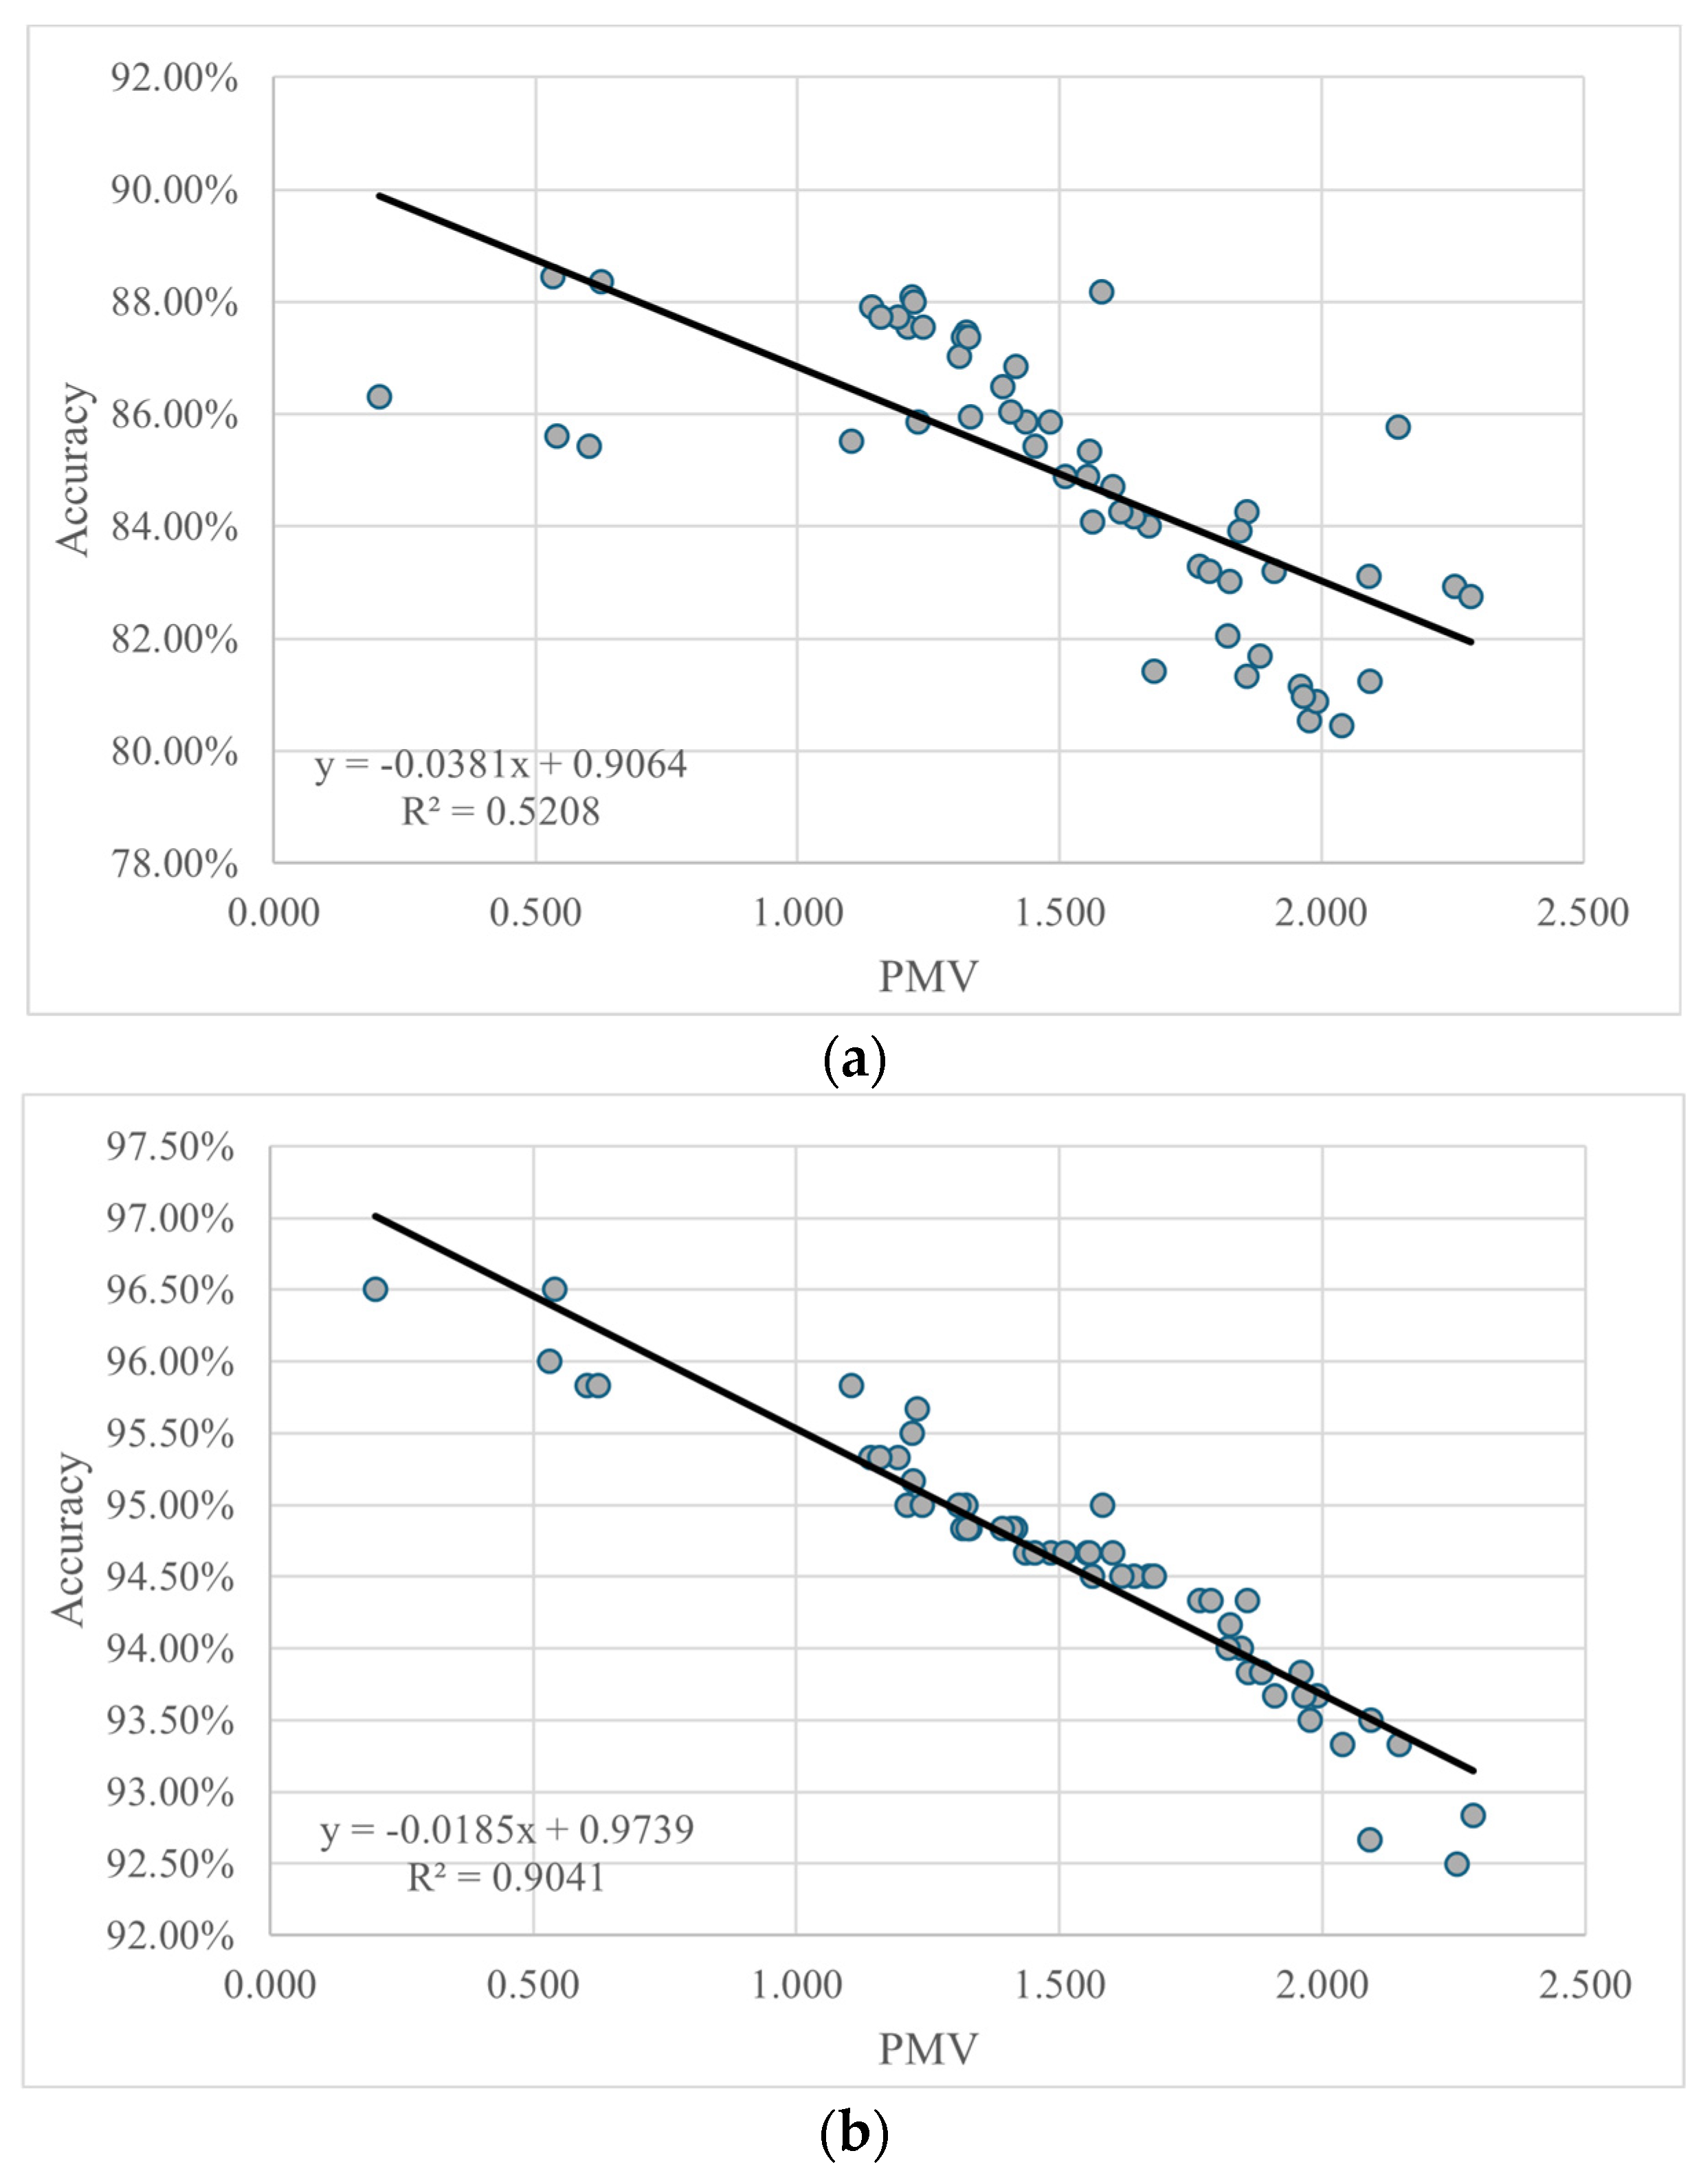
Figure 14 further illustrates the overall relationship between PMV and cognitive performance across all respondents. The regression plots demonstrate a consistent decline in both attention and working memory accuracy as PMV values increased. The negative regression trends indicate that warmer thermal conditions were associated with reduced cognitive accuracy, supporting the correlation analysis results presented in Figure 13. Compared to attention performance, working memory showed a steeper decline as PMV increased, suggesting that working memory may be more sensitive to thermal discomfort under classroom conditions.

4. Discussion

This study assessed the indoor environmental performance of a colonial-era educational building and examined its implications for occupant comfort and cognitive performance under current climatic conditions. The findings indicate that the environmental performance of the building under current climatic conditions may no longer fully reflect the effectiveness originally intended by its historical passive design strategies. The physical measurements provide strong evidence of this inadequacy. Both the classroom air temperature (Ta) and relative humidity (Rh) were considerably higher than the regulated thresholds for classroom environments. Additionally, although the building’s colonial design features such as high ceilings and large openings were originally intended to enhance natural ventilation, the measured air velocity (Va) remained low and did not approach the upper limit of the recommended range. This indicates that the existing passive ventilation system was insufficient to provide effective air circulation and convective heat removal. As a result, the average PMV values on the first and second floors classified both classrooms as thermally warm, falling outside the recommended comfort range. Furthermore, the PPD values were extremely high, suggesting that more than half of the occupants were likely to feel thermally dissatisfied.
The objective thermal assessments were further validated by the students’ subjective responses. Most respondents perceived the indoor environment as warm and reported feeling uncomfortable. This discomfort intensified throughout the day, corresponding to the gradual increase in indoor temperature. Consequently, many students expressed a preference for a cooler indoor environment. Similar results were found in previous studies. A study examining the influence of environmental conditions on students’ thermal comfort in three primary schools in Brazil [31] reported that at the first school, with an average temperature of 26.79 °C, most respondents (31.25%) felt thermally neutral. In the second school, where the average temperature was 26.49 °C, most respondents (38.65%) reported feeling slightly cool. Meanwhile, at the third school, with a slightly higher average temperature of 26.9 °C, most respondents (33.46%) also reported feeling neutral. Interestingly, although most students still considered the classroom conditions tolerable, their acceptance declined as temperatures continued to rise. Similarly, a study conducted in an underground railway station in China reported that 91.69% of respondents found the thermal environment acceptable at a temperature of 25 °C, 86.46% at 27 °C, and 70.10% at 29 °C [22]. This difference between discomfort and tolerance suggests a notable degree of thermal acclimatization among students accustomed to warm–humid climates. These responses further reinforce the building’s limitations in maintaining acceptable indoor environmental performance during classroom occupancy.
However, such adaptation does not necessarily imply the absence of physiological strain or cognitive consequences. The statistical analysis revealed a strong and significant negative relationship between PMV and HSSI and students’ cognitive performance, specifically in attention and working memory. This finding indicates that warmer thermal conditions and higher perceived heat strain were associated with lower cognitive accuracy. The correlation analysis showed that higher PMV and HSSI values were associated with lower attention and working memory scores, supporting previous evidence that thermal discomfort is associated with poorer concentration and short-term information processing. These results are consistent with previous studies reporting that thermal discomfort and physiological heat stress can reduce cognitive performance. This finding is consistent with previous research, which reported that working memory performance increases as thermal conditions approach the neutral range (−0.5 < PMV < 0.5), with the highest working memory accuracy observed at PMV 0 (p < 0.05) [32]. Another study found that working memory performance decreases with rising air temperature and humidity within the range of 26.88 °C to 31.92 °C [33]. The strong correlations observed in this study suggest that even mild heat strain in classroom environments may be associated with poorer short-term cognitive performance.
As a secondary environmental parameter, lighting conditions analysis showed a positive but statistically insignificant relationship with cognitive performance. Although higher illuminance tended to correspond with slightly better attention and memory accuracy, the effect was too weak to reach statistical significance. This finding differs from [15] which has reported a statistically significant effect of illuminance on both attention and working memory ability. This may be due to the measured illuminance levels at the representative measurement points in both classrooms, which limited the variation necessary to detect an effect, or because the influence of thermal discomfort dominated the contribution of lighting. Although illuminance was not significantly associated with attention or working memory performance in the present study, this finding should be interpreted with caution. The relatively limited range of illuminance levels observed across the classrooms may have reduced the statistical variability required to detect meaningful relationships. Therefore, the absence of statistical significance should not be interpreted as evidence that lighting has no influence on cognitive performance. Rather, it indicates that no measurable association was detected within the range of lighting conditions observed during this field study. Previous studies have reported that inadequate daylighting or low illuminance may negatively influence attention, alertness, and learning performance. However, these effects are often observed under broader variations in lighting conditions than those encountered in the present study [34,35].
Future studies should therefore include classrooms with a wider range of lighting conditions or implement controlled illumination interventions to isolate the effect of light on cognition under tropical conditions. In addition, this study has several limitations. First, it was conducted in a single colonial school building with a relatively small sample size, which may limit the generalizability of the findings to other building types, climatic contexts, or occupant populations. Second, the observational field design allows the identification of statistical associations rather than causal relationships between indoor environmental conditions and cognitive performance. Finally, the 18-day observation period may not fully capture seasonal variations in indoor environmental conditions. Future studies involving multiple buildings, larger participant samples, and longer observation periods are recommended to strengthen the generalizability of the findings.
The lack of statistical significance between illuminance and cognitive performance may be further explained by the occupants’ subjective perceptions. Based on the Lighting Sensation Vote (LSV) and Lighting Comfort Vote (LCV), the lighting conditions in the colonial building of SMA Negeri 1 Semarang were generally perceived as neutral to slightly bright, despite the recorded intensity being relatively low. In the morning, respondents on the first floor reported a slightly brighter sensation (+1) at 28.966 lux, while the second-floor majority remained neutral (0) at 33.869 lux. Interestingly, a temporal divergence was observed where first-floor occupants reported a decreasing sensation of brightness toward the evening, while those on the second floor felt the environment became increasingly bright as the day progressed. This finding presents a notable contrast with prior research in subway environments, where significant portions of respondents perceived the environment as dark even at much higher illuminance (100–300 lux) [22]. This suggests that the building’s specific architectural features or the occupants’ adaptation to natural light may lower the threshold for neutral brightness sensations.
Furthermore, the Lighting Comfort Vote (LCV) data indicates that comfort levels did not consistently align with higher illuminance. On the first floor, comfort significantly declined throughout the day, with slight discomfort (−1) peaking in the evening at 46.67%. Conversely, the second floor exhibited an inverse trend, where comfort peaked during midday and the percentage of uncomfortable occupants gradually decreased toward the afternoon. This suggests that the optimal lighting comfort for the first floor is achieved in the morning, while the second floor reaches its peak comfort during midday. The prevalence of neutral to uncomfortable votes at these low illuminance levels might explain why lighting did not serve as a strong catalyst for cognitive improvement. Although the lighting sensation was adequate for basic tasks, the physiological comfort remained insufficient to significantly boost mental performance.
These constraints may reduce the generalizability of the results and highlight the need for larger-scale and longitudinal studies to confirm the observed relationships between thermal comfort, lighting, and cognitive performance. Furthermore, the HSSI measurements in this field study did not include quantitative assessments of participants’ physiological responses. Therefore, future studies should incorporate quantitative physiological measurements to capture the phenomenon more objectively and strengthen the interpretation of heat strain effects on learning performance.
From a building engineering perspective, the findings highlight the need for adaptive retrofitting strategies in colonial educational buildings operating in tropical climates. While preserving historical architectural identity remains important, passive design systems may require enhancement to maintain acceptable indoor environmental quality under future climate conditions. Potential interventions include improving cross-ventilation effectiveness, integrating hybrid ventilation systems, optimizing shading strategies, reducing internal heat accumulation, and improving daylight distribution without increasing solar heat gain. Such interventions may help preserve the functional relevance of colonial educational buildings while improving occupant comfort and cognitive performance.

5. Conclusions

This research found that a colonial-era school building demonstrates limited capability in maintaining acceptable indoor environmental conditions under current climatic conditions to support effective learning. Findings suggest a decline in the effectiveness of the building’s passive environmental control strategies. Both objective measurements and students’ subjective perceptions consistently indicated thermal discomfort and inadequate illumination levels. Although no direct heat strain risks were detected, the observed rise in HSSI values alongside increasing PMV points to accumulating physiological stress under warmer indoor conditions. Statistical analysis further revealed significant negative correlations between PMV, HSSI, and students’ cognitive performance, particularly in attention and working memory, showing that higher thermal discomfort and perceived heat strain were significantly associated with lower cognitive accuracy. In contrast, lighting conditions showed a positive but nonsignificant effect on cognitive outcomes, likely due to the measured illuminance levels at the representative measurement point across both classrooms.
In summary, the findings highlight that even moderate but continuous heat exposure in tropical learning environments may contribute to poorer learning performance. While the findings highlight the importance of maintaining appropriate indoor thermal conditions, learning performance is also influenced by multiple physiological, psychological, and educational factors. Therefore, improving classroom environmental quality should be considered as one component of a broader strategy to support students’ academic performance. The results also highlight the need to re-evaluate passive environmental control performance in existing colonial educational buildings and consider adaptive improvement strategies to maintain acceptable indoor environmental quality. Future research should incorporate quantitative physiological indicators and controlled lighting experiments to better understand these interactions. Expanding the study to include a larger sample size, longer observation period, and diverse building types would also improve the generalizability and robustness of the conclusions.

Author Contributions

Conceptualization, W.B. and H.P.; methodology, W.B. and M.A.H.; software, M.A.H.; validation, W.B., H.P. and N.S.R.; formal analysis, W.B. and M.A.H.; investigation, M.A.H. and N.S.R.; resources, W.B. and H.P.; data curation, M.A.H. and N.S.R.; writing for original draft preparation, M.A.H. and N.S.R.; writing for review and editing, W.B. and H.P.; visualization, M.A.H.; supervision, W.B. and H.P.; project administration, W.B.; funding acquisition, W.B. All authors have read and agreed to the published version of the manuscript.

Funding

This research was funded by Universitas Diponegoro through the International Research Publication research scheme, grant number 306-445/UN7.D2/PP/V/2026.

Institutional Review Board Statement

The study was conducted in accordance with the Declaration of Helsinki and approved by the Health Research Ethics Committee, Faculty of Public Health, Universitas Diponegoro (Ethics Code: 76/EA/KEPK-FKM/2025, Approval Date 30 January 2025).

Informed Consent Statement

Informed consent was obtained from all subjects involved in the study and from their legal guardians where required.

Data Availability Statement

The datasets generated and analyzed during the current study are available from the corresponding author upon reasonable request. Data are not publicly available due to ethical considerations and participant privacy protection.

Acknowledgments

The authors would like to express their sincere gratitude to the participating school, teachers, and students for their valuable cooperation and participation throughout this study. The authors also acknowledge the support provided by the Faculty of Engineering, Universitas Diponegoro. The authors are grateful to all individuals who contributed to the successful completion of this research. During the preparation of this manuscript, the authors used ChatGPT (OpenAI, GPT-5.5) and Grammarly to assist with language editing, sentence structure, and academic writing style. The AI tool was not used to generate research data, perform statistical analyses, or draw scientific conclusions. All outputs were critically reviewed, revised, and verified by the authors, who take full responsibility for the content of this publication.

Conflicts of Interest

The authors declare no conflicts of interest.

Abbreviations

The following abbreviations are used in this manuscript:
PMVPredicted Mean Vote
PPDPredicted Percentage of Dissatisfied
HSSIHeat Strain Score Index
ASHRAEAmerican Society of Heating, Refrigerating and Air-Conditioning Engineers
TaAir temperature
VaAir velocity
TMRTMean radiant temperature
TSVThermal Sensation Vote
TCThermal Comfort
TAThermal Acceptability
TPThermal Preference
LCVLighting Comfort Vote
LSVLighting Sensation Vote

Appendix A

Appendix A.1. Scale of Heat Strain Score Index (HSSI)

Appendix A.1.1. Instruction for Use of Heat Strain Score Index

  • Mark each question based on the subject and your observation of the appropriate condition
  • When completed, for each question, write your score in the “primary score” column in Total Scores Calculation Sheet
  • Primary Score: each question is multiplied by the effect coefficient and the final score is recorded
  • Add the final scores of the Calculation Sheet for the total score result

Appendix A.1.2. Questions

  • Q1—How do you feel about your workplace air temperature?
Very cold (−3)
Cold (−2)
Slightly Cool (−1)
Normal (0)
Slightly warm (1)
Warm (2)
Very warm (3)
  • Q2—How do you feel about the humidity level of your workplace?
Dry (a feeling of dryness in the mouth and throat) (−2)
Appropriate and desirable (0)
Wet skin (1)
Clothes sticking to the skin surface (2)
Fully wet skin (3)
Sweat loss from the skin surface (4)
  • Q3—How do you feel about the temperature of adjacent surfaces due to the contact with your hands?
I feel too cold (−3)
I feel cold (−2)
I feel cool (−1)
I do not feel cold or hot (0)
I feel hot (1)
Their heat cannot be tolerable (2)
If my skin is in touch with them, I will be burnt (3)
  • Q4—How do you feel about the flow of air in your workplace?
Cold weather circulation exists (−3)
Cold weather current exists (−2)
Gentle stream of pleasing air (−1)
Sense of stability in the gentle flow of air or warm air (1)
Moderate flow of warm air (2)
Extreme current of hot weather (3)
  • Q5—While you are working, the intensity of physical activity you do is like which of the following conditions?
Architecture 06 00119 i001
  • Q6—How much is the amount of sweating throughout your workday?
I do not feel like sweating (0)
I feel the sweat on my armpit and inguinal (1)
I feel the sweat on my chest and back (2)
Sweating is so severe that my underwear gets wet (3)
Sweating is so severe that I feel it on my face (4)
Sweating is so severe that it is flowing all over my body (5)
  • Q7—How fatigued are you at work?
I’m not tired at all (0)
I’m a little tired (1)
I’m tired (2)
I’m exhausted (3)
I’m so exhausted that I desire to have a break (4)
  • Q8—How strong is the intensity of your thirst when you are at work?
I don’t get thirsty (0)
I get a little thirsty (1)
I get thirsty (2)
I get very thirsty (3)
I get so thirsty that my mouth and throat get dry and they can’t be wet with saliva (4)
  • Q9—How much are you suffering from heat?
I’m not annoyed (0)
I’m a little annoyed (1)
I’m annoyed (2)
I’m very annoyed (3)
I’m so annoyed that I want to quit my job posts (4)
  • Q10—How do you feel about the size of your working space within the building?
Spacious (0)
Appropriate common space (1)
Limited cramped space (2)
  • Q11—How is the ventilation system in your workplace?
Active and high ventilation (−1)
Appropriate ventilation, ventilation is not needed (0)
Inadequate ventilation (1)
Despite the lack of air conditioning, there is no ventilation (2)
  • Q12—In which environments below are you doing your own tasks now?
Outdoors (0)
Indoor (2)
Both (1)
  • Q13—What kind of clothes do you use while you work out?
T-shirts and jeans (no work clothing) (0)
Normal work clothing (underwear+ shirts and pants) (1)
Full suits (underwear+ work clothing coverall) (2)
Heavy or wool clothing or winter work clothing (underwear + double cloth coveralls) (3)
Water-proof clothing (chemical protective clothing, wind visor, leather) (5)
Fully enclosed suit with hood and gloves (7)
  • Q14—What color is your work clothing?
Light colors (e.g., white, cream, yellow, light blue, orange, etc.) (0)
Dark colors (e.g., black, dark brown, dark red and dark blue) (1)
  • Q15—What material is your work clothing made of?
Cotton (1)
Cotton and synthetic fibers (2)
Fireproof and water proof (3)
  • Q16—During work, which equipment do you use including the following personal protection equipment?
Self-contained breathing apparatus (2)
Full-face respirator (1.5)
Half-face respirator (1)
Water-proof boot (1)
Leather apron (1)
Anti-dust mask (0.5)
Face shield (0.5)
Non-cotton glove (0.5)
Helmet (0.5)
Ear muff (0.5)
  • Q17—What is your most often body posture when you are at work?
Usually sitting (1)
Usually standing with low mobility (2)
Standing with high mobility (3)
I am usually walking (4)
  • Q18—Which of the following symptoms do you have while you are working?

Mild headache (0.5)
Dizziness (0.5)
Weakness (0.5)
Muscle pain (0.5)
Red acne appearance (0.5)
Lower concentration (0.5)
None (0)
Table A1. Calculation of heat strain score index total scores calculation sheet.
Number of QuestionsPrimary ScoreEffect CoefficientFinal Score
Q1 0.73
Q2 0.67
Q3 0.65
Q4 0.61
Q5 0.63
Q6 0.67
Q7 0.57
Q8 0.84
Q9 0.81
Q10 0.28
Q11 0.68
Q12 0.31
Q13 0.36
Q14 0.29
Q15 0.33
Q16 0.50
Q17 0.37
Q18 0.57
Total Score

Appendix A.1.3. Evaluation Result

  • A total score which is less than 13.5 indicates that the person has no or low heat strain (Green Zone or safe level).
  • A total score between 13.6 and 18 indicates that there is a potential of heat-induced illnesses occurring and further evaluation of heat stress is needed (Yellow Zone or alarm level).
  • A total score greater than 18 indicates that heat-induced illnesses are very likely and appropriate control measures should be taken as soon as possible to reduce heat strain (Red Zone or danger level).

References

  1. Mahabella, L.S.; Abduh, M. Kenyamanan Termal Bangunan Rumah Tinggal Kolonial di Sekitar Alun-Alun Merdeka Kota Malang. In (SENTRA) Seminar Nasional Teknologi dan Rekayasa; Universitas Muhammadiyah Malang: Malang, Indonesia, 2019; pp. 82–89. [Google Scholar]
  2. Purwanto, L.M.F. Kota Kolonial Lama Semarang (Tinjauan Umum Sejarah Perkembangan Arsitektur Kota). Dimens. Tek. Arsit. 2005, 33, 27–33. [Google Scholar]
  3. Rahmah, C.N.; Munir, A.; Fuady, M. Colonial Building Design Strategies for Tropical Climates (Case Study at SMPN 1 Lhokseumawe). Idealogy J. 2024, 9, 385–393. [Google Scholar] [CrossRef]
  4. BMKG. Analisis Laju Perubahan Suhu Udara Rata-Rata Tahunan. Available online: https://www.bmkg.go.id/iklim/ (accessed on 16 November 2024).
  5. Hersbach, H.; Bell, B.; Berrisford, P.; Biavati, G.; Horányi, A.; Muñoz Sabater, J.; Nicolas, J.; Peubey, C.; Radu, R.; Rozum, I.; et al. “ERA5 Monthly Averaged Data on Single Levels from 1940 to Present,” Copernicus Climate Change Service (C3S) Climate Data Store (CDS). Available online: https://cds.climate.copernicus.eu/datasets/reanalysis-era5-single-levels-monthly-means?tab=overview (accessed on 25 June 2026).
  6. Lan, L.; Tang, J.; Wargocki, P.; Wyon, D.P.; Lian, Z. Cognitive performance was reduced by higher air temperature even when thermal comfort was maintained over the 24–28 °C range. Indoor Air 2022, 32, e12916. [Google Scholar] [CrossRef] [PubMed]
  7. Dasgupta, S.; Singh, P.; Manchanda, S.; Natarajan, S.; Alnuaimi, A. Field Studies of Thermal Comfort in Heritage Hotel Buildings in warm humid climate of India. In Comfort at The Extremes 2023: The Book of Proceedings; CEPT University Press: Ahmedabad, India, 2024. [Google Scholar] [CrossRef]
  8. Maknun, J. Adaptive thermal comfort in colonial building classrooms. IOP Conf. Ser. Mater. Sci. Eng. 2021, 1098, 022043. [Google Scholar] [CrossRef]
  9. Wang, C.; Zhang, F.; Wang, J.; Doyle, J.K.; Hancock, P.A.; Mak, C.M.; Liu, S. How indoor environmental quality affects occupants’ cognitive functions: A systematic review. Build. Environ. 2021, 193, 107647. [Google Scholar] [CrossRef]
  10. Li, S.; Zhang, X.; Li, Y.; Gao, W.; Xiao, F.; Xu, Y. A comprehensive review of impact assessment of indoor thermal environment on work and cognitive performance—Combined physiological measurements and machine learning. J. Build. Eng. 2023, 71, 106417. [Google Scholar] [CrossRef]
  11. Branaghan, R.J.; Lafko, S. Cognitive ergonomics. In Clinical Engineering Handbook; Elsevier: Amsterdam, The Netherlands, 2020; pp. 847–851. [Google Scholar] [CrossRef]
  12. Liang, Y.; Yu, J.; Xu, R.; Zhang, J.; Zhou, X.; Luo, M. Correlating working performance with thermal comfort, emotion, and fatigue evaluations through on-site study in office buildings. Build. Environ. 2024, 265, 111960. [Google Scholar] [CrossRef]
  13. Cowan, N. Working Memory Underpins Cognitive Development, Learning, and Education. Educ. Psychol. Rev. 2014, 26, 197–223. [Google Scholar] [CrossRef] [PubMed]
  14. Choi, Y.; Kim, M.; Chun, C. Effect of temperature on attention ability based on electroencephalogram measurements. Build. Environ. 2019, 147, 299–304. [Google Scholar] [CrossRef]
  15. Pradhan, S.; Jang, Y.; Chauhan, H. Investigating effects of indoor temperature and lighting on university students’ learning performance considering sensation, comfort, and physiological responses. Build. Environ. 2024, 253, 111346. [Google Scholar] [CrossRef]
  16. Stubblefield, Z.M.; Cleary, M.A.; Garvey, S.E.; Eberman, L.E. Effects of Active Hyperthermia on Cognitive Performance. In Proceedings of the Fifth Annual College of Education Research Conference: Section on Allied Health Professions; Florida International University: Westchester, FL, USA, 2006; Available online: http://digitalscholarship.fiu.edu/record/ (accessed on 2 February 2025).
  17. ANSI/ASHRAE 55-2023; Thermal Environmental Conditions for Human Occupancy. ASHRAE: Peachtree Corners, GA, USA, 2023.
  18. Putra, J.C.P. A Study of Thermal Comfort and Occupant Satisfaction in Office Room. Procedia Eng. 2017, 170, 240–247. [Google Scholar] [CrossRef]
  19. Fanger, P.O. Thermal Comfort: Analysis and Applications in Environmental Engineering; Danish Technical Press: Copenhagen, Denmark, 1970; Volume 92. [Google Scholar]
  20. Guo, H.; Aviv, D.; Loyola, M.; Teitelbaum, E.; Houchois, N.; Meggers, F. On the understanding of the mean radiant temperature within both the indoor and outdoor environment, a critical review. Renew. Sustain. Energy Rev. 2020, 117, 109207. [Google Scholar] [CrossRef]
  21. Dehghan, H.; Mortzavi, S.B.; Jafari, M.J.; Maracy, M.R. Development and Validation of a Questionnaire for Preliminary Assessment of Heat Stress at Workplace. J. Res. Health Sci. 2015, 15, 175–181. [Google Scholar] [PubMed]
  22. Hu, X.; Li, N.; Gu, J.; He, Y.; Yongga, A. Lighting and thermal factors on human comfort, work performance, and sick building syndrome in the underground building environment. J. Build. Eng. 2023, 79, 107878. [Google Scholar] [CrossRef]
  23. Menteri Kesehatan Republik Indonesia. Keputusan Menteri Kesehatan Republik Indonesia Nomor 1429/MENKES/SK/XII/2006; Kementerian Kesehatan Republik Indonesia: Jakarta, Indonesia, 2006.
  24. Jaeggi, S.M.; Buschkuehl, M.; Perrig, W.J.; Meier, B. The concurrent validity of the N-back task as a working memory measure. Memory 2010, 18, 394–412. [Google Scholar] [CrossRef] [PubMed]
  25. Stoet, G. PsyToolkit: A software package for programming psychological experiments using Linux. Behav. Res. Methods 2010, 42, 1096–1104. [Google Scholar] [CrossRef] [PubMed]
  26. Stoet, G. PsyToolkit: A Novel Web-Based Method for Running Online Questionnaires and Reaction-Time Experiments. Teach. Psychol. 2017, 44, 24–31. [Google Scholar] [CrossRef]
  27. JASP Team. JASP, Version 0.95.4; [Apple Silicon]; JASP Team: Amsterdam, The Netherlands, 2026. Available online: https://jasp-stats.org/ (accessed on 5 March 2025).
  28. Menteri Kesehatan Republik Indonesia. Peraturan Menteri Kesehatan Republik Indonesia Nomor 48 Tahun 2016; Menteri Kesehatan Republik Indonesia: Jakarta, Indonesia, 2016.
  29. Menteri Tenaga Kerja dan Transmigrasi Republik Indonesia. Peraturan Menteri Tenaga Kerja dan Transmigrasi Republik Indonesia Nomor PER.13/MEN/X/2011; Menteri Tenaga Kerja dan Transmigrasi Republik Indonesia: Jakarta, Indonesia, 2011.
  30. Zhang, J.; Lv, K.; Zhang, X.; Ma, M.; Zhang, J. Study of Human Visual Comfort Based on Sudden Vertical Illuminance Changes. Buildings 2022, 12, 1127. [Google Scholar] [CrossRef]
  31. Noda, L.; Lima, A.V.P.; Souza, J.F.; Leder, S.; Quirino, L.M. Thermal and visual comfort of schoolchildren in air-conditioned classrooms in hot and humid climates. Build. Environ. 2020, 182, 107156. [Google Scholar] [CrossRef]
  32. Kim, H.; Hong, T.; Kim, J.; Yeom, S. A psychophysiological effect of indoor thermal condition on college students’ learning performance through EEG measurement. Build. Environ. 2020, 184, 107223. [Google Scholar] [CrossRef]
  33. Tian, C.; Li, H.; Tian, S.; Tian, F.; Yang, H. The neurocognitive mechanism linking temperature and humidity with miners’ working memory: An fNIRS study. Front. Hum. Neurosci. 2024, 18, 1414679. [Google Scholar] [CrossRef] [PubMed]
  34. Castilla, N.; Higuera-Trujillo, J.L.; Llinares, C. The effects of illuminance on students′ memory. A neuroarchitecture study. Build. Environ. 2023, 228, 109833. [Google Scholar] [CrossRef]
  35. Siraji, M.A.; Kalavally, V.; Schaefer, A.; Haque, S. Effects of Daytime Electric Light Exposure on Human Alertness and Higher Cognitive Functions: A Systematic Review. Front. Psychol. 2022, 12, 765750. [Google Scholar] [CrossRef] [PubMed]
Figure 1. Historical trend of annual air temperature in the study area (1980–2024).
Architecture 06 00119 g001
Figure 2. Research workflow.
Architecture 06 00119 g002
Figure 3. Colonial school building (Source: Author). The yellow dashed box indicates the location of the classrooms where the environmental measurements and questionnaire surveys were conducted.
Architecture 06 00119 g003
Figure 4. Instruments and respondent layout (same layout for the first and second floor). Plain desk-and-chair icons represent unoccupied students’ and teachers’ desks and chairs.
Architecture 06 00119 g004
Figure 5. Installation of the wireless weather station. The yellow dashed box indicates the location of the instrument.
Architecture 06 00119 g005
Figure 6. Image of the classroom: (a) 1st floor class; (b) 2nd floor class (Source: Author).
Architecture 06 00119 g006
Figure 7. Physical environment condition: (a) indoor air temperature (Ta in); (b) relative humidity (Rh in); (c) air velocity (Va in); and (d) illuminance (lux).
Architecture 06 00119 g007aArchitecture 06 00119 g007b
Figure 8. PMV and PPD distribution.
Architecture 06 00119 g008
Figure 9. Subjective thermal comfort response: (a) thermal sensation vote; (b) thermal acceptability; (c) thermal comfort; (d) thermal preference.
Architecture 06 00119 g009aArchitecture 06 00119 g009b
Figure 10. HSSI results.
Architecture 06 00119 g010
Figure 11. Subjective lighting comfort: (a) Lighting Sensation Vote; (b) Lighting Comfort Vote.
Architecture 06 00119 g011
Figure 12. Attention performance results.
Architecture 06 00119 g012
Figure 13. Working memory performance results.
Architecture 06 00119 g013
Figure 14. Correlation between Predicted Mean Votes (PMV), (a) attention, and (b) working memory performance.
Architecture 06 00119 g014
Table 1. Measuring instruments specifications.
InstrumentParameterValid RangeAccuracyUnit
WBGT Data Logger 87786 AZGlobe temperature0–80±1 at 15–40, others 1.5°C
Hot Wire Anemometer GM8903Air velocity0–30±3% ± 0.1m/s
Elitech GSP-6Air temperature (in)−40–85±0.5 (at −20–40); others ±1 °C°C
Relative humidity (in)10–99±3 at 25 °C, 20–80; others ±5%Rh
Lux-29 Digital Light MeterIlluminance0–200,000±4% (0–10,000)Lux
MISOL-2320Air temperature (out)−20–40±0.5°C
Relative humidity (out)20–90±0.3%Rh
Table 2. Outdoor physical environment.
Ta Out (°C)Rh Out (%)Va Out (m/s)
MorningNoonAfternoonMorningNoonAfternoonMorningNoonAfternoon
Max28.8632.2230.8796.4995.5295.370.91.51.37
Mean26.7229.4028.9283.8375.2077.670.400.830.85
Min23.1924.5423.8873.0060.3369.670.060.280.18
SD1.6852.4092.4377.34910.8278.6160.2540.3270.329
Abbreviations: Ta out, outdoor air temperature; Rh out, outdoor relative humidity; Va out, outdoor air velocity.
Table 3. Pearson correlation coefficients between environmental parameters and cognitive performance based on daily classroom mean values.
VariablesCoefficientpn
PMV: Attention (1st floor)−0.944<0.0154
PMV: Attention (2nd floor)−0.936<0.0154
PMV: Working memory (1st floor)−0.764<0.0154
PMV: Working memory (2nd floor)−0.770<0.0154
Illuminance: Attention (1st floor)0.048>0.0554
Illuminance: Attention (2nd floor)0.271>0.0554
Illuminance: Working memory (1st floor)0.311>0.0554
Illuminance: Working memory (2nd floor)0.300>0.0554
HSSI: Attention (1st floor)−0.571<0.0154
HSSI: Attention (2nd floor)−0.608<0.0154
HSSI: Working memory (1st floor)−0.959<0.0154
HSSI: Working memory (2nd floor)−0.907<0.0154
Abbreviations: PMV, Predicted Mean Votes; n, sample size. Note: Correlation coefficients were calculated using daily mean values obtained from 18 observation days for each classroom and measurement period.
Disclaimer/Publisher’s Note: The statements, opinions and data contained in all publications are solely those of the individual author(s) and contributor(s) and not of MDPI and/or the editor(s). MDPI and/or the editor(s) disclaim responsibility for any injury to people or property resulting from any ideas, methods, instructions or products referred to in the content.