Article

Experiencing Change: Extended Realities and Empowerment in Community Engagement

Department of Interior Architecture, Rhode Island School of Design, Providence, RI 02903, USA
Architecture 2025, 5(4), 98; https://doi.org/10.3390/architecture5040098
Submission received: 7 August 2025 / Revised: 15 September 2025 / Accepted: 22 September 2025 / Published: 21 October 2025
(This article belongs to the Special Issue Strategies for Architectural Conservation and Adaptive Reuse)

Abstract

In the 21st century, community participation in heritage management has become a worldwide phenomenon. Despite this shift in heritage management thinking and the inclusion of community members in such processes, these participatory efforts have not necessarily led to the empowerment of communities in decision making. Many studies have been conducted to probe this critical question and to better understand what hinders the active involvement of the public. This paper examines the question through Crossing the Pell, an academic project from the Rhode Island School of Design (RISD). With grant sponsors/clients and based in real-time heritage management issues of historic Newport, Rhode Island, this project emphasized creative and untested methods for engaging community through the use of immersive digital environments. As sponsored design with the stipulated objectives of funders and clients, the professors and students were charged with not only solutions for an adaptation of existing infrastructure but also the design of a unique community engagement process. This paper documents the multi-year academic endeavor, analyzes its outcomes in the context of the history of community engagement, and offers a hypothesis for implementing an active and meaningful participatory process in cultural heritage management through the use of extended realities.

1. Introduction

In the 21st century, community participation in heritage management has become a worldwide phenomenon. Recognized and emphasized by UNESCO conventions in Budapest (2002), Faro (2006) and Kyoto (2012), the importance of communities in the management of heritage worldwide has led to community engagement processes for including the voices of local communities. This paradigm shift towards a people-centered process is part of a new, democratized cultural heritage practice [1]. Such a democratic participatory practice implies access to spaces of power and processes of decision making that renders the community member from passive observer to active collaborator [2]. Despite this shift in heritage management thinking and the inclusion of community members in such processes, these participatory efforts have not necessarily led to the empowerment of communities in decision making. In the last decade, some critics in fact claim that “there is no distinct role for the ‘public’ within the management process; rather, more often than not, this role is found at the end of the process, in the form of educational or informational criteria.” [3]. At a time of inclusion in heritage management, why is there no distinct role for the public other than in an informational sense? Many studies have been conducted to probe this critical question and to better understand what hinders the active involvement of the public. This paper examines the question through Crossing the Pell, an academic project from the Rhode Island School of Design (RISD). With grant sponsors/clients and based in real-time heritage management issues of historic Newport, Rhode Island, this project emphasized creative and untested methods for engaging community through the use of immersive digital environments. As sponsored design with the stipulated objectives of funders and clients, the professors and students were charged with not only solutions for an adaptation of existing infrastructure but also the design of a unique community engagement process. This paper documents the multi-year academic endeavor, analyzes its outcomes in the context of the history of community engagement, and offers a hypothesis for implementing an active and meaningful participatory process in cultural heritage management.

2. Academic Opportunities

The Rhode Island School of Design (RISD) is “one of the first art and design schools in the U.S. with graduate programs that research, experiment, create and push the possibilities of practice.” [4]. RISD’s Department of Interior Architecture focuses on the adaptive reuse of the built environment through its graduate programs. The Master of Art (MA) in Adaptive Reuse is a post-professional degree for architects to explore reuse first hand through studies based in a real-world setting. As educators of adaptive reuse, members of the Department of Interior Architecture were invited to participate in discussions of the future of heritage with the leaders and lawmakers of Newport, Rhode Island, USA.
Newport, RI, USA is a coastal city that holds some of America’s greatest historic treasures from 18th century homes of the American Revolution to the 19th century mansions of America’s Gilded Age. As the destination of the 17th century settlers who left England in search of religious freedom, the Atlantic Coast is dotted from north to south with waterfront cities—Plymouth, MA to Newport, RI, Annapolis, MD, Charleston, SC and St. Augustine, FL—that represent the earliest endeavors of the citizens of the newfound nation. These cities are preserved through strict standards and regulations aimed at maintaining them as cultural evidence of that period in history. The city and its heritage face many future challenges with climate change. Two projects emerged from the Newport discussions. Projecting Change (2017) focused on the impact of rising seas on the waterfront city. The results of this project led to a multi-year investigation of infrastructural change in Newport: Crossing the Pell (2021–2024). With a focus on the future of transportation and its impact on built heritage and the community, Crossing the Pell provided the canvas for exploring the potential of immersive environments in community engagement processes.

2.1. Projecting Change 2017

In 2017, graduate students in the 1-yr post-professional MA in Adaptive Reuse undertook an investigation of rising seas in the design studio titled Projecting Change. Sponsored by the van Beuren Charitable Foundation (vBCF) and the Newport Restoration Foundation (NRF), this semester-long investigation focused on ‘The Point’, an historic coastal neighborhood threatened by sea level rise [5].
One of the oldest neighborhoods of Newport, the Point is part of the Newport Historic District Zoning and designated a National Historic Landmark District in 1968. It is characterized by 18th century houses, many of which are built directly on grade. The historic homes experienced flooding from precipitation, storm surge, and extreme high tides. In 2017, high-model projections of the National Oceanic and Atmospheric Administration (NOAA) predicted 1 foot (30 cm) of sea level rise by 2035, 3 feet (91 cm) by 2065 and almost 7 feet (213 cm) by 2100. The houses of the Point Neighborhood, which already flood with each severe storm, will be under water without a careful plan for their future. Instead, those who could afford to raised their home by 2 feet, 4 feet, or more. Without regulations for such changes in the Newport Historic District Guidelines, the streets of the neighborhood displayed what is termed a ‘lollypopping’ effect. The previously uniform roof line of the on-grade homes became jagged, the now differing heights a display of wealth inequities. Owners of the historic homes in Point Neighborhood were, however, unwilling to engage in discussions of sea level rise and its impact on their small community. The sponsors of the studio had a single grant-stipulated objective: to engage the historic coastal neighborhood threatened by sea level rise in a conversation of their future [6].
Embracing the strategies for combatting sea level rise of ‘retreat, defend or adapt’, four student projects were developed, each representing an option for the adaptation of the built heritage of the Point Neighborhood’s built heritage. Focusing on strategies for the entire neighborhood rather than for a single house, the projects varied in the level of intervention. With the common assumption of a future of inundation, the schemes varied from defending the historic homes and streets with managed water control to creating whole new systems and definitions for preservation in the water. While these schemes of change were studied in traditional 2D drawings—plans, sections, elevation, axonometrics, perspectives—the studio elected to experiment with immersive environments as a means of meeting their grant objective. In a one-day community engagement event, the projects were made available to the community members through visualization utilizing virtual reality (VR). The presentation included two individual computer stations with headsets and multiple Google Cardboard VR viewers (now discontinued) for use with personal phones. Both the PCs and the Google Cardboards enabled an immersive experience of each of the projects. In addition, the PC user could, with the aid of joysticks and a headset, navigate through the sequence of images and interact with the design [6].
The event was well attended by community members of all ages but also by City lawmakers and preservationists. The Google Cardboard VR viewers were plentiful and simple to use. The students demonstrated the ease of attaching one’s phone to the viewer and accessing the different projects. The computer stations that allowed more interaction were in constant demand with long queues. This experience was particularly popular with older community members who delighted in seeing their own homes as context and watching them change in the proposed schemes of the future (Figure 1).
Visualization of this form allowed the members of the community—from middle schoolers to octogenarians—to finally experience what sea level rise might look like in their immediate surroundings. They were able to understand what ‘retreat, defend and adapt’ might resemble as future scenarios. With this understanding, conversations about the future took place between neighbors as never before. Through visualization, Projecting Change connected the members of the community and introduced new definitions of preservation for a future yet to arrive. As members of a community, they now had the language to participate in discussions related to the future of their neighborhood. Familiarity with the architectural language empowered them to speak.
The studio concluded with the close of the academic semester in May 2017. Over the next years, we received news that ‘lollypopping’ and other issues of rising seas were discussed at the neighborhood planning meetings and elsewhere in the historic city. In July 2019, two years after the community engagement event on Bridge Street, The New York Times published an article on the implications of sea level rise on historic Newport that included the RISD project. In January 2020, two and a half years after the project, Newport’s Historic District Commission adopted guidelines and standards concerning the elevation of buildings within Newport’s Historic Districts. Today, the website of the City of Newport includes a section titled “Elevating History.”
The correlation of immersive environments and the successful community event with the Point Neighborhood was only briefly considered. As academics, we were still exploring the potential of new technology in real time as it developed. Media coverage of Projecting Change [7], followed by Saving Superman [8] in 2020, a project that focused on the reuse of a vacant heritage Art Deco high rise in Providence, Rhode Island, raised the awareness of the department’s pedagogical objectives. An unexpected, high-profile invitation arising at a time when pandemic circumstances required new means of teaching brought the use of XR once again to the forefront.

2.2. Crossing the Pell 2021–2024

In 2020, the need for an American national infrastructure bill became the preoccupation of government, both in the U.S. House of Representatives and the Senate. A report conducted by the American Society of Civil Engineers on the health of infrastructure found that “… in 2019, according to the Federal Highway Administration (FHWA), 22.3% of bridges were classified as structurally deficient.” [9]. The concerns with infrastructure manifested itself not only in performance and technology but also in equitable use. The City of Newport commissioned “Keep Newport Moving,” a mobility plan advocating for both a sustainable and equitable future. Its goals to “support [of] the needs of all ages, abilities, races and economic backgrounds,” [10] included decreasing the household transportation cost burden as well as increasing publicly available micromobility options. Community feedback on transportation priorities indicated preferences for walking (85.3%) and biking (67.4%) [10] in a reduced reliance on automobiles. Built in the 17th century, Newport’s streets were designed for “non-motorized and water transportation.” [10]. Its narrow streets were not only unsuitable for vehicular traffic, especially in the summer months, but they were not fit for safe walking and biking. Newport’s bike network included only 3.35 miles (5.3 km) of bike lanes and were not part of a connected network. The mobility plan proposed a bike network in excess of 40 miles connecting the city and beyond [10]. I n this context, the Pell Bridge was slated for enhancement and positioned for Federal infrastructure funding. Along with the basic improvements, the Rhode Island Turnpike and Bridge Authority (RITBA) explored the inclusion of bicycle and pedestrian access to the bridge. In the ensuing discussion of a design charrette for exploring innovative materials in the adaptation of infrastructure, Senator Whitehouse of RI issued an invitation to the Department of Interior Architecture to study and design adaptations to the Claiborne Pell Bridge for the inclusion of bicycles and pedestrians.1 It was an extraordinary opportunity; an urgent real-world problem, high-profiled clients, and an engaged community.
The Claiborne Pell Bridge in Rhode Island, USA, previously known as the Newport Bridge, is the gateway to the Narragansett Bay and rivers to the North. Approximately 11,000,000 vehicles traverse its 2.2-mile (3.5 km) span annually, with an average of 28,000 daily crossings [11]. Designed by the engineering firm of Parsons, Brinckerhoff, Quade and Douglas, the Pell Bridge is the longest suspension bridge in New England. It is suspended from cables supported by two soaring gothic-styled intermediate portal towers, inspired by the iconic Brooklyn Bridge. Its completion in 1969 brought a dramatic change for the city of Newport. Previously accessible from the west only by ferry, historic Newport became a center of tourism through vehicular access, evidenced more than half a century later on any summer day by the traffic on the Pell Bridge that rises to an average daily crossing of 35,000 vehicles [11]. By the 50th birthday of the Pell Bridge in 2019, America was a country confronting aging infrastructure in severe need of upgrade.
The Senator’s invitation in 2020 came in the midst of the pandemic. In this context, teaching a design studio with a 2.2-mile (3.5 km) long bridge site seemed insurmountable. With four teams of graduate students, four instructors and several consulting experts, the Crossing the Pell studio faced not only the design challenge of adapting the bridge for bike and pedestrian access but that of doing so through virtual learning. In the case of the Pell Studio, the magnitude of the site proved to be our greatest challenge. This seemingly overwhelming obstacle would lead to novel approaches to two aspects of the design process: the site visit and the final review presentation, both of which would be conducted on laptop computers.
At a length of 2.2 miles (3.5 km), the site would have been difficult to both analyze and experience in person. The predicament lay in conducting such a site visit through video conferencing on 15″ laptop computers. The complexities of the site were numerous: uniquely different foundation conditions, cable stays rising to 400+ feet in the air, massive cable anchor blocks semi-submerged in the Narragansett Bay. Construction documents from the 1960s were technically informative but they only offered glimpses in a myriad of architectural details. A physical model built from these drawings offered little additional insight as a 40 ft-long (12.2 m) model at 1/8″ = 1′- 0″ (approximately 1:100) scale only provided a portion of the bridge structure. An immersive 3D digital model of the bridge, however, offered new possibilities. Covering the bridge, the topography above and below the water, and the buildings and key infrastructure along various shore lines, it was important for context and spatial orientation. Completed, it allowed the visualization of the site animated and in real time 3D, using Unity, a game engine. Taken into Virtual Reality (VR), the site model became an immersive experience, allowing us to go beyond the restrictions typical of both architectural drawings and remote work. Most importantly at this stage of the project, VR allowed the studio to “visit” the site, which at the time was not possible in person, and, using this simulation, to explore spatial conditions and vantage points nearly impossible to reach in physicality. On Zoom critiques, faculty and students were able to explore the bridge from all directions, flying up into the top of the portals as well as exploring each of the anchor conditions in the water. The many advantages gained from the virtual 3D site visits led to an exploration of a final presentation applying similarly immersive digital components [12].
Four schemes emerged: Conductivity, The Net, The Inhabited Bridge and All the World’s a Stage [13]. Over 2.2 miles (3.5 km), the schemes provided uniquely different amenities and experiences for bikers and pedestrians. The four projects, in addition to adapting the bridge for non-vehicular access, focused on other issues of the city: energy generation, ecosystems of the Narragansett Bay, tourism, public transportation and outdoor spaces for all.
The knowledge gained from creating the virtual site visit was applied to the planning of a virtual final review. The projects used stereoscopic spherical renderings to create a virtual reality Pano Tour of the schemes. This can loosely be defined as imagery one can look at from within, with spatial depth achieved by projecting slightly offset spherical renderings on each eye. A Pano Tour consists of a series of these images, chained together [12]. Each scheme was presented as a narrated series of views that showcased the project’s proposed design for adaptation. Using such a format even within the confines of laptops, the students were able to present their schemes in sequence from Newport to Jamestown through a 3D “pan-able experience.” For example, The Net, a design featuring a bike path system supporting the bay ecosystem, the Pano tour sequence included 360 views from the shores of Jamestown to viewing platforms along the bay, various marine exhibits, and a fish market. In this manner, the Senator and his staff traveled a 2.2-mile (3.5 km) virtual tour of the defining moments over the entire length of each of the design proposals. The detailed questions and elaborate commentary on specific aspects of each scheme affirmed that despite the virtual presentation our audience had indeed traversed miles across the bridge with us.
The Senator’s enthusiasm for both the different design approaches and the novel mode of presentation led to a new invitation to create a public exhibition. The sole objective was to share the design proposals with his constituents. A new sponsored design studio was planned for fall of 2022 with the goal of an exhibition to be held in Newport at the end of the year. This exhibition would in effect be a community engagement event on a grand scale. To that end, a partnership was formed with Bike Newport (BN), a grass roots bike advocacy group with many connections to different communities within the city. With Newport audiences of all ages and walks of life in attendance, this would be an opportunity to test new ways of engaging the community.

3. Context: Community Engagement in the 21st Century

As an academic endeavor, the Crossing the Pell exhibition was an opportunity to challenge the concept of community engagement in real time within one of America’s heritage cities. The multi-year challenge took place at a strategic moment in the history of community engagement in the management of cultural heritage. The right of all to engage with cultural heritage is a relatively recent phenomenon with roots in mid-century affirmations such as the United Nations Universal Declaration of Human Rights (1948) and the International Covenant on Economic, Social and Cultural Rights (1966). These were further supported by the Burra Charter (1979) and its focus on cultural significance and diversity of culture. Burra spearheaded the idea of communities and their importance in the protection of heritage. These 20th c. catalysts led to the call for public involvement in heritage that began in earnest only in the 21st century. The 2002 Budapest Declaration on World Heritage and its objective to increase public awareness and involvement led to what is now known as the “5cs” of heritage: credibility, conservation, capacity-building, communication, and communities (added in 2007). This was followed by the Faro Convention (2006) and its ratification to “reframe relations between all involved stakeholders, highlighting the essential role of inhabitants and … heritage communities.” [14]. This advocacy for participatory democracy in heritage management was affirmed at The World Heritage Convention in Kyoto, Japan that celebrated its 40th anniversary in 2012 with the theme “World Heritage and Sustainable Development: The Role of Local Communities.” Setting the direction for the next decade, the Kyoto Vision was a call to support the role of the community with amongst other things financial resources, sharing of responsibilities, and ensuring effective involvement [15].
Engaging communities in conservation and heritage management became prioritized in the years following Kyoto [16]. Many efforts were made to include communities. ‘Capacity-building,’ one of the World Heritage Convention C-themes, is defined by the United Nations as “the process of developing and strengthening skills, instincts, abilities, processes and resources that organizations and communities need to survive, adapt, and thrive in a fast-changing world.” [17]. It was a means of aiding the participation of communities through training and education. Once intended for heritage practitioners, capacity-building is now seen as part of a people-centered change to include those in local communities. Capacity-building programs intended for the community include case studies of best practices, training activities related to nature, culture, tourism and development, promotion of World Heritage in school curricula, creation of networks, identification of successful examples, training for participation in the World Heritage Convention, on-site learning of protection strategies [18]. Most of these program activities help to fulfill the levels of public participation requiring few skills. Such activities support the less involved levels of public participation but not necessarily the ones required for active involvement. Despite these efforts, community engagement efforts have been termed by some as a ‘contested domain’ where the inclusion of communities might be viewed as one lending political credibility to various players [19]. Ultimately, they lead to heritage practices that rely on experts, not communities. With the appearance of inclusion, this type of engagement can lead to in an unequitable balance between professionals and communities [19].
These stark observations on community engagement in the first decade of the 21st century most likely led to grants such as those that enabled the RISD projects. At the time of the van Beuren Charitable Foundation (vBCF) sponsor of Projecting Change in 2017, the term ‘community engagement’ was widely used but not uniquely defined. Definitions varied from “…the intention of communicating with the community, as well as facilitating actions and events to enhance people’s interest” [20] to focusing on “integrating local communities not just as stakeholders but as co-deliverers and decision makers in the development of local places or heritage led projects.” [21]. The abstract grant language in the RISD projects with objectives such as “to ignite a conversation in the community” or “to share with a Senator’s constituents” speak to the need to reexamine and perhaps breathe new life into the existing community engagement process.
The IAP2 (International Association for Public Participation) describes a Spectrum of Public Participation with five levels of impact: Inform, Consult, Involve, Collaborate and Empower [22]. Another model distills these levels to: Community Information, Community Consultation and Community Participation [23]. Despite the Kyoto Vision to ensure effective involvement, most community participation to date has taken place at the informational level [3]. Exploring the issue in the academic sector was an experiment to raise the impact of community participation beyond this phase.

4. Research Objectives

Academia, as a setting for promoting social actions in cultural applications through education, is an ideal testing ground for uncharted waters. Here, a mutual collaboration can exist between educators, students, communities and policymakers [24]. The invitation to exhibit academic design proposals to the public served different purposes for the various players involved. From a political and policy standpoint, it was a trial balloon to gauge public opinion on issues related to adapting existing infrastructure from urban implications and tourism to non-vehicular transport. These opinions would be advantageous for future decisions related to the infrastructure bill, especially for RITBA. From the academic viewpoint, it was an unfettered opportunity to experiment with innovative strategies in community engagement. Following upon the success of Projecting Change in igniting a neighborhood conversation through the use of immersive environments, the objectives for the Crossing the Pell exhibition were to engage the community in discussions of infrastructural change through the use of XR technology, updated since 2017.
Crossing the Pell would be an experiment on a much larger scale both in terms of the audience (the entire city of Newport) and the complexity of the issue (infrastructural adaptation). The objectives were three-fold:
  • To create an exhibition on infrastructure that would be accessible to all ages and backgrounds.
  • To create an exhibition that conveys four complex design proposals for adapting a 2.2 mile (3.5 km) long bridge.
  • To create a system of feedback to assess the efficacy of immersive environments in engaging communities in projects of architecture and design.

5. Methodology: Design

There were few requirements for this exhibition/community engagement event other than Senator Whitehouse’s request to present the projects to his constituents. While understated, this sole requirement set the parameters for many design decisions. To fully understand our design audience, we considered some basic demographics of Newport, RI. From 2023 data, this city of approximately 25,000 people had a median age of 37.2, with approximately 25% of the population over the age of 60 and 20% under the age of 20. It had a median household income of USD 83,562 [25]. Its diversity was broken into 5 groups: White (73.6%), Black or African American (7.11%), Two Races Including Other (Hispanic) (3.84%), Two Races Excluding Other, & Three or More Races (Non- Hispanic) (3.6%), and Asian (2.96%). Educational levels obtained by those in the work force included High School or Equivalent and/or a bachelor’s degree while approximately 1% each of men and women over 25 years of age had not completed any academic degree. The most common jobs were Sales & Related Occupations, Management Occupations and Office & Administrative Support occupations. With a reputation as the playground of the ultra-wealthy, Newport has 15.1% of its population living below the poverty line, a number that is higher than the national average of 12.4% [26].
Objective 1
Design methodology was determined by how best to relay complex bridge infrastructure designs to this large and varied group, most without knowledge of design, architecture, engineering, and construction. At a length of 2.2 miles (3.5 km), the bridge and the surrounding site were difficult to convey due to its magnitude. The existing drawings from the 1960s included truncated sections of the bridge itself as well as the many details of its construction. The designs for adapting the existing structure would add another level of complexity to the existing documentation. At 2.2 miles (3.5 km) long, the bridge is the length of 51 American football fields. An architectural elevation of the full bridge fitting on a 36″ (91.4 cm) wide sheet would be impossibly small at approximately 3″ (7.6 cm) in height. Drawings and models of such scales offer little information for the viewer without knowledge of architectural drawing conventions and what they signify. It was evident that with the exception of renderings, architectural drawings would be indecipherable for the general public. With this in mind, the exhibition was conceived as a show on architecture but without architectural representation. There would be no drawings, site plans, axonometrics or models. Instead, it would be approached as an exhibition of experience, the experience of what four different schemes might offer over 2.2 miles from Newport to Jamestown, RI. Following upon the methods used in Projecting Change, the studio focused on the use of immersive environments to convey the designs.
Objective 2
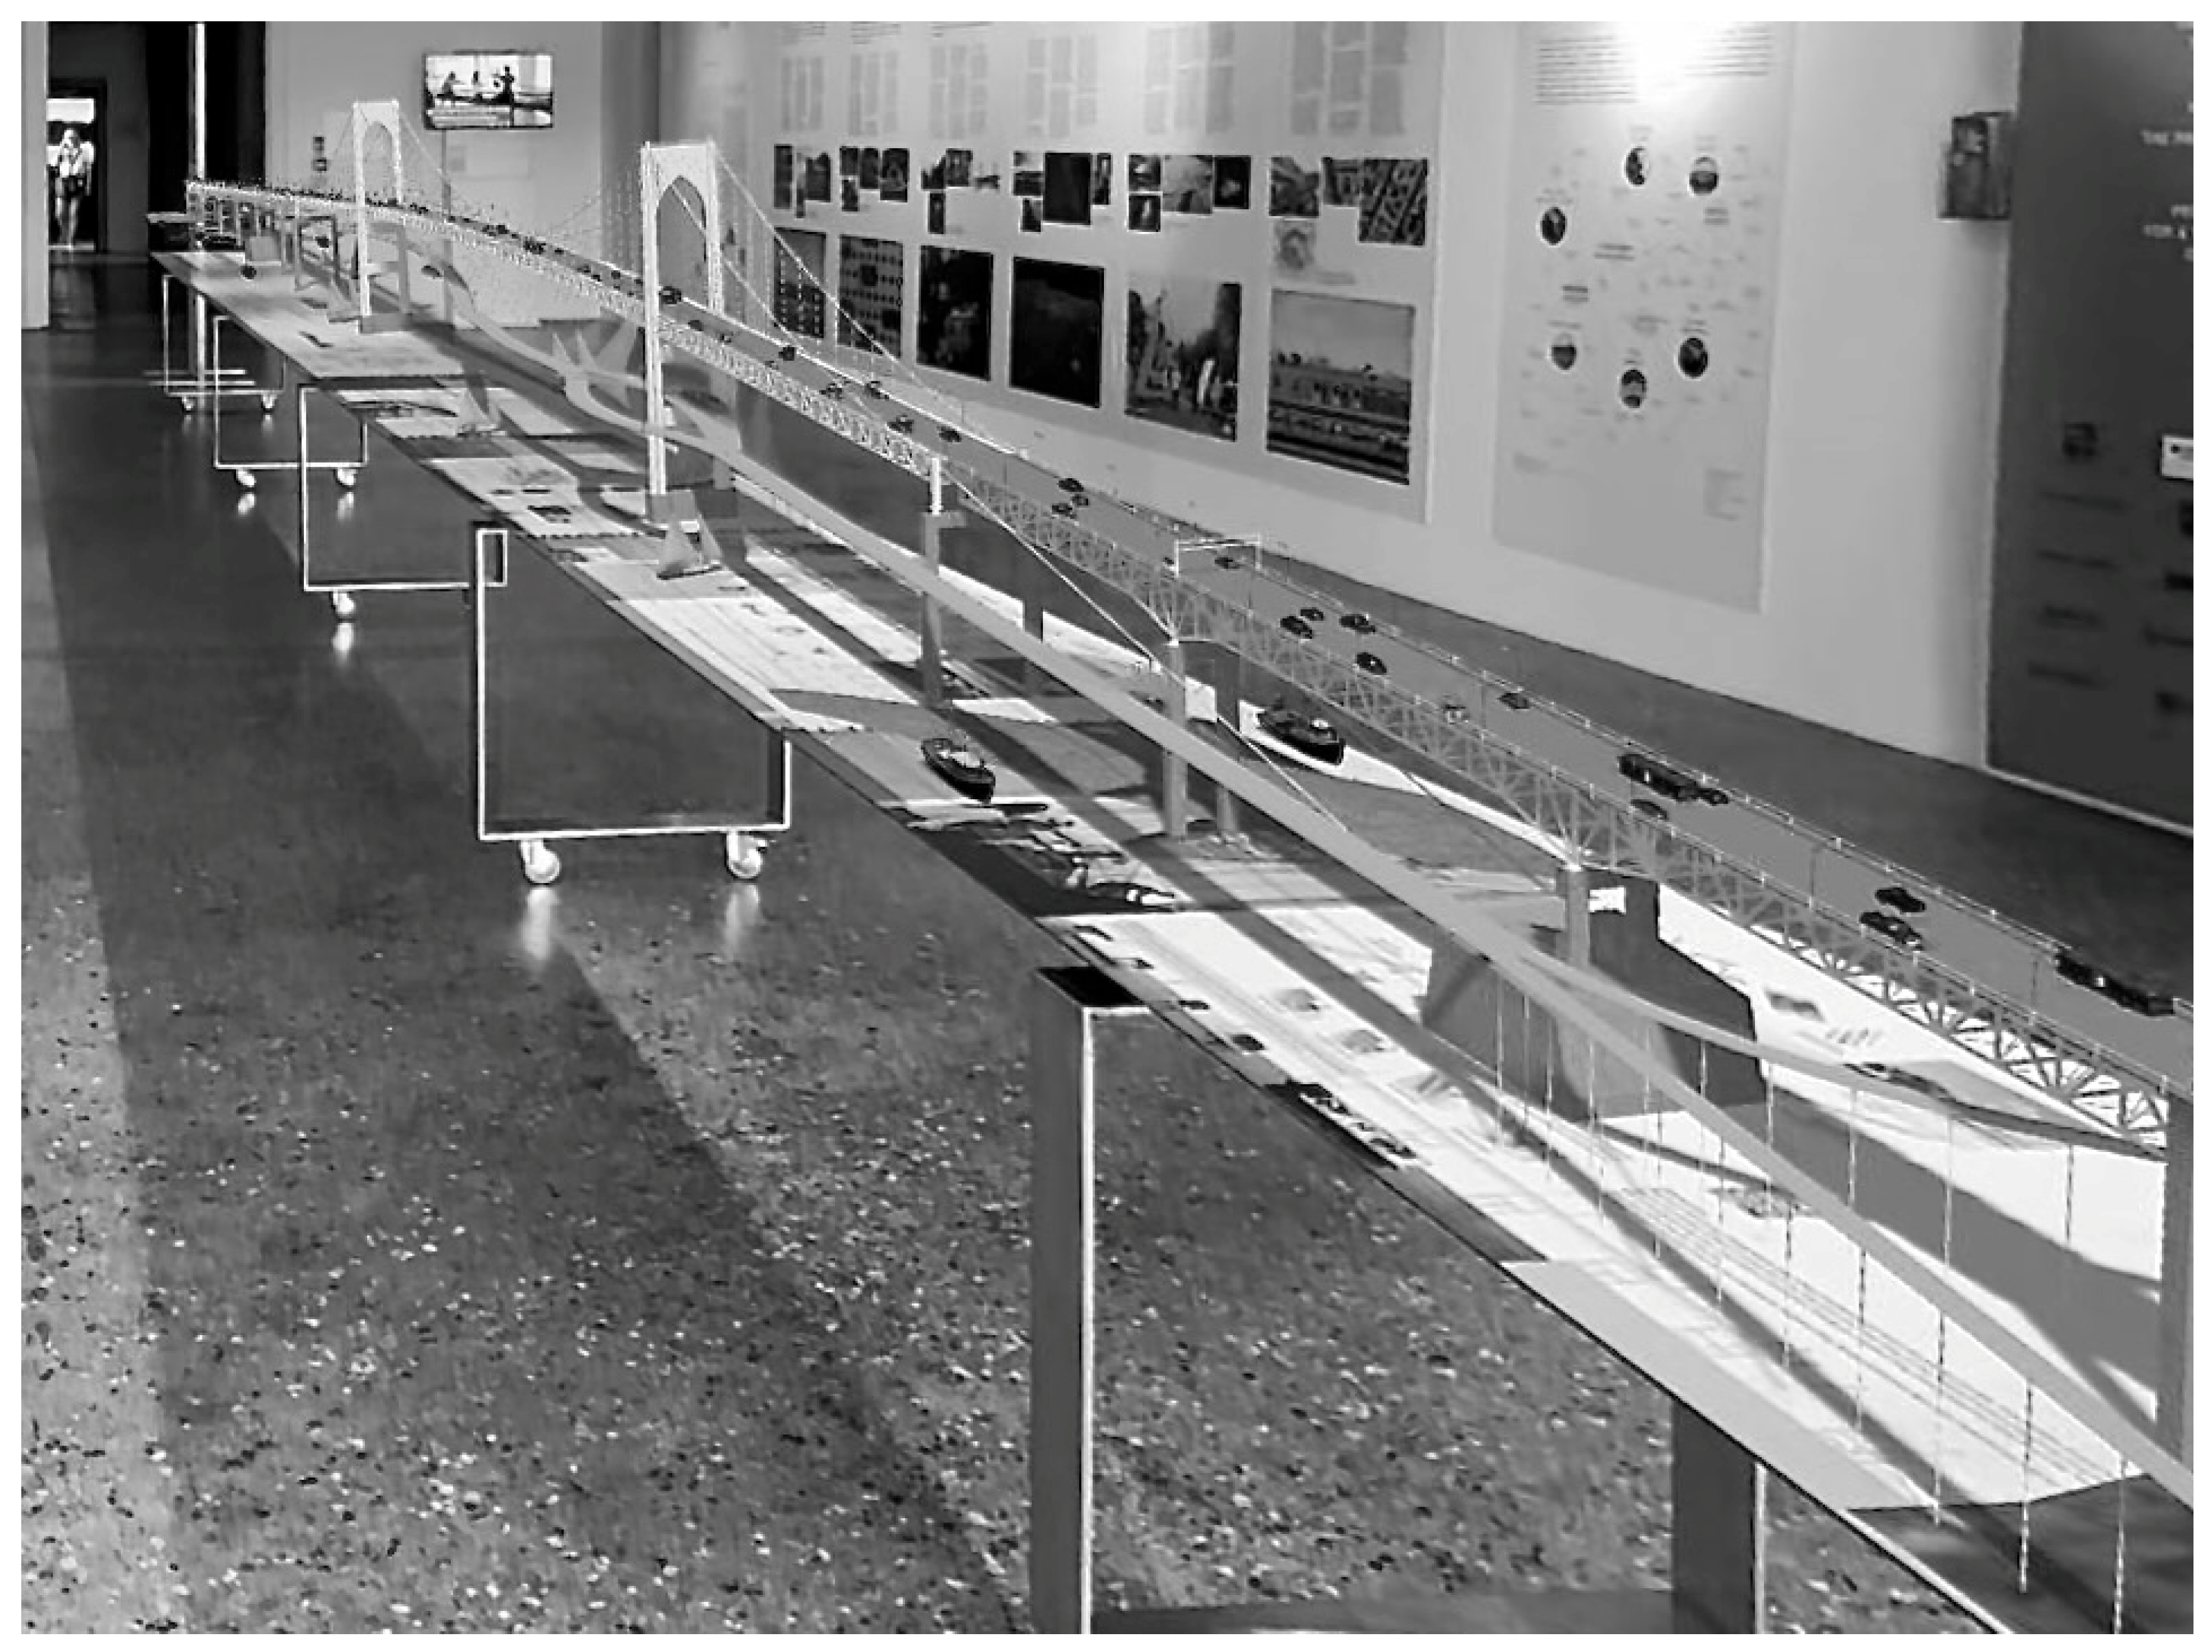
The exhibition was designed to provide three experiences: a VR pedestrian experience to “walk” across the bridge designs, a VR “ride” on a stationary bicycle across the bridge designs and an augmented reality (AR) table that allowed the visitor to navigate four different 40 ft (12.2 m) long digital models brought into the physical world (Figure 2). A Pano Tour and a VR headset conveyed the pedestrian experience by taking the viewer onto the bridge via a walk through the different designs at a 1:1 human scale. Within the limits of a 5′ (1.5 m) diameter circle on the floor, the viewer, using the joy sticks, would be able to explore any of the four projects in 360 degrees. In the second experience, a stationary bicycle paired with a VR headset allowed one to bike through the schemes from Newport to Jamestown. The most complex element, this fully interactive VR cycling simulation required significant technological manipulations. Sitting on various stationary bikes, visitors could pedal and steer through the 2.2 mile-long (3.5 km) designs in virtual reality. The 3rd experience comprised a 40 ft (12.2 m)-long table covered with the history and development of the Pell Bridge that also served as augmented reality image markers. With an iPad, a viewer could scan the surface of the table to bring a full virtual bridge into their physical environment via 4 different augmented reality apps created by the students. Each of those offered a fully animated projection of the scaled bridge on the table. In augmented reality, one can observe the flow of traffic, and, moving closer, even find animated pedestrians and cyclists on the envisioned paths. None of the experiences required familiarity with architectural drawings and conventions.
The consideration of human factors played a large part in the design of the exhibit and its elements so as to address the differentials of user size and age. The walking tour was one size fits all. The bikes included various child sizes as well as an adult tricycle for those requiring extra stability. The augmented table was designed to American with Disabilities Act (ADA) standards but included a low built-in step/bench that served the purpose of addressing issues of the very young and the very old. Children whose height was prohibitive to experiencing the virtual bridge on the table could access the exhibit from the top of the continuous step/bench. It also served as an inconspicuous place for those who needed a place to rest.
In addition to physical concerns, there was the consideration of human factors in virtual space. These included elements that accounted for physical comfort while operating in a virtual environment. For VR walking, this manifested in the creation of physical walking zones that corroborated the settings in the headset. Graphically vibrant, 5′ diameter, 1/8″ thick circular mats served as a tactile boundary for a contained walking experience. For the VR biking experience that took the visitor to an experience 200 ft (61 m) above the water, consideration was given to the effect of sudden elevation. This abrupt transition could be jarring and had the potential to cause dizziness and loss of control. A preparatory virtual bike ride on the level of the water was created to acclimate users both for experiencing the proximity of water and for the eventual elevation to the height of the bridge.
Objective 3
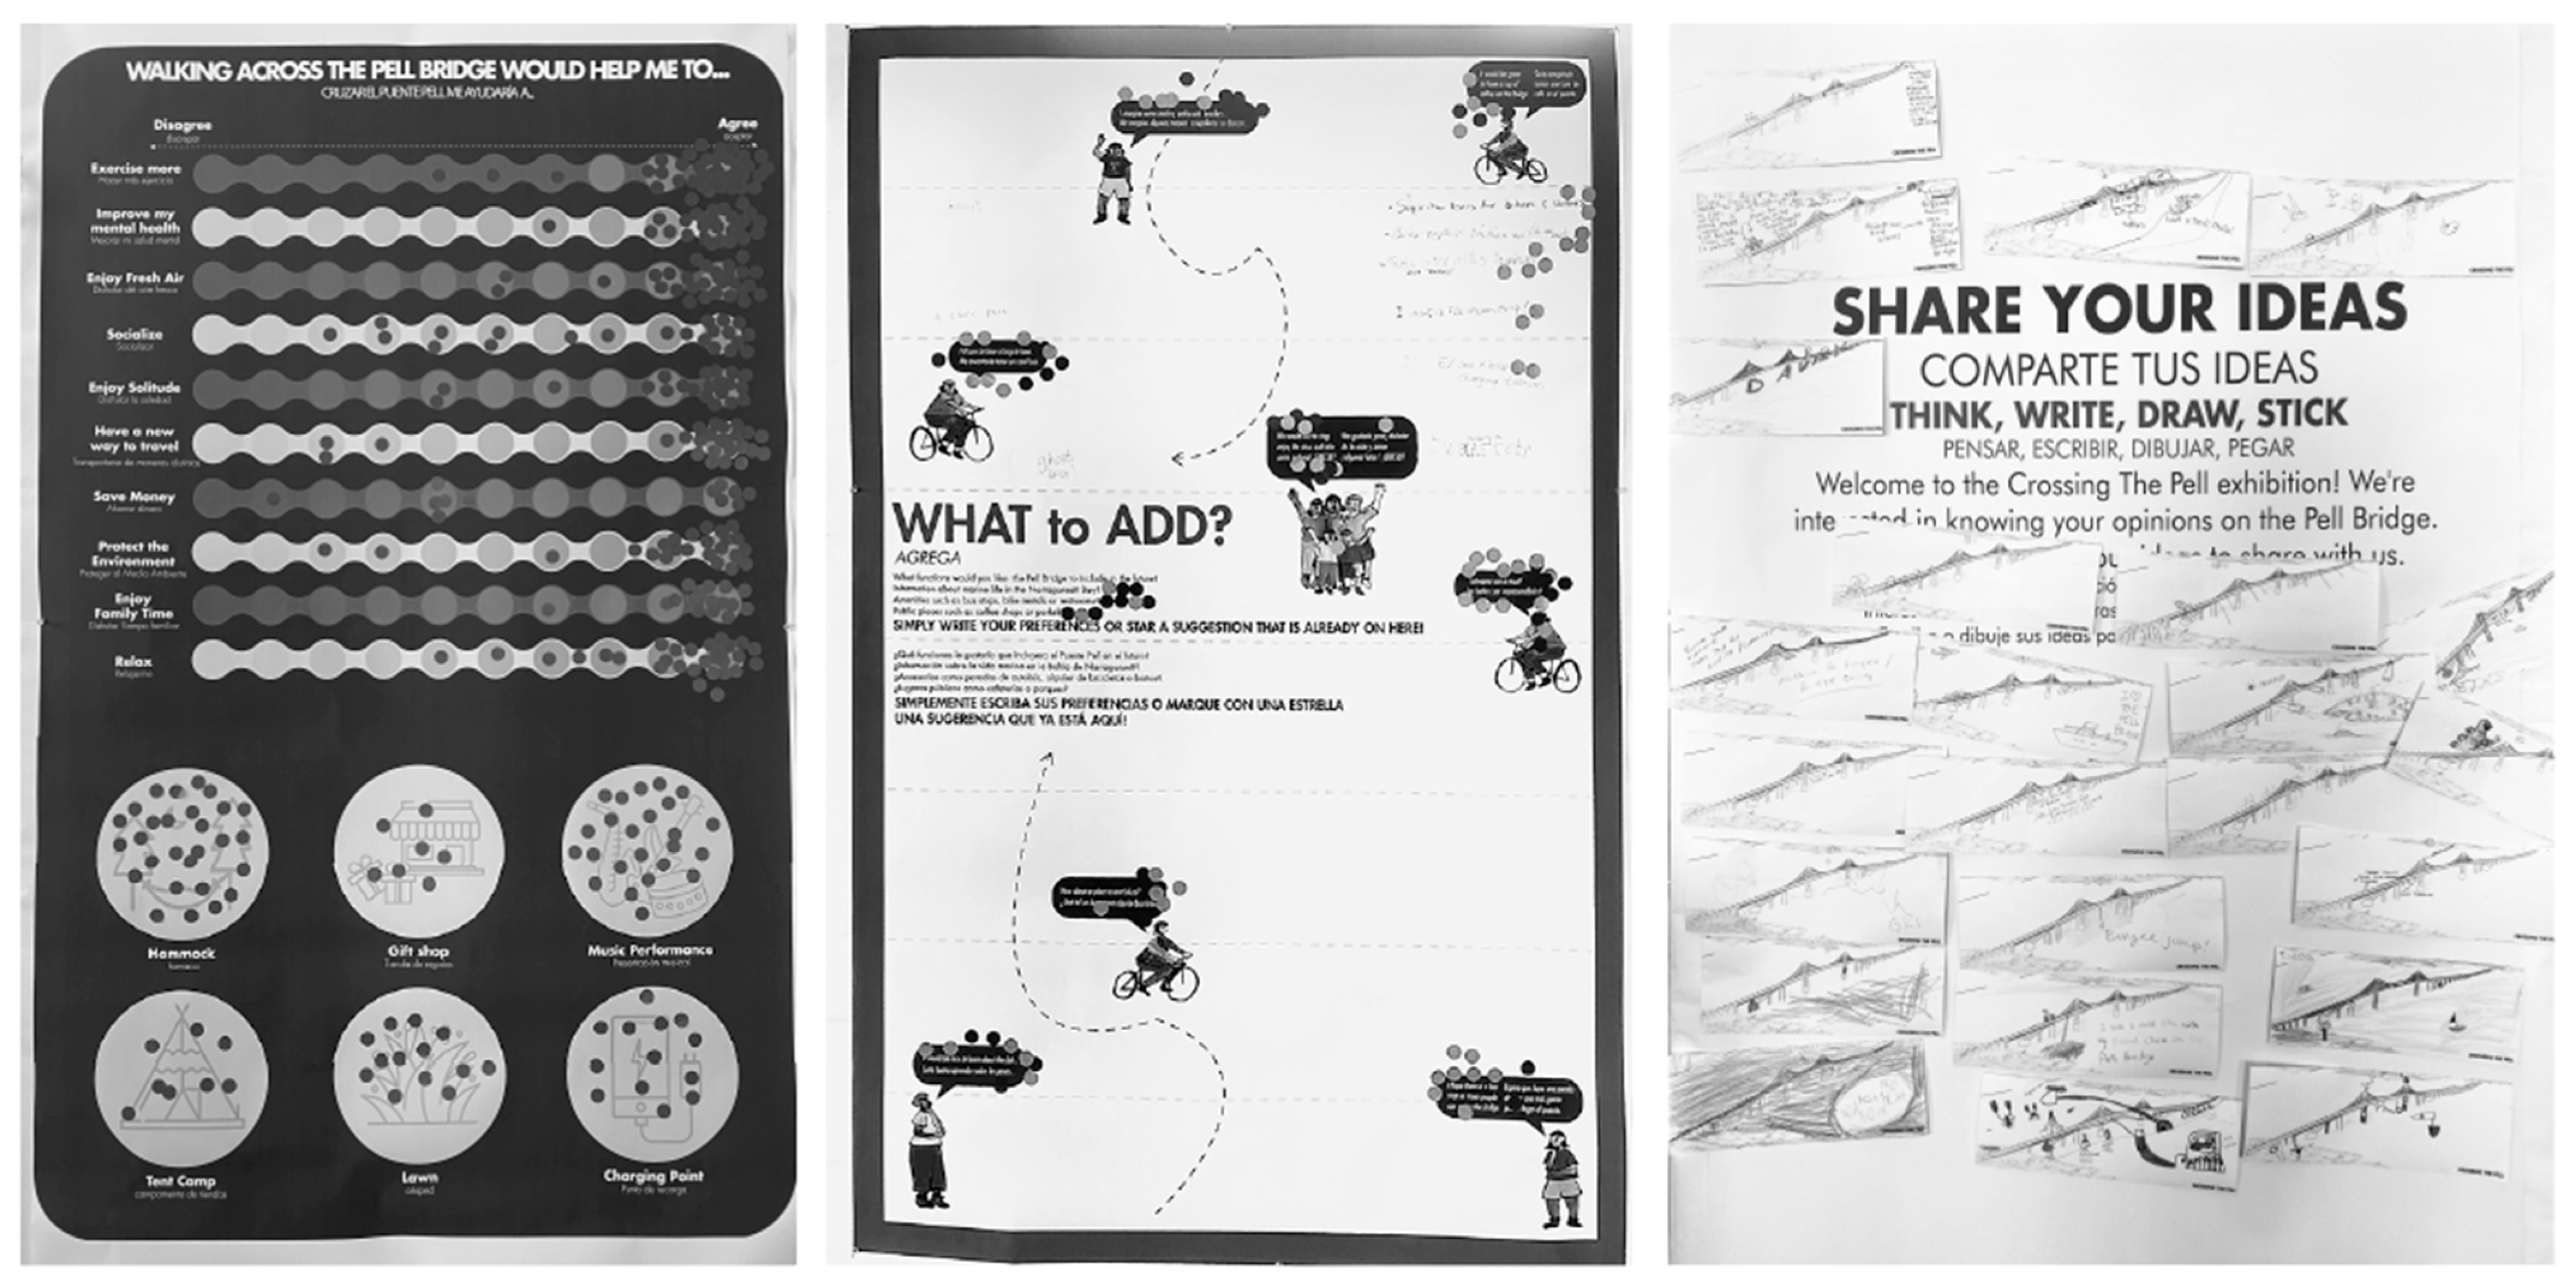
An important component of the exhibition was gauging visitor response. Feedback, although only an informal part of the exhibition, would provide evidence of the efficacy of immersive environments for introducing complex design concepts. With the general audience in mind as well as the demographics of the city, the feedback component was created to appeal to all ages, with few barriers and accessible graphics. Bilingual in English and Spanish, two types of feedback—directed and open ended—were solicited on various aspects of the bridge adaptation designs (Figure 3). The former solicited opinions on pre-determined subjects by allowing visitors to express themselves through a sliding scale of agreement. The latter was an open opportunity for visitors to respond by writing and/or drawing their thoughts of the project.

5.1. Type 1 Panels (Directed)

There were three different Type 1 panels, each focusing on a separate subject: the desired benefits of walking, the desired improvements for biking and the impact of the bridge on urban life. Each of these subjects were further divided into various related issues. Opinions on each issue could be expressed in the form of attaching a sticker on a graphic line with ten positions from ‘Less Important’ to ‘More Important for You’. Additionally, the lower half of the panel offered 6 different amenities for the bridge expressed only as graphics. One could express interest by the direct placement of a sticker on the graphic. Stickers were self-serve and without limitations (Table 1).

5.2. Type 2 Panels (Open Ended)

The second type of panel expanded on amenities for a bridge adaptation project. These panels differed from the first type in that they solicited individual write-in comments with words in one version and drawings in the other. Type 2A panel titled “What to Add?” solicited written comments. It featured several figures expressing their own interest as examples. Type 2B was titled “Share Your Ideas” and solicited drawn comments. Copies of a diagrammatic line drawing of the existing bridge were available as a base for users to draw their own design (Table 2).

6. Methodology: Implementation

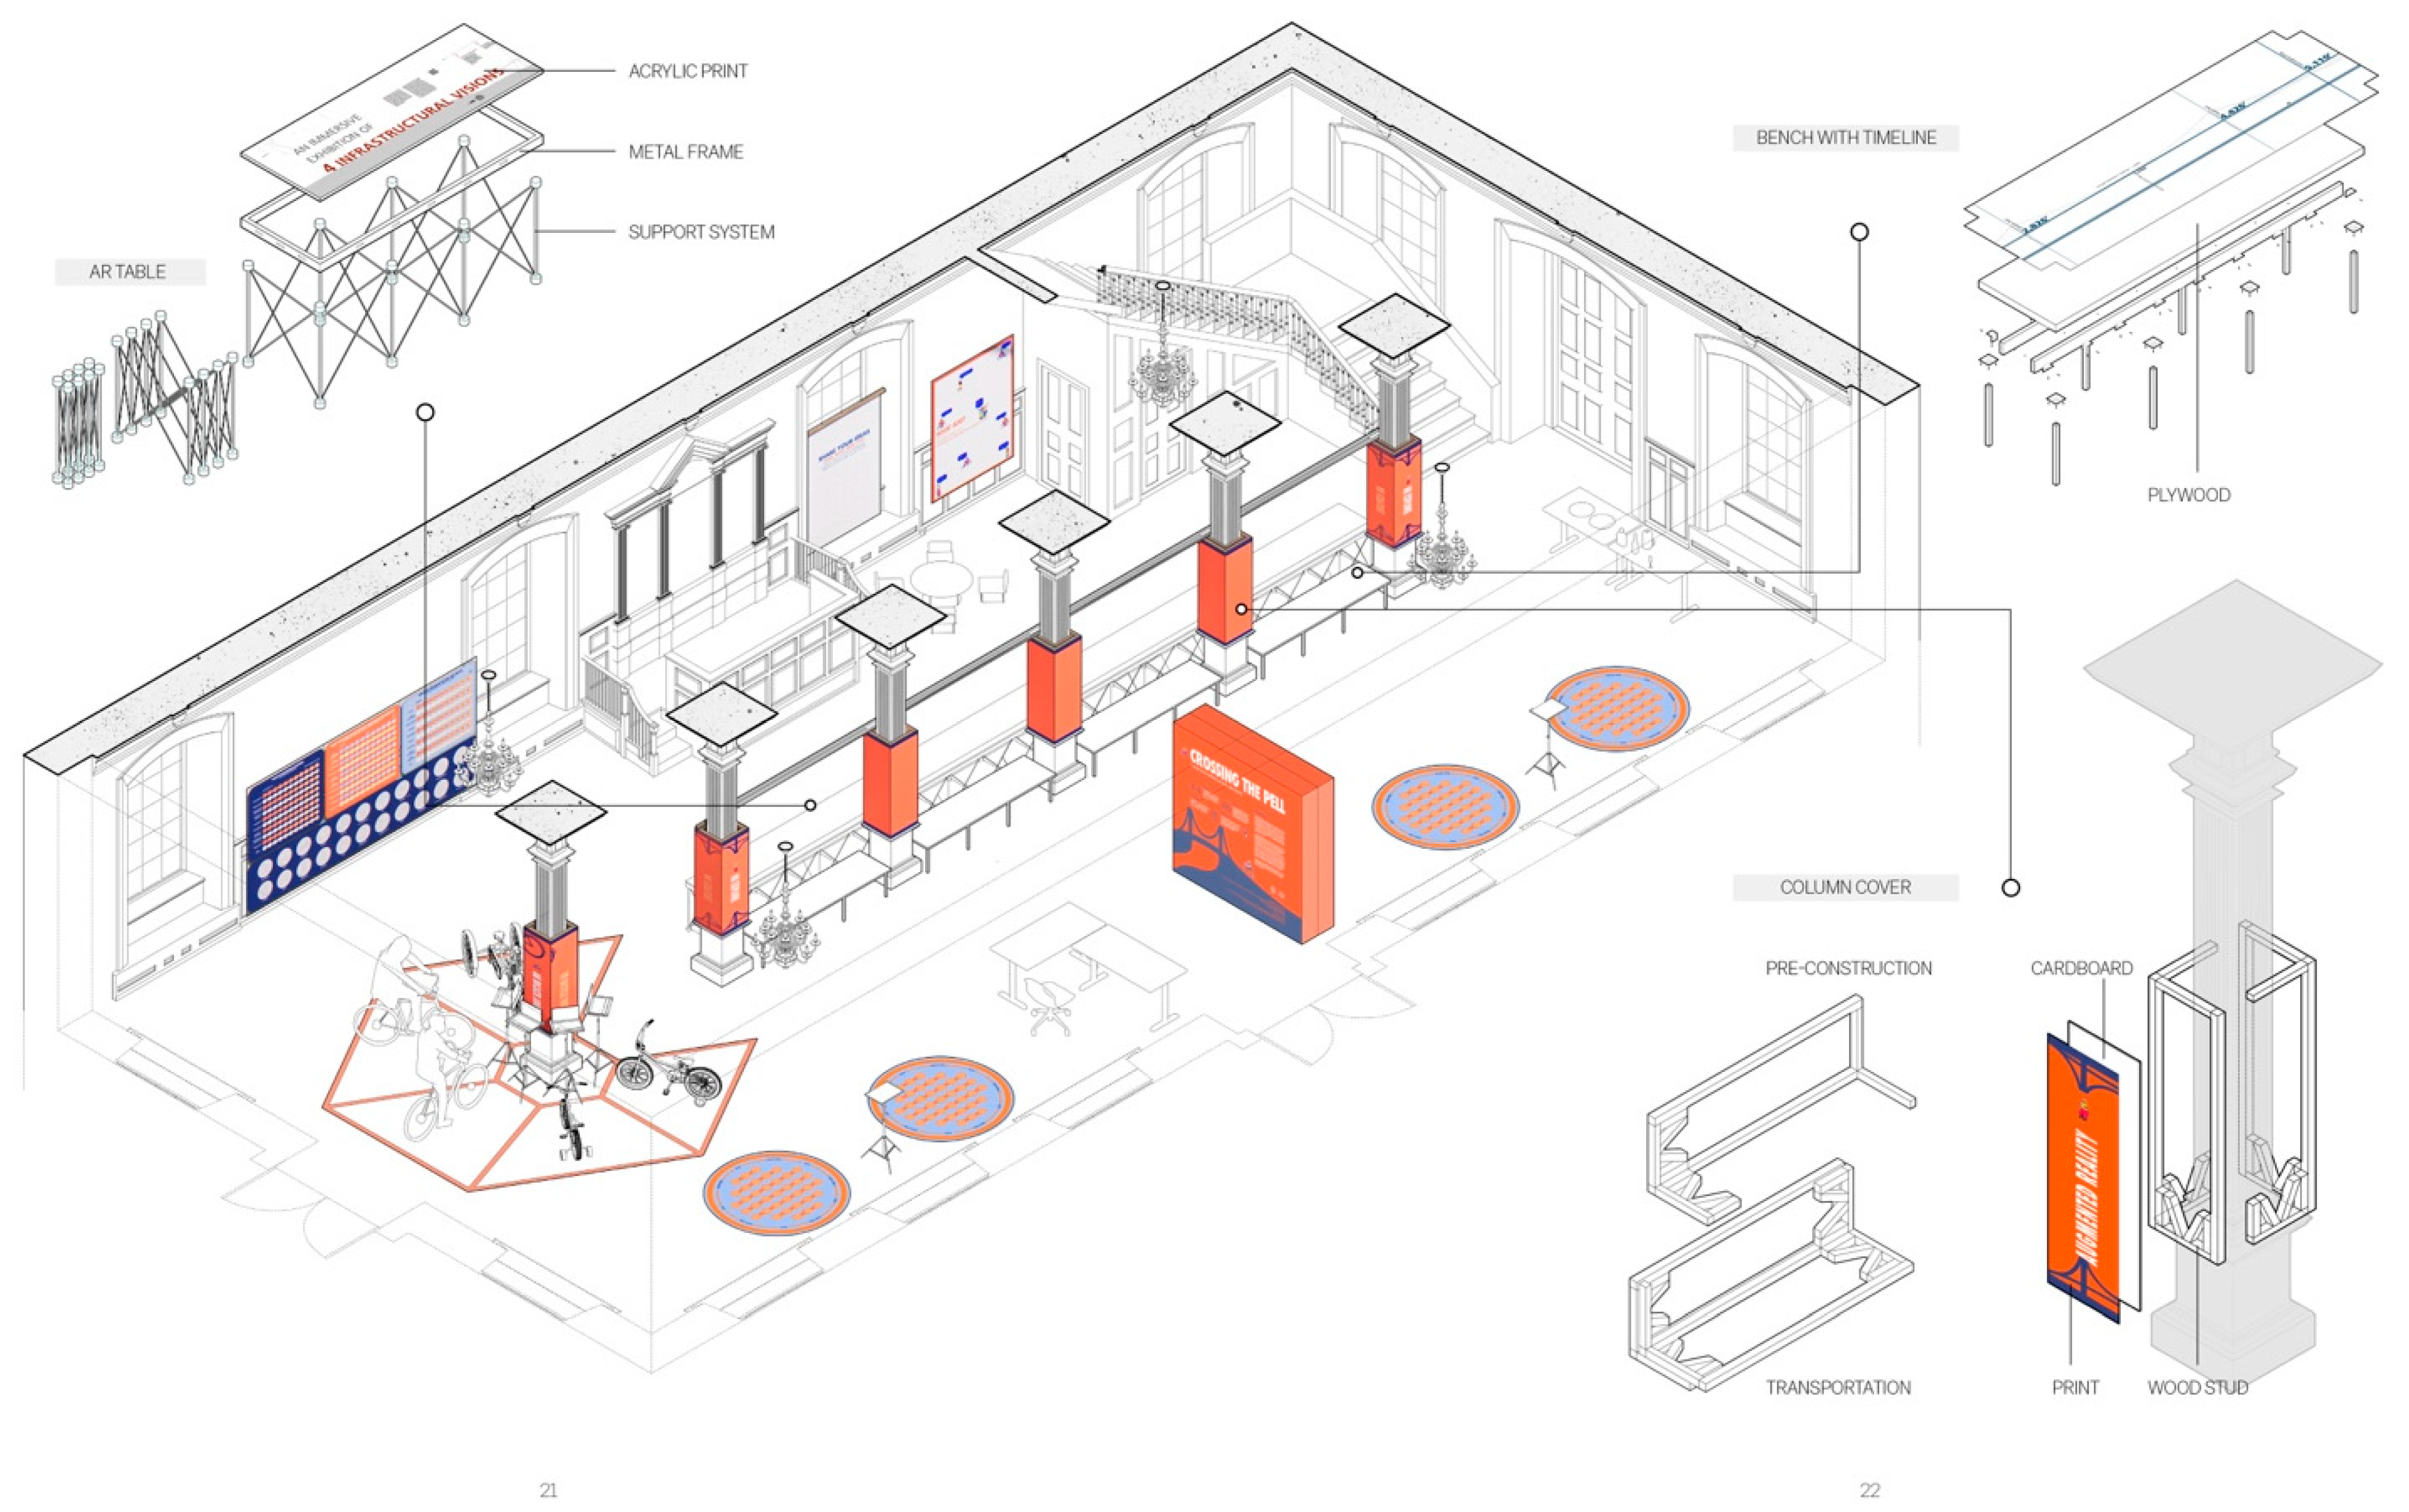
The exhibition was held on the first floor of the Old Colony House, an 18th c. historic statehouse built in the Georgian style. Accessed directly off the main entrance, the first floor is open with six columns and ideal for accommodating large numbers of people. The open floor plan was divided into five distinct areas: welcome/introduction area, the walking experience with 4 VR stations, the VR biking experience with 5 bikes (2 adult, 1 adult tricycle, I youth bicycle and 1 child bicycle), the AR table and a feedback station with self-serve graphic questionnaire boards and an area for drawing (Figure 4).
Scheduled for three days, the first evening served as a preview for invited guests while the next days—Saturday and Sunday—were open to the public. Online reservations were encouraged by not required. More than 100 guests attended the preview. Approximately 500 visitors attended the open exhibition, based on a general head count at the entrance. Upon arrival, guests were welcomed by student docents who introduced the exhibition elements.
With the exception of meal times, the three experiences were in full use and, often times, with a queue. Users included all ages from the elderly (age 93) to the very young (age 3) (Figure 5). The walking experience was most accessible, probably due to the ease of operation. The bikes, each paired with a technical assistant, were in constant demand. Adult bikes were preferred to the adult tricycle which was selected only as an option to waiting. Children’s bikes were in constant use with a long waiting line. (Several children biked through all four schemes, the equivalent of biking 8.8 miles (14.2km).) The AR table was in high demand. Each of the four schemes was available on a dedicated I-pad, the use of which was limited only by its battery life. The AR table was used both individually and in groups of two or three. The experience of the virtual bridge design in one’s physical space was conducive to group use and led to animated observations and discussions while in operation.

7. Data and Analysis

As an academic exhibition, Crossing the Pell operated outside the guidelines of real-world heritage management and the engagement process. In that sense, the visitors were guests and not participants in a community engagement on the future of infrastructural adaptation. Stakeholders, interest groups, community members all coexisted without differentiation. Empirical data was not formally collected, although such data was obtained through observation, corroborated by the many photographs of the event.

7.1. Qualitative

Information about the visitor was observed or gleaned through conversations with them. It included age, gender, ethnicity, socio-economic level, occupation.
  • Age (from conversations): The youngest visitor was three years old, she used the child bike experience. The oldest visitor was ninety-three years old and she thoroughly enjoyed the VR walking experience while her septuagenarian daughters hovered nervously by her side. There were visitors of all ages in between those two extremes.
  • Gender (general observation): The audience was mixed with no discernible difference in one versus the other in any age groups.
  • Ethnicity (general observation): White, Black, Hispanic, Asian, S. Asian with a majority of White visitors
  • Socio-economic level (knowledge of BN)
    There was some indication of socio-economic levels only through the knowledge of our community partner, Bike Newport (BN). Through their advocacy for first time bikers, members of the BN team identified visitors from these neighborhoods where bike ownership was scarce. Similarly, they identified visitors who were supporters and funders of such initiatives.
  • Occupation (through conversations):
    Occupations included the following: teacher, film maker, homemaker, construction worker, politician, museum staff, boat maker, members of the hospitality industry, graphic designer, printer, gardener, preservationist, government worker, baker, religious, lobbyist, photographer, architect, landscape architect, historian, student

7.2. Quantitative

Measured information from the exhibition included informal counting of attendees and computer data from the VR bike experience. The opinions expressed in the feedback constituted a different type of data.
  • Number of public visitors: 492
  • The number of visitors on Saturday and Sunday were accounted for visually at the entry by a BN staff member using a clicker. (Visitors to the preview were not counted.)
  • Number of miles biked in total: 450 miles (725 km), each ride averaging 1.59 miles (2.5 km) (Retrieved from the computer programs connected to each bike)
  • Responses to Feedback Panel Type 1: 1097 sticker responses (Table 1)
  • Responses to Feedback Type 2A: 116 responses (Table 2)
  • Responses to Feeback Type 2B: 24 drawings (Table 2)
Type 2A worked as designed, but visitors who agreed with one of the figures or a previously written comment selected to express their consensus by adding a sticker instead of rewriting the same comment. Those who participated in Panel Type 2B not only drew but also added written comments to augment their drawings.
The empirical data offered the following definitive conclusions:
  • More than 500 visitors participated over three days
  • The visitors reflect a makeup similar to the demographics of the city
  • The visitors actively participated in the XR experiences
  • Participation on the VR bike experience averaged 1.59 miles (2.5 km) per ride
  • The visitors responded with feedback
These conclusions suggest an active engagement with the XR experiences (1–4) but also in thoughtful consideration of the designs that these experiences conveyed (5). The latter provides insight into the visitors’ ability to understand the projects. By applying a community engagement standard for participation, the IAP2 Spectrum of Public Participation [22], the data can be reviewed using its 5 levels of participation—Inform, Consult, Involve, Collaborate, Empower.
  • INFORM
    The VR experiences offered the participant four different designs for providing bike and pedestrian access on the Pell Bridge. Without architectural drawings, the experiences conveyed extensive information on the different 2.2-mile long (3.5 km) design proposals. The AR table offered a different type of information: history and timeline of the Pell Bridge as well as contextual information of the city and the bay. The AR experience allowed the visitor to navigate the entire length for nuances of each design within a 40′ long (12.2 m) projected bridge. The I-pad permitted both overall observations and up-close interaction with the virtual bridge designs (Figure 6). All three experiences conveyed architectural information of the designs—overall strategy, siting, spatial sequences, programming and details.
  • CONSULT
    The Type 2A feedback panels solicited responses to questions specific to adapting the bridge for bike and pedestrian access. A total of 1097 responses were gathered. Members of the community recorded their preferences for walking and biking on the bridge through their opinion on issues both global and local. Panel Type 2B panels allowed the visitor to add observations of their own. These feedback activities were not unlike design charettes that take place in preliminary design processes for consulting with clients.
  • INVOLVE, COLLABORATE AND EMPOWER
    The responses to Type 2B panels offered a glimpse into the visitors’ understanding of the different schemes. Beyond the shared program of bike and pedestrian access, each project focused on its own theme: Conductivity on energy generation and public transportation, The Net on healthy aquatic ecosystems, All the World’s a Stage on tourism and performance venues and The Inhabited Bridge on outdoor urban spaces. The feedback responses for the Type 2B panels surprisingly revealed a substantial comprehension of the differences between the four schemes. While responses such as ‘ghost tour,’ ‘zip line’, ‘gondola’ or ‘bungee jumping’ may seem gratuitous, they in fact specifically relate to the adaptation of the Pell Bridge for tourism as presented in All the World’s a Stage. Responses such as “solar panel” and “wind turbines” refer directly to Conductivity where a new path not only serves non-vehicular access but also creates enough energy to power homes in the North End of Newport. Comments on the bus system and vans referred directly to a feature on the VR experience of Conductivity that shows the design of public transportation stops on the bridge. These comments exemplify an understanding of a massive design project and also its details.
    Type 2 Panels required the processing of information and a comprehension of the 2.2-mile long (3.5 km) designs. The comments received demonstrate the potential of community members to understand an intricate proposed design without the use of any architectural representation. This is an understanding that empowers members of the community to be collaborators.
Given the exhibit’s deliberate methodology to eschew architectural representation, such an understanding or familiarity with the designs can only be attributed to the experiencing of the projects through immersive environments. Experiencing design through the use of VR and AR enabled community members without architectural knowledge to understand the designs and to respond to questions about them. It further empowered them to make their own suggestions. As such, Crossing the Pell as a community engagement event wielded an impact level well beyond an informational one. In contrast to the claim that the role for the public is often only found at the end of the process in the form of educational or informational criteria [3], the Pell project can be seen as a prototype for democratic participatory processes that involve the community before the project begins.
While this project provides indications of the benefits of using immersive environments in the participatory process, this method comes, at this point in time, with some drawbacks. From the user perspective, there are minor risks of using VR technology. They include moderate to severe reactions including nausea and dizziness. There were three cases of such reactions in the 500+ visitors, one of which was severe. (In that case, a visitor used the VR bike without the preparatory VR cycling at the water’s edge. The immediate ascent to 200 ft (60 m) led to fear and a loss of balance.) As the project was developed in the midst of the pandemic, there was always concern about user hygiene and the sharing of equipment. This was resolved with disposable covers for the headset and disinfectant for the joy sticks.
From the perspective of the designers, there are concerns for the cost of creating immersive environments. At this time, it is still quite expensive in terms of hardware, software and expertise. Crossing the Pell was a funded endeavor. Without the generosity of our sponsors2, the equipment and expertise required for creating the experiences would have been cost prohibitive. In addition, immersive experiences are not autonomous. The deployment of such technology in a public setting required an intensive hands-on approach. Each of the immersive experiences required a 1-1 supervision by a team member to ensure its smooth operation, especially the VR bike. In total, the exhibition was supervised by a team of twenty—sixteen students, two professors, and two BN staff—for the entirety of the show.
The reception of the Crossing the Pell exhibition led to numerous opportunities in Rhode Island and beyond. In Newport, there were invitations to incorporate the exhibit into the public schools, the public library, the Newport Mansions (the historic edifices of the Gilded Age). In nearby Providence, invitations to exhibit included the Providence Public Library and the Rhode Island State House. These invitations were declined for reasons of costs, equipment and manpower. In 2023, the VR bike experience was displayed at the National Bike Summit, a national League of Bikers Association meeting in Washington, D.C. and the UIA World Congress of Architects focusing on Sustainable Futures in Copenhagen, Denmark. Also in the spring of 2023, a Pell research team worked to develop a quasi-autonomous version of the immersive walking experience that was subsequently installed in Senator Whitehouse’s office in the US Capitol. Most recently, the AR table is displayed in Time Space Existence at the Venice Biennale 2025. At this time, a phone app version for autonomous use is in development. For now, guides at the Palazzo Mora offer instructions on the use of the I-pads. But technology changes quickly. Some of the methods used for Projecting Change in 2017 were superseded by the time of Crossing the Pell in 2022. In the near future, the use of immersive environments will most likely become more accessible or even ubiquitous.

8. Conclusions

If indeed there is a global interest for community participation in heritage management today, then stronger efforts are needed to address the skills required for empowering decision making. Heritage management has required documentation since its Western inception in the 19th century. Architectural drawings used for heritage documentation are based in descriptive geometry. Introduced at the École Polytechnique after the French Revolution, this type of geometry used projections and “allowed for the first time a systematic reduction to three-dimensional objects to two dimensions.” [27]. It enabled the translation of forms and structures in space to drawings such as floor plans and elevations. However, an understanding of two-dimensional drawings such as floor plans, sections, elevations, and details requires a translation back to the three-dimensional space they represent. Such translation requires, at a bare minimum, a knowledge of the language of architecture, its drawing conventions and symbols and the relationship of scale to reality. This type of knowledge enables one to understand the existing material structure but also any proposed changes to it. Without such an understanding of architectural drawings, there can be no participation in discussions of heritage management. Such skills are a prerequisite for a community engagement process of empowerment and decision making. With the expectation that most members of a community may not be architects or members of the construction industry, crash courses on design language are a means to a truly inclusive engagement process—enabling community members to learn the basics of architectural design so as to have the tools to speak with design experts [28]. But it would be difficult and perhaps impractical to require members of the community to be tutored in the understanding of architectural drawings and their significance. Advances in digital technology might provide an alternative. Article 14 of the Faro Convention that addressed cultural heritage and the information society specifically seeks to improve information access relating to cultural heritage. The use of digital technology to create immersive environments, such as that used in Crossing the Pell, could enable design to be experienced without the understanding of architectural drawings. Such environments can be understood by users of all ages and backgrounds. The use of immersive environments for empowering the community to participate in decision making could be the future of a truly democratized cultural heritage practice.

Funding

This research received no external funding.

Institutional Review Board Statement

Not applicable.

Informed Consent Statement

Not applicable.

Data Availability Statement

No new data were created or analyzed in this study.

Conflicts of Interest

The author declares no conflict of interest.

Notes

1
This opportunity would extend over several academic semesters from the first advanced design studio in spring 2021 to the final installation team in Washington DC, Newport, RI and the UIA Congress in Copenhagen, DK concluding in summer 2023. The team included: Lead Faculty 2021-2024: Michael Grugl, Liliane Wong; Studio Faculty 2021: Michael Grugl, Wolfgang Rudorf, Liliane Wong; Consultant Faculty Andrew Hartness, Ben Cornelius, Tucker Houlihan; Studio Faculty 2022-23: Michael Grugl, Liliane Wong; Students 2021: Shuyi Guan, Nupoor Maduskar, Saira Nepomuceno, Seung Oh, Demilade Okunfulure, Sofia Paez, Mohan Wang, Yu Xiao; Students 2022: Chuchu Chen, Zhaoyang Cui, Yangchuang Deng, Xinzhu Huang, Jinlan Huang, Shravan Rao, Yicheng Ren, Hongli Song, Xueyun Tang, Zhijie Tang, Zefeng Wang, Xinjie Xiang, Chang Xie, George Xu; Special Guest 2022: Chance Chang; Students 2023: Zhaoyang Cui, Yangchuan Deng, Miranda Goldschmidt, Reem Habis, Rachel Strompf, Ruijie Tai, Tian Tian.
2
Crossing the Pell was funded by the Champlin Foundation, the Bafflin Foundation and the Bazarsky Family Foundation of RI.

References

  1. Oladeji, S.O.; Grace, O.; Ayodeji, A.A. Community Participation in Conservation and Management of Cultural Heritage Resources in Yoruba Ethnic Group of South Western Nigeria. SAGE Open 2022, 12, 21582440221130987. [Google Scholar] [CrossRef]
  2. Kisić, V.; Tomka, G. Citizen Engagement & Education Learning Kit for Heritage Civil Society Organisations; Europa Nostra: The Hague, The Netherlands, 2018. [Google Scholar]
  3. Waterton, E. Whose Sense of Place? Reconciling Archaeological Perspectives with Community Values: Cultural Landscapes in England. Int. J. Herit. Stud. 2005, 11, 309–325. [Google Scholar] [CrossRef]
  4. Graduate Degree Programs, Certificates and Concentrations. RISD. Available online: https://www.risd.edu/academics/graduate-study (accessed on 6 August 2025).
  5. Wong, L. Projecting Change: Redefining Preservation in the Era of Sea Level Rise. In Design Cultures_Revolution, Cumulus Conference Proceedings Roma 2021. Volume 2. Available online: https://cumulusroma2020.org/proceedings/ (accessed on 6 August 2025).
  6. Wong, L.; Wang, Y. Projecting Change—Visualization in Mitigating the Clash of Heritage Preservation and Sea Level Rise. Architect 2020, 63–70. [Google Scholar]
  7. Wong, L. Projecting Change. Open Transcripts. Available online: http://opentranscripts.org/transcript/projecting-change/ (accessed on 5 August 2025).
  8. RISD Superman Project. Available online: https://savingsuperman.risd.edu/ (accessed on 5 August 2025).
  9. American Society of Civil Engineers. Report Card for Rhode Island’s Infrastructure 2020; ASCE: RI, USA, 2020; Available online: https://infrastructurereportcard.org/wp-content/uploads/2016/10/Report-2020-RI-IRC-FINAL-WEB.pdf (accessed on 30 January 2023).
  10. City of Newport. Keep Newport Moving: Transportation Master Plan; City of Newport: Newport, RI, USA, 2023. [Google Scholar]
  11. Rhode Island Turnpike and Bridge Authority. Newport/Pell Bridge Improving Road Safety & the Implementation of a Moveable Median Barrier; RITBA: Jamestown, RI, USA, 2014; Available online: https://www.ibtta.org/sites/default/files/documents/2015/Dublin/Offenberg_Eric.pdf (accessed on 6 December 2023).
  12. Grugl, M.; Wong, L. Crossing the Pell: Experiencing Design in the Age of Extended Realities. In Making Design Public; Cambridge Scholars Publishing: Newcastle upon Tyne, UK, 2025. [Google Scholar]
  13. Crossing the Pell. Available online: https://crossingthepell.risd.edu/ (accessed on 5 August 2025).
  14. Salmela, U. The Faro Convention Action Plan Handbook 2018–2019; Council of Europe Framework Convention on the Value of Cultural Heritage for Society: Faro, Portugal, 2017. [Google Scholar]
  15. UNESCO World Heritage Centre. World Heritage Convention’s 40th Anniversary Celebration Concludes and Launches Kyoto Vision. Available online: https://whc.unesco.org/en/news/953/ (accessed on 5 August 2025).
  16. Chitty, G. (Ed.) Heritage, Conservation and Communities: Engagement, Participation and Capacity Building; Routledge: London, UK, 2016. [Google Scholar] [CrossRef]
  17. UNESCO World Heritage Centre. UNESCO World Heritage Centre—Compendium. Available online: https://whc.unesco.org/en/compendium/ (accessed on 5 August 2025).
  18. UNESCO World Heritage Centre. Capacity Building. Available online: https://whc.unesco.org/en/capacity-building/ (accessed on 5 August 2025).
  19. Waterton, E.; Watson, S. Heritage and Community Engagement: Collaboration or Contestation; Routledge: London, UK, 2011. [Google Scholar]
  20. Lao, T.W. Heritage Education as an Effective Approach to Enhance Community Engagement: A Model for Classifying the Level of Engagement. In Proceedings of the HERITAGE 2022—International Conference on Vernacular Heritage: Culture, People and Sustainability, Valencia, Spain, 15–17 September 2022; Universitat Politècnica de Valènci: Valencia, Spain, 2022. [Google Scholar] [CrossRef]
  21. Historic England. Why Engage with Communities and Do It Effectively; Historic England: Swindon, UK, 2024; Available online: https://historicengland.org.uk/advice/caring-for-heritage/community-advice-hub/why-and-how-to-engage-with-communities/#93b93b87 (accessed on 21 September 2025).
  22. International Association for Public Participation USA. IAP2 Spectrum of Public Participation. Available online: https://www.iap2usa.org/cvs (accessed on 21 September 2025).
  23. Johnston, K. Community Engagement—A Relational Perspective. In Proceedings of the Australian & New Zealand Communication Association Annual Conference, Wellington, New Zealand, 9–11 July 2008; Australia and New Zealand Communication Association and La Trobe University: Melbourne, Australia, 2008. [Google Scholar]
  24. Frullo, N.; Mattone, M. Preservation and Redevelopment of Cultural Heritage Through Public Engagement and University Involvement. Heritage 2024, 7, 5723–5747. [Google Scholar] [CrossRef]
  25. Census Reporter. Census Profile: Newport, RI. Available online: http://censusreporter.org/profiles/16000US4449960-newport-ri/ (accessed on 27 August 2025).
  26. Data USA Newport County, RI. Available online: https://datausa.io/profile/geo/newport-county-ri (accessed on 27 August 2025).
  27. Pérez Gómez, A.; Pelletier, L. Architectural Representation and the Perspective Hinge; MIT Press: Cambridge, MA, USA, 1997. [Google Scholar]
  28. Royal Institute of British Architects. Good Community Engagement Leads to Successful Projects. Available online: https://www.architecture.com/knowledge-and-resources/knowledge-landing-page/good-community-engagement-leads-to-successful-projects (accessed on 5 August 2025).
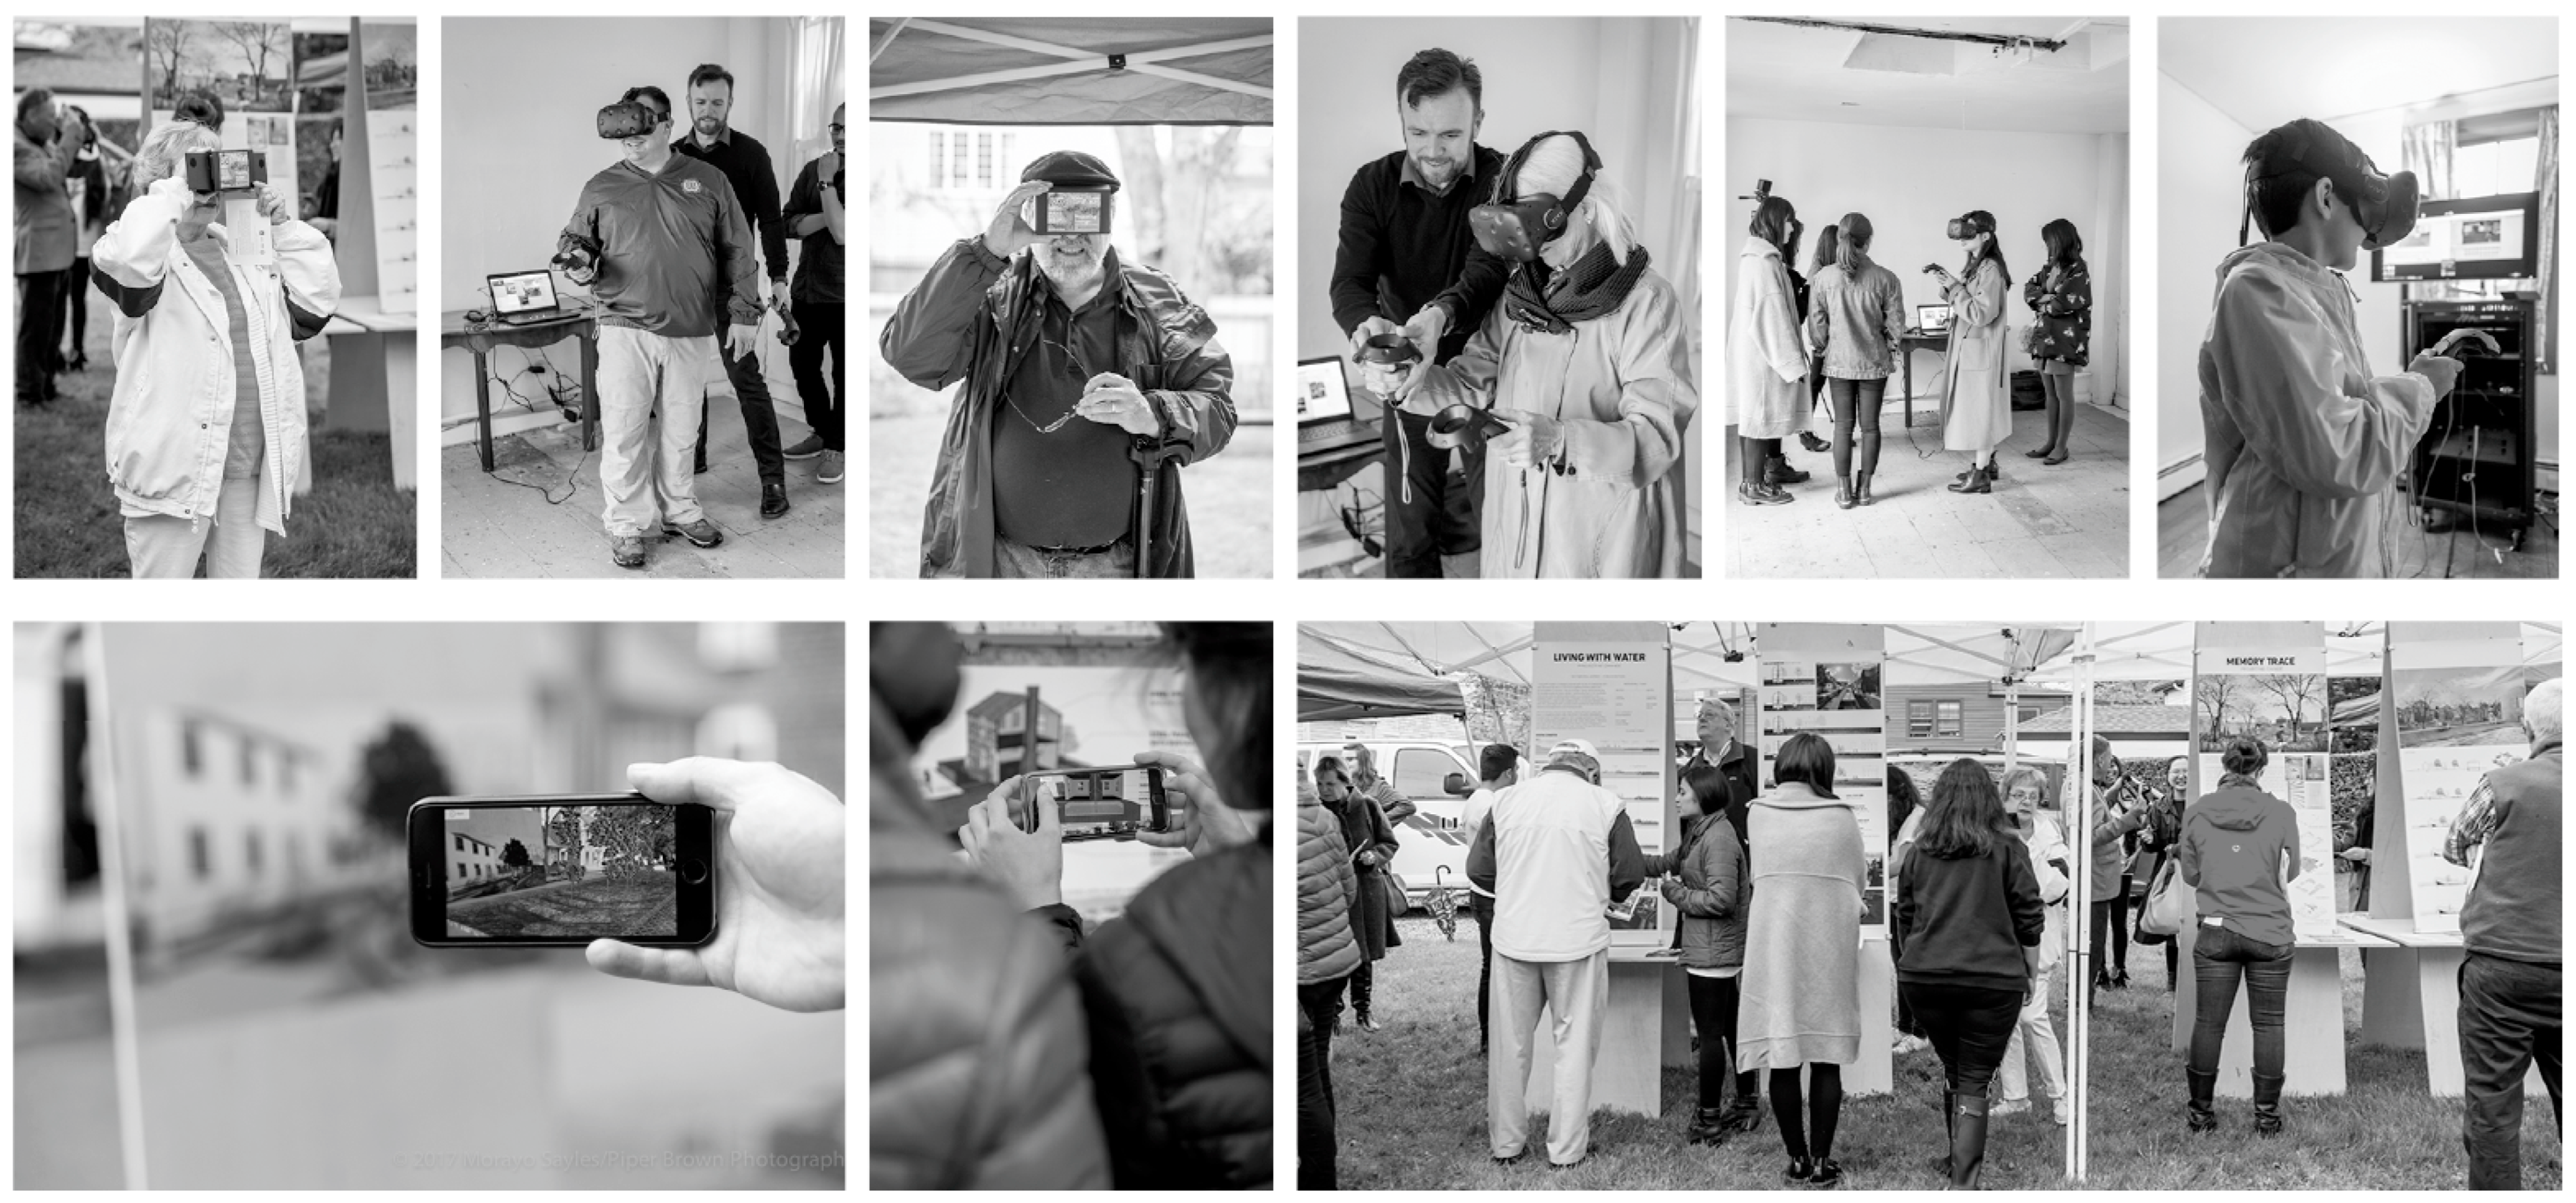
Figure 1. Projecting Change community engagement with Point Street Neighbors, May 2017.
Architecture 05 00098 g001
Figure 2. Three experiences: VR biking, VR walking and AR table.
Architecture 05 00098 g002
Figure 3. Panels: (leftright) Type 1A, Type 2A, Type 2B.
Architecture 05 00098 g003
Figure 4. Layout of the exhibition at the Old Colony House, Newport.
Architecture 05 00098 g004
Figure 5. Crossing the Pell: Users of all ages experience the bridge designs in VR and AR.
Architecture 05 00098 g005
Figure 6. A projected virtual bridge on the AR Table at Time Space Existence, Venice Architectural Biennial, 2025.
Architecture 05 00098 g006
Table 1. Responses to Feedback Panel Type 1.
Panel Type 1SubjectTopics to Rate (Number of Responses by Stickers Applied)Amenities (Number of Responses by Stickers Applied)
A“Walking the Pell Would Help Me To….”Exercise more (42)
Improve my mental health (26)
Enjoy fresh air (28)
Socialize (21)
Enjoy solitude (20)
Have a new way to travel (25)
Save money (12)
Protect the environment (23)
Enjoy family time (17)
Relax (29)
Hammock (28)
Gift Shop (7)
Music Performances (23) Tent Camp (8)
Lawn (13)
Charging Point (13)
B“What Could We Do to Improve Your Biking Experience?”Upgraded Infrastructure (23)
Seating Areas (16)
Bike Parking (22)
Bike Lanes (32)
Biking Instruction (10)
Bike Rentals (16)
Clear Signage (19)
Safety Measures (22)
Biking App (13)
Ease of Access (26)
Viewing deck (23)
Plants (37)
Bicycle Lane (56)
Snack Bar (69)
Bench (16)
Jogging track (9)
C“Your Suggestions Matter…”Local Economy (26)
Social Equality (27)
Convenient Transportation (26) Construction Expense (27)
Local History (30)
Sustainability (27)
Views from the bridge (33)
Entertainment Experience (22)
Marine Ecology (31)
Safety (35)
Information on the History of the Pell Bridge (13)
Pet Park (17)
Wheelchair rental (5)
Coffee Shop (18)
Book Shop (10)
Storage Lockers (6)
Table 2. Responses to Feedback Panel Type 2.
Panel
Type 2
SubjectTopics Included (# of Stickers Placed)ResponsesWritten Comments
AWhat to Add?Information on marine life (12)
bus stop, bike rentals (7)
restrooms (20)
coffee shops (10)
parks (12)
benches and bike lane (12)
viewing areas (10)
108 stickersSeparate lanes for bikes and walkers
Bike repair stations with tools
Public Water Refills & Fountains
I want a (sic) ice cream shop!
EV and E-bike charging station
A skate park
Ghost tour
Fishing
BShare your ideasNA24 picturesLive entertainment with interactive history
Cloud Hotel
Bungee Jump
Solar panels along south elevation of road bed
Wind turbines (drawn suspended from road deck)
Observatory (shown on top of cable stay)
Gondola tram (drawn suspended below bridge deck)
Zip line (drawn suspended between foundation piers)
Tourism walk experience over top for sunrise/sunset
Platform for bungee jumping and bridge swing
VR room (drawn below bridge deck)
Under detour, if terrible traffic
Do this first to get people excited about being able to go across bridges without a car!
No bikes get left behind unlike current #64 bus to/from NUWC from 1A Park & Ride
Low cost, frequently running van service for Newport and Jamestown Bridges
Disclaimer/Publisher’s Note: The statements, opinions and data contained in all publications are solely those of the individual author(s) and contributor(s) and not of MDPI and/or the editor(s). MDPI and/or the editor(s) disclaim responsibility for any injury to people or property resulting from any ideas, methods, instructions or products referred to in the content.