Abstract
Background: Singlet oxygen (1O2) generation in biological samples remains a significant challenge. Studying the mechanism of 1O2 action during photodynamic therapy (PDT) in atherosclerotic plaques in vitro represents an innovative cardiological approach. Atherosclerosis, a chronic and progressive disease, is characterized by plaque buildup inside arterial walls. Objectives: This study focused on the use of spin–lattice (T1) and spin–spin (T2) relaxation times measured by Magnetic Resonance Imaging (MRI) before and after the administration of indocyanine green-mediated PDT (ICG-PDT). Methods: To enhance visualization of morphological changes in atherosclerotic plaques, the clinically approved MRI contrast agent Gadovist was utilized. A total of 12 atherosclerotic plaque samples were collected from six patients undergoing endarterectomy. The generation of 1O2 in these plaques was assessed using quantitative MRI measurements and microscopic imaging, which visualized structural changes induced by PDT. Results: This research explores the potential of T1 and T2 relaxation times as indicators of PDT efficacy, while Gadovist helped provide evidence of 1O2 diffusion within the samples. Conclusions: Considering advancements in modern treatment, PDT may offer a novel approach for targeting atherosclerosis.
1. Introduction
Atherosclerosis is a chronic, progressive disease where plaques made of lipids, cholesterol, calcium, and cellular debris accumulate within arterial walls, causing narrowing and stiffening of the arteries [1,2]. This impedes blood flow and increases the risk of severe cardiovascular events such as heart attacks, strokes, and peripheral arterial disease [3,4]. The disease begins early in life with endothelial dysfunction, often triggered by risk factors like high cholesterol, hypertension, smoking, diabetes, and a sedentary lifestyle [5].
Dysfunctional endothelial cells allow LDL cholesterol to penetrate the arterial wall, sparking an inflammatory response (Figure 1). Over time, immune cells, particularly macrophages, engulf LDL particles, forming foam cells and fatty streaks, which represent the earliest visible signs of atherosclerosis. These lesions can develop into more complex plaques that may rupture, leading to thrombosis and acute vascular events [6,7,8]. Atherosclerosis is a leading cause of morbidity and mortality globally and often remains asymptomatic until its later stages, making early detection and intervention crucial [9]. Treatment focuses on lifestyle changes, pharmacological interventions, and in some cases, surgical procedures to restore blood flow [10]. Imaging technologies such as intravascular ultrasound (IVUS), magnetic resonance imaging (MRI), and computed tomography angiography (CTA) have improved the understanding of plaque dynamics, offering new opportunities for diagnosis and personalized treatment [11,12]. While MRI can be used to visualize the coronary arteries, it often struggles with the small size and tortuosity of these vessels, particularly when trying to identify early signs of stenosis or plaque buildup [13].
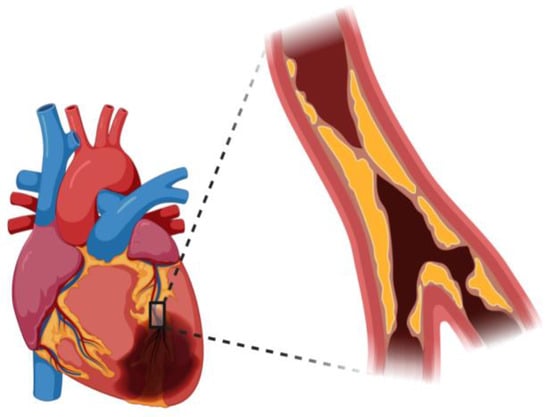
Figure 1.
Atherosclerosis occlusion view in coronary artery.
IVUS, a catheter-based imaging method, provides real-time visualization of blood vessels, offering critical insights into plaque morphology, composition, and severity. This technique allows for cross-sectional imaging, identifying plaque burden, vessel remodeling, and distinguishing between soft (lipid-rich) and hard (calcified) plaques [14,15]. Photodynamic therapy (PDT) is an innovative treatment for atherosclerosis that uses photosensitive substances, known as photosensitizers (PSs), which accumulate in atherosclerotic plaques and are activated by light to destroy pathological cells [16,17]. PSs selectively target macrophages and inflammatory cells within plaques, minimizing damage to healthy tissue [18]. Upon activation by light, PS generates reactive oxygen species (ROS), particularly singlet oxygen (1O2), which causes cellular damage, leading to the breakdown of plaques and improved blood flow [19,20,21,22,23,24]. PDT utilizes two mechanisms: Type I, which involves direct electron or hydrogen transfer to generate ROS, and Type II, which generates ROS through interaction with oxygen, primarily forming 1O2 [25,26,27,28,29,30]. PDT selectively targets and removes plaques, offering a promising therapeutic strategy for patients with cardiovascular disease [31,32]. Indocyanine green (ICG), a near-infrared fluorescent dye, has gained significant attention for both diagnostic and therapeutic applications, including in atherosclerosis and PDT. ICG is used in cardiology and heart surgery to measure tissue perfusion and blood flow, aiding in the evaluation of coronary artery bypass grafts and heart function [33,34,35,36]. In PDT, ICG absorbs light and releases energy that can target and destroy abnormal cells in atherosclerotic plaques, offering a safe and effective tool in both diagnostics and treatment [37,38]. Microscopy plays a critical role in atherosclerosis research by allowing scientists to examine the molecular and cellular mechanisms underlying plaque development and to evaluate potential therapeutic strategies [39,40,41].
The process of pathogenesis of atherosclerosis (Figure 2) is divided into stages of migration of leukocytes through the vascular endothelium to the intima, where atherosclerotic lesions form [42]. In the first phase of Tethering and Rolling, leukocytes attach to the endothelium thanks to molecules such as PSGL-1 (P-selectin glycoprotein ligand-1) and L-selectin. These bonds are relatively weak, allowing leukocytes to roll on the endothelial surface [43,44]. The next step in the activation of integrins involves the activation of integrins via chemokine signals that are received by G-protein coupled receptors (GPCRs) on the surface of leukocytes [45]. Chemokines such as CCL2, CCL5, and CXCL1, secreted by the endothelium and present in the intima, activate leukocytes and enhance their adhesion. Next is the arrest and firm stage [46,47]. Once activated, integrins on the surface of leukocytes (e.g., LFA1 and VLA4) bind to adhesion molecules on endothelial cells, such as ICAM1 and VCAM1. This causes the leukocytes to arrest and adhere strongly to the endothelium. The leukocytes then begin to polarize, preparing to migrate across the endothelium [48,49]. Molecules such as JAM-B, Mac1, and PECAM1 are involved in this process. Leukocytes move across the endothelial barrier into the intima, enabled by adhesion molecules such as JAM-A, JAM-C, and CD99 called transendothelial migration [50]. Factors that promote the further development of atherosclerosis are present in the intima layer. The inflammatory cytokines IL-1, IL-6, and TNF contribute to the inflammatory process and recruitment of further leukocytes [51]. Chemokines CCL2, CCL5, and CXCL1 attract further inflammatory cells. Retention molecules such as Netrin 1 and Semaphorin 3E help retain inflammatory cells around the atherosclerotic lesion [52]. Once the monocytes reach the intima, they transform into macrophages and engulf LDL (low-density lipoproteins) thanks to receptors such as CD36 and SR-A1. The accumulation of lipids in macrophages leads to their transformation into foam cells, which are a key element in atherosclerotic plaque formation [53,54]. This originally protective function can become overloaded and turn into a harmful pathogenic process when the foam cells begin to die, leaving lipids in the form of a soft, destabilizing necrotic core in the atherosclerotic plaque [55]. Such a core, called an atherosclerotic core, is relatively inert, but contributes to the weakening of plaque structure. Atherogenic lipoproteins can also accumulate and be retained directly in the inner layer of the artery, without passing through the foam cell stage [56,57]. The lipid-rich atherosclerotic core is devoid of blood vessels, contains few cells, has a soft, mushy consistency, and has a complete lack of collagen to support its structure. The size of this lipid core plays a key role in atherosclerotic plaque stability—the larger the core, the greater the risk of plaque destabilization and rupture [58,59]. As atherosclerosis progresses, endothelial cells, macrophages, and smooth muscle cells die, mainly through apoptosis. The disintegration of foam cells and the loss of muscle cells lead to the formation of a lipidic, destabilizing core and a brittle fibrous envelope prone to rupture [60,61]. Apoptosis also increases tissue factor activity, which enhances core thrombogenicity. Although the cells die more often than they divide, the plaque continues to grow, probably due to the recruitment of new cells from the blood [62]. During regression of atherosclerosis, induced by lowering cholesterol, macrophages atrophy—some of them die, while others may leave the plaque [63]. During atherosclerotic plaque formation, remodeling of the artery occurs, which can affect blood flow in two ways: by widening the vessel wall (expansive remodeling), which reduces flow restriction, or by narrowing the vessel (constrictive remodeling), which increases this restriction [64,65]. Plaques prone to rupture, especially those associated with acute coronary syndromes, tend to be larger and characterized by expansive remodeling, which preserves a wide vessel lumen. In contrast, plaques associated with stable angina tend to be smaller but can lead to significant lumen narrowing by shrinking remodeling [66]. Smoking and diabetes promote constrictive remodeling, but the reasons for these differences are not yet well understood. A growing number of studies point to a very strong influence of the immune system in atherosclerotic plaque formation [67,68]. Atherosclerotic plaque rupture is when the fibrous cap of the plaque is ruptured, exposing the lipid core to the flowing blood, increasing the risk of thrombus formation [69]. This is the most common cause of thrombosis in the coronary arteries [70].
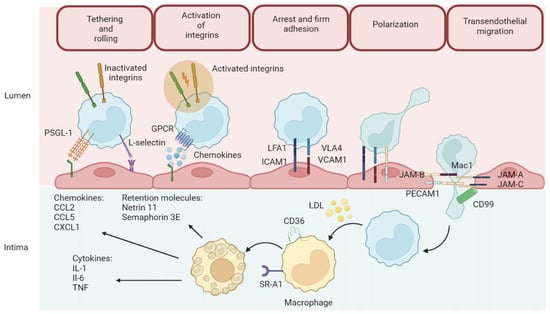
Figure 2.
Atherosclerosis formation process.
In this study, we hypothesized that Gadovist administration enhances MRI-based imaging of PDT effects in atherosclerotic plaques, possibly by influencing ICG distribution or retention. By comparing the T1 and T2 relaxation times before and after PDT, with and without Gadovist, we intend to ascertain whether gadolinium-based contrast agents can improve tissue permeability or serve as useful markers of treatment effectiveness. The study also includes histopathological analysis to evaluate changes in plaque tissue before and after PDT [71,72,73,74,75,76]. By combining MRI and PDT, this research highlights their complementary roles in diagnosing and treating atherosclerosis, offering a non-invasive, effective approach to assessing and managing this complex disease.
2. Materials and Methods
2.1. Materials
During experiments, all atherosclerosis plaque samples were placed in Eppendorf® 0030 000.919 tubes (Sigma Aldrich, Warsaw, Poland). Gadovist R 1.0 was purchased form Bayer AG, Leverkusen, Germany. Indocyanine green (ICG) was delivered from Carl Roth Karlsruhe in Germany. For the oxygen purge we used Oxygen (99%) produced by STP & DIN Chemicals, Bielsko-Biala, Poland. MRI experiments were performed with a 1.5T OPTIMA 360MR manufactured by General Electric HealthCare (Chicago, IL, USA). The microscope was manufactured by Zeiss Axio Imager D2 (Oberkochen, Germany). Samples were irradiated with LED Diall IP54 0203H (Sigma Aldrich, Warsaw, Poland). The live and dead staining was from Abcam (Cambridge, MA, USA).
2.2. Methods
2.2.1. Atherosclerotic Tissue Sample Preparation for PDT and MRI Measurements
Informed consent was obtained from all subjects involved in the study. Tissue samples of arteries with atherosclerotic lesions were collected by endarterectomies from 6 patients. The plaques analyzed in this study had to be more than 20 mm from the intervention site. The plaque characteristics were classified based on coronary angiography examination. Samples were excised from the carotid artery, which had previously been image-diagnosed and qualified for removal. All plaques can be categorized into primary types of hard plaque. All bioethical consents presented in this research were obtained according to Bioethical Certificate no 43/2024/B (approved on: 9 September 2024) issued by the Bioethics Committee of the District Medical Chamber in Rzeszów.
The collected atherosclerotic lesions had weights of 0.0108 g, 0.0115 g, 0.0545 g, 0.0531 g, 0.0630 g, 0.0615 g, 0.1285 g, 0.1321 g, 0.0321 g, 0.0403 g, 0.1042 g, and 0.1330 g. All used samples were measured by using the balance of Ohaus PX224 (Geifensee, Switzerland). The samples were delivered to the laboratory in a solution of physiological salt (Figure 3).
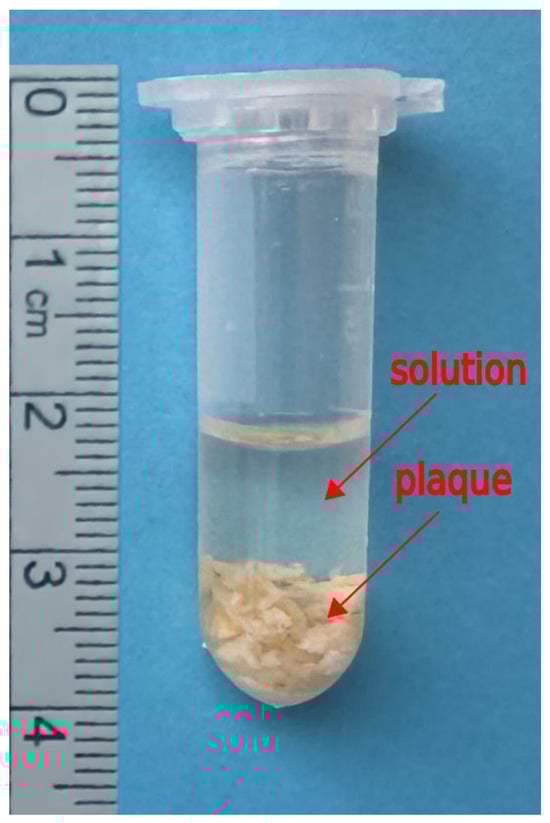
Figure 3.
An example of setup of atherosclerosis plaque in Eppendorf tube with the volume of 1.6 mL solution isotonic, an approximately 0.9 percent solution of sodium chloride also called normal saline solution.
In total, 12 samples (2 from one patient when the number of patients were six) were evaluated. Our research focused on the use of MRI to evaluate the results of PDT with ICG in atherosclerosis plaques before and after Gadovist administration. We optimized the T1 and T2 relaxation times of MRI to evaluate the results of PDT with ICG. We planned to provide appropriate control on each step of the research. To do this we were obligated to select the correct time of all used procedure presented at Figure 4.
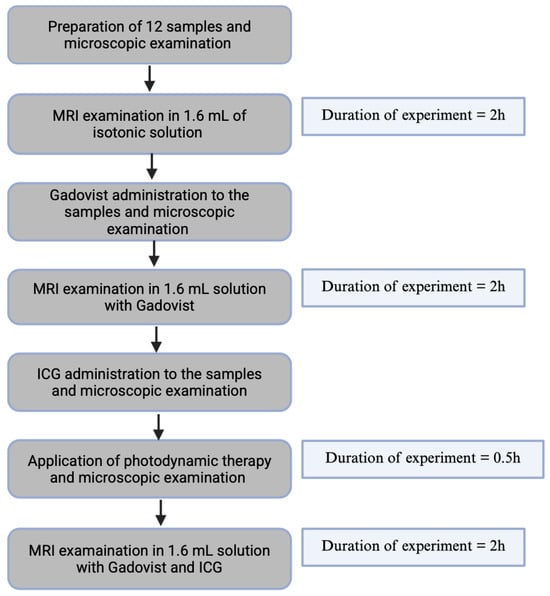
Figure 4.
A schematic research diagram.
To control the incubation time of plaque with Gadovist, we monitored one sample during incubation using T1 relaxation time. For this reason, we performed four acquisitions of T1 relaxation time with an interval of 30 min. The first T1 measurements were at the time when Gadovist was added to the plaque, and the last T1 measurements were after 2 h. Based on this result, we deduce that 2 h of incubation is the time when the accumulation of Gadovist reached its maximum in plaque.
To control ICG accumulation in the plaques and enable the adequate incubation time of plaque with ICG, the control T1 MRI measurements were performed on one sample. Based on these measurements, we selected an incubation time of 0.5 h. In our experiment, we included a control trial assessing the viability of cells left in saline without PDT at 0 h and 6.5 h using the Guava® MUSE® Cell Analyzer (Cytek Biosciences B.V., Amsterdam, The Netherlands). The viability at 0 h was 67.34% and at 6.5 h was 63.56%.
2.2.2. MRI Measurements
The OPTIMA 360 MRI system from General Electric Healthcare (GEHE, Boston, MA, USA) was used for this research. It is an apparatus based on a superconducting magnet with a magnetic field induction of 1.5 T. The parameters of the gradient system, such as the maximum amplitude and speed of gradient increase, were 33 mT/m and 120 T/m/s, respectively. The prepared plaques in Eppendorf tubes were placed in the center of the MRI magnet. The samples were scanned using a Fast Spin–Echo (FSE) (GEHE, General Electric Healthcare, Boston, MA, USA) sequence with an axial projection using a small flexible coil. The following scan parameters were used: field of view (FOV) = 10 × 10 cm; matrix = 320 × 224; NEX = 2.0; slice thickness = 1.0 mm; spacing = 0.5 mm. T1 relaxation time measurements were made in steps with the repetition time (TR) as follows: (A) TR = 500 ms, (B) TR = 700 ms, (C) TR = 1000 ms, (D) TR = 1500 ms, (E) TR = 2000 ms, (F) TR = 3000 ms, (G) TR = 5000 ms, (H) TR = 10,000 ms, and (I) TR = 15,000 ms with a fixed echo time (TE) of 23 ms. In the case of the T2 relaxation time, the TE time fluctuated: TE = 10 ms, (B) TE = 20 ms, (C) TE = 26.2 ms, (D) TE = 42 ms, (E) TE = 68 ms, (F) TE = 85 ms, (G) TE = 102 ms, (H) TE = 130 ms, (I) TE = 160 ms, and (J) TE = 200 ms, TR = 10,000 ms.
Gadovist (Figure 5) at a concentration of 1.0 mmol/mL (1 M) was applied to the tubes in a volume of 0.1 mL per tube. Gadovist contrast was added to the test samples to study the possible absorption and its effect on T1 and T2 relaxation times. A 2 h incubation time was used to allow Gadovist molecules to penetrate and accumulate in samples.
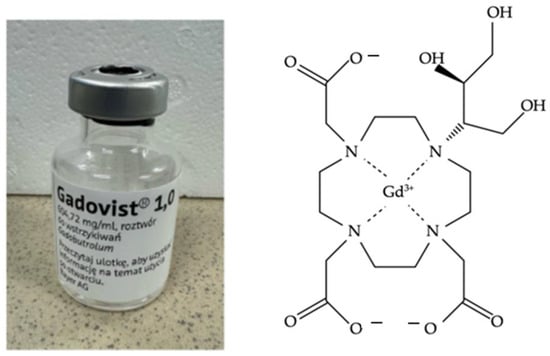
Figure 5.
Gadovist manufactured by Bayer AG and chemical structure.
2.2.3. PDT with Indocyanine Green
The stock solution of ICG (Figure 6) was prepared with concentrations of 2 μg of ICG/1 mL water, corresponding with the literature value for the use of ICG in humans (2 mg/1 kg body mass) [47]. Then, 0.1 mL of ICG at a concentration of 1.8 × 10⁻⁵ M in water solution was added to each sample of plaques.
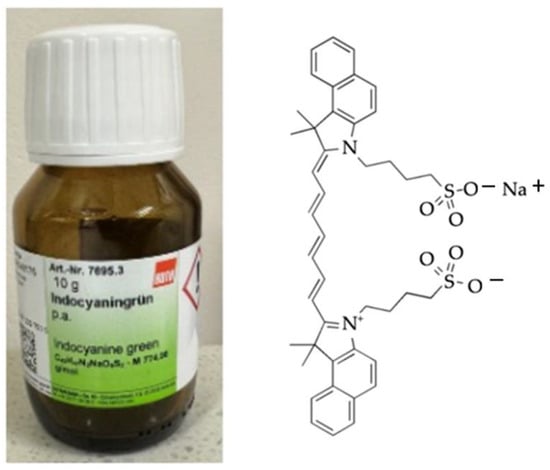
Figure 6.
ICG (manufactured by Carl Roth (Karsruhe, Germany) and chemical structure.
The plaque treated with 1.8 × 10⁻⁵ M ICG were irradiated for 30 min with a 400 W halogen bulb LED Diall IP54 0203H (Warsaw, Poland) (Figure 7). The distance between the halogen bulb and plaque sample was adjusted to avoid excessive heating or drying of the plaque. The tubes with plaque were placed in a vessel containing cold water with ice cubes.
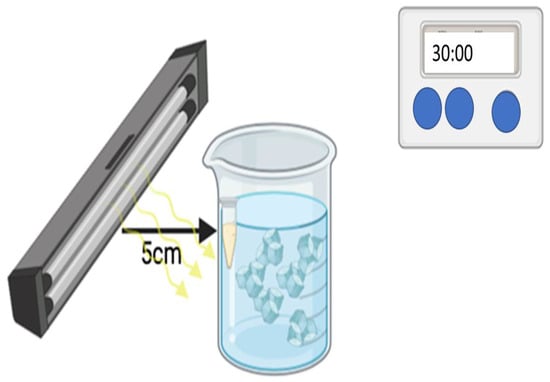
Figure 7.
Scheme showing the procedure of PDT using LED Diall IP54 0203H (Warsaw, Poland).
A nominal power of 400 W positioned 5 cm from the surface of the sample. The lamp emits radiation isotropically, and the optical efficiency of the system is approximately 50%, corresponding to an effective optical output power of 200 W.
Under these assumptions, the light energy is distributed over the surface of a sphere with a radius of 5 cm, giving a total surface area of:
A = 4πr2 = 4π (0.05)2 ≈ 314 cm2
For an illuminated sample area of 1 cm2, the power density at the sample surface is:
200 W/314 cm2 ≈ 0.636 W/cm2
With an exposure time of 30 min (1800 s), the total light energy density delivered to the sample surface is estimated as:
0.636 W/cm2 × 1800 s = 1145 J/cm2
2.2.4. Histological Sample Preparations for Microscope Examination
Samples of plaques before and after PDT were stained with common histological stain live and dead staining Abcam (Cambridge, MA, USA). The finished slides were examined under a microscope by Zeiss Axio Imager. D2 (Oberkochen, Germany). Such tissue preparation was applied to each mentioned stage of microscopic examination in Figure 4 [48] using bright-field microscopy and fluorescence microscopy.
2.2.5. Statistical Analysis
A statistical model was applied to compute differences between T1 and T2 changes in plaque tissues. Variability within samples was modeled as a random effect to account for repeated measurements acquired from the same patient. Normally distributed data were summarized using mean ± standard deviation (S.D.). Differences between time points were analyzed using a paired t-test. Data analysis was performed using Statistica 13.1 software (StatSoft Polska Sp. z o.o., Krakow, Poland). Throughout this study, p-values less than 0.05 are considered statistically significant and are indicated by a single asterisk (*). Statistical significance of the changes is decided by Student's t-test for dependent samples.
3. Results
3.1. MRI
Boxplots illustrating the distribution of T1 and T2 values (Figure 8) for all experimental conditions have been added (Figure 9B and Figure 10B) to enhance visual clarity.
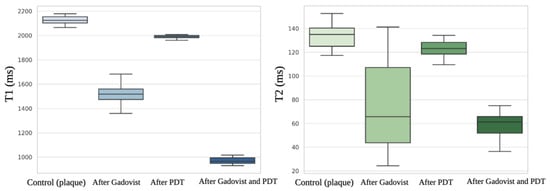
Figure 8.
T1 and T2 values.
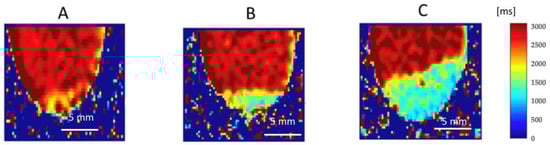
Figure 9.
Quantitative native T1 maps reflect the longitudinal (spin-lattice) relaxation time, which describes how quickly the net magnetization returns to equilibrium along the direction of the magnetic field (B0). The T1 relaxation times are expressed in milliseconds (ms), with corresponding signal intensities indicated by the color scale shown on the right side of the figure. This allows for direct, pixel-by-pixel measurement of T1 values within a selected Region of Interest (ROI). T1 distributions were analyzed across all samples and treatment conditions: (A) before administration of Gadovist, (B) after administration of Gadovist, and (C) after both Gadovist administration and PDT.
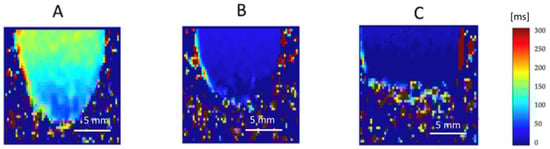
Figure 10.
Quantitative native T2 maps represent the perpendicular relaxation time. The T2 relaxation time, also known as the spin–spin relaxation time or perpendicular relaxation time, is a measure of how quickly the spins exchange energy in the “xy” plane. The range of signal intensity corresponds to the value of T2 relaxation time (ms) and color scale located on the right side of the figure. Due to this, the relaxation time in the chosen Region of Interest can be readied pixel by pixel directly from the T2 map. T2 distribution was measured for all samples and treatment types, such as (A) before Gadovist implementation; (B) after Gadovist implementation; (C) after Gadovist implementation and PDT.
The quality of the MRI images of the biological samples is related to the water content. The general principle for T1 mapping was to acquire multiple images with different T1 weightings and to fit the signal intensities of the images to the equation for T1 relaxation (Figure 9). T1 times were determined for regions of interest, which in our study was every samples taken for MRI measurements.
MRI analysis of the water solution collected from plaques storage confirm the presence of water with T1 = 2789 ± 11.09 ms (95% CI: 2783.8–2794.2) and T2 = 151 ± 03.05 ms (95% CI: 149.3–152.7), without any detectable amount of plaques tissue. Together with sample hydronation, the T1 and T2 relaxation time is increased. The averaged T1 value for n = 12 samples of control plaque before Gadovist and ICG administration was 2100.15 ± 35.3 ms (95% CI: 2026.1–2174.2, Figure 9A). The averaged T2 value for n = 12 samples of plaque before Gadovist and ICG administration was 130.23 ± 15.09 ms (95% CI: 121.4–139.0, Figure 10A).
Following MRI measurements, a PDT experiment with ICG was performed. We observed that using MRI to assess PDT's effectiveness is a creative approach. In this investigation, the PDT-treated plaque samples showed lower T1 and T2 values than the pre-PDT plaque. The mean T1 value of the post-PDT samples was 1998.10 ± 23 ms (95% CI: 1984.0–2012.2), and the post-PDT-averaged T2 was 127 ± 10.10 ms (95% CI: 120.2–133.7).
After Gadovist administration, the mean T1 was 1510.33 ± 76.11 ms (95% CI: 1446.1–1574.6), and the mean T2 was 78.89 ± 32.01 ms (95% CI: 60.2–97.5). The influence of Gadovist on samples caused a decrease in both T1 and T2 relaxation times compared to control plaques. T1 clearly showed that samples after Gadovist administration had shorter values, corresponding to Gadolinium tissue penetration. Gadolinium molecules shorten the spin-lattice relaxation time (T1) where they are present. The relative mean decrease in T1 was 28.1%, and for T2 it was 39.4%.
The T1 relaxation time in post-Gadovist samples used for PDT showed a mean value of 980.23 ± 32.61 ms (95% CI: 958.2–1002.3), corresponding to a 53.3% relative decrease compared to the control group. The T2 relaxation time after PDT and Gadovist was 50.34 ± 13.02 ms (95% CI: 42.1–58.6), representing a 61.4% reduction relative to control (Table 1). After 2 hours of Gadovist incubation, T1 and T2 values were consistent with those at 1.5 hours, confirming the appropriateness of the 2-hour time point.

Table 1.
The average of T1 and T2 relaxation time at each step of experiment according to procedures stated in Figure 3.
MRI and PDT are valuable tools for plaque research, offering benefits in monitoring, treatment evaluation, and understanding mechanisms. This study supports the use of T1 and T2 MRI to assess plaque characteristics, as we observed statistically significant reductions. However, while changes in T1 may reflect Gadovist diffusion, they do not directly confirm increased singlet oxygen diffusion or enhanced cytotoxicity. Further studies with specific singlet oxygen detection and cell assays are necessary.
MRI and PDT are valuable tools for plaque research, offering benefits in plaque monitoring, treatment evaluation, and understanding underlying mechanisms. This study further supports the use of T1 and T2 MRI to assess plaque tissue characteristics, as we observed a statistically significant reduction in both T1 and T2 relaxation times. We noted lower T2 values for the plaque samples after Gadovist and PDT treatment. The observed reduction in T1 values in the plaque after Gadovist and after PDT with ICG group suggests an interaction between Gadovist and the plaque tissue that may influence the PDT outcome. However, T1 mapping alone does not provide direct evidence of increased singlet oxygen (1O2) diffusion or enhanced cell destruction. Further studies using singlet oxygen-specific detection methods and cellular assays are necessary to elucidate the underlying mechanisms and verify whether Gadovist facilitates greater 1O2 diffusion or cytotoxicity. This quantitative MRI protocol offers a promising approach for the early evaluation of PDT efficacy and could aid in optimizing treatment parameters.
The ICG sensitizer was able to diffuse to plaque beyond those in direct contact with Gadovist solution. The net movement of ICG molecules was in the direction of lower concentration and did not depend much on the amount released. The ICG photosensitizer diffused laterally by 3.0 ± 0.2 mm for the top of solution without Gadovist and by 4.5 ± 0.5 mm for top of solution without Gd. The absorption of ICG after Gadovist administration increased by 10 times. This corresponds to the changes in values of both T1 and T2 relaxation times.
3.2. Microscopy Results
The image set consists of four microscopic panels labeled A, B, C, and D, illustrating the effects of PDT on a plaque-like structure. The images provide both visible light microscopy and fluorescence-based live/dead staining to assess structural and cellular changes before and after treatment. Figure 11A presents a grayscale microscopic image of the plaque before PDT treatment. The structure appears dense with distinct bright and dark regions, suggesting variations in texture and composition. The bright areas may correspond to more compact or reflective regions, while the darker areas could represent softer or less dense material. Figure 11B, taken under the same conditions after PDT treatment, shows visible changes in the plaque’s structure. The image appears more diffused, with less defined bright areas, indicating possible structural degradation or breakdown. This suggests that PDT has disrupted the plaque, likely causing cellular damage and altering its physical composition. Figure 11C displays the plaque before PDT using live/dead staining, where green fluorescence represents viable (live) cells and red fluorescence indicates non-viable (dead) cells. Most of the plaque fluoresces green, suggesting a high proportion of living cells. There are some red-stained areas, but they are sparse compared to the green regions, indicating minimal cell death before treatment. Figure 11D shows the same staining method applied after PDT treatment. Here, a striking transformation is evident—red fluorescence dominates the image, suggesting a significant increase in dead or damaged cells. The green fluorescence is notably reduced, indicating that many initially viable cells have been killed or compromised by PDT. This shift in fluorescence from green to red provides direct evidence of the treatment’s effectiveness in inducing cell death within the plaque. The comparison between A and B demonstrates structural disruption of the plaque due to PDT, while the shift from C to D highlights the cellular impact, with widespread cell death occurring post-treatment. The effectiveness of PDT is visually confirmed by the transition from a mostly green-stained, viable plaque to a predominantly red-stained, non-viable structure. All four images have a 100 μm scale bar, emphasizing that these are microscopic views. The comparison between grayscale and fluorescence imaging highlights both the structural and biochemical changes occurring in response to ICG-PDT. The observed alterations suggest that the therapy may have successfully targeted pathological components within the plaque, potentially reducing its burden or altering its composition.
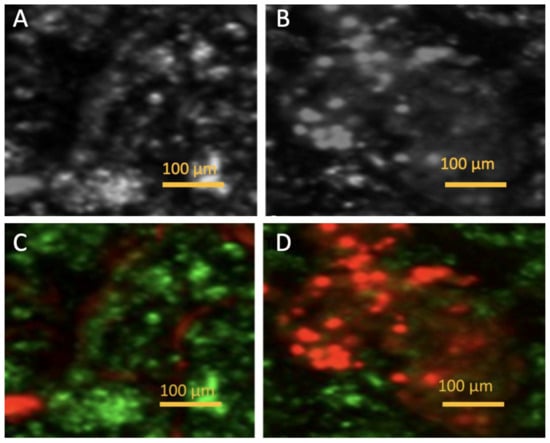
Figure 11.
Microscopic images. (A) (bright-field microscopy) and (C) (fluorescence microscopy with live/dead staining) show plaque before PDT. (B) (bright-field microscopy) and (D) (fluorescence microscopy with staining) show plaque after PDT treatment.
4. Discussion
The diagnosis and treatment of arteriosclerosis is an important healthcare issue. Atherosclerosis is an active cellular process, and the atherosclerotic plaque is a collection of various migrating, proliferating, and infiltrating cells (mainly macrophages, T lymphocytes, and smooth muscle cells) along with immune triggers such as oxidized LDL, infectious agents, heat shock proteins, and other factors yet to be discovered [77]. In many biological processes, including oxidative stress, inflammation, and cellular damage, the presence of singlet oxygen is essential. Because of its effects on lipid peroxidation, endothelial dysfunction, and the inflammatory response, singlet oxygen has been linked to the development, instability, and rupture of plaque in the context of atherosclerosis [78,79]. Clarifying the processes that propel plaque development and rupture requires an understanding of the diffusion of singlet oxygen within the atherosclerotic plaque [80]. In an excited state, singlet oxygen is a very reactive, transient molecule. It is produced by biological mechanisms like the activation of NADPH oxidases in inflammatory cells or by the interaction of light with PSs during procedures like PDT [81,82]. In biological tissues, the diffusion of singlet oxygen is very limited due to its short half-life (nanoseconds to microseconds) and its strong reactivity with surrounding molecules, such as lipids, proteins, and nucleic acids [83]. However, the local context of inflammation and oxidative stress in atherosclerotic plaques may promote the formation and diffusion of singlet oxygen, especially in necrotic cores that are rich in lipids or when inflammatory cells such as neutrophils and macrophages are present [84,85]. The local concentration of ROS-generating enzymes, the presence of inflammatory cells, and the nature of the plaque all affect the diffusion of atherosclerotic plaques. The number of cells and extracellular matrix components also affects its ability to diffuse across the plaque, which can either help or inhibit its spread [86,87]. Advanced imaging techniques have been employed in several clinical trials and research to evaluate the role of singlet oxygen in atherosclerosis, specifically in relation to oxidative stress and plaque susceptibility. These studies frequently examine the role that oxidative damage—mediated by singlet oxygen and other ROS—plays in atherosclerotic plaque instability and cardiovascular event risk. The 2019 study [88] investigated how a tailored antioxidant therapy affected oxidative stress and inflammation in atherosclerosis patients using fluorescence imaging and confocal microscopy. The authors showed that the targeted antioxidant treatment increased plaque stability and decreased singlet oxygen levels in plaque macrophages. According to the study, oxidative damage that destabilized plaques and raised their risk of rupture was largely caused by singlet oxygen production in macrophages, especially in lipid-rich regions of the plaque. Plaques were stabilized by lowering singlet oxygen levels within them through the modulation of antioxidant pathways, demonstrating the possibility of preventing cardiovascular events by addressing oxidative stress. The use of singlet oxygen in PDT to treat atherosclerosis without the need for external light is examined in a study by Mu d. et al. [89]. For stability and magnetic resonance imaging (MRI), the researchers created a system of polymeric nanoparticles (FeCNPs) cross-linked with a Fe3+-catechol complex and loaded with chemical fuel and PS. By building up in atherosclerotic plaques, the FeCNPs improved MRI contrast and decreased the thickness and size of the plaque. The therapy successfully reduced inflammation markers (CD68, MCP1, and TNFα), got rid of macrophages, and stopped the condition from becoming worse. Notably, FeCNPs showed activity in the abdominal aortae and aortic arches at lower doses than at higher levels. This study offers a novel strategy for targeted atherosclerosis treatment by showcasing the potential of integrating MRI and chemiexcited PDT. The next study investigated [90] the role of singlet oxygen in the formation of atheronal-A (ChSeco), an oxidized cholesterol species implicated in atherosclerosis and Alzheimer’s disease. It is thought that singlet oxygen-mediated oxidations produce ChSeco in inflammatory sites. ChSeco exposure causes cellular oxidative stress in H9c2 cardiomyocytes, mainly due to glutathione depletion and an increase in reactive oxygen species (ROS), especially hydrogen peroxide (H2O2). The work emphasizes how ChSeco-induced cytotoxicity involves the plasma membrane NADPH oxidase system (NOS) as a major source of H2O2. By blocking NOS with apocynin (Apo) and diphenyleneiodonium chloride (DPI), oxidative damage and H2O2 production were decreased, cytotoxicity was lessened, and mitochondrial dysfunction was prevented. These results imply that the cytotoxic effects seen in atherosclerosis-related cell damage are partly caused by the singlet oxygen-driven synthesis of ChSeco and the subsequent generation of ROS by NADPH oxidase. The oxidative species implicated in the oxidation of low-density lipoprotein (LDL) by macrophages, a crucial step in atherosclerosis, were investigated by Wilkins GM. et al. [91]. The findings imply that hydrogen peroxide (H2O2) contributes to LDL oxidation, whereas singlet oxygen and hydroxyl radicals probably do not. Superoxide anions are also examined in the study. However, their relevance is yet unknown because of inconsistent results using manganese SOD (Mn-SOD) and copper-zinc superoxide dismutase (Cu/Zn-SOD) in the studies. Mn-SOD continuously prevented LDL oxidation, but Cu/Zn-SOD had inconsistent effects. Overall, the study concludes that more research is required to pinpoint the precise reactive species involved in LDL oxidation by macrophages, and that superoxide’s participation in this process is still unclear. The significance of antibody-catalyzed water oxidation in atherosclerosis was examined by other scientists [92], with a particular emphasis on the production of oxidants from singlet oxygen (1O2). The findings demonstrate that incubating human leukemia THP-1 monocytes with phorbol myristate acetate and human immunoglobulin G resulted in the production of both hydrogen peroxide (H2O2) and ozone (O3). These monocytes accumulated lipids and formed foam cells when they were also exposed to low-density lipoprotein (LDL). Vinylbenzoic acid dramatically reduced the rise in intracellular lipids, whereas catalase only marginally reduced it. This suggests that ozone (O3), not hydrogen peroxide, is more important in the development of atherosclerosis through antibody-catalyzed water oxidation. This demonstrates how singlet oxygen may be involved in the production of these oxidants and the buildup of lipids in atherosclerosis. These studies suggest that controlling oxidative stress, particularly through the modulation of singlet oxygen levels, may help stabilize plaques and reduce the risk of cardiovascular events. ICG is FDA-approved for clinical use, particularly in liver function tests and angiography, but has also found utility in studying and treating cardiovascular diseases like atherosclerosis. ICG can be used for non-invasive imaging of atherosclerotic plaques due to its ability to absorb and emit light in the near-infrared (NIR) range [93,94]. This feature makes it highly suitable for use in various imaging modalities, particularly for visualizing blood vessels and plaque structures in vivo. ICG binds to plasma proteins when injected into the bloodstream, allowing it to circulate throughout the vascular system. Its near-infrared fluorescence can then be detected using specialized imaging devices. ICG can highlight areas of abnormal blood flow or tissue abnormalities in atherosclerotic lesions, assisting in the identification of plaque formations, particularly in high-risk areas like the carotid or coronary arteries [95]. ICG fluorescence has been used to differentiate between stable and unstable plaques, as areas of necrotic core or inflammation often exhibit distinct fluorescence profiles. In surgeries involving atherosclerosis, such as CABG or endarterectomy, ICG can be used for real-time visualization of plaque or vessel integrity, guiding surgical decisions. PDT is an emerging therapeutic approach that involves the use of photosensitizing agents, like ICG, to target and treat atherosclerotic plaques [96]. When exposed to specific wavelengths of light, these agents become activated, producing ROS, such as singlet oxygen, that can selectively damage target tissues. ICG is an effective PS because of its ability to absorb light in the near-infrared spectrum. When exposed to NIR light (typically at 750–800 nm), ICG undergoes a photochemical reaction that generates ROS, including singlet oxygen [97]. This ROS can cause cellular damage, leading to the breakdown of the atherosclerotic plaque. ICG selectively accumulates in the lipid-rich and necrotic areas of atherosclerotic plaques due to its affinity for lipoproteins and the altered permeability of inflamed endothelial cells [98]. However, it is a new strategy in atherosclerosis treatment approaches. There is still a lack of much evidence supporting the effect of PDT and appropriate parameters that are not harmful to the patient’s health. The possibility of ICG-mediated ICG-PDT for the treatment of keloids, a difficult skin condition, was investigated by Shao J. et al. [99] In order to optimize PDT for keloid treatment, the researchers compared various therapeutic modalities, such as ICG-PDT, in vitro (Figure 12). The findings showed that, particularly when the photodynamic mechanism was triggered, ICG-PDT efficiently suppressed keloid fibroblast migration and activity, causing autophagy, apoptosis, and a reduction in collagen synthesis. These effects were remarkably attained at low medication concentrations. These results led to the researchers’ effective application of ICG-PDT in a clinical situation, which enhanced therapy results. The study shows that ICG-PDT has a great deal of therapeutic promise for the treatment of clinical keloid. In a randomized controlled trial, Labban N. et al. [100] assessed the effectiveness of ICG-PDT in treating peri-implantitis in patients with diabetes mellitus (DM) as a supplement to peri-implant manual debridement (PIMD). ICG-PDT + PIMD or PIMD alone was used to treat 48 DM patients with 64 implants. At baseline, three months, and six months, clinical, radiographic, and microbiological parameters were evaluated. Clinical indicators such as plaque index (PI), bleeding on probing (BOP), and probing depth (PD) significantly improved in both groups. After six months, however, the ICG-PDT group’s results in PD, suppuration, and crestal bone loss (PCBL) were noticeably better. Furthermore, Porphyromonas gingivalis and Treponema denticola decreased significantly and continuously with ICG-PDT in comparison to baseline, although PIMD only showed decreases after three months. Interleukin (IL)-1β and IL-6 levels decreased in both groups at three months, but by six months, these decreases had not been sustained. According to the study’s findings, treating peri-implantitis in DM patients with numerous applications of ICG-PDT yields superior clinical and microbiological results than PIMD alone. Afroozi B. et al. [101] investigated the efficacy of ICG-PDT combined with nystatin mouthwash (PDT + nystatin) for treating denture stomatitis, comparing it to routine antifungal therapy with nystatin alone. According to the study’s findings, ICG-mediated PDT in conjunction with nystatin provides a safe and efficient substitute for conventional antifungal treatment for denture stomatitis. Yannuzzi LA. et al. [102] investigated the use of verteporfin in conjunction with ICG- PDT to treat chronic central serous chorioretinopathy (CSC). Fluorescein angiography, optical coherence tomography, and ICG angiography were utilized to diagnose and track the problem in 20 eyes from 15 individuals. Results were seen when PDT was applied to regions of choroidal hyperpermeability. According to the findings, ICG-guided PDT caused retinal detachments to completely resolve in 12 eyes and partially resolve in 8 eyes. After six weeks, there was a marginally significant mean improvement of 0.55 lines in visual acuity in six eyes. There were no documented negative effects from the treatment. The study finds that ICG-guided PDT with verteporfin may help resolve exudative detachments and enhance visual acuity in chronic CSC, suggesting potential for additional investigation. Elevated cholesterol alone is sufficient for the development of atherosclerosis. Other factors accelerate the development of the disease [103]. Hamblin et al. performed initial experiments on intravascular PDT using BSA-ce6-mal in this model. Twenty-four hours after intravenous injection of 2 mg/kg BSA-ce6-mal, rabbits were anesthetized, and a 3 cm diffusion fiber with an outer diameter of 200 mm was inserted into the femoral artery and advanced to the mid-abdominal aorta. Two hundred joules of 660 nm light per cm of diffusion tip length were administered through flowing blood, and rabbits were sacrificed 8 days later. Examination of aortic segments by histology and immunohistochemistry revealed a significant 69% reduction in the number of macrophages present in irradiated sections compared with the number in unilluminated sections. The question remains how long this reduction in macrophages will last and whether other markers of inflammation and susceptibility will also be reduced [104]. Recent studies exploring T1 and T2 relaxation times in atherosclerosis are breaking new ground for several reasons, highlighting their potential as diagnostic and prognostic tools in cardiovascular disease. Recent advancements in MRI techniques, advanced pulse sequences, and improved spatial and temporal resolution now allow researchers to capture much more detailed information about tissue composition [92]. These advances enable more accurate and sensitive measurements of T1 and T2 relaxation times in the arterial wall and plaques. High-resolution imaging is particularly crucial for assessing the microstructural heterogeneity of atherosclerotic plaques and correlating relaxation time changes with underlying tissue characteristics such as lipid content, calcification, or inflammation [93,94]. Modern studies are beginning to focus on the link between T1 and T2 relaxation times and specific plaque components. By correlating T1 and T2 times with specific plaque components, researchers are beginning to develop more precise non-invasive techniques to assess plaque vulnerability, potentially identifying plaques at risk of rupture before clinical events occur. Atherosclerosis often progresses asymptomatically until it reaches advanced stages. Early detection, particularly of plaque inflammation and lipid accumulation, is crucial for preventing adverse outcomes. T1 and T2 relaxation times can provide a means of detecting early changes in plaque composition, potentially identifying patients at risk even before clinical symptoms appear. This ability to diagnose atherosclerosis at earlier stages could lead to more effective preventive measures. Although the study of T1 and T2 relaxation times in atherosclerosis has been limited, emerging research is uncovering the potential of these parameters as non-invasive biomarkers for plaque characterization and risk assessment [95]. Recent advancements in MRI technology and a better understanding of the microstructural changes in atherosclerotic plaques have enabled more accurate measurements of T1 and T2 times, revealing new insights into the disease’s progression. As the field continues to evolve, these studies hold promise for revolutionizing the diagnosis, monitoring, and treatment of atherosclerosis, particularly in identifying vulnerable plaques that could lead to serious cardiovascular events. In this way, the exploration of T1 and T2 relaxation times in atherosclerosis could significantly improve patient outcomes through earlier detection and more targeted therapeutic approaches [96,97,98,99,100,101,102,103,104]. An inventive method of evaluating PDT’s efficacy is to use MRI to evaluate it. T1 and T2 values were lower in the PDT-treated tissues in this experiment than in the pre-PDT-treated tissues. The pre-PDT tissue’s mean T1 value was 1510.33 ± 76.11 ms, while the post-PDT tissue’s was 980.23 ± 32.01 ms. The pre-PDT tissue’s mean T2 value was 78.89 ± 32.61 ms, while the post-PDT tissue’s was 50.34 ± 13.02 ms. After PDT on atherosclerotic tissue in vitro, both T1 and T2 relaxation times dropped. This might be because tissue loses water, and the effect grew as the sample size’s mass shrank. Under in vivo conditions, when processes like edema and increased hypoxia tend to elevate T1 and T2, this decrease in T1 and T2 is not anticipated to occur. A recent study found that tissue edema and swelling caused a modest rise in T1, which was accompanied by an increase in T2 relaxation time evaluated after PDT of the brain in vivo [105]. The declines in T1 and T2 in these tests were caused by tissue water loss. In agreement with this work, the literature shows that the changes in the T1 and T2 values before and after PDT are significant, which makes MRI a non-invasive imaging method for monitoring PDT-induced changes. Microscopy plays a crucial role in studying atherosclerosis, allowing us to examine the structural and cellular characteristic of atherosclerotic plaques in detail. Different types of microscopes and imaging techniques are used to analyze the progression, composition, and effects of therapies on atherosclerosis [106]. We can observe basic structural analysis of tissue sections in light microscopy. This method is widely used for assessing the general architecture of atherosclerotic plaques, including the presence of fatty streaks, fibrous caps, and calcifications. Fluorescence microscopy can be used to visualize specific cellular components and molecular markers. Fluorescence microscopy is particularly useful for studying inflammation, cell signaling, and cellular interactions in atherosclerotic plaques [107]. PDT can selectively kill the cells, while MRI provides noninvasive imaging on our interior bodies. If these two techniques combine, the probe can act as both PDT and MRI agent at the same time. These theranostic agents can bring great efficiency in cancer treatment. The studies that have been presented make it abundantly evident that singlet oxygen is an active participant in important processes like lipid peroxidation, endothelial dysfunction, and inflammatory responses within atherosclerotic plaques rather than just a byproduct of biological reactions. Acute cardiac events are frequently directly associated with plaque rupture caused by an imbalance in the oxidative microenvironment, and these oxidative mechanisms also contribute to plaque instability. In this context, ICG-PDT emerges as a promising approach to selectively target pathological cells, particularly inflammatory macrophages, within atherosclerotic lesions. ICG-PDT induces the production of singlet oxygen and other ROS, which may contribute to plaque stabilization and reduce local inflammation [108,109]. However, this therapeutic strategy requires special caution. While controlled ROS generation can selectively destroy destabilizing macrophages and promote plaque stability, excessive or nonselective ROS production risks exacerbating oxidative stress and plaque destabilization. Therefore, the selectivity of ICG owing to its affinity for lipid-rich necrotic areas and inflammatory macrophages enables localized activation of therapy, sparing healthy tissue [93,109]. Several studies underscore the therapeutic potential of ICG-PDT in atherosclerosis. Waksman R. et al. demonstrated a dramatic reduction in macrophage populations within plaques (98% reduction at 7 days, 92% at 28 days), facilitating smooth muscle cell proliferation and plaque stabilization [108]. Recent 2023 data reveal that ICG preferentially accumulates in lipid-rich macrophages and LDL/HDL-containing structures, further enhancing treatment precision [93]. Moreover, Lin et al.’s rat model studies showed that repeated ICG-PDT sessions significantly reduced intimal thickness and mitigated vessel stenosis without serious adverse effects [110]. Nonetheless, clinical validation of ICG-PDT remains necessary to carefully balance therapeutic efficacy against potential oxidative damage in the complex plaque microenvironment. A key enabler for advancing ICG-PDT applications is the integration of MRI, especially with T1 and T2 relaxation time mapping. MRI can noninvasively track plaque composition, monitor treatment response, and facilitate mechanistic research. Truong M. et al. demonstrated that T1/T2* mapping effectively categorizes plaque components ex vivo, which may help identify plaques at risk of rupture [111]. These findings align with Wang Y. et al., who showed that combined T1, T2, and T2* mapping reliably differentiates various intraplaque structures [112]. Our own results, consistent with previous research, show that gadolinium-based contrast agents like Gadovist penetrate plaques efficiently, decreasing T1 and T2 relaxation times by creating local magnetic field disturbances and enhancing tissue contrast [113]. The decrease in T2 may also reflect increased concentrations of reactive products such as singlet oxygen. Interestingly, samples treated with ICG-PDT alone showed longer T1 and T2 times compared to those pre-treated with Gadovist, potentially indicating a higher number of viable cells. Prior studies by T Lin JS. et al. found that ICG-PDT inhibits arterial intima hypertrophy and induces apoptosis of smooth muscle cells [110]. The observed tenfold increase in ICG absorption following Gadovist administration suggests a synergistic effect between photodynamic therapy and contrast-enhanced MRI. Supporting this, Verma et al. reviewed the dual theranostic role of ICG as both an imaging agent and therapeutic carrier, enabling simultaneous diagnosis and treatment of plaques [114]. The capacity of MRI with T1/T2 mapping to visualize signal distribution at a pixel level greatly advances plaque structure analysis in both large and small vessels. This methodology has been successfully applied in coronary and carotid artery studies [115,116,117]. Quantitative MRI thus holds promise to guide clinical decisions in photodynamic therapy by evaluating tissue responses and predicting disease recurrence. Given these advantages, further development of combined ICG-PDT and MRI approaches is warranted for both in vivo and ex vivo research, aiming to optimize the therapeutic targeting of atherosclerotic plaques while minimizing risks. The findings support our primary hypothesis, which is that Gadovist enhances MRI sensitivity to PDT-induced changes in plaque tissue. T1 and T2 relaxation times significantly decreased after receiving both Gadovist and PDT treatment, indicating better tissue interaction and contrast for evaluating therapy response. To ascertain whether this effect is caused by altered plaque permeability, synergistic contrast, or improved ICG penetration, more in vivo studies are required. Nonetheless, the findings imply that gadolinium-contrasted MRI could be employed as a non-invasive measure of PDT efficacy.
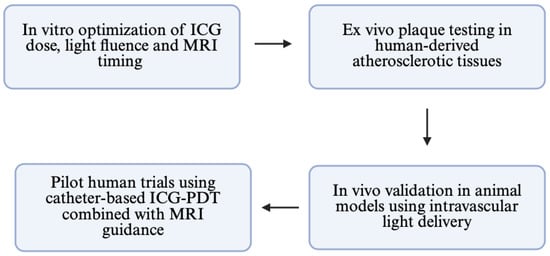
Figure 12.
Conceptual roadmap for bench-to-bedside translation of MRI-guided ICG-PDT.
5. Limitations
This study is subject to several limitations. First, the small sample size (n = 12 per group) limits statistical power and generalizability. Second, the complex environment of in vivo plaque, which includes tissue heterogeneity, immunological response, and dynamic perfusion, was not precisely replicated because the trials were conducted in vitro. Third, the use of cylindrical tubes for MRI scanning may introduce geometric artifacts or inhomogeneities into the magnetic field, which could affect relaxation time measurements. They cannot be totally ruled out, despite being diminished by repeated acquisitions and standardized location. Lastly, even if changes in T1/T2 point to molecular and structural changes, our method does not use real-time oxygen monitoring, such as phosphorescence-based O2 sensors or probes unique to singlet oxygen. Such tools would allow future studies to more precisely assess photodynamic efficacy at the molecular level. However, this research is a prelude to further studies which will be carried out considering all variables. Another limitation is the uncertain penetration depth of the NIR light source used in the ICG-PDT protocol (Figure 12).
While ICG absorbs light efficiently in the 780–810 nm range, the effective light penetration into plaque tissue is limited to approximately 2–4 mm, depending on its composition and calcification. In thicker or fibrotic plaques, this may result in the incomplete treatment of deeper layers. In future implementations, diffusing-tip fiber catheters or endovascular balloon-integrated optics could help enhance light delivery and uniformity in complex lesions. Also, our photosensitizer ICG, while widely used as a near-infrared photosensitizer, has several inherent limitations. First, its tissue penetration is restricted to approximately 2–4 mm due to the absorption and scattering of light in biological tissue. This limits its effectiveness for treating thick or calcified plaques. Second, ICG has a short plasma half-life (~3–5 minutes), making timing of administration and light exposure critical. Furthermore, real-world clinical translation poses several technical challenges. Delivering uniform NIR light to atherosclerotic lesions in vivo is complex, especially in tortuous or small-diameter vessels. Current endovascular tools would require the integration of light-diffusing fiber optics and contrast-delivery systems in a compact form factor. Moreover, MRI-guided PDT would necessitate the synchronization of imaging and therapy systems, potentially increasing procedural time and cost. To address these barriers, our next steps include validation of this MRI-PDT platform in atherosclerotic animal models (e.g., ApoE−/− mice or rabbit models with diet-induced plaques). These models will allow real-time intravascular light delivery via custom fiber-optic catheters, and the validation of imaging markers. Following this, we aim to design a pilot feasibility study in humans, focusing on endovascular PDT safety and T1/T2 imaging readouts. Development of a dual-mode catheter is necessary for contrast with light delivery.
6. Conclusions
These findings suggest that quantitative MRI, in particular T1 and T2 relaxation mapping, can be employed as a theragnostic method to assess PDT efficacy in real time. This approach enables the use of a single imaging procedure for both therapy monitoring and diagnosis. Building on our in vitro results, future studies will focus on in vivo validation using animal models of atherosclerosis. Catheter-based ICG and light delivery will mimic clinical conditions in these models. These models provide a framework for the planning and evaluation of imaging-guided therapy and are readily translated from the MRI sequences improved in this work. This strategy may eventually be improved into a clinically beneficial platform that enables image-guided, minimally invasive therapy by combining contrast-enhanced MRI with targeted PDT. A promising treatment approach for individuals with cardiovascular disease, PDT in atherosclerosis seeks to eliminate atherosclerotic plaques selectively without causing harm to healthy artery segments. The MRI protocol presented in this study was performed in a clinical MRI scanner and therefore can be transferred to a clinical acquisition rather straightforwardly. PDT research could greatly benefit from this quantitative and early evaluation technique, for example to study the efficacy of new photosensitizers or different treatment protocols, or to provide new insights in the mechanisms of PDT. The proposed method might be applicable to intravascular clinical settings. In clinical practice, ICG may be administered via a balloon catheter or microcatheter, and near-infrared light may be transmitted via fiber-optic probes integrated into the catheter wall. Simultaneous or sequential MRI scanning would enable real-time imaging-guided PDT planning, optimize treatment timing and intensity, and monitor T1/T2 changes.
Author Contributions
Conceptualization, P.W., W.M., D.B.-A., D.L., A.T. and D.A.; methodology, P.W., W.M., D.B.-A., D.L., A.T. and D.A.; validation, P.W., W.M., D.B.-A., D.L., A.T. and D.A.; formal analysis, P.W., W.M., D.B.-A., D.L., A.T. and D.A.; resources, P.W., W.M., D.B.-A., D.L., A.T. and D.A.; writing—original draft preparation, P.W., W.M., D.B.-A., D.L., A.T. and D.A.; writing—review and editing, P.W., W.M., D.B.-A., D.L., A.T. and D.A.; visualization, P.W., W.M., D.B.-A., D.L., A.T. and D.A.; supervision, P.W. and D.A. All authors have read and agreed to the published version of the manuscript.
Funding
This research received no external funding.
Institutional Review Board Statement
The study was done according to Bioethical Certificate no 43/2024/B (approved on: 9 September 2024) issued by the Bioethics Committee of the District Medical Chamber in Rzeszów.
Informed Consent Statement
Informed consent was obtained from all subjects involved in the study.
Data Availability Statement
All data has been included.
Conflicts of Interest
The authors declare no conflicts of interest.
References
- Lusis, A.J. Atherosclerosis. Nature 2000, 407, 233–241. [Google Scholar] [CrossRef]
- Wilson, H.M.; Barker, R.N.; Erwig, L.-P. Macrophages: Promising Targets for the Treatment of Atherosclerosis. Curr. Vasc. Pharmacol. 2009, 7, 234–243. [Google Scholar] [CrossRef] [PubMed]
- Grenon, S.M.; Vittinghoff, E.; Owens, C.D.; Conte, M.S.; Whooley, M.; Cohen, B.E. Peripheral artery disease and risk of cardiovascular events in patients with coronary artery disease: Insights from the Heart and Soul Study. Vasc. Med. 2013, 18, 176–184. [Google Scholar] [CrossRef] [PubMed]
- Pahwa, R.; Jialal, I. Atherosclerosis; StatPearls: Treasure Island, FL, USA, 2024. [Google Scholar]
- Mudau, M.; Genis, A.; Lochner, A.; Strijdom, H. Endothelial dysfunction: The early predictor of atherosclerosis. Cardiovasc. J. Afr. 2012, 23, 222–231. [Google Scholar] [CrossRef] [PubMed]
- Stary, H.C.; Chandler, A.B.; Dinsmore, R.E.; Fuster, V.; Glagov, S.; Insull, W., Jr.; Rosenfeld, M.E.; Schwartz, C.J.; Wagner, W.D.; Wissler, R.W. A definition of advanced types of atherosclerotic lesions and a histological classification of atherosclerosis: A report from the Committee on Vascular Lesions of the Council on Arteriosclerosis, American Heart Association. Circulation 1995, 92, 1355–1374. [Google Scholar] [CrossRef]
- Lu, Y.; Cui, X.; Zhang, L.; Wang, X.; Xu, Y.; Qin, Z.; Liu, G.; Wang, Q.; Tian, K.; Lim, K.S.; et al. The Functional Role of Lipoproteins in Atherosclerosis: Novel Directions for Diagnosis and Targeting Therapy. Aging Dis. 2022, 13, 491–520. [Google Scholar] [CrossRef]
- Mehu, M.; Narasimhulu, C.A.; Singla, D.K. Inflammatory Cells in Atherosclerosis. Antioxidants 2022, 11, 233. [Google Scholar] [CrossRef]
- Jebari-Benslaiman, S.; Galicia-García, U.; Larrea-Sebal, A.; Olaetxea, J.R.; Alloza, I.; Vandenbroeck, K.; Benito-Vicente, A.; Martín, C. Pathophysiology of Atherosclerosis. Int. J. Mol. Sci. 2022, 23, 3346. [Google Scholar] [CrossRef]
- Yachmaneni, A., Jr.; Jajoo, S.; Mahakalkar, C.; Kshirsagar, S.; Dhole, S. A Comprehensive Review of the Vascular Consequences of Diabetes in the Lower Extremities: Current Approaches to Management and Evaluation of Clinical Outcomes. Cureus 2023, 15, e47525. [Google Scholar] [CrossRef]
- Lu, G.; Ye, W.; Ou, J.; Li, X.; Tan, Z.; Li, T.; Liu, H. Coronary Computed Tomography Angiography Assessment of High-Risk Plaques in Predicting Acute Coronary Syndrome. Front. Cardiovasc. Med. 2021, 8, 743538. [Google Scholar] [CrossRef]
- West, H.W.; Dangas, K.; Antoniades, C. Advances in Clinical Imaging of Vascular Inflammation: A State-of-the-Art Review. JACC Basic. Transl. Sci. 2023, 9, 710–732. [Google Scholar] [CrossRef]
- Dhawan, S.; Dharmashankar, K.C.; Tak, T. Role of magnetic resonance imaging in visualizing coronary arteries. Clin. Med. Res. 2004, 2, 173–179. [Google Scholar] [CrossRef]
- Sarwar, M.; Adedokun, S.; Narayanan, M.A. Role of intravascular ultrasound and optical coherence tomography in intracoronary imaging for coronary artery disease: A systematic review. J. Geriatr. Cardiol. 2024, 21, 104–129. [Google Scholar] [CrossRef]
- Shlofmitz, E.; Kerndt, C.C.; Parekh, A.; Khalid, N. Intravascular Ultrasound; StatPearls: Treasure Island, FL, USA, 2023. [Google Scholar]
- Mytych, W.; Bartusik-Aebisher, D.; Łoś, A.; Dynarowicz, K.; Myśliwiec, A.; Aebisher, D. Photodynamic Therapy for Atherosclerosis. Int. J. Mol. Sci. 2024, 25, 1958. [Google Scholar] [CrossRef]
- Yoon, I.; Li, J.Z.; Shim, Y.K. Advance in Photosensitizers and Light Delivery for Photodynamic Therapy. Clin. Endosc. 2013, 46, 7–23. [Google Scholar] [CrossRef] [PubMed]
- Wańczura, P.; Aebisher, D.; Kłosowicz, M.; Myśliwiec, A.; Dynarowicz, K.; Bartusik-Aebisher, D. Application of Photodynamic Therapy in Cardiology. Int. J. Mol. Sci. 2024, 25, 3206. [Google Scholar] [CrossRef] [PubMed]
- Silva, Z.S., Jr.; Bussadori, S.K.; Fernandes, K.P.; Huang, Y.Y.; Hamblin, M.R. Animal models for photodynamic therapy (PDT). Biosci. Rep. 2015, 35, e00265. [Google Scholar] [CrossRef] [PubMed]
- Casas, A.; Di Venosa, G.; Hasan, T.; Batlle, A. Mechanisms of resistance to photodynamic therapy. Curr. Med. Chem. 2011, 18, 2486–2515. [Google Scholar] [CrossRef]
- Przygoda, M.; Bartusik-Aebisher, D.; Dynarowicz, K.; Cieślar, G.; Kawczyk-Krupka, A.; Aebisher, D. Cellular Mechanisms of Singlet Oxygen in Photodynamic Therapy. Int. J. Mol. Sci. 2023, 24, 16890. [Google Scholar] [CrossRef]
- Semeraro, P.; Syrgiannis, Z.; Bettini, S.; Giancane, G.; Guerra, F.; Fraix, A.; Bucci, C.; Sortino, S.; Prato, M.; Valli, L. Singlet oxygen photo-production by perylene bisimide derivative Langmuir-Schaefer films for photodynamic therapy applications. J. Colloid Interface Sci. 2019, 553, 390–401. [Google Scholar] [CrossRef]
- Kim, M.M.; Ghogare, A.A.; Greer, A.; Zhu, T.C. On the in vivo photochemical rate parameters for, PDT reactive oxygen species modeling. Phys. Med. Biol. 2017, 62, R1–R48. [Google Scholar] [CrossRef] [PubMed]
- Alvarez, N.; Sevilla, A. Current Advances in Photodynamic Therapy (PDT) and the Future Potential of PDT-Combinatorial Cancer Therapies. Int. J. Mol. Sci. 2024, 25, 1023. [Google Scholar] [CrossRef] [PubMed]
- Zhou, Z.; Song, J.; Nie, L.; Chen, X. Reactive oxygen species generating systems meeting challenges of photodynamic cancer therapy. Chem. Soc. Rev. 2016, 45, 6597–6626. [Google Scholar] [CrossRef] [PubMed]
- Kang, X.; Zhang, Y.; Song, J.; Wang, L.; Li, W.; Qi, J.; Tang, B.Z. A photo-triggered self-accelerated nanoplatform for multifunctional image-guided combination cancer immunotherapy. Nat. Commun. 2023, 14, 5216. [Google Scholar] [CrossRef]
- Li, Q.; Huang, C.; Liu, L.; Hu, R.; Qu, J. Enhancing Type I Photochemistry in Photodynamic Therapy Under Near Infrared Light by Using Antennae-Fullerene Complexes. Cytom. A 2018, 93, 997–1003. [Google Scholar] [CrossRef]
- Cui, S.; Guo, X.; Wang, S.; Wei, Z.; Huang, D.; Zhang, X.; Zhu, T.C.; Huang, Z. Singlet Oxygen in Photodynamic Therapy. Pharmaceuticals 2024, 17, 1274. [Google Scholar] [CrossRef]
- Debele, T.A.; Peng, S.; Tsai, H.C. Drug Carrier for Photodynamic Cancer Therapy. Int. J. Mol. Sci. 2015, 16, 22094–22136. [Google Scholar] [CrossRef]
- Itri, R.; Junqueira, H.C.; Mertins, O.; Baptista, M.S. Membrane changes under oxidative stress: The impact of oxidized lipids. Biophys. Rev. 2014, 6, 47–61. [Google Scholar] [CrossRef]
- Burtenshaw, D.; Kitching, M.; Redmond, E.M.; Megson, I.L.; Cahill, P.A. Reactive Oxygen Species (ROS), Intimal Thickening, and Subclinical Atherosclerotic Disease. Front. Cardiovasc. Med. 2019, 6, 89. [Google Scholar] [CrossRef]
- Oskroba, A.; Bartusik-Aebisher, D.; Myśliwiec, A.; Dynarowicz, K.; Cieślar, G.; Kawczyk-Krupka, A.; Aebisher, D. Photodynamic Therapy and Cardiovascular Diseases. Int. J. Mol. Sci. 2024, 25, 2974. [Google Scholar] [CrossRef]
- Hackethal, A.; Hirschburger, M.; Eicker, S.O.; Mücke, T.; Lindner, C.; Buchweitz, O. Role of Indocyanine Green in Fluorescence Imaging with Near-Infrared Light to Identify Sentinel Lymph Nodes, Lymphatic Vessels and Pathways Prior to Surgery—A Critical Evaluation of Options. Geburtshilfe Frauenheilkd. 2018, 78, 54–62. [Google Scholar] [CrossRef] [PubMed]
- Alander, J.T.; Kaartinen, I.; Laakso, A.; Pätilä, T.; Spillmann, T.; Tuchin, V.V.; Venermo, M.; Välisuo, P. A review of indocyanine green fluorescent imaging in surgery. Int. J. Biomed. Imaging 2012, 2012, 940585. [Google Scholar] [CrossRef]
- Yamamoto, M.; Orihashi, K.; Sato, T. Intraoperative Indocyanine Green Imaging Technique in Cardiovascular Surgery [Internet]. In Artery Bypass; InTech: London, UK, 2013. [Google Scholar]
- Nakayama, A.; del Monte, F.; Hajjar, R.J.; Frangioni, J.V. Functional near-infrared fluorescence imaging for cardiac surgery and targeted gene therapy. Mol. Imaging 2002, 1, 365–377. [Google Scholar] [CrossRef]
- Wang, X.; Luo, D.; Basilion, J.P. Photodynamic Therapy: Targeting Cancer Biomarkers for the Treatment of Cancers. Cancers 2021, 13, 2992. [Google Scholar] [CrossRef]
- Ara, E.S.; Noghreiyan, A.V.; Sazgarnia, A. Evaluation of photodynamic effect of Indocyanine green (ICG) on the colon and glioblastoma cancer cell lines pretreated by cold atmospheric plasma. Photodiagnosis Photodyn. Ther. 2021, 35, 102408. [Google Scholar] [CrossRef]
- Wildgruber, M.; Swirski, F.K.; Zernecke, A. Molecular imaging of inflammation in atherosclerosis. Theranostics 2013, 3, 865–884. [Google Scholar] [CrossRef]
- Wissmeyer, G.; Kassab, M.B.; Kawamura, Y.; Aguirre, A.D.; Jaffer, F.A. Intravital Microscopy in Atherosclerosis Research. Methods Mol. Biol. 2022, 2419, 645–658. [Google Scholar]
- Poznyak, A.V.; Sukhorukov, V.N.; Eremin, I.I.; Nadelyaeva, I.I.; Orekhov, A.N. Diagnostics of atherosclerosis: Overview of the existing methods. Front. Cardiovasc. Med. 2023, 10, 1134097. [Google Scholar] [CrossRef] [PubMed]
- Lo, J.; Plutzky, J. The biology of atherosclerosis: General paradigms and distinct pathogenic mechanisms among HIV-infected patients. J. Infect Dis. 2012, 205, S368–S374. [Google Scholar] [CrossRef] [PubMed]
- Kappelmayer, J.; Nagy, B., Jr. The Interaction of Selectins and PSGL-1 as a Key Component in Thrombus Formation and Cancer Progression. Biomed. Res. Int. 2017, 2017, 6138145. [Google Scholar] [CrossRef]
- Zimmerman, G.A. Two by two: The pairings of P-selectin and P-selectin glycoprotein ligand 1. Proc. Natl. Acad. Sci. USA 2001, 98, 10023–10024. [Google Scholar] [CrossRef] [PubMed]
- Caputo, K.E.; Hammer, D.A. Adhesive dynamics simulation of G-protein-mediated chemokine-activated neutrophil adhesion. Biophys. J. 2009, 96, 2989–3004. [Google Scholar] [CrossRef] [PubMed]
- Mauersberger, C.; Hinterdobler, J.; Schunkert, H.; Kessler, T.; Sager, H.B. Where the Action Is-Leukocyte Recruitment in Atherosclerosis. Front. Cardiovasc. Med. 2022, 8, 813984. [Google Scholar] [CrossRef] [PubMed]
- Moore, K.J.; Sheedy, F.J.; Fisher, E.A. Macrophages in atherosclerosis: A dynamic balance. Nat. Rev. Immunol. 2013, 13, 709–721. [Google Scholar] [CrossRef]
- Elices, M.J.; Osborn, L.; Takada, Y.; Crouse, C.; Luhowskyj, S.; Hemler, M.E.; Lobb, R.R. VCAM-1 on activated endothelium interacts with the leukocyte integrin VLA-4 at a site distinct from the VLA-4/fibronectin binding site. Cell 1990, 60, 577–584. [Google Scholar] [CrossRef]
- Muller, W.A. Getting leukocytes to the site of inflammation. Vet. Pathol. 2013, 50, 7–22. [Google Scholar] [CrossRef]
- Langer, H.F.; Chavakis, T. Leukocyte-endothelial interactions in inflammation. J. Cell. Mol. Med. 2009, 13, 1211–1220. [Google Scholar] [CrossRef]
- Popa-Fotea, N.M.; Ferdoschi, C.E.; Micheu, M.M. Molecular and cellular mechanisms of inflammation in atherosclerosis. Front. Cardiovasc. Med. 2023, 10, 1200341. [Google Scholar] [CrossRef]
- Korbecki, J.; Maruszewska, A.; Bosiacki, M.; Chlubek, D.; Baranowska-Bosiacka, I. The Potential Importance of CXCL1 in the Physiological State and in Noncancer Diseases of the Cardiovascular System, Respiratory System and Skin. Int. J. Mol. Sci. 2023, 24, 205. [Google Scholar] [CrossRef]
- Farahi, L.; Sinha, S.K.; Lusis, A.J. Roles of Macrophages in Atherogenesis. Front. Pharmacol. 2021, 12, 785220. [Google Scholar] [CrossRef]
- Gui, Y.; Zheng, H.; Cao, R.Y. Foam Cells in Atherosclerosis: Novel Insights Into Its Origins, Consequences, and Molecular Mechanisms. Front. Cardiovasc. Med. 2022, 9, 845942. [Google Scholar] [CrossRef]
- Galindo, C.L.; Khan, S.; Zhang, X.; Yeh, Y.S.; Liu, Z.; Razani, B. Lipid-laden foam cells in the pathology of atherosclerosis: Shedding light on new therapeutic targets. Expert Opin. Ther. Targets 2023, 27, 1231–1245. [Google Scholar] [CrossRef] [PubMed]
- Guyton, J.R.; Klemp, K.F. Development of the lipid-rich core in human atherosclerosis. Arterioscler. Thromb. Vasc. Biol. 1996, 16, 4–11. [Google Scholar] [CrossRef]
- Lorey, M.B.; Öörni, K.; Kovanen, P.T. Modified Lipoproteins Induce Arterial Wall Inflammation During Atherogenesis. Front. Cardiovasc. Med. 2022, 9, 841545. [Google Scholar] [CrossRef]
- Guyton, J.R.; Klemp, K.F. The lipid-rich core region of human atherosclerotic fibrous plaques. Prevalence of small lipid droplets and vesicles by electron microscopy. Am. J. Pathol. 1989, 134, 705–717. [Google Scholar]
- Badimon, L.; Padró, T.; Vilahur, G. Atherosclerosis, platelets and thrombosis in acute ischaemic heart disease. Eur. Heart J. Acute Cardiovasc. Care 2012, 1, 60–74. [Google Scholar] [CrossRef] [PubMed]
- Tabas, I. Macrophage apoptosis in atherosclerosis: Consequences on plaque progression and the role of endoplasmic reticulum stress. Antioxid. Redox Signal. 2009, 11, 2333–2339. [Google Scholar] [CrossRef]
- Bennett, M.R.; Sinha, S.; Owens, G.K. Vascular Smooth Muscle Cells in Atherosclerosis. Circ. Res. 2016, 118, 692–702. [Google Scholar] [CrossRef]
- Mallat, Z.; Hugel, B.; Ohan, J.; Lesèche, G.; Freyssinet, J.M.; Tedgui, A. Shed membrane microparticles with procoagulant potential in human atherosclerotic plaques: A role for apoptosis in plaque thrombogenicity. Circulation 1999, 99, 348–353. [Google Scholar] [CrossRef]
- Feig, J.E. Regression of atherosclerosis: Insights from animal and clinical studies. Ann. Glob. Health 2014, 80, 13–23. [Google Scholar] [CrossRef] [PubMed]
- Pasterkamp, G.; de Kleijn, D.P.; Borst, C. Arterial remodeling in atherosclerosis, restenosis and after alteration of blood flow: Potential mechanisms and clinical implications. Cardiovasc. Res. 2000, 45, 843–852. [Google Scholar] [CrossRef] [PubMed]
- He, Z.; Luo, J.; Lv, M.; Li, Q.; Ke, W.; Niu, X.; Zhang, Z. Characteristics and evaluation of atherosclerotic plaques: An overview of state-of-the-art techniques. Front. Neurol. 2023, 14, 1159288. [Google Scholar] [CrossRef] [PubMed]
- Liang, M.; Puri, A.; Devlin, G. The vulnerable plaque: The real villain in acute coronary syndromes. Open Cardiovasc. Med. J. 2011, 5, 123–129. [Google Scholar] [CrossRef] [PubMed]
- Centers for Disease Control and Prevention (US); National Center for Chronic Disease Prevention and Health Promotion (US); Office on Smoking and Health (US). How Tobacco Smoke Causes Disease: The Biology and Behavioral Basis for Smoking-Attributable Disease: A Report of the Surgeon General; Centers for Disease Control and Prevention (US): Atlanta, GA, USA, 2010. [Google Scholar]
- Mathur, R.K. Role of diabetes, hypertension, and cigarette smoking on atherosclerosis. J. Cardiovasc. Dis. Res. 2010, 1, 64–68. [Google Scholar] [CrossRef]
- Bentzon, J.F.; Otsuka, F.; Virmani, R.; Falk, E. Mechanisms of plaque formation and rupture. Circ. Res. 2014, 114, 1852–1866. [Google Scholar] [CrossRef]
- Konishi, T.; Virmani, R.; Jinnouchi, H.; Kawai, K.; Sekimoto, T.; Kawakami, R.; Finn, A.V. Plaque histological characteristics in individuals with sudden coronary death. Vasc. Pharmacol. 2023, 153, 107240. [Google Scholar] [CrossRef]
- Ma, C.H.; Yang, J.; Mueller, J.L.; Huang, H.C. Intratumoral Photosensitizer Delivery and Photodynamic Therapy. Nano Life 2021, 11, 2130003. [Google Scholar] [CrossRef]
- Pang, A.S.; Dinesh, T.; Pang, N.Y.; Dinesh, V.; Pang, K.Y.; Yong, C.L.; Lee, S.J.J.; Yip, G.W.; Bay, B.H.; Srinivasan, D.K. Nanoparticles as Drug Delivery Systems for the Targeted Treatment of Atherosclerosis. Molecules 2024, 29, 2873. [Google Scholar] [CrossRef]
- Josefsen, L.B.; Boyle, R.W. Unique diagnostic and therapeutic roles of porphyrins and phthalocyanines in photodynamic therapy, imaging and theranostics. Theranostics 2012, 2, 916–966. [Google Scholar] [CrossRef]
- Chen, J.; Zhang, X.; Millican, R.; Sherwood, J.; Martin, S.; Jo, H.; Yoon, Y.S.; Brott, B.C.; Jun, H.W. Recent advances in nanomaterials for therapy and diagnosis for atherosclerosis. Adv. Drug Deliv. Rev. 2021, 170, 142–199. [Google Scholar] [CrossRef]
- Wang, L.; Chen, Q.; Liu, D. Development of photodynamic therapy in treating oral diseases. Front. Oral Health 2025, 5, 1506407. [Google Scholar] [CrossRef]
- Froelich, J.J.; Möckel, J.W.; Azumi, N.; Barth, K.H. Analysis of particle size generated during plaque ablation with a flashlamp pumped pulsed dye laser. Cardiovasc. Interv. Radiol. 1995, 18, 35–38. [Google Scholar] [CrossRef] [PubMed]
- Kim, S.; Lee, M.W.; Kim, T.S.; Song, J.W.; Nam, H.S.; Cho, H.S.; Jang, S.J.; Ryu, J.; Oh, D.J.; Gweon, D.G.; et al. Intracoronary dual-modal optical coherence tomography-near-infrared fluorescence structural-molecular imaging with a clinical dose of indocyanine green for the assessment of high-risk plaques and stent-associated inflammation in a beating coronary artery. Eur. Heart J. 2016, 37, 2833–2844. [Google Scholar] [CrossRef] [PubMed]
- Bouillaguet, S.; Wataha, J.C.; Virgillito, M.; Gonzalez, L.; Rakich, D.R.; Meyer, J.M. Effect of sub-lethal concentrations of HEMA (2-hydroxyethyl methacrylate) on THP-1 human monocyte-macrophages, in vitro. Dent. Mater. 2000, 16, 213–217. [Google Scholar] [CrossRef] [PubMed]
- Jomova, K.; Raptova, R.; Alomar, S.Y.; Alwasel, S.H.; Nepovimova, E.; Kuca, K.; Valko, M. Reactive oxygen species, toxicity, oxidative stress, and antioxidants: Chronic diseases and aging. Arch. Toxicol. 2023, 97, 2499–2574. [Google Scholar] [CrossRef]
- Zhu, G.; Gao, Y.; Qian, J.; Lai, Y.; Lin, H.; Liu, C.; Chen, F.; Liu, X. Comprehensive analysis of atherosclerotic plaques reveals crucial genes and molecular mechanisms associated with plaque progression and rupture. Front. Cardiovasc. Med. 2023, 10, 951242. [Google Scholar] [CrossRef]
- Glaeser, J.; Nuss, A.M.; Berghoff, B.A.; Klug, G. Singlet oxygen stress in microorganisms. Adv. Microb. Physiol. 2011, 58, 141–173. [Google Scholar]
- Pospíšil, P.; Prasad, A.; Rác, M. Role of reactive oxygen species in ultra-weak photon emission in biological systems. J. Photochem. Photobiol. B. 2014, 139, 11–23. [Google Scholar] [CrossRef]
- Kuimova, M.K.; Yahioglu, G.; Ogilby, P.R. Singlet oxygen in a cell: Spatially dependent lifetimes and quenching rate constants. J. Am. Chem. Soc. 2009, 131, 332–340. [Google Scholar] [CrossRef]
- Senderovic, A.; Galijasevic, S. The Role of Inducible Nitric Oxide Synthase in Assessing the Functional Level of Coronary Artery Lesions in Chronic Coronary Syndrome. Cardiol. Res. 2024, 15, 330–339. [Google Scholar] [CrossRef]
- Shao, R.; Chen, R.; Zheng, Q.; Yao, M.; Li, K.; Cao, Y.; Jiang, L. Oxidative stress disrupts vascular microenvironmental homeostasis affecting the development of atherosclerosis. Cell Biol. Int. 2024, 48, 1781–1801. [Google Scholar] [CrossRef]
- Song, B.; Bie, Y.; Feng, H.; Xie, B.; Liu, M.; Zhao, F. Inflammatory Factors Driving Atherosclerotic Plaque Progression New Insights. J. Transl. Int. Med. 2022, 10, 36–47. [Google Scholar] [CrossRef]
- Stocker, R.; Keaney, J.F., Jr. Role of oxidative modifications in atherosclerosis. Physiol. Rev. 2004, 84, 1381–1478. [Google Scholar] [CrossRef]
- Wang, Y.; Li, L.; Zhao, W.; Dou, Y.; An, H.; Tao, H.; Xu, X.; Jia, Y.; Lu, S.; Zhang, J.; et al. Targeted Therapy of Atherosclerosis by a Broad-Spectrum Reactive Oxygen Species Scavenging Nanoparticle with Intrinsic Anti-inflammatory Activity. ACS Nano 2018, 12, 8943–8960. [Google Scholar] [CrossRef] [PubMed]
- Mu, D.; Wang, X.; Wang, H.; Sun, X.; Dai, Q.; Lv, P.; Liu, R.; Qi, Y.; Xie, J.; Xu, B.; et al. Chemiexcited Photodynamic Therapy Integrated in Polymeric Nanoparticles Capable of MRI Against Atherosclerosis. Int. J. Nanomed. 2022, 17, 2353–2366. [Google Scholar] [CrossRef] [PubMed]
- Laynes, L.; Raghavamenon, A.C.; Atkins-Ball, D.S.; Uppu, R.M. NADPH Oxidase System Mediates Cholesterol Secoaldehyde-Induced Oxidative Stress and Cytotoxicity in H9c2 Cardiomyocytes. In Cardiovascular Signaling in Health and Disease; Parinandi, N.L., Hund, T.J., Eds.; Springer: Cham, Switzerland, 2022. [Google Scholar]
- Wilkins, G.M.; Leake, D.S. The effects of free radical scavengers on the oxidation of low-density lipoproteins by macrophages. Biochim. Biophys. Acta 1994, 1215, 250–258. [Google Scholar] [CrossRef] [PubMed]
- Peng, K.J.; Huang, Y.S.; An, L.N.; Han, X.Q.; Zhang, J.G.; Wang, Q.L.; Sun, J.; Wang, S.R. Effect of ozone produced from antibody-catalyzed water oxidation on pathogenesis of atherosclerosis. Acta Biochim. Biophys. Sin. 2006, 38, 417–422. [Google Scholar] [CrossRef]
- Vinegoni, C.; Botnaru, I.; Aikawa, E.; Calfon, M.A.; Iwamoto, Y.; Folco, E.J.; Ntziachristos, V.; Weissleder, R.; Libby, P.; Jaffer, F.A. Indocyanine green enables near-infrared fluorescence imaging of lipid-rich, inflamed atherosclerotic plaques. Sci. Transl. Med. 2011, 3, 84ra45. [Google Scholar] [CrossRef]
- Khalafi, S.; Botero Fonnegra, C.; Reyes, A.; Hui, V.W. Developments in the Use of Indocyanine Green (ICG) Fluorescence in Colorectal Surgery. J. Clin. Med. 2024, 13, 4003. [Google Scholar] [CrossRef]
- Mahmut, Z.; Zhang, C.; Ruan, F.; Shi, N.; Zhang, X.; Wang, Y.; Zheng, X.; Tang, Z.; Dong, B.; Gao, D.; et al. Medical Applications and Advancement of Near Infrared Photosensitive Indocyanine Green Molecules. Molecules 2023, 28, 6085. [Google Scholar] [CrossRef]
- Verjans, J.W.; Osborn, E.A.; Ughi, G.J.; Calfon Press, M.A.; Hamidi, E.; Antoniadis, A.P.; Papafaklis, M.I.; Conrad, M.F.; Libby, P.; Stone, P.H.; et al. Targeted Near-Infrared Fluorescence Imaging of Atherosclerosis: Clinical and Intracoronary Evaluation of Indocyanine Green. JACC Cardiovasc. Imaging 2016, 9, 1087–1095. [Google Scholar] [CrossRef]
- Atta, D.; Elarif, A.; Al Bahrawy, M. Reactive oxygen species creation by laser-irradiated indocyanine green as photodynamic therapy modality: An in vitro study. Lasers Med. Sci. 2023, 38, 213. [Google Scholar] [CrossRef]
- Wańczura, P.; Aebisher, D.; Iwański, M.A.; Myśliwiec, A.; Dynarowicz, K.; Bartusik-Aebisher, D. The Essence of Lipoproteins in Cardiovascular Health and Diseases Treated by Photodynamic Therapy. Biomedicines 2024, 12, 961. [Google Scholar] [CrossRef] [PubMed]
- Shao, J.; Hu, M.; Wang, W.; Pan, Z.; Zhao, D.; Liu, J.; Lv, M.; Zhang, Y.; Li, Z. Indocyanine green based photodynamic therapy for keloids: Fundamental investigation and clinical improvement. Photodiagnosis Photodyn. Ther. 2024, 45, 103903. [Google Scholar] [CrossRef] [PubMed]
- Labban, N.; Shibani, N.A.; Al-Kattan, R.; Alfouzan, A.F.; Binrayes, A.; Assery, M.K. Clinical, bacterial, and inflammatory outcomes of indocyanine green-mediated photodynamic therapy for treating periimplantitis among diabetic patients: A randomized controlled clinical trial. Photodiagnosis Photodyn. Ther. 2021, 35, 102350. [Google Scholar] [CrossRef] [PubMed]
- Afroozi, B.; Zomorodian, K.; Lavaee, F.; Zare Shahrabadi, Z.; Mardani, M. Comparison of the efficacy of indocyanine green-mediated photodynamic therapy and nystatin therapy in treatment of denture stomatitis. Photodiagnosis Photodyn. Ther. 2019, 27, 193–197. [Google Scholar] [CrossRef] [PubMed]
- Yannuzzi, L.A.; Slakter, J.S.; Gross, N.E.; Spaide, R.F.; Costa, D.; Huang, S.J.; Klancnik, J.M., Jr.; Aizman, A. Indocyanine green angiography-guided photodynamic therapy for treatment of chronic central serous chorioretinopathy: A pilot study. Retina 2003, 23, 288–298. [Google Scholar] [CrossRef]
- Demidova, T.N.; Hamblin, M.R. Macrophage-targeted photodynamic therapy. Int. J. Immunopathol. Pharmacol. 2004, 17, 117–126. [Google Scholar] [CrossRef]
- Makris, G.C.; Teng, Z.; Patterson, A.J.; Lin, J.M.; Young, V.; Graves, M.J.; Gillard, J.H. Advances in MRI for the evaluation of carotid atherosclerosis. Br. J. Radiol. 2015, 88, 20140282. [Google Scholar] [CrossRef]
- Chio, I.I.C.; Tuveson, D.A. ROS in Cancer: The Burning Question. Trends Mol. Med. 2017, 23, 411–429. [Google Scholar] [CrossRef]
- Tian, J.Y.; Guo, F.J.; Zheng, G.Y.; Ahmad, A. Prostate cancer: Updates on current strategies for screening, diagnosis and clinical implications of treatment modalities. Carcinogenesis 2018, 39, 307–317. [Google Scholar] [CrossRef]
- Uekubo, A.; Hiratsuka, K.; Aoki, A.; Takeuchi, Y.; Abiko, Y.; Izumi, Y. Effect of antimicrobial photodynamic therapy using rose bengal and blue light-emitting diode on Porphyromonas gingivalis in vitro: Influence of oxygen during treatment. Laser Ther. 2016, 25, 299–308. [Google Scholar] [CrossRef] [PubMed]
- Waksman, R.; McEwan, P.E.; Moore, T.I.; Pakala, R.; Kolodgie, F.D.; Hellinga, D.G.; Seabron, R.C.; Rychnovsky, S.J.; Vasek, J.; Scott, R.W.; et al. PhotoPoint photodynamic therapy promotes stabilization of atherosclerotic plaques and inhibits plaque progression. J. Am. Coll. Cardiol. 2008, 52, 1024–1032. [Google Scholar] [CrossRef] [PubMed]
- Houthoofd, S.; Vuylsteke, M.; Mordon, S.; Fourneau, I. Photodynamic therapy for atherosclerosis. The potential of indocyanine green. Photodiagnosis Photodyn Ther. 2020, 29, 101568. [Google Scholar] [CrossRef] [PubMed]
- Lin, J.S.; Wang, C.J.; Li, W.T. Inhibitory Effect of Photodynamic Therapy with Indocyanine Green on Rat Smooth Muscle Cells. Acta Cardiol. Sin. 2019, 35, 65–74. [Google Scholar] [CrossRef] [PubMed] [PubMed Central]
- Truong, M.; Lennartsson, F.; Bibic, A.; Sundius, L.; Persson, A.; Siemund, R.; In’t Zandt, R.; Goncalves, I.; Wassélius, J. Classifications of atherosclerotic plaque components with T1 and T2* mapping in 11.7 T MRI. Eur. J. Radiol. Open 2021, 8, 100323. [Google Scholar] [CrossRef] [PubMed] [PubMed Central]
- Wang, Y.; Liu, X.; Wang, J.; Wang, Y.; Qi, H.; Kong, X.; Liu, D.; Liu, J.; Zheng, H.; Xiong, F.; et al. Simultaneous T1, T2, and T2* Mapping of Carotid Plaque: The SIMPLE* Technique. Radiology 2023, 307, e222061. [Google Scholar] [CrossRef] [PubMed]
- Zhang, R.; Lu, K.; Xiao, L.; Hu, X.; Cai, W.; Liu, L.; Liu, Y.; Li, W.; Zhou, H.; Qian, Z.; et al. Exploring atherosclerosis imaging with contrast-enhanced MRI using PEGylated ultrasmall iron oxide nanoparticles. Front. Bioeng. Biotechnol. 2023, 11, 1279446. [Google Scholar] [CrossRef] [PubMed] [PubMed Central]
- Verma, N.; Setia, A.; Mehata, A.K.; Randhave, N.; Badgujar, P.; Malik, A.K.; Muthu, M.S. Recent Advancement of Indocyanine Green Based Nanotheranostics for Imaging and Therapy of Coronary Atherosclerosis. Mol. Pharm. 2024, 21, 4804–4826. [Google Scholar] [CrossRef] [PubMed]
- Qiao, H.; Li, D.; Cao, J.; Qi, H.; Han, Y.; Han, H.; Xu, H.; Wang, T.; Chen, S.; Chen, H.; et al. Quantitative evaluation of carotid atherosclerotic vulnerable plaques using in vivo T1 mapping cardiovascular magnetic resonaonce: Validation by histology. J. Cardiovasc. Magn. Reson. 2020, 22, 38. [Google Scholar] [CrossRef] [PubMed] [PubMed Central]
- Jiang, Y.; Zhu, C.; Peng, W.; Degnan, A.J.; Chen, L.; Wang, X.; Liu, Q.; Wang, Y.; Xiang, Z.; Teng, Z.; et al. Ex-vivo imaging and plaque type classification of intracranial atherosclerotic plaque using high resolution MRI. Atherosclerosis 2016, 249, 10–16. [Google Scholar] [CrossRef] [PubMed] [PubMed Central]
- Yuan, C.; Kerwin, W.S.; Yarnykh, V.L.; Cai, J.; Saam, T.; Chu, B.; Takaya, N.; Ferguson, M.S.; Underhill, H.; Xu, D.; et al. MRI of atherosclerosis in clinical trials. NMR Biomed. 2006, 19, 636–654. [Google Scholar] [CrossRef] [PubMed]
Disclaimer/Publisher’s Note: The statements, opinions and data contained in all publications are solely those of the individual author(s) and contributor(s) and not of MDPI and/or the editor(s). MDPI and/or the editor(s) disclaim responsibility for any injury to people or property resulting from any ideas, methods, instructions or products referred to in the content. |
© 2025 by the authors. Licensee MDPI, Basel, Switzerland. This article is an open access article distributed under the terms and conditions of the Creative Commons Attribution (CC BY) license (https://creativecommons.org/licenses/by/4.0/).