1. Introduction
The continuous accumulation of polystyrene (PS) waste represents a persistent environmental and technological challenge due to its high production volume, extensive commercial use, and intrinsic resistance to natural degradation. PS is widely employed in packaging, insulation, disposable food-service materials, and consumer products because of its low cost, ease of processing, low density, and physicochemical stability [
1,
2,
3,
4,
5]. However, these same properties contribute to its environmental persistence after disposal. Rather than undergoing rapid mineralization, PS tends to fragment progressively into micro- and nanoplastics, which can persist in aquatic systems, sediments, soils, food chains, and biological matrices as long-lived polymeric contaminants [
6,
7,
8,
9,
10,
11,
12].
From a chemical recycling perspective, PS is particularly relevant because its thermal degradation can yield styrene-rich liquids and aromatic hydrocarbons that have potential as chemical feedstocks [
13,
14]. Pyrolysis has therefore emerged as a promising route for converting PS waste and PS-derived microplastics into reusable monomers, fuels, or platform chemicals. However, the efficiency and selectivity of PS pyrolysis are not governed solely by operational parameters such as temperature or heating rate. Instead, they are fundamentally controlled by the molecular events that initiate and propagate chain degradation. In this context, understanding the roles of localized C–C bond cleavage, radical stabilization, β-scission, and secondary fragmentation is essential for improving PS chemical recycling strategies [
15,
16].
Thermal degradation of PS is generally described as a radical-mediated process involving initiation, propagation, depropagation, β-scission, hydrogen transfer, and secondary reactions [
17,
18]. Among these stages, radical initiation is expected to impose a significant energetic barrier because it requires homolytic cleavage of covalent bonds within a relatively stable aromatic polymer framework. Once radical centers are formed, subsequent β-scission and depropagation reactions can proceed more readily, facilitating chain fragmentation and styrene formation. Therefore, PS degradation should not be considered a uniform cleavage of the polymer backbone, but rather a multistep process in which distinct molecular events dominate at different stages of conversion.
Thermogravimetric analysis (TGA) has been widely used to characterize the macroscopic degradation behavior of PS and related plastic wastes under non-isothermal conditions [
19,
20,
21,
22]. Parameters such as Tonset, Tmax, mass-loss rate, and apparent activation energy provide valuable information about the thermal severity required for degradation. In particular, isoconversional kinetic analysis is useful because it evaluates the apparent activation energy as a function of degree of conversion, allowing changes in the dominant degradation contributions to be tracked throughout the thermal process [
23,
24]. However, the apparent activation energy obtained from TGA is a global kinetic descriptor. It does not correspond to the energy of a single elementary bond-breaking event, but rather reflects the combined contributions of radical initiation, chain propagation, volatilization, heat transfer, and secondary reactions.
In parallel, density functional theory (DFT) provides a molecular-level approach to evaluate localized bond-cleavage energetics, radical stabilization, and electronic properties in polymer fragments [
7,
20,
25,
26,
27]. For PS, this approach is particularly useful because the presence of pendant phenyl groups can stabilize benzylic radicals and generate non-equivalent reactive environments along the polymer chain. Bond dissociation energies, Gibbs free energy changes, and frontier molecular orbital distributions can thus be used to construct a site-specific energetic map of degradation-prone regions within a PS fragment. These descriptors are not intended to replace thermal kinetic parameters but rather to provide a molecular-level interpretation of the energetic events that contribute to the experimentally observed degradation behavior.
Despite these advances, a significant mechanistic gap remains between molecular-scale bond energetics and macroscopic thermokinetic behavior. Many studies focus either on the thermal degradation kinetics of PS or on the quantum-chemical energetics of simplified PS fragments. At the same time, the connection between these two scales is often treated qualitatively or assumed implicitly. This limitation is critical because a single, constant energy barrier does not govern PS degradation. At low conversion, degradation may be dominated by the formation of radical sites at the most accessible weak links. At intermediate conversion, β-scission and depropagation processes can drive rapid mass loss. At high conversion, the degradation of more resistant aromatic or oligomeric residues may increase the apparent energetic demand. Therefore, a rigorous interpretation requires distinguishing between localized thermodynamic descriptors obtained by DFT and apparent activation energies derived from non-isothermal TGA.
The working premise of this study is that the thermal degradation of PS cannot be adequately represented by a single uniform energetic descriptor. At the molecular level, localized homolytic cleavage and radical-mediated fragmentation reactions can exhibit different thermodynamic requirements within a finite oligomeric structure. At the macroscopic level, the apparent activation energy obtained from non-isothermal TGA may vary with conversion because it reflects the combined contributions of multiple processes, including radical generation, chain fragmentation, volatilization, heat transfer, and secondary reactions. The two levels of analysis are therefore treated as complementary but non-equivalent: DFT provides model-dependent information on selected molecular reactions, whereas isoconversional analysis describes the apparent kinetic response of the investigated bulk PS sample. No direct assignment of an individual oligomeric cleavage position to a specific conversion interval is assumed.
Accordingly, this study combines molecular thermodynamic calculations and non-isothermal thermal analysis to examine different aspects of PS degradation. DFT calculations were used to compare selected homolytic-cleavage and radical β-scission reactions within a defined finite PS oligomer, whereas TGA and isoconversional methods were used to characterise the global apparent kinetic response of the condensed polymer sample. The purpose was not to establish a direct numerical equivalence between molecular reaction energies and TGA-derived activation energies or to assign individual cleavage sites to specific conversion intervals. Instead, the two approaches were used as complementary, scale-dependent analyses to distinguish local molecular thermodynamics from collective thermal-degradation behaviour [
28,
29,
30].
2. Methodology
2.1. Scope and General Methodological Framework
The thermal degradation of polystyrene was investigated at two distinct and non-equivalent levels of analysis. At the molecular level, density functional theory calculations were performed using a finite PS oligomeric model to obtain site-specific electronic and thermodynamic descriptors for selected bond-cleavage reactions. At the bulk level, non-isothermal thermogravimetric analysis was used to determine degradation temperatures, mass-loss behavior, and apparent activation energies for the investigated PS sample. The computational and experimental results were integrated through a qualitative multiscale interpretation; however, the molecular descriptors were not treated as numerical substitutes for the apparent kinetic parameters obtained from TGA.
The finite oligomeric model was not intended to reproduce the full molecular weight, molecular-weight distribution, tacticity, interchain packing, morphology, defect population, additive composition, cross-linking, or environmental aging history of real-world PS microplastics. It was used as a chemically controlled molecular system for comparing selected reaction energetics within a defined phenyl-substituted backbone. Accordingly, the DFT-derived quantities should be interpreted as model-dependent relative descriptors. Conversely, the activation energies derived from TGA should be interpreted as apparent kinetic parameters of a macroscopic, multistep thermal process. The scope and identity of the material subjected to TGA will be described independently from those of the computational oligomeric model.
2.2. Molecular Model Construction and Computational Details
A finite hydrogen-terminated polystyrene oligomer containing ten styrene repeat units was constructed as the molecular model. The resulting decamer had the molecular formula C
80H
82 and contained 162 atoms, including 20 carbon atoms in the aliphatic backbone and ten pendant phenyl groups. The phenyl substituents were arranged according to an isotactic stereochemical sequence. The two chain termini were saturated with hydrogen, producing a benzyl-type –CH
2(C
6H
5) terminus at one end and a –CH
3 terminus at the opposite end. A single non-linear starting conformation was selected and used throughout the computational analysis; therefore, the calculated energetic quantities are conditional on the selected chain length, tacticity, terminal groups, and molecular conformation [
7,
31].
The backbone carbon atoms were numbered sequentially from C1 to C20, beginning at the benzyl-type terminus. The phenyl groups were attached to backbone atoms C1, C3, C5, C7, C9, C11, C13, C15, C17, and C19. The ten cleavage positions evaluated in the energetic analysis were defined as consecutive C–C backbone bonds, with cleavage site C1 corresponding to the C1–C2 bond and cleavage site C10 corresponding to the C10–C11 bond. The complete atom-numbering scheme and the structural definition of the evaluated cleavage positions are provided in
Figure S1 and Table S1, respectively. The Gaussian input, molecular connectivity, and Cartesian coordinates are provided as
Supplementary Data S1.
All calculations were performed using Gaussian 16, Revision C.01. The M06-2X exchange–correlation functional was employed in combination with the LANL2DZ basis set. Molecular geometries used in the energetic analysis were optimized without imposing molecular symmetry, and the calculations were conducted in the gas phase without an implicit solvent model. Frequency calculations were subsequently performed to obtain zero-point and finite-temperature thermochemical corrections.
The intact PS oligomer was treated as a neutral closed-shell singlet with a total charge of 0 and a spin multiplicity of 1 using the restricted M06-2X formalism. All neutral radical precursors and radical fragments generated during the homolytic-cleavage and radical β-scission analyses were assigned a spin multiplicity of 2 and were treated using the unrestricted M06-2X formalism. Closed-shell unsaturated products were treated as neutral singlets using the restricted formalism. The charge, multiplicity, and electronic-structure treatment assigned to each class of species are summarized in
Table S2.
Thermochemical corrections were evaluated at 873 K. Because pressure was not specified explicitly in the Gaussian input, the Gaussian default pressure of 1 atm was applied. The reported thermochemical quantities therefore correspond to a gas-phase standard state of 1 atm and were obtained using the ideal-gas, rigid-rotor, and harmonic-oscillator treatment implemented in Gaussian 16. Zero-point energy, thermal enthalpy, entropy, and Gibbs free-energy contributions were obtained from the corresponding frequency calculations and were applied consistently when calculating the reported reaction quantities.
For the intact C
80H
82 oligomer, the final electronic energy was −3096.26596464 Hartree. The zero-point correction, thermal correction to energy, thermal correction to enthalpy, and thermal correction to Gibbs free energy were 0.035148, 0.050387, 0.053152, and −0.095858 Hartree, respectively. The corresponding electronic-plus-zero-point energy, thermal energy, thermal enthalpy, and thermal Gibbs free energy were −3096.230817, −3096.215577, −3096.212813, and −3096.361822 Hartree, respectively. The intact closed-shell oligomer exhibited a calculated ⟨S
2⟩ value of 0.0000. The complete computational and thermochemical information for the parent oligomer is provided in
Table S3.
2.3. Thermodynamic Descriptors of Homolytic Cleavage and Radical β-Scission
Site-specific C–C cleavage reactions were evaluated at selected positions of the finite PS oligomeric model. Two chemically distinct reaction classes were considered: homolytic C–C bond cleavage, representing the generation of radical fragments, and β-scission of a pre-existing radical precursor, representing subsequent radical-mediated chain fragmentation. Because these processes have different reactants and products, their calculated energetic descriptors were defined separately.
For homolytic C–C cleavage, the bond dissociation enthalpy was calculated as:
where
and
are the enthalpies of the radical fragments generated after homolytic cleavage, and
is the enthalpy of the corresponding closed-shell precursor.
The Gibbs free-energy change for homolytic cleavage was calculated as:
For β-scission, the calculated quantity was treated as a reaction enthalpy rather than as a bond dissociation energy because the process begins from a radical precursor and generates a new unsaturated product together with a radical fragment. The β-scission reaction enthalpy was calculated as:
and the corresponding Gibbs free-energy change was calculated as:
Balanced reaction schemes for all evaluated β-scission processes are provided in the
Supplementary Materials. Each scheme identifies the radical precursor, the cleaved C–C bond, the resulting unsaturated fragment, and the radical product.
The calculated BDE,
, and
values are thermodynamic quantities. They should not be interpreted as transition-state activation energies or kinetic barriers. No direct conclusions regarding reaction rates can be drawn unless the corresponding transition states are located and characterized. Accordingly, lower
or
values are interpreted only as indicating greater thermodynamic favorability within the selected oligomeric model [
17,
18,
20,
32].
2.4. Frontier Molecular Orbital Analysis
Frontier molecular orbital analysis was performed to evaluate the electronic distribution of the optimized PS oligomeric model. The highest occupied molecular orbital (HOMO) and lowest unoccupied molecular orbital (LUMO) were visualized to identify electron-rich regions, π-delocalized domains, and benzylic/aromatic zones that may be involved in radical stabilization. The HOMO–LUMO energy gap was calculated as:
where ELUMO and EHOMO correspond to the orbital energies of the lowest unoccupied and highest occupied molecular orbitals, respectively.
The HOMO–LUMO gap was used as a global electronic descriptor of molecular stability. In contrast, the spatial distribution of the frontier orbitals was used as qualitative evidence to identify electronically activated regions of the PS fragment. In particular, orbital localization over aromatic and benzylic domains was considered relevant because these regions can participate in electronic delocalization and in the stabilization of radical character following C–C bond cleavage [
33,
34,
35].
The frontier orbital analysis was not interpreted as a direct substitute for BDE calculations. The HOMO–LUMO gap describes the global electronic response of the optimized PS fragment, while BDE and ΔG quantify the energetic cost of specific cleavage events. Therefore, agreement between frontier orbital localization and low-energy cleavage regions was interpreted mechanistically rather than numerically. This approach allows the electronic structure of PS to be connected with the site-specific degradation profile without overestimating the predictive scope of the orbital descriptors.
2.5. Thermogravimetric Analysis
Thermogravimetric analysis was performed to evaluate the non-isothermal degradation behavior of a mechanically prepared virgin polystyrene (PS) microplastic fraction under inert conditions. The starting material was a reactor-grade PS homopolymer, , obtained from a single production lot. The material had not been previously used or reprocessed, and no additives were deliberately incorporated during sample preparation. Before thermal analysis, the solid PS was mechanically ground and sieved. The fraction passing through a 200-mesh sieve, corresponding to a nominal particle size below approximately 75 µm, was collected and manually homogenized before sampling. The complete particle-size distribution, including , , and , was not determined.
The number-average molecular weight , weight-average molecular weight , molecular-weight dispersity , tacticity, and degree of cross-linking were not experimentally determined. Therefore, these characteristics were not treated as defined structural attributes of the investigated material. Although the sample had not been subjected to deliberate aging or oxidation, its oxidation index was not independently measured.
Before analysis, the sieved PS fraction was dried under vacuum at 65 °C for 24 h to minimize the contribution of residual moisture to the initial mass-loss region. The dried material was subsequently stored in a closed desiccator until analysis. Approximately mg of sample was placed as a thin, non-compacted layer in an open platinum pan for each run. This sample mass and configuration were selected to reduce internal thermal gradients, minimize diffusion and mass-transfer limitations, and improve the reliability of the non-isothermal kinetic analysis.
The measurements were conducted using a Discovery TGA 55 thermogravimetric analyzer (TA Instruments, New Castle, DE, USA), equipped with a high-sensitivity Tru-Mass balance and a furnace suitable for controlled thermal analysis up to 1000 °C. Open platinum pans were used to facilitate the release of volatile degradation products during thermal decomposition. The furnace chamber was continuously purged with high-purity nitrogen to maintain an inert atmosphere throughout the experiment. The total nitrogen flow was 60 mL min
−1, comprising 40 mL min
−1 through the furnace and 20 mL min
−1 through the balance-protection circuit [
36,
37].
The samples were heated from ambient temperature to 600 °C at five linear heating rates: 5, 10, 15, 20, and 25 °C min−1. Multiple heating rates were employed to generate the temperature shifts required for non-isothermal kinetic analysis. Thermogravimetric curves were recorded as residual mass percentage versus temperature, while derivative thermogravimetric curves were obtained to determine the temperature corresponding to the maximum mass-loss rate.
The degree of conversion was calculated from the mass-loss profile using:
where
is the degree of conversion,
is the initial sample mass before the main degradation event,
is the sample mass at temperature
, and
is the final residual mass after thermal degradation [
38,
39]. The conversion parameter was used to follow degradation progress independently of the absolute mass loss recorded at each heating rate.
The derivative thermogravimetric response was calculated as:
where
represents the variation in sample mass as a function of temperature. The onset degradation temperature,
, was determined using the tangent-intersection method in the principal mass-loss region. The maximum degradation temperature,
, was obtained from the maximum of the DTG curve. Both parameters were used as macroscopic thermal descriptors of the non-isothermal degradation process and as input variables for the subsequent kinetic analysis.
The displacement of Tonset and Tmax toward higher temperatures with increasing heating rate was interpreted as a non-isothermal kinetic effect rather than as an increase in the intrinsic chemical stability of PS. At higher heating rates, the sample remains for a shorter time at each temperature, producing an apparent displacement of the degradation event toward higher temperatures. Accordingly, the thermal parameters extracted from the TGA and DTG curves were interpreted as macroscopic degradation descriptors influenced by heating rate, thermal lag, heat transfer, volatilization, and the overall radical degradation network.
The reported thermal and kinetic parameters are specific to the investigated mechanically prepared virgin PS microplastic fraction. Because molecular-weight distribution, tacticity, degree of cross-linking, oxidation index, and complete particle-size distribution were not independently determined, the resulting parameters should not be extrapolated directly to environmentally aged, oxidized, cross-linked, additive-containing, or compositionally heterogeneous PS microplastics. The molecular-weight distribution, tacticity, gel fraction, and oxidation index of the investigated material were not independently determined. These variables can influence the thermal degradation response of PS and therefore limit direct extrapolation of the present TGA-derived parameters to other commercial grades or environmentally aged microplastics.
2.6. Non-Isothermal Kinetic Analysis
The apparent activation energy of PS degradation was evaluated using three non-isothermal kinetic approaches: Kissinger, Flynn–Wall–Ozawa (FWO), and Kissinger–Akahira–Sunose (KAS). These methods were selected because they provide complementary information on the thermal degradation process. The Kissinger method estimates a global apparent activation energy from the shift in Tmax as a function of heating rate. In contrast, the FWO and KAS methods estimate the apparent activation energy as a function of the degree of conversion [
40,
41,
42].
The general rate equation for solid-state thermal degradation is expressed as:
where α is the conversion degree, t is time, k(T) is the temperature-dependent rate constant, and f(α) is the reaction model. The temperature dependence of the rate constant was described using the Arrhenius equation:
where A is the pre-exponential factor, Ea is the apparent activation energy, R is the universal gas constant, and T is the absolute temperature. Under non-isothermal conditions, the heating rate is defined as:
where β is the linear heating rate.
For the Kissinger method, the apparent activation energy was calculated from the relationship:
where Tmax is the absolute temperature corresponding to the maximum degradation rate obtained from the DTG curve; the apparent activation energy was obtained from the slope of the linear plot of ln(β/Tmax
2) versus 1/Tmax [
41]. Since this method is based on the displacement of the DTG maximum across heating rates, the resulting Ea value was interpreted as a global kinetic descriptor of the main degradation event rather than a heating-rate-specific property.
The Flynn–Wall–Ozawa method was applied using:
where Tα is the absolute temperature corresponding to a fixed conversion degree α, and C(α) is a conversion-dependent constant. For each selected α value, Ea was obtained from the slope of the linear relationship between log β and 1/Tα. This method allows the evolution of apparent activation energy to be followed without imposing an explicit reaction model.
The Kissinger–Akahira–Sunose method was applied using:
where Tα is the absolute temperature corresponding to a fixed conversion degree and C(α) is a conversion-dependent constant. For each α value, Ea was obtained from the slope of the plot of ln(β/Tα
2) versus 1/Tα. The KAS method was used together with FWO to verify whether the conversion-dependent activation energy trend was independent of the mathematical approximation used.
The FWO and KAS analyses were performed over the conversion interval from α = 0.05 to α = 0.95. This range was selected to include the early, intermediate, and advanced stages of degradation while avoiding excessive influence from baseline noise at very low conversion and residual-mass uncertainty at complete conversion. Low conversion values were interpreted as the initial degradation region, where radical formation at accessible weak links may contribute strongly to the apparent kinetic response. Intermediate conversion values were associated with active chain fragmentation, β-scission, depropagation, and volatilization of styrene-rich fragments. High conversion values were interpreted as advanced degradation stages involving more resistant aromatic or oligomeric residues and secondary fragmentation processes.
The activation energies obtained from Kissinger, FWO, and KAS were treated as apparent kinetic parameters of the overall thermal degradation process. They should not be interpreted as direct experimental equivalents of individual DFT-derived bond dissociation energies. BDE and ΔG are localized thermodynamic descriptors of cleavage for specific molecular events. In contrast, TGA-derived Ea reflects the combined kinetic contribution of radical initiation, propagation, volatilization, heat transfer, and secondary reactions under non-isothermal conditions. Therefore, the comparison between DFT energetics and thermokinetic parameters was used to establish a mechanistic correspondence between molecular susceptibility and macroscopic degradation behavior, rather than a direct numerical equivalence.
2.7. Descriptive Analysis of DFT-Derived Energetics and Regression Assessment of Kinetic Models
The energetic descriptors calculated for the selected homolytic-cleavage and radical β-scission reactions were analyzed descriptively. For each reaction class and energetic quantity, the mean, median, standard deviation, interquartile range, minimum, maximum, and total range were calculated to summarize the central tendency and internal dispersion of the evaluated computational dataset.
The individual C1–C10 values were deterministic results obtained from a single finite PS oligomeric model. These reaction positions do not constitute independent experimental replicates or randomly sampled members of a defined molecular population. Consequently, the descriptive statistics were used only to summarize variation among the selected reaction definitions and were not interpreted as estimates of population parameters, computational uncertainty, or statistical sampling error.
Inferential comparisons such as Welch’s
t-test, the Mann–Whitney U test, bootstrap confidence intervals, permutation tests, and standardized population effect sizes were not applied because their assumptions of independent sampling were not satisfied by the present computational design. Although these methods are appropriate for comparisons involving defined and independently sampled populations [
42,
43,
44,
45,
46], their application to the current deterministic dataset could overstate the statistical certainty of the energetic differences.
Similarly, the C1–C10 numbering was used exclusively to preserve structural traceability among the calculated reactions. It was not treated as an independently sampled continuous variable or as a validated reaction coordinate. Therefore, positional rank correlations were not used as evidence of a monotonic propagation mechanism.
For the non-isothermal kinetic analysis, linear regression was applied independently to the Kissinger, Flynn–Wall–Ozawa, and Kissinger–Akahira–Sunose relationships. The regression quality was evaluated using the slope, intercept, coefficient of determination, and standard error, where these parameters were available. These regression statistics describe the quality of the kinetic linearizations and are methodologically distinct from the descriptive comparison of the deterministic DFT-derived values.
3. Optimized Structure and Frontier Molecular Orbital Distribution of the PS Oligomeric Model
3.1. Optimized Structure and Frontier Molecular Orbital Distribution of the PS Oligomeric Model
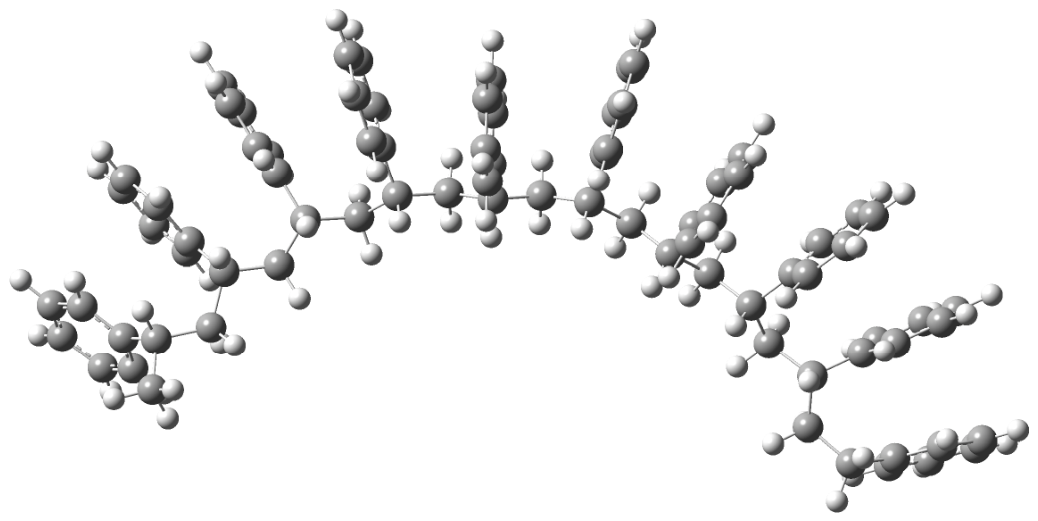
As shown in
Figure 1, the optimized PS oligomeric model retained the characteristic phenyl-substituted carbon backbone of polystyrene while adopting a non-linear conformation due to torsional deviations along the aliphatic chain and steric interactions among neighboring pendant phenyl groups. This structural arrangement is relevant because PS degradation is controlled not only by the formal presence of C–C bonds in the backbone but also by the local electronic environment generated by the aromatic substituents. In particular, benzylic regions adjacent to phenyl groups can stabilize radical character through electronic delocalization after homolytic C–C cleavage [
20,
27,
35].
The frontier molecular orbital descriptors are summarized in
Table 1. The HOMO energy was −659.21 kJ mol
−1, whereas the LUMO energy was 83.41 kJ mol
−1, resulting in a HOMO–LUMO gap of 742.62 kJ mol
−1. This large gap indicates a globally stable electronic structure, consistent with the chemical persistence of PS and the high energetic input required for spontaneous degradation under mild conditions. However, the degradation behavior cannot be inferred solely from the gap value. As shown in
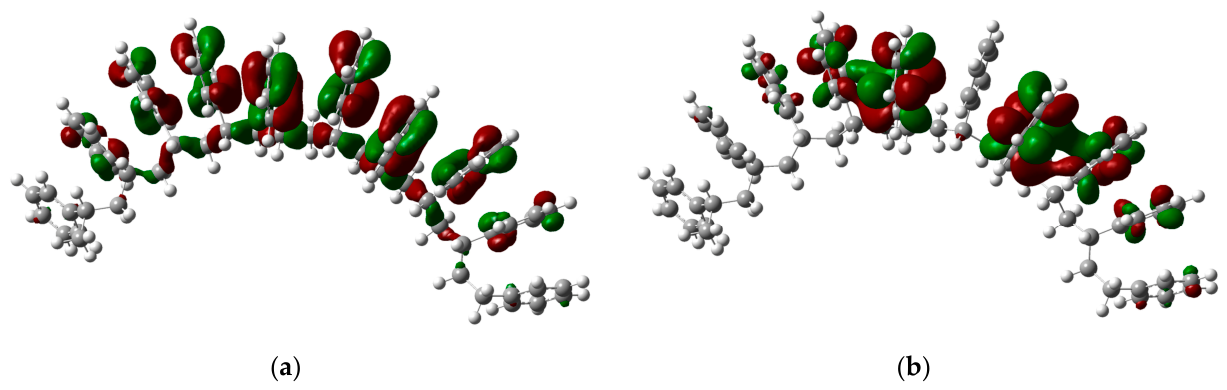
Figure 2, the spatial distribution of the frontier orbitals is essential because it reveals whether the electronic response is homogeneous along the oligomer or concentrated in specific aromatic/benzylic domains.
The HOMO distribution was mainly localized over π-rich aromatic regions and adjacent benzylic domains, rather than being uniformly distributed over the entire aliphatic backbone. This localization is chemically meaningful because radical formation during thermal degradation requires electronic reorganization, and benzylic radical stabilization is favored when the unpaired electron can be delocalized toward the phenyl substituent. Therefore, the HOMO pattern supports the idea that PS contains electronically differentiated weak-link regions, even though the polymer backbone appears formally repetitive.
The LUMO distribution also showed preferential localization over selected aromatic and benzylic regions, indicating that the lowest-energy acceptor domains are spatially concentrated rather than extended uniformly over the chain. The simultaneous localization of both HOMO and LUMO over phenyl-substituted regions suggests that these domains are involved in the electronic response associated with bond cleavage and radical stabilization. This behavior provides qualitative electronic support for the non-uniform BDE profile obtained in the site-resolved cleavage analysis.
A critical distinction must be maintained when interpreting these results. The HOMO–LUMO gap is a global electronic descriptor and should not be treated as a direct substitute for bond dissociation energy. The gap describes the general electronic stability of the optimized PS fragment, whereas BDE quantifies the energetic cost of a specific bond-cleavage event. Their relationship is therefore mechanistic rather than numerical. The large HOMO–LUMO gap supports the global resistance of PS to spontaneous degradation. At the same time, the localized orbital distribution explains why selected benzylic/aromatic regions can behave as comparatively more accessible radical-initiation sites during thermal degradation [
20,
27,
33,
35].
3.2. Site-Resolved Thermodynamic Profiles of Homolytic Cleavage and Radical β-Scission in the PS Oligomeric Model
The site-resolved energetic parameters calculated for homolytic C–C cleavage are summarized in
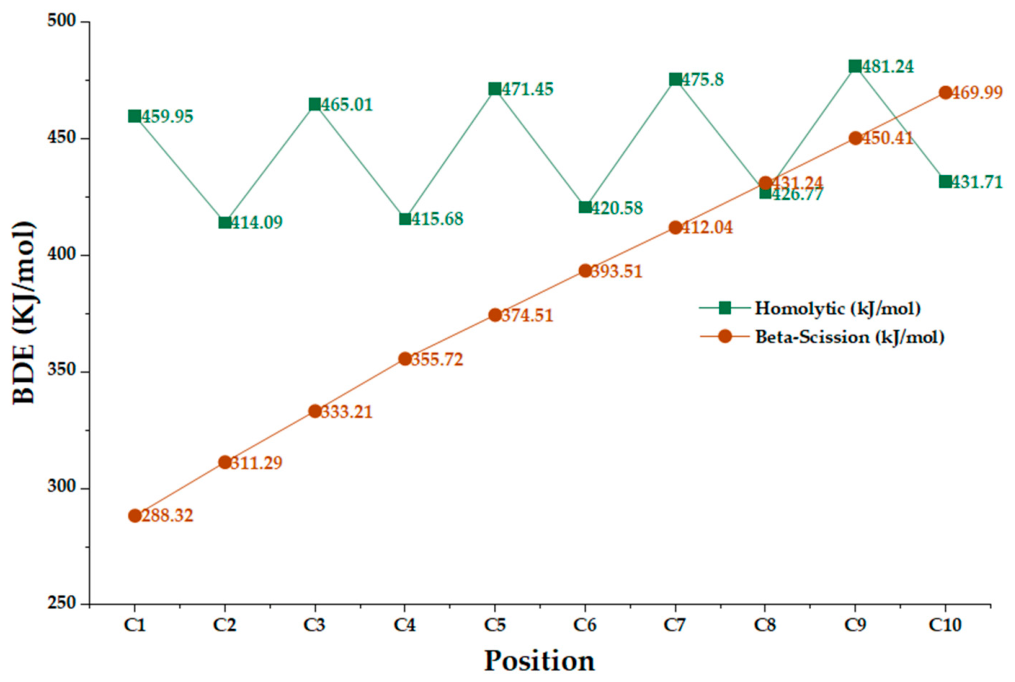
Table 2. These values represent local thermodynamic descriptors of radical-forming bond dissociation within the selected PS oligomeric model. Homolytic cleavage required comparatively high BDE values throughout the evaluated fragment, ranging from 414.09 to 481.24 kJ mol
−1. This range indicates that radical generation is thermodynamically demanding within the defined molecular structure and that the energetic requirement varies with the local bonding environment. However, because the calculated BDE values are thermodynamic quantities rather than activation barriers, they should not be interpreted as direct kinetic measures or as definitive evidence that radical initiation is the rate-determining step of bulk PS degradation.
The calculated thermodynamic parameters for the selected radical β-scission reactions are summarized in
Table 3. In contrast to the homolytic dissociation of the closed-shell parent oligomer, these reactions begin from radical precursors and generate an unsaturated product together with a new radical fragment. Therefore, the reported quantities are interpreted as reaction enthalpies, ΔHrxn, and Gibbs free-energy changes, ΔGrxn, rather than as bond dissociation energies.
The calculated ΔHrxn values ranged from 288.32 to 469.99 kJ mol−1, whereas the corresponding ΔGrxn values ranged from 55.44 to 189.41 kJ mol−1 under the adopted gas-phase thermochemical conditions. All ΔGrxn values were positive, indicating that the evaluated β-scission reactions were endergonic relative to their corresponding radical precursors. Within the defined oligomeric model, lower ΔGrxn values indicate a comparatively smaller thermodynamic penalty for formation of the corresponding products. However, these quantities do not provide information about the activation barriers, rate constants, or kinetic preference of the individual β-scission reactions.
As shown in
Figure 3, the calculations identify a model-dependent thermodynamic distinction between direct homolytic radical generation and subsequent radical-mediated fragmentation. They do not, by themselves, establish that a particular β-scission reaction is kinetically preferred, that the listed C1–C10 positions constitute consecutive elementary steps, or that the positional sequence represents the physical progression of an unzipping mechanism.
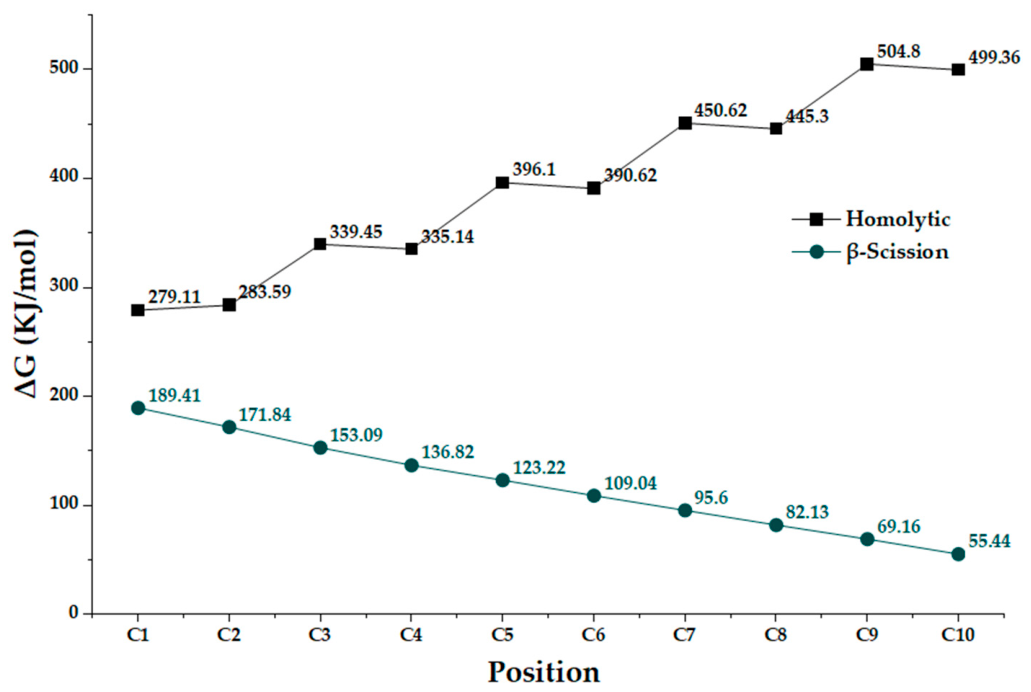
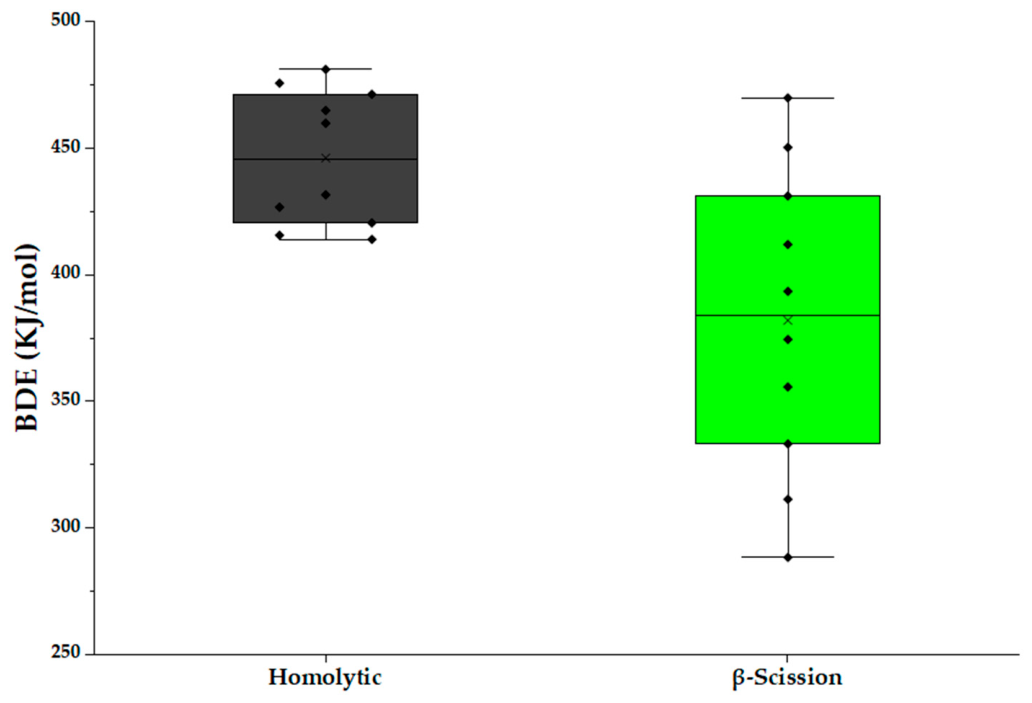
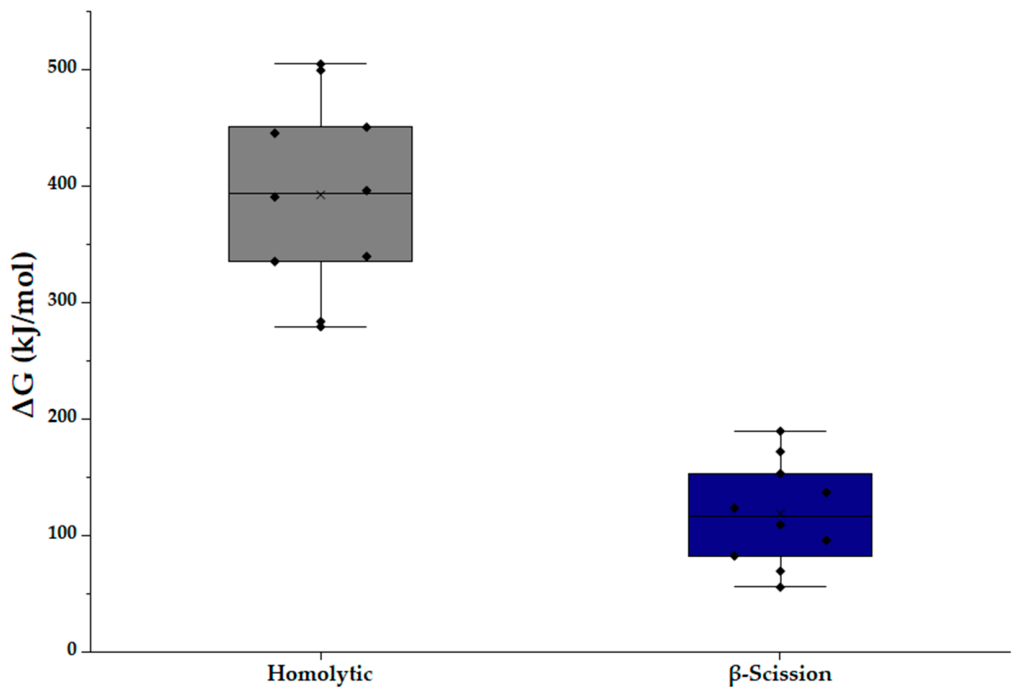
The comparison of BDE profiles reveals two distinct energetic regimes. Homolytic cleavage remained within a high-energy window, whereas β-scission began at substantially lower BDE values and increased progressively along the evaluated positions. This distinction is mechanistically significant because homolytic cleavage corresponds to radical initiation, while β-scission corresponds to propagation after radical formation. The corresponding differences in Gibbs free-energy changes for the two reaction classes are shown in
Figure 4. Therefore, the degradation of PS should not be interpreted as a single uniform bond-breaking process. Instead, it involves an energetically demanding initiation step followed by a propagation route that becomes accessible once radical centers are generated [
16,
17,
18,
20].
The Gibbs free-energy results distinguish the thermodynamic characteristics of the two defined reaction sets within the finite PS oligomeric model. For homolytic cleavage, the calculated ΔG values ranged from 279.12 to 504.80 kJ mol−1. Although the values generally increased toward the higher-numbered positions, local deviations were observed, and the C1–C10 sequence should not be described as a strictly monotonic profile. In contrast, the selected radical β-scission reactions exhibited ΔGrxn values that decreased from 189.41 to 55.44 kJ mol−1 across the defined reaction set. This numerical contrast indicates that the evaluated homolytic dissociations and β-scission reactions have different model-dependent thermodynamic requirements. It does not, however, establish a direct correspondence between radical initiation and propagation stages in the condensed polymer or identify the kinetic sequence of PS degradation.
The calculated Gibbs free-energy changes decreased across the defined C1–C10 β-scission reaction set. This ordering indicates that the products associated with the higher-numbered reactions had smaller positive ΔGrxn values relative to their corresponding radical precursors within the selected oligomeric model. All reactions remained endergonic under the adopted gas-phase thermochemical conditions. The C1–C10 labels should not be interpreted as a validated reaction coordinate or as successive elementary steps of a physical unzipping process. Because fragment size, terminal proximity, precursor identity, and product stoichiometry may vary across the reaction set, these factors may contribute to the observed monotonic ordering. Accordingly, the calculated sequence is treated as a model-dependent thermodynamic pattern rather than as direct evidence of a sequential propagation mechanism.
The comparatively lower ΔGrxn values obtained for some β-scission reactions are chemically compatible with radical-mediated fragmentation pathways that may generate unsaturated and styrene-related products. Nevertheless, product distributions were not calculated or experimentally quantified in the present study, and the molecular results cannot be used to assign the global mass-loss behavior observed by TGA to specific β-scission reactions. Taken together, the frontier-orbital distributions and calculated reaction thermodynamics indicate that the selected PS oligomer contains electronically and energetically non-equivalent local environments. Homolytic C–C cleavage exhibited BDE values of 414.09–481.24 kJ mol−1 and ΔG values of 279.12–504.80 kJ mol−1, whereas the selected radical β-scission reactions exhibited ΔGrxn values of 55.44–189.41 kJ mol−1. These differences describe the relative thermodynamics of the explicitly defined reactions within the isolated oligomeric model. They do not establish their kinetic preference, their temporal sequence, or a direct relationship with the conversion-dependent apparent activation energies obtained from TGA. Demonstration of a sequential unzipping mechanism would require equivalent local reaction environments, systematic control of fragment-size and terminal effects, and transition-state calculations for the relevant elementary reactions.
3.3. Descriptive Comparison of the Calculated Cleavage Energetics
The descriptive energetic parameters calculated for the selected homolytic-cleavage and radical β-scission reaction sets are summarized in
Table 4. These values characterize the central tendency, dispersion, and range of the reactions defined within the finite PS oligomeric model. They should not be interpreted as observations sampled from a broader population of PS structures.
The homolytic-cleavage BDE values ranged from 414.09 to 481.24 kJ mol−1, with a mean of 446.23 kJ mol−1 and a comparatively narrow total range of 67.15 kJ mol−1. This indicates that all evaluated homolytic-cleavage reactions remained within a relatively high energetic domain, although selected positions, particularly C2, C4, and C6, exhibited lower calculated values than the remaining reactions.
The evaluated radical β-scission reaction set showed a broader enthalpic distribution, with ΔHrxn values ranging from 288.32 to 469.99 kJ mol−1 and a mean of 382.02 kJ mol−1. Several of these reactions therefore exhibited lower calculated enthalpic requirements than the homolytic-cleavage reactions. However, because the two datasets represent chemically different reaction definitions and may be influenced by differences in precursor identity, fragment size, terminal environment, and product stoichiometry, this comparison is interpreted descriptively rather than as evidence of two independently sampled energetic populations.
A stronger numerical contrast was observed for the Gibbs free-energy descriptors. The calculated ΔGdiss values for homolytic cleavage ranged from 279.12 to 504.80 kJ mol−1, whereas the ΔGrxn values for the evaluated β-scission reactions ranged from 55.44 to 189.41 kJ mol−1. Within the selected oligomeric model, this result indicates that the evaluated β-scission reactions involved smaller positive Gibbs free-energy penalties relative to their corresponding radical precursors than those associated with homolytic dissociation of the closed-shell parent oligomer. Nevertheless, all reported ΔGrxn values remained positive under the adopted gas-phase thermochemical conditions, and the comparison does not establish kinetic preference or direct correspondence with the apparent activation energies obtained from TGA.
The numerical differences should not be interpreted as population-level statistical significance, computational uncertainty, or proof of a kinetic separation between initiation and propagation. The individual values are deterministic outputs conditioned by the selected oligomeric conformation, reaction definitions, theoretical method, and thermochemical treatment. Accordingly, the comparison supports only a model-dependent thermodynamic distinction among the evaluated reactions.
The C1–C10 labels were retained to preserve structural traceability. As illustrated in
Figure 5, the calculated values are presented descriptively as deterministic reaction results rather than as independent experimental observations. Although ordered trends occur in some calculated descriptors, the positional index is not an independently sampled physical variable and is not treated as a reaction coordinate. Consequently, positional correlations are not used to demonstrate a propagation or unzipping mechanism.
The BDE distribution confirms the mechanistic separation already suggested by the site-resolved energetic profiles. Homolytic cleavage is concentrated in a narrower, consistently higher-energy domain, whereas β-scission occupies a broader distribution extending to substantially lower BDE values. A complementary thermodynamic separation is observed in the Gibbs free-energy distributions shown in
Figure 6, where homolytic cleavage exhibits substantially higher positive ΔG values than the evaluated β-scission reactions. This pattern indicates that generating radical centers requires a greater energetic investment than the subsequent radical-mediated fragmentation steps. Importantly, the difference is not driven by a single extreme value but is sustained across most evaluated positions, reinforcing the interpretation that homolytic radical generation exhibits a higher calculated thermodynamic requirement than the evaluated β-scission reaction set of PS degradation [
16,
17,
18,
20].
The thermodynamic separation becomes even more pronounced when ΔG is taken into account. Homolytic cleavage occupies a broad and high positive ΔG domain, whereas β-scission remains confined to markedly lower free-energy values. This indicates that, once the radical center has been formed, the propagation process is not only energetically more accessible in terms of BDE at several positions, but also thermodynamically more favorable. In other words, initiation and propagation differ not only in magnitude, but also in their thermodynamic behavior along the evaluated PS fragment.
The C1–C10 labels were assigned to preserve structural traceability across the calculated reaction set. Although monotonic ordering was observed for several descriptors, the positional index is not an independently sampled physical variable and should not be interpreted as a reaction coordinate. Therefore, rank correlations with the C1–C10 numbering are not used as evidence of a propagation mechanism. The observed ordering is reported descriptively and may reflect combined effects of local structure, terminal proximity, fragment size, and reaction definition.
The statistical analysis strengthens the mechanistic interpretation of PS degradation proposed in this work. Homolytic cleavage and β-scission do not represent two numerically similar manifestations of the same event, but two energetically distinct stages of a radical degradation sequence. Homolytic cleavage defines the high-energy initiation threshold, whereas β-scission defines the lower-energy propagation domain that enables subsequent depolymerization. This statistical distinction provides an important bridge between the molecular DFT results and the macroscopic thermal degradation behavior later observed by TGA/DTG.
3.4. Relative Cleavage Susceptibility Within the Selected PS Oligomeric Model
The cleavage reaction with the lowest calculated energetic requirement identified from the site-resolved energetic descriptors is summarized in
Table 5. This synthesis integrates the BDE and ΔG results to distinguish between the most accessible initiation sites, the most favorable propagation events, and the most resistant regions within the evaluated PS oligomeric model.
The weak-link analysis indicates that PS degradation does not proceed through a single energetically equivalent cleavage event along the polymer backbone. Instead, radical initiation and propagation are controlled by different energetic descriptors. The C2 position exhibited the lowest homolytic BDE, identifying it as the most accessible radical-initiation site within the evaluated model. C4 and C6 also showed comparatively low homolytic BDE values, suggesting that initiation-prone behavior is not restricted to a single isolated position but is associated with specific local environments along the phenyl-substituted backbone.
This interpretation is consistent with the frontier orbital analysis, in which the aromatic and benzylic regions showed localized electronic contributions. Such localization can facilitate radical stabilization after C–C bond cleavage and explain why the PS backbone should not be treated as electronically uniform. Therefore, the weak-link behavior arises from the combined influence of backbone connectivity, benzylic stabilization, and the electronic effect of pendant phenyl groups, rather than from bond position alone [
20,
27,
35].
Within the evaluated β-scission reaction set, the C1 reaction exhibited the lowest calculated enthalpic requirement, whereas the C10 reaction exhibited the lowest Gibbs free-energy change. These descriptors do not represent the same thermodynamic property: reflects the enthalpic balance between a radical precursor and its products, whereas additionally includes thermal and entropic contributions. Therefore, C1 and C10 should not be described as competing kinetic pathways or as the initial and final stages of a validated reaction sequence. Instead, they represent the lowest values of two distinct thermodynamic descriptors within the defined computational dataset.
The calculated values decreased monotonically across the defined C1–C10 β-scission reaction set. However, the positional labels should not be interpreted as successive elementary steps along a validated reaction coordinate. Differences in fragment size, terminal proximity, radical-precursor identity, and product stoichiometry may contribute to the observed ordering. Accordingly, the trend is interpreted as a model-dependent thermodynamic pattern rather than as direct evidence of a sequential unzipping mechanism.
The comparison between initiation and propagation also clarifies the role of weak links in PS chemical recycling. Lowering the energetic requirement of the initial homolytic cleavage step should have a greater impact on the overall degradation efficiency than targeting β-scission alone, because β-scission becomes comparatively more favorable once radical centers are available. From this perspective, catalytic or process-design strategies should prioritize activation of the high-energy radical-initiation stage while preserving the intrinsic tendency of PS radicals to undergo depropagation and β-scission toward aromatic products [
13,
14,
16].
It is important to emphasize that the weak-link map obtained here should be interpreted as a relative susceptibility profile within the selected PS oligomeric model. Real PS microplastics may contain broader molecular-weight distributions, chain-end effects, tacticity variations, additives, oxidation defects, and environmental aging features that can introduce additional reactive sites. Nevertheless, the present DFT results provide a chemically consistent framework for identifying why certain phenyl-substituted regions are more favorable for radical initiation and why β-scission becomes thermodynamically favorable during propagation.
3.5. Thermogravimetric Degradation Window and Its Role in the Multiscale Analysis
The thermal degradation response of the additive-free PS sample under nitrogen is summarized in
Table 6. The increase in Tonset and Tmax with heating rate is a well-established feature of non-isothermal PS degradation and is not presented here as an independent novelty. In the present study, these parameters define the experimentally observed degradation window used to contextualize the subsequent isoconversional kinetic analysis and the molecular-level thermodynamic descriptors obtained from the finite PS oligomeric model. The specific contribution therefore lies in the multiscale interpretation of these complementary datasets while maintaining a clear distinction between bulk apparent kinetics and model-dependent molecular energetics.
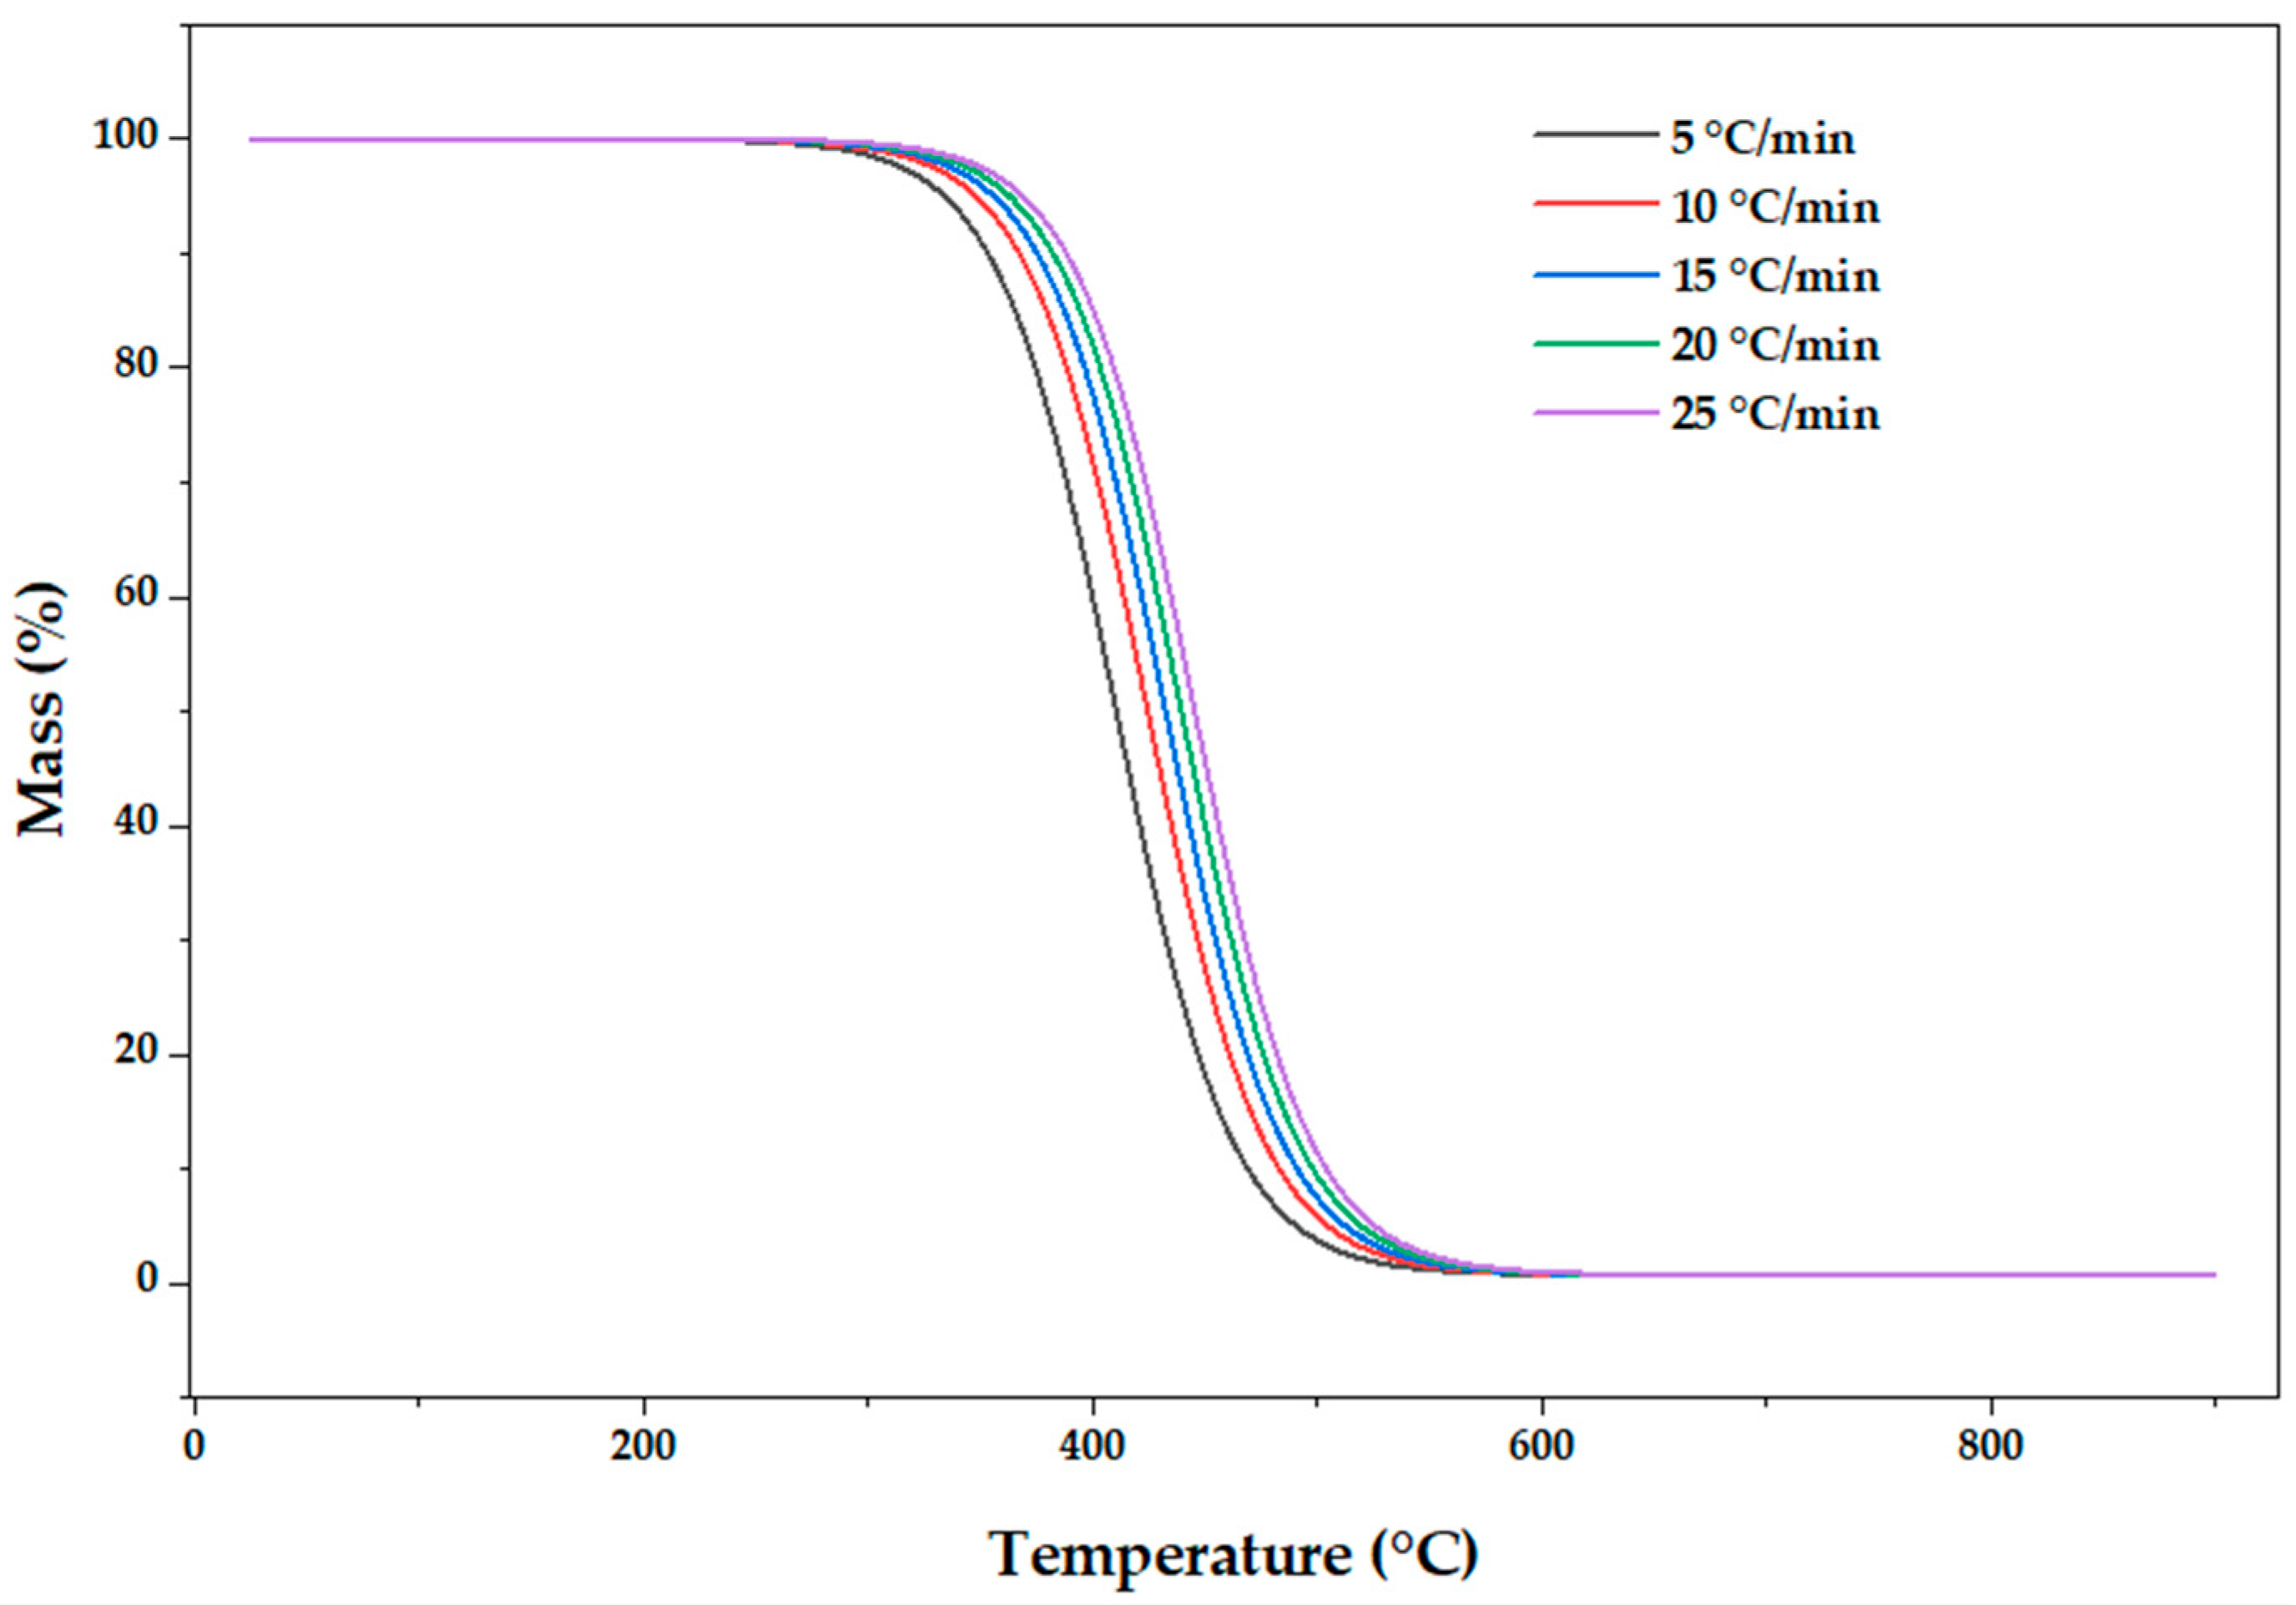
As shown in
Figure 7, the TGA profiles exhibited a single dominant mass-loss event under inert conditions, consistent with the main thermal depolymerization interval typically observed for PS. The absence of multiple well-resolved degradation stages indicates that, under the selected non-isothermal conditions, the overall mass loss is governed by a major degradation event rather than by clearly separated thermal transitions. However, this single apparent event should not be interpreted as evidence of a single elementary reaction. PS degradation involves a coupled radical network in which initiation, β-scission, depropagation, volatilization, and secondary reactions contribute simultaneously or sequentially to the measured mass-loss profile [
19,
36,
37].
Both Tonset and Tmax shifted progressively toward higher temperatures as the heating rate increased. Tonset increased from 334.0 °C at 5 °C min
−1 to 369.0 °C at 25 °C min
−1, while Tmax increased from 426.5 to 461.5 °C over the same heating-rate interval. This displacement reflects the expected kinetic delay and thermal lag associated with non-isothermal measurements. At higher heating rates, the sample remains for a shorter time at each temperature, and the apparent degradation event is consequently displaced toward higher temperatures [
37,
39,
47]. This systematic displacement was quantitatively supported by linear regression analysis, which showed strong positive relationships between heating rate and both Tonset and Tmax, with R
2 = 0.9685 in both cases (
Table S5).
The thermogravimetric results do not identify individual bond-cleavage events or specific positions within the oligomeric model. Instead, they provide the macroscopic temperature interval in which the collective degradation network becomes experimentally observable. The DFT-derived descriptors complement this information by showing that the selected molecular reactions are not thermodynamically equivalent within the finite oligomeric model. Accordingly, the relationship between both datasets is qualitative: TGA/DTG defines the bulk degradation window, whereas DFT describes relative molecular differences among selected cleavage reactions.
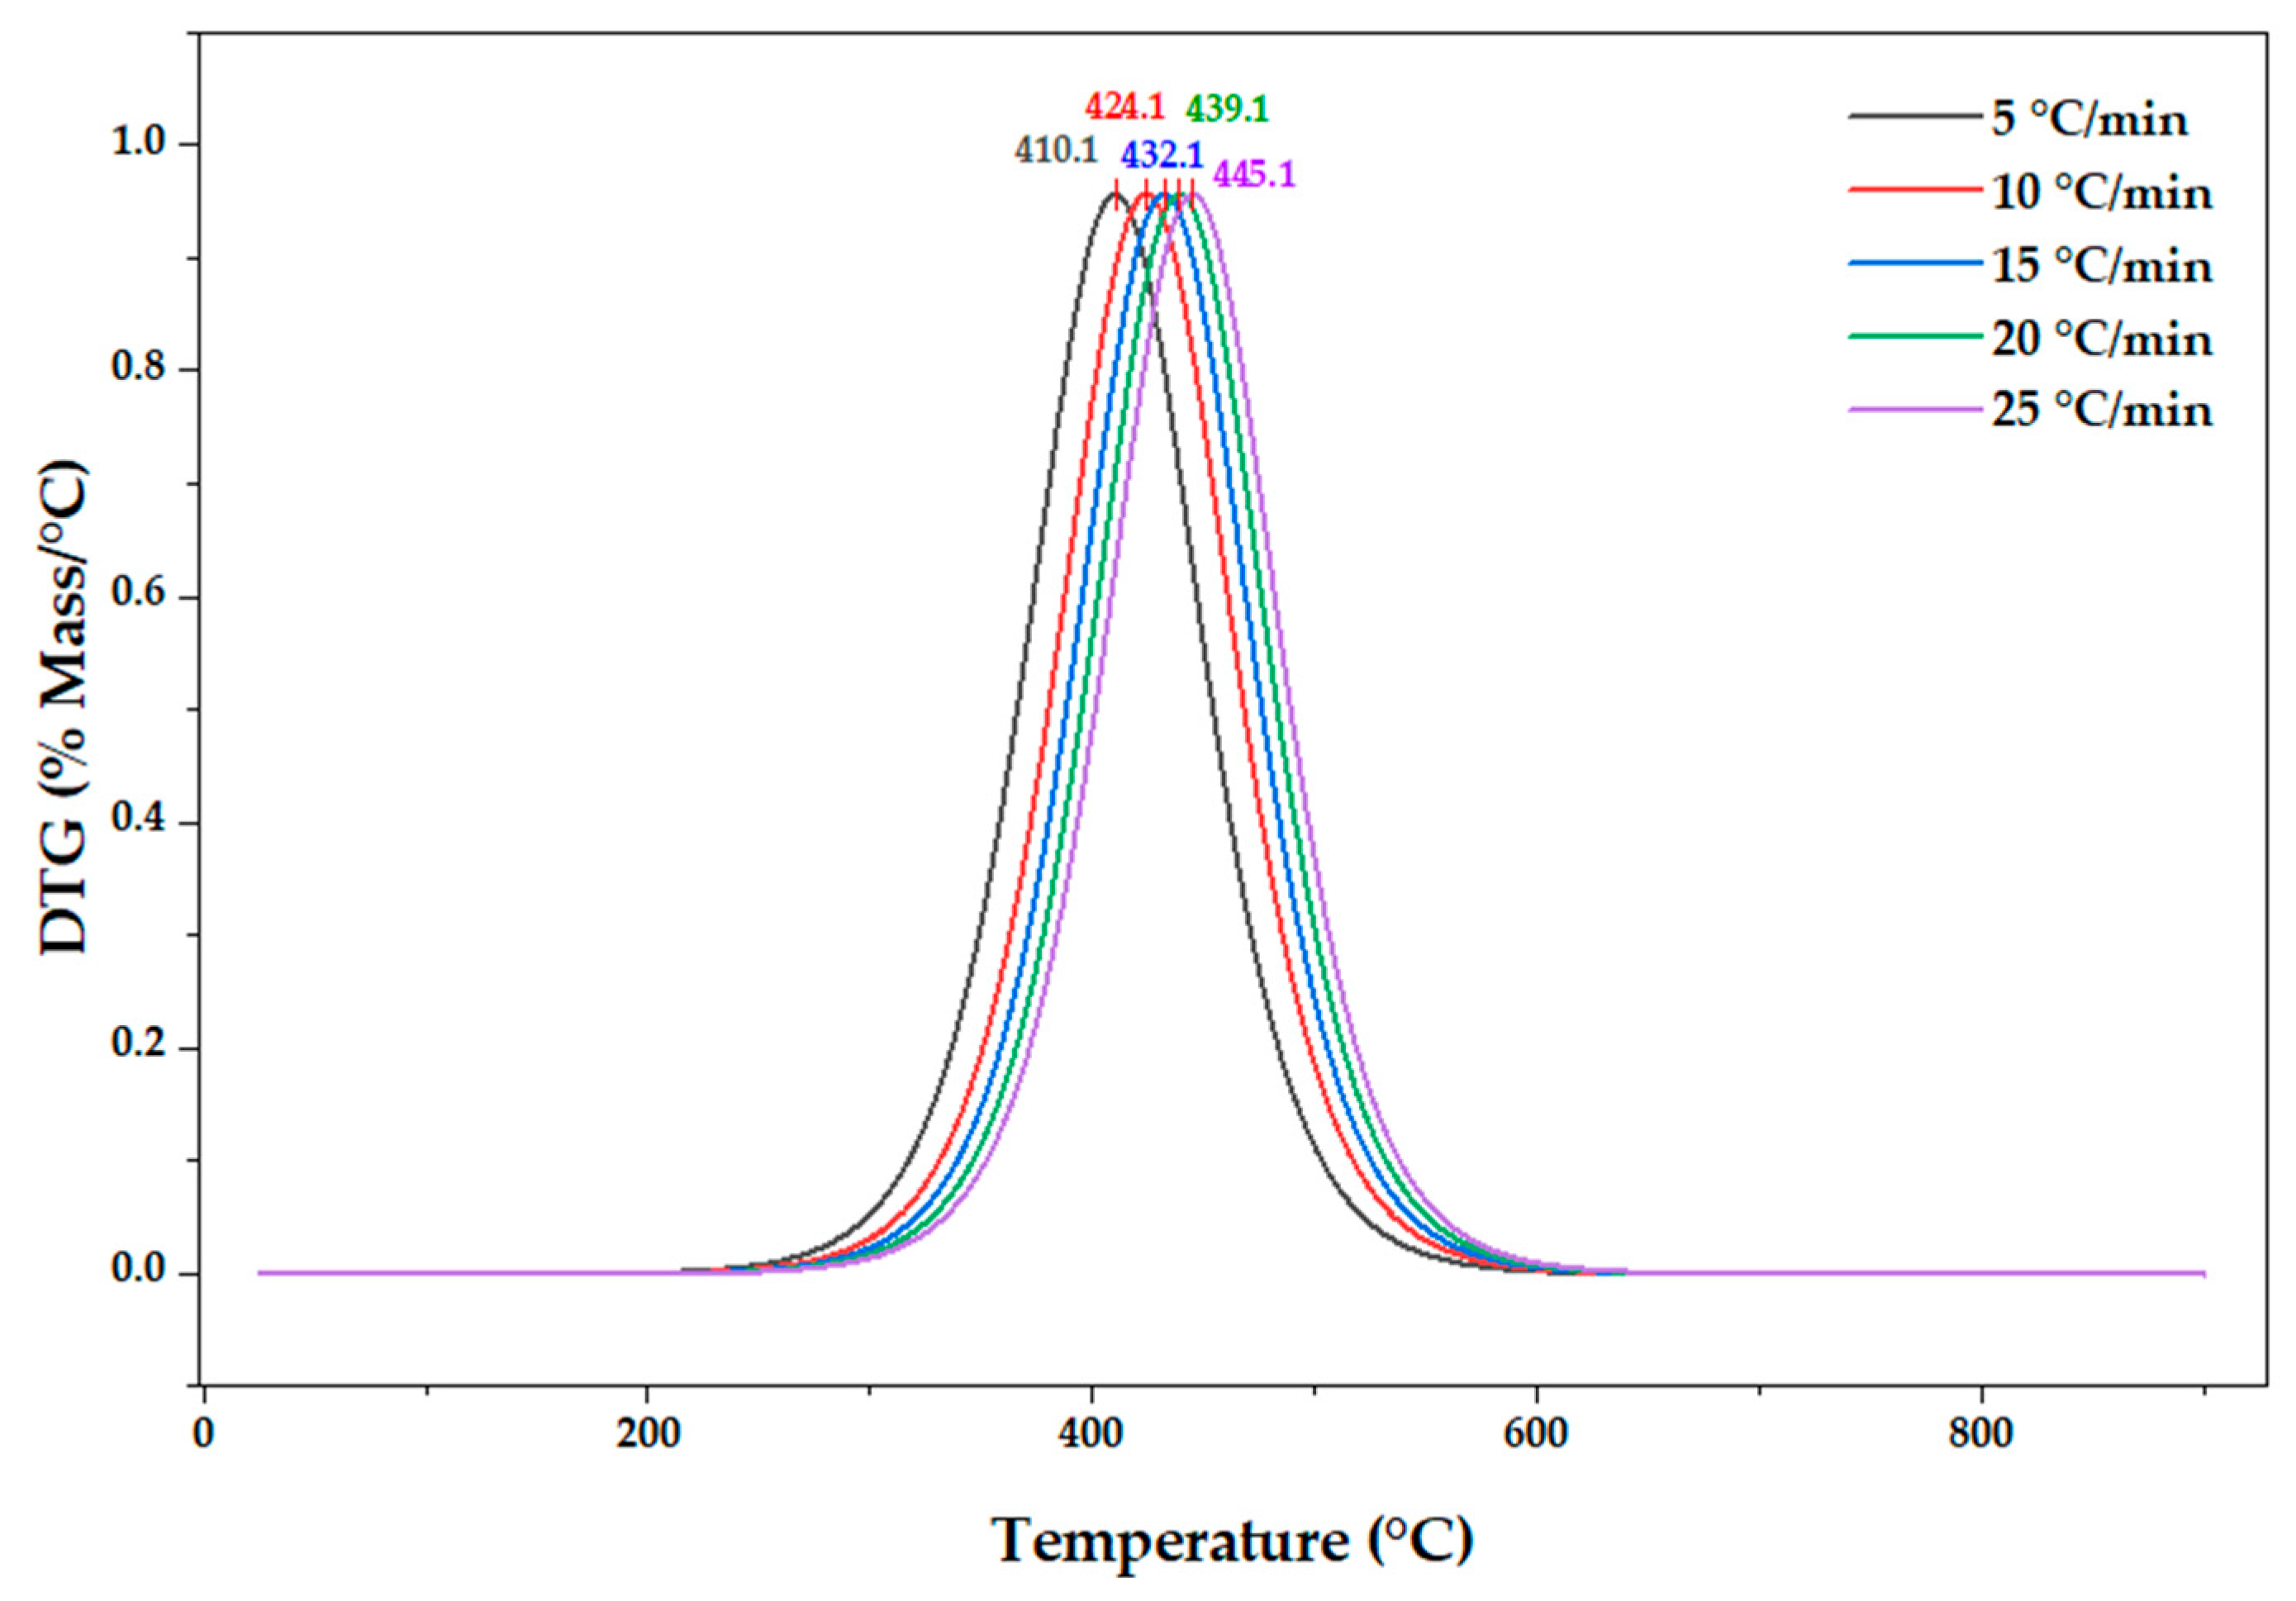
The DTG profiles further support this interpretation. A single dominant DTG maximum was observed for each heating rate, indicating that the maximum mass-loss rate occurs within a narrow thermal window associated with the main PS degradation event. The DTG maximum shifted from 426.5 °C at 5 °C min
−1 to 461.5 °C at 25 °C min
−1, following the same trend observed in the TGA curves. This shift confirms that faster heating delays the apparent maximum degradation rate because the polymer experiences a shorter effective residence time at each temperature [
47,
48,
49,
50].
As shown in
Figure 8, the DTG peak identifies the temperature at which the degradation rate is maximum; however, it should be interpreted as a macroscopic kinetic response rather than as direct evidence of an individual molecular cleavage event. The high-temperature DTG maximum reflects the combined thermal requirement for radical formation, chain fragmentation, product volatilization, and secondary reactions. In this sense, DTG analysis complements the DFT results but does not replace them. DFT identifies the relative molecular susceptibility of specific cleavage pathways, whereas DTG describes the temperature region in which the global degradation network reaches its maximum rate.
The specific contribution of the present thermal analysis is therefore not the conventional heating-rate-induced displacement of the TGA and DTG profiles. Rather, it is the demonstration that an apparently single dominant mass-loss event can coexist with a conversion-dependent apparent activation-energy profile and with non-equivalent molecular reaction energetics in the selected oligomeric model. This combined interpretation indicates that the apparently simple bulk degradation profile encompasses evolving contributions from radical generation, chain fragmentation, volatilization, and secondary reactions. However, no individual DFT reaction is assigned directly to a specific temperature or conversion interval.
3.6. Isoconversional Evolution of Activation Energy During PS Degradation
The apparent activation energies obtained from non-isothermal kinetic analysis are summarized in
Table 7. The Kissinger method yielded a global apparent activation energy of 186.6 kJ mol
−1 for the main DTG degradation event. In comparison, the FWO and KAS methods yielded average apparent activation energies of 184.6 and 182.4 kJ mol
−1, respectively, over the conversion interval α = 0.05–0.95. The close agreement among these three kinetic approaches indicates that independent non-isothermal approximations consistently describe the main thermal degradation event in additive-free PS.
The reliability of the Kissinger-derived activation energy was supported by the high linearity of the Kissinger plot, which yielded R
2 = 0.9977 and a 95% confidence interval for Ea of 170.072–203.149 kJ mol
−1 (
Table S5). In addition, regression analysis of the FWO-derived Ea values as a function of conversion degree showed a strong positive relationship between Ea and α, with R
2 = 0.9903 and a positive slope of 82.114 kJ mol
−1 per α unit. This confirms quantitatively that the apparent activation energy increases systematically as degradation progresses. The intercept of the Kissinger regression was used to estimate the global apparent pre-exponential factor according to A = (Ea/R) exp(b), where b is the regression intercept. Using Ea = 186.61 kJ mol
−1 and b = 20.606, an apparent A value of 1.996 × 10
13 min
−1, equivalent to 3.33 × 10
11 s
−1, was obtained. This value represents a global apparent parameter associated with the dominant mass-loss event under the conventional single-step Kissinger approximation and should not be interpreted as the frequency factor of an individual elementary reaction.
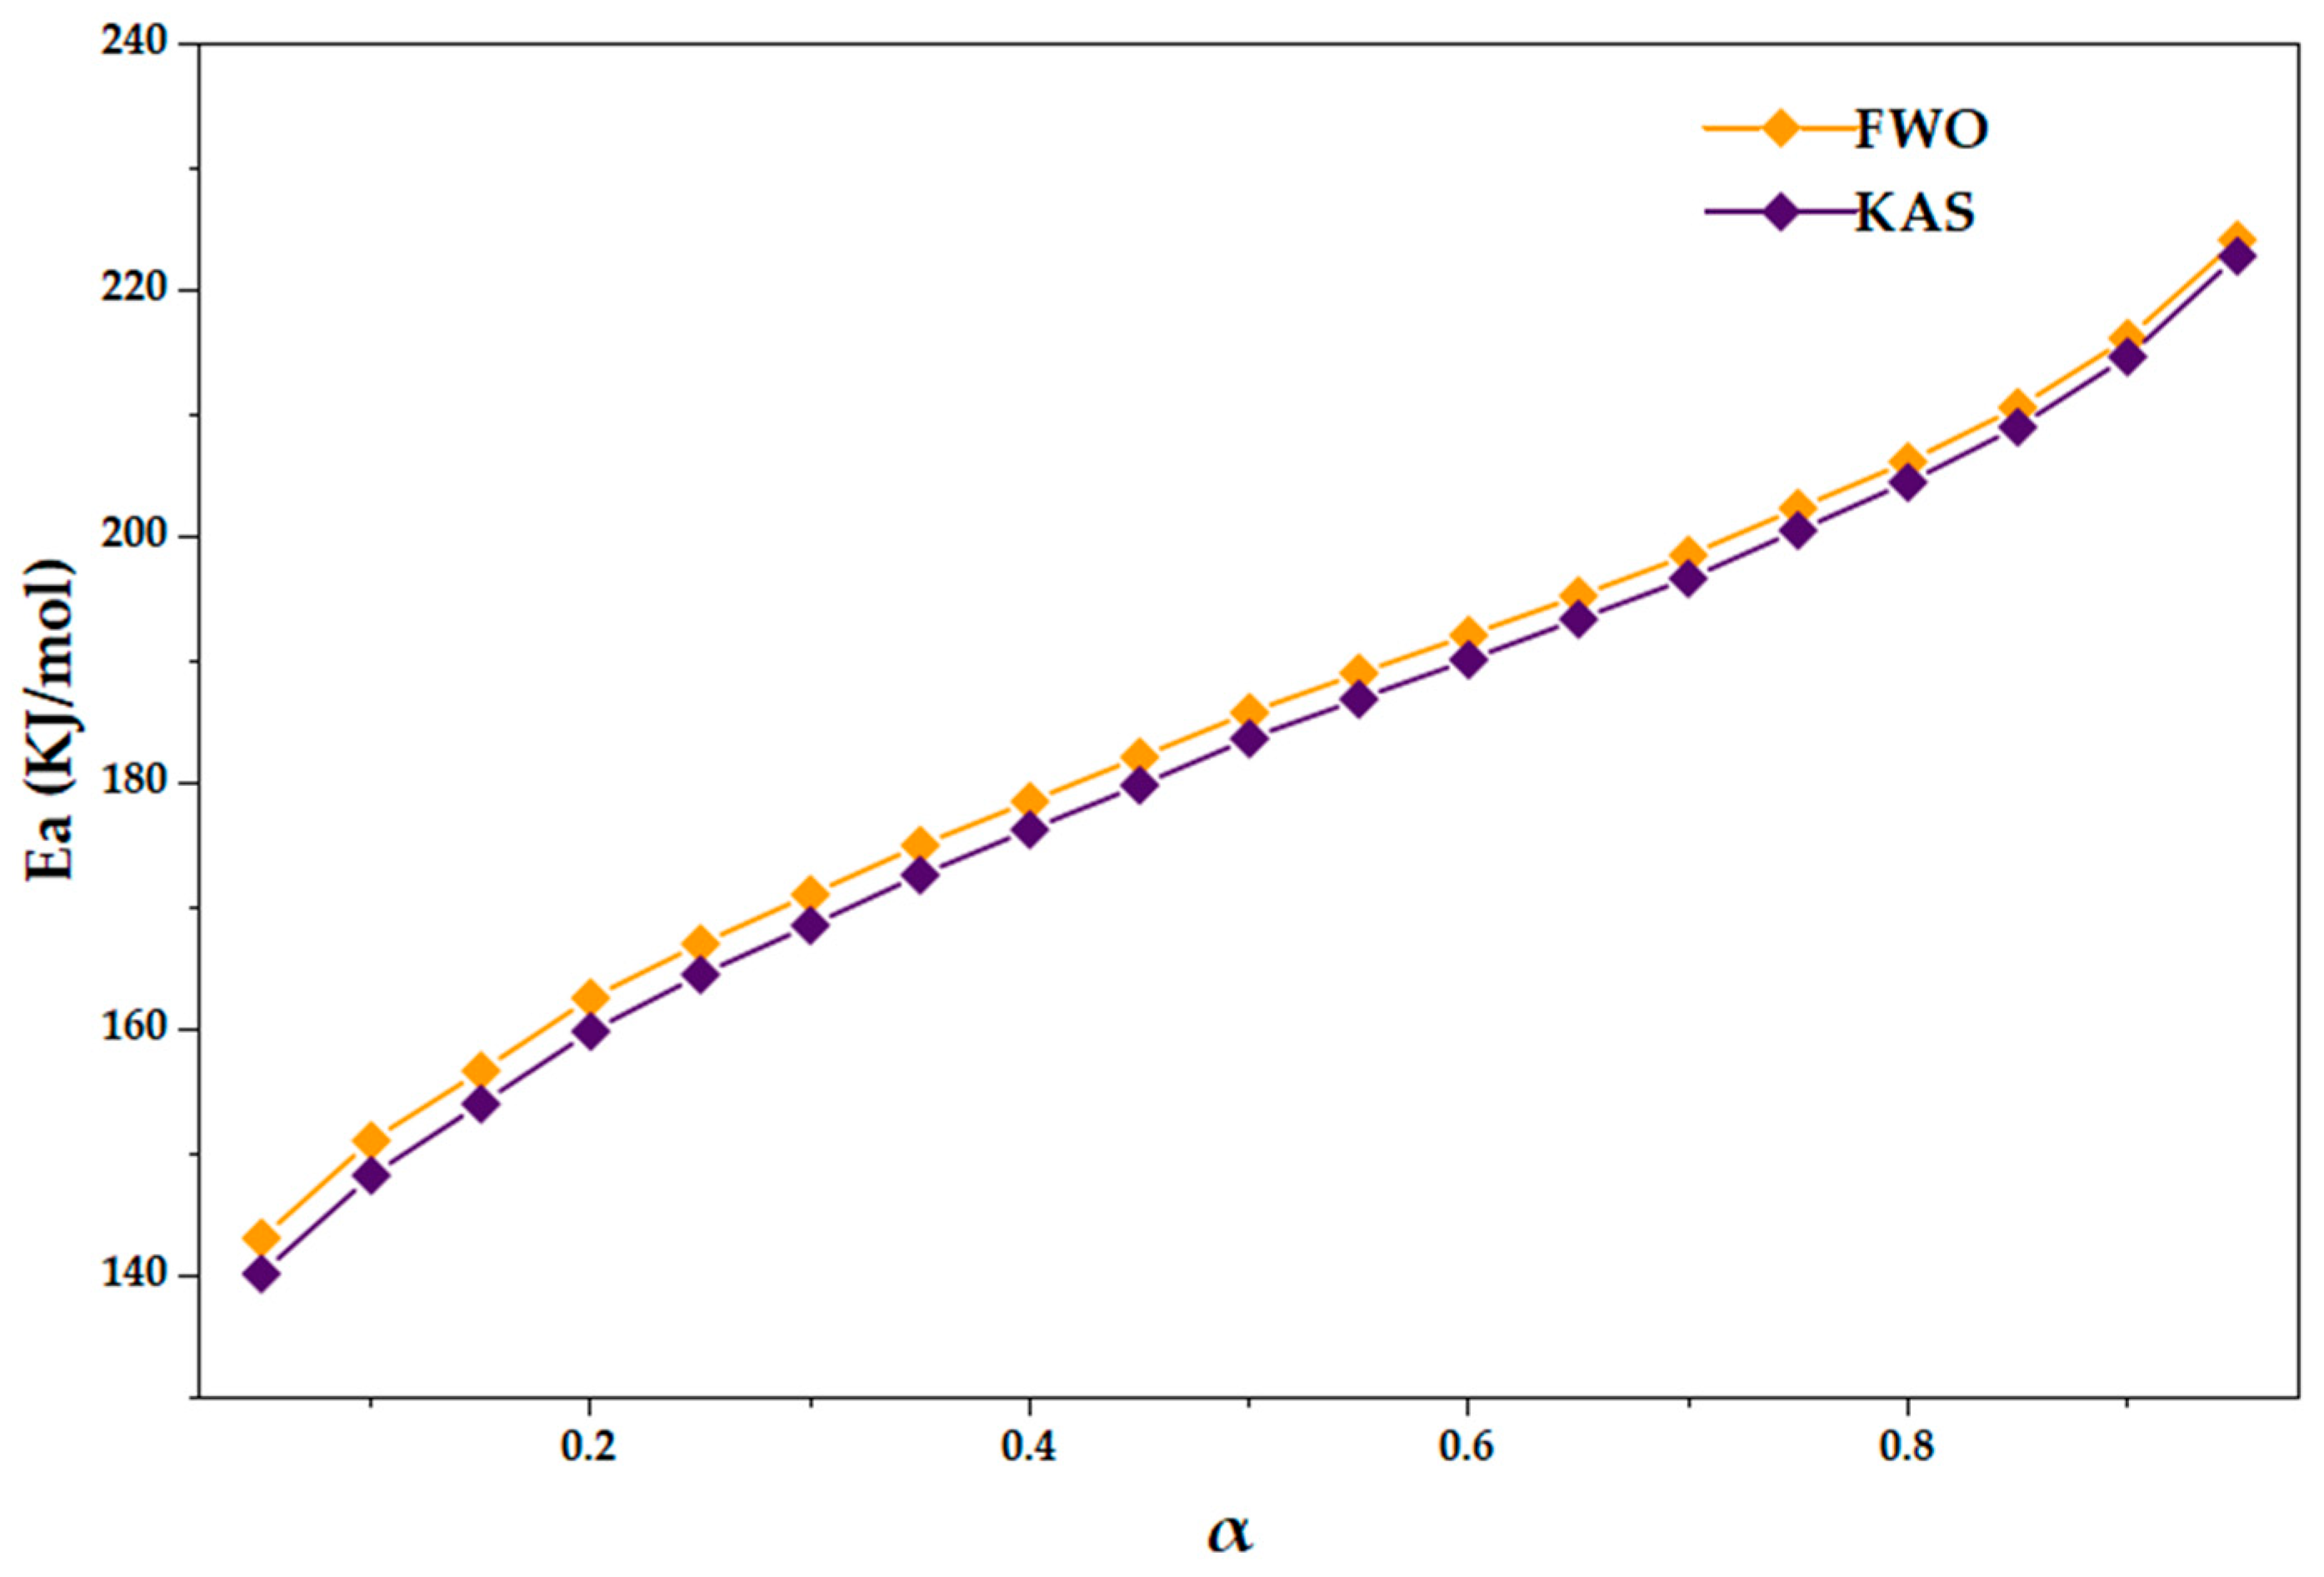
Pre-exponential factors were not derived from the FWO and KAS regressions because these model-free isoconversional methods require specification of the integral reaction model, g(α), before A can be determined. Since no unique solid-state reaction model was established, calculation of conversion-dependent A values would require an unsupported assumption. The conversion-dependent apparent activation-energy profiles obtained from the FWO and KAS methods are shown in
Figure 9. Furthermore, the availability of only one global Ea–A pair from Kissinger does not permit a statistically or mechanistically rigorous evaluation of the kinetic compensation effect.
Although the average Ea values obtained from FWO and KAS are close to the global Kissinger value, the conversion-dependent profiles provide more detailed mechanistic information. The apparent activation energy increased progressively as degradation advanced, rising from approximately 143.1 kJ mol−1 at α = 0.05 to 224.2 kJ mol−1 at α = 0.95, as determined by the FWO method. The KAS method showed the same upward trend, with slightly lower values throughout the conversion interval. This agreement indicates that the Ea–α trend is not an artifact of a single kinetic approximation, but a consistent feature of the non-isothermal degradation response.
The increase in apparent activation energy with the degree of conversion indicates that a single constant activation barrier cannot adequately describe PS degradation. At low conversion, the lower Ea values suggest that degradation is initiated through more accessible weak-link regions, chain-end contributions, or local sites where radical formation is comparatively less demanding. This stage is consistent with the DFT-derived homolytic cleavage profile, in which selected positions of the PS fragment exhibited lower BDE values than the rest of the evaluated backbone.
At intermediate conversion, the apparent activation energy approaches the average kinetic range obtained from Kissinger, FWO, and KAS. This region corresponds to the main mass-loss stage observed in the TGA/DTG profiles. It is expected to involve active radical propagation, β-scission, depropagation, and volatilization of styrene-rich fragments. The DFT results support this interpretation because β-scission exhibited lower thermodynamic requirements than homolytic initiation, as evidenced by the progressive decrease in ΔG along the evaluated pathway. Therefore, the intermediate conversion region can be interpreted as the macroscopic expression of an activated radical-propagation regime.
At high conversion, the continued increase in Ea indicates that the remaining material becomes progressively more resistant to degradation. This behavior can be attributed to the depletion of the most accessible degradation pathways and the increasing contribution of stabilized aromatic fragments, oligomeric residues, secondary cracking, and less reactive chain segments. Under these conditions, additional mass loss requires greater thermal input, which explains the higher apparent activation energies observed near the final conversion region.
The similarity between the FWO and KAS trends is important because both methods rely on different mathematical approximations of the temperature integral. Their agreement supports the robustness of the conversion-dependent kinetic interpretation. However, small numerical differences between FWO and KAS should not be overinterpreted, because both methods provide apparent activation energies for a global, multistep degradation process rather than exact barriers for individual molecular events.
The isoconversional analysis therefore strengthens the multiscale interpretation proposed in this work. Kissinger provides a global kinetic descriptor of the main degradation event, whereas FWO and KAS reveal that the apparent energetic demand evolves with conversion. DFT explains the molecular origin of this behavior by distinguishing between a high-energy homolytic initiation stage and a more favorable β-scission/depropagation regime. Consequently, the kinetic results should be interpreted as macroscopic evidence of a changing degradation network rather than as a direct numerical reproduction of the DFT-derived BDE sequence.
The DFT and thermogravimetric results describe different physical quantities and should not be interpreted as directly equivalent. The calculated BDE, ΔHrxn, and ΔGrxn values are local thermodynamic descriptors for selected molecular reactions in a finite, isolated gas-phase PS oligomer. In contrast, the apparent activation energies obtained from Kissinger, FWO, and KAS analyses are global kinetic parameters derived from the mass-loss response of a condensed polymer sample under non-isothermal conditions. The conversion degree, α, represents the fraction of total measurable mass loss and does not identify a specific chemical bond, molecular fragment, or elementary reaction. Moreover, the TGA response may include contributions from chain entanglement, intermolecular interactions, molten-phase viscosity, heat and mass transfer, volatile-product diffusion, secondary cracking, recombination, and residue evolution, none of which are represented explicitly in the isolated oligomeric calculation. Therefore, no C1–C10 position or calculated molecular reaction was assigned to a specific temperature, conversion interval, or apparent activation-energy value. The computational and experimental results are interpreted only as complementary, scale-dependent descriptions: DFT compares the relative thermodynamics of selected molecular processes within the defined oligomer, whereas TGA characterises the collective degradation behaviour of the bulk sample.
3.7. Conceptual Relationship Between Conversion-Dependent Kinetics and Oligomer-Based Thermodynamic Descriptors
The relationship between conversion-dependent apparent activation energy and oligomer-based thermodynamic descriptors is summarized conceptually in
Table 8. This comparison does not imply a one-to-one correspondence between a specific conversion interval and an individual C1–C10 reaction. The TGA-derived apparent activation energy reflects the collective contribution of radical generation, chain fragmentation, volatilization, heat transfer, and secondary reactions, whereas the DFT calculations describe selected molecular reactions within a finite oligomeric model. Accordingly, the two levels are compared qualitatively rather than through direct numerical or site-specific assignments. [
23,
28,
29].
At early conversion, the lower apparent activation-energy values may reflect the participation of comparatively susceptible chain environments, chain ends, or pre-existing structural defects. However, these contributions cannot be assigned specifically to the C2, C4, or any other cleavage position of the finite oligomer. At intermediate conversion, the main mass-loss region is consistent with the simultaneous contribution of radical fragmentation, β-scission, depropagation, and volatilization. The DFT calculations provide thermodynamic support for the possibility that selected radical-mediated fragmentation reactions become more favorable after radical generation, but they do not determine the activation barriers or kinetic sequence of those reactions. At advanced and final conversion, the increasing apparent activation energy may reflect the depletion of readily degradable structures and the greater contribution of persistent aromatic or oligomeric residues, which are not represented explicitly by the current finite oligomeric model [
17,
37,
51].
At low conversion, the lower apparent activation energy can be associated with the initial formation of radical centers at the most accessible weak-link regions. This interpretation is supported by the DFT results, in which the lowest homolytic BDE values were observed at selected positions on the PS fragment, particularly at C2 and C4. Although these sites do not represent the only possible initiation points in real PS, they provide molecular evidence that radical formation is not energetically uniform along the phenyl-substituted backbone [
18,
20,
52].
At intermediate conversion, the degradation process is expected to be dominated by β-scission, depropagation, and volatilization of styrene-rich fragments. This stage is consistent with the lower thermodynamic requirements calculated for β-scission, especially the progressive decrease in ΔG along the evaluated pathway. Consequently, the rapid mass-loss region observed in TGA/DTG can be interpreted as the macroscopic manifestation of a radical-mediated propagation regime that becomes increasingly favorable once the initiation barrier has been overcome [
23,
28,
29].
At high conversion, the increase in apparent activation energy suggests that the remaining material becomes progressively enriched in more resistant aromatic or oligomeric residues. Under these conditions, further degradation requires a higher thermal input because the most accessible weak links and propagation pathways have already contributed significantly to mass loss. This behavior is consistent with multistep polymer degradation, where the apparent activation energy evolves as the relative contributions of initiation, propagation, secondary cracking, and residual decomposition change with conversion [
17,
37,
51].
Overall, the conversion-dependent kinetic profile supports the proposed multiscale degradation framework. DFT identifies the molecular origin of weak-link susceptibility and β-scission favorability, whereas FWO and KAS describe how the apparent energetic demand evolves during the macroscopic thermal process. Therefore, the increasing Ea–α trend should not be interpreted as a direct reproduction of the BDE sequence, but rather as the kinetic expression of a dynamically evolving radical degradation network. This distinction strengthens the mechanistic interpretation and avoids overassigning individual DFT cleavage sites to specific conversion points [
18,
20,
52].
4. Conclusions
This study applied two complementary but physically distinct approaches to examine polystyrene degradation. Molecular-scale thermodynamic descriptors were obtained from DFT calculations for selected reactions within a finite isolated oligomeric model, whereas non-isothermal thermal and isoconversional analyses were used to characterize the global apparent kinetic response of the condensed polymer sample. The results indicate that PS degradation cannot be represented adequately by a single uniform energetic parameter. However, the computational and experimental quantities describe different physical phenomena and should not be interpreted as numerically equivalent or as establishing a direct correspondence between individual molecular reactions and conversion intervals.
For the hydrogen-terminated isotactic PS decamer, the calculated bond dissociation energies for homolytic backbone C–C cleavage ranged from 414.09 to 481.24 kJ mol−1. These values indicate that homolytic radical generation involves a comparatively high thermodynamic requirement within the evaluated reaction set. The C2 cleavage position exhibited the lowest calculated BDE, while C4 and C6 also presented comparatively low values. These differences show that the calculated bond-dissociation thermodynamics depend on the local molecular environment within the defined oligomeric structure. However, the C1–C10 labels represent distinct structural positions and should not be interpreted as consecutive elementary steps, a temporal reaction sequence, or a validated reaction coordinate.
The selected radical β-scission reactions presented Gibbs free-energy changes ranging from 55.44 to 189.41 kJ mol−1. These values were lower than the ΔGdiss values calculated for the evaluated homolytic-dissociation reactions, which ranged from 279.12 to 504.80 kJ mol−1. This numerical contrast indicates that the β-scission reactions involved smaller positive Gibbs free-energy penalties relative to their corresponding radical precursors within the finite oligomeric model. Nevertheless, the two reaction sets have different reactants, products, stoichiometries, fragment sizes, and terminal environments; therefore, the comparison is descriptive and model-dependent. The calculated quantities are thermodynamic reaction descriptors rather than activation barriers because transition states and intrinsic reaction coordinates were not determined. Consequently, the results do not establish the rate or kinetic preference of β-scission, demonstrate a sequential unzipping mechanism, or identify the elementary reactions responsible for the global mass-loss behavior observed by TGA.
The frontier molecular orbital analysis further showed that the electronic response of the selected PS model was spatially heterogeneous. The calculated HOMO–LUMO gap of 742.62 kJ mol−1 is consistent with the electronic stability of the closed-shell oligomeric structure under the adopted computational conditions. The localization of frontier orbitals over aromatic and benzylic regions identifies electronically responsive domains that may influence the relative stabilization of radical structures. This analysis supports a non-uniform electronic description of the oligomer but does not, by itself, quantify environmental persistence or determine the kinetics of backbone cleavage.
The thermogravimetric results provided the macroscopic counterpart to the molecular calculations. Both Tonset and Tmax shifted toward higher temperatures as the heating rate increased, consistent with kinetic delay, reduced residence time, and thermal-lag effects under non-isothermal conditions. The Kissinger method yielded a global apparent activation energy of 186.61 kJ mol−1. After applying the residual-mass correction defined in the conversion equation, the average apparent activation energies over α = 0.05–0.95 were 180.81 kJ mol−1 for FWO and 178.49 kJ mol−1 for KAS. Over the more conservative interval α = 0.10–0.90, the corresponding averages were 180.62 and 178.29 kJ mol−1.
The isoconversional analysis confirmed that a single constant apparent activation energy does not describe the complete mass-loss process. The FWO values increased from 143.10 kJ mol−1 at α = 0.05 to 221.71 kJ mol−1 at α = 0.95, whereas the KAS values increased from 140.10 to 220.23 kJ mol−1 over the same interval. Although all regressions exhibited high linearity, the confidence intervals became wider toward high conversion, indicating greater uncertainty near the final degradation region. Therefore, the endpoint values are reported for completeness, while the mechanistic discussion is focused primarily on α = 0.10–0.90.
The conversion-dependent variation in apparent activation energy is consistent with changing contributions from radical generation, chain fragmentation, volatilization, depletion of more reactive structures, and secondary reactions as degradation proceeds. These assignments remain qualitative because a fixed conversion interval represents the collective response of the bulk sample and cannot be associated directly with an individual molecular reaction or a specific C1–C10 position. In particular, the calculated BDE, ΔHrxn, and ΔGrxn values are not numerically equivalent to the apparent activation energies obtained from TGA.
The principal contribution of this work is therefore not the conventional displacement of TGA and DTG profiles with heating rate, but the demonstration that an apparently dominant mass-loss event can coexist with a conversion-dependent kinetic profile and with non-equivalent molecular reaction thermodynamics. The experimental and computational results provide complementary information at different scales: TGA describes the collective degradation response of the mechanically prepared PS fraction, whereas DFT compares selected reactions within a defined finite molecular model.
From a chemical-recycling perspective, the high calculated thermodynamic requirement for homolytic radical generation suggests that facilitating initial backbone activation may be an important target for future catalytic or process-development studies. Once radicals are formed, selected β-scission reactions display comparatively lower reaction free energies within the model. However, no catalyst, product distribution, reaction yield, or depolymerization selectivity was evaluated in the present work. The recycling implications should therefore be regarded as mechanistic hypotheses to guide subsequent experimental validation rather than as demonstrated process-performance conclusions.
Limitations and Scope of Applicability
The computational results must be interpreted within the boundaries of the selected finite oligomeric representation. The DFT analysis was performed using a hydrogen-terminated isotactic PS decamer with a fixed chain length, defined terminal groups, a single selected conformation, and a gas-phase molecular treatment. Consequently, the calculated homolytic-cleavage and radical β-scission descriptors are conditional on this specific molecular structure and computational framework.
The model does not reproduce the substantially higher molecular weights of commercial polystyrene, chain-length polydispersity, chain entanglement, broad conformational distributions, condensed-phase intermolecular interactions, amorphous-domain heterogeneity, branching, additives, impurities, oxidation, or possible cross-linking. These characteristics may be particularly relevant in real-world polystyrene microplastics exposed to manufacturing history, mechanical stress, ultraviolet radiation, thermal aging, and environmental weathering. Such factors can modify local bond environments, radical stabilization, volatile-product diffusion, and the overall thermal-degradation response.
The mechanically prepared PS fraction analyzed by TGA should likewise not be considered fully representative of heterogeneous environmental microplastics. The experimental sample provides a controlled laboratory material for examining thermal behavior, but it does not reproduce the complete variability in particle morphology, additive composition, oxidation state, contamination, and aging history encountered in environmental samples.
Accordingly, the calculated bond-dissociation and reaction free energies should not be used as direct quantitative predictors of bulk-polymer degradation or as elementary kinetic barriers. Similarly, the conversion-dependent activation energies derived from TGA are global apparent kinetic parameters and cannot be assigned directly to individual C1–C10 cleavage positions.
Future studies should evaluate longer oligomers, multiple chain lengths and conformations, different tacticities, oxidized and cross-linked structures, and periodic or condensed-phase models. Experimental extensions should include environmentally aged PS, additive-containing materials, replicate thermal measurements, and chemical identification of volatile and condensed degradation products. These developments would permit evaluation of chain-length convergence, conformational variability, intermolecular effects, product selectivity, and the influence of environmental aging on PS degradation.