Article

Detection of Microplastics in Coastal Environments Based on Semantic Segmentation

by
Javier Lorenzo-Navarro
1,*,
José Salas-Cáceres
1,
Modesto Castrillón-Santana
1,
May Gómez
2 and
Alicia Herrera
2
1
Instituto Universitario de Sistemas Inteligentes y Aplicaciones Numéricas en Ingeniería (SIANI), Universidad de Las Palmas de Gran Canaria, 35017 Las Palmas, Spain
2
Instituto Universitario de Investigación en Acuicultura Sostenible y Ecosistemas Marinos (ECOAQUA), Universidad de Las Palmas de Gran Canaria, 35017 Las Palmas, Spain
*
Author to whom correspondence should be addressed.
Microplastics 2026, 5(2), 66; https://doi.org/10.3390/microplastics5020066
Submission received: 23 December 2025 / Revised: 12 January 2026 / Accepted: 28 March 2026 / Published: 3 April 2026

Abstract

Microplastics represent an emerging threat to aquatic ecosystems, human health, and coastal aesthetics, with increasing concern about their accumulation on beaches due to ocean currents, wave action, and accidental spills. Despite their environmental impact, current methods for detecting and quantifying microplastics remain largely manual, time-consuming, and spatially limited. In this study, we propose a deep learning-based approach for the semantic segmentation of microplastics on sandy beaches, enabling pixel-level localization of small particles under real-world conditions. Twelve segmentation models were evaluated, including U-Net and its variants (Attention U-Net, ResUNet), as well as state-of-the-art architectures such as LinkNet, PAN, PSPNet, and YOLOv11 with segmentation heads. Models were trained and tested on augmented data patches, and their performance was assessed using Intersection over Union (IoU) and Dice coefficient metrics. LinkNet achieved the best performance with a Dice coefficient of 80% and an IoU of 72.6% on the test set, showing superior capability in segmenting microplastics even in the presence of visual clutter such as debris or sand variation. Qualitative results support the quantitative findings, highlighting the robustness of the model in complex scenes.

1. Introduction

Plastics, while versatile in applications ranging from industry to food preservation, pose a significant environmental threat when they decompose into smaller fragments known as microplastics. Microplastics are an environmental issue that severely impacts aquatic ecosystems. It is estimated that between 4.7 and 12.8 million metric tons of plastic entered the ocean in 2010, and without proper management, the accumulated amount of plastic waste that could enter the ocean from land is projected to increase by an order of magnitude by 2025 [1]. These plastics fragment due to UV radiation and wave action into increasingly smaller pieces, transforming into microplastics. Microplastics are deposited on shores, carried by sea currents, and in highly exposed areas, concentrations on beaches can reach values of more than 300 g of microplastics per square meter [2].
Coastal plastic pollution has escalated into a systemic environmental crisis. Quantitatively, it is estimated that between 11 and 14 million metric tons of plastic waste leak into marine ecosystems annually, contributing to a total oceanic accumulation that may exceed 199 million tons by 2025 [3]. This pollution is not merely an aesthetic issue; qualitatively, it results in the physical smothering of coral reefs and mangroves, and the chemical contamination of the food chain through microplastic ingestion. In [4], a study on the Macaronesia islands showed the presence of plastic marine litter on all the beaches studied, with an average concentration of 1760 items/m2 and 15.30 g/m2 for microplastics, reaching in some beaches more than 3000 items/m2 and almost 33 g/m2.
In addition to the harm they may cause to marine organisms that ingest them, microplastics also cause aesthetic and landscape damage. This is a growing concern for citizens, local authorities in coastal areas, as well as for administrations at all levels and research funding programs. This issue became evident following the accident of the “Toconao” ship off the Portuguese coast in December 2023. The ship was carrying containers filled with pellets, the raw material used to manufacture plastics, which are about 5 mm in diameter. This type of spill generates significant environmental damage due to the impossibility of removing these pellets from the sea because of their small size and the large number of pellets each container holds. Once they reach the shores, cleaning and removing them from the beaches is very difficult, which caused great public alarm.
Furthermore, the toxicity of these pellets depends on the additives they carry, which could pose a problem for marine organisms and marine seabirds. This accident highlighted the need for monitoring and alert systems to detect the arrival of unusually high quantities of pellets or any other type of microplastic that could pose a threat to ecosystems or cause significant landscape damage on beaches. Various studies have demonstrated the significant variability in the reaching of microplastics on beaches, which depends on wind, wave action, and currents [2]. This results in a substantial difference in concentration even between consecutive days of sampling, making it very difficult to monitor coastal arrival due to the considerable sampling effort and enormous expense in human resources.
In Europe, the objective of the Marine Strategy Framework Directive (MSFD, 2008/56/EC) [5] is to assess trends in good environmental status, for which it is necessary to implement monitoring programs, in this case, for Descriptor 10 related to marine litter. As noted by Galgani et al. [6], the unequal spatial and temporal distribution of marine debris presents a challenge when designing a statistically robust monitoring program. Therefore, one of the major challenges in this field of study is finding a way to automate both the quantification and classification of microplastics, saving time and sampling effort.
Thanks to Artificial Intelligence, several studies are attempting to develop technologies with this goal in mind. Additionally, citizens who visit beaches daily could help by collecting samples or images that would allow automated quantification and classification, generating data that would inform authorities of possible spills or unusually high microplastic arrivals, enabling them to make decisions such as increasing cleaning services. Currently, apps Marine Litter Watch [7] or MARNOBA [8] have been developed for use with smartphones to monitor macro-litter, but to date, mesoplastics (5–25 mm) and microplastics (1–5 mm) have not been included.
The analysis of debris on the coast, especially plastic debris, is of significant interest to the scientific community. In some cases, this analysis is performed manually by experts who analyze aerial images, as demonstrated by the study conducted by Moy et al. [9], which analyzed almost 76 km of coastline across the main Hawaiian Islands of Niihau, Kauai, Oahu, Molokai, Lanai, Maui, Kahoolawe, and Hawaii. A similar study is that of Deidun et al. [10], where aerial images of the Maltese Islands were used to categorize different types of debris, including plastics. In another example of visual analysis, Kako et al. [11] monitored Newport Beach in Oregon over the course of one year to observe whether debris from the Great Tohoku Earthquake and the massive tsunami of 11 March 2011, reached the west coast of the United States. Photographs were taken and analyzed to count the amount of debris present on the beach. Visual analysis of images is time-consuming, so the introduction of automatic techniques from the field of computer vision can alleviate the task and enable the monitoring of wider areas. Gonçalvez et al. [12] analyzed the presence of plastics on Cabedelo Beach (Portugal) using aerial images captured by a drone. Those authors focused on meso-litter items (sizes between 2.5 cm and 50 cm) due to the resolution of the images taken from an altitude of 20 m. Meso-litter items were classified at the pixel level using color as an input feature to a Random Forest classifier [13]. The images were divided into 320 × 320-sized patches, which were then rescaled to 64 × 64. Results were reported in terms of the F1-score, as the task was approached as a classification problem, yielding scores of 76% and 57% for plastics located on the beach and in the dunes, respectively. F1-score is the harmonic mean of precision and recall, where precision is the proportion of samples predicted as positive by the classifier that are actually true positives, and recall (also known as sensivity) is the proportion of actual positive samples that are correctly identified as positive by the classifier.
Pinto et al. [14] made use of a neural network on Leirosa Beach (Portugal), achieving an average F1-score of 49% across the different types of litter considered. In a more recent study, Ross Winans [15] utilized the annotated images from Moy et al. [9] to train various deep learning methods for litter detection, with the best F1-score of 50.7% achieved using Single Shot MultiBox Detector (SSD) [16] with MobileNetV2 [17] which is a is a lightweight convolutional neural network architecture
Previous works that aim to automatically detect plastic items on beaches using methods from the computer vision field primarily focus on object detection that do not delineate them at the pixel level in images. To achieve the latter, segmentation methods have been proposed, receiving significant attention in the computer vision field over the decades. In recent years, with the rise of deep learning approaches, numerous methods have been proposed. One of the first proposed methods was the Fully Convolutional Network (FCN) [18], which modifies traditional Convolutional Neural Networks (CNNs) for pixel-wise prediction tasks. This is achieved by replacing fully connected layers with convolutional layers. Other models obtained as an improvement of a detection models are Mask Region-based Convolutional Neural Network (R-CNN) [19] and YOLO [20]. Thus, Mask R-CNN is an extension of Faster R-CNN [21], integrates instance segmentation capabilities by adding a branch that predicts segmentation masks for each Region of Interest (RoI). Similarly, YOLO, originally designed for object detection, has evolved to include segmentation capabilities. Its latest versions provide instance segmentation by predicting masks for detected objects. Another widely used model is U-Net [22], featuring an encoder-decoder architecture with skip connections. These connections enable precise localization while preserving contextual information. Similarly, LinkNet [23] employs an encoder–decoder architecture with skip connections, achieving competitive performance while using significantly fewer parameters. The Pyramid Attention Network (PAN) [24] leverages a spatial pyramid attention mechanism to enhance feature extraction for semantic segmentation. By incorporating attention mechanisms, PAN effectively captures global context and improves pixel-level classification accuracy. These methods will be discussed in more detail in Section 2.2.
The present study represents an effort in the development of software for the automatic quantification of microplastics on beaches, which could be incorporated into any of the currently existing apps for marine litter monitoring. In this context, our work focuses on benchmarking optimal neural network architectures for microplastic segmentation in coastal environments. The objective of this study is to contribute to a scalable and efficient monitoring solution for coastal microplastic accumulation. Unlike laboratory-intensive methodologies, such as those involving chemical digestion and FTIR spectroscopy, which offer high-fidelity classification but are constrained by high costs and time demands, this work focuses on a rapid screening approach. By utilizing deep learning-based semantic segmentation, we aim to build a bridge between automated detection and environmental monitoring. This system is designed to facilitate long-term, extensive spatial assessments, providing a critical tool for local authorities to monitor plastic arrival trends and respond to environmental incidents with minimal human resource intervention.

2. Materials and Methods

2.1. Microplastic Images Dataset

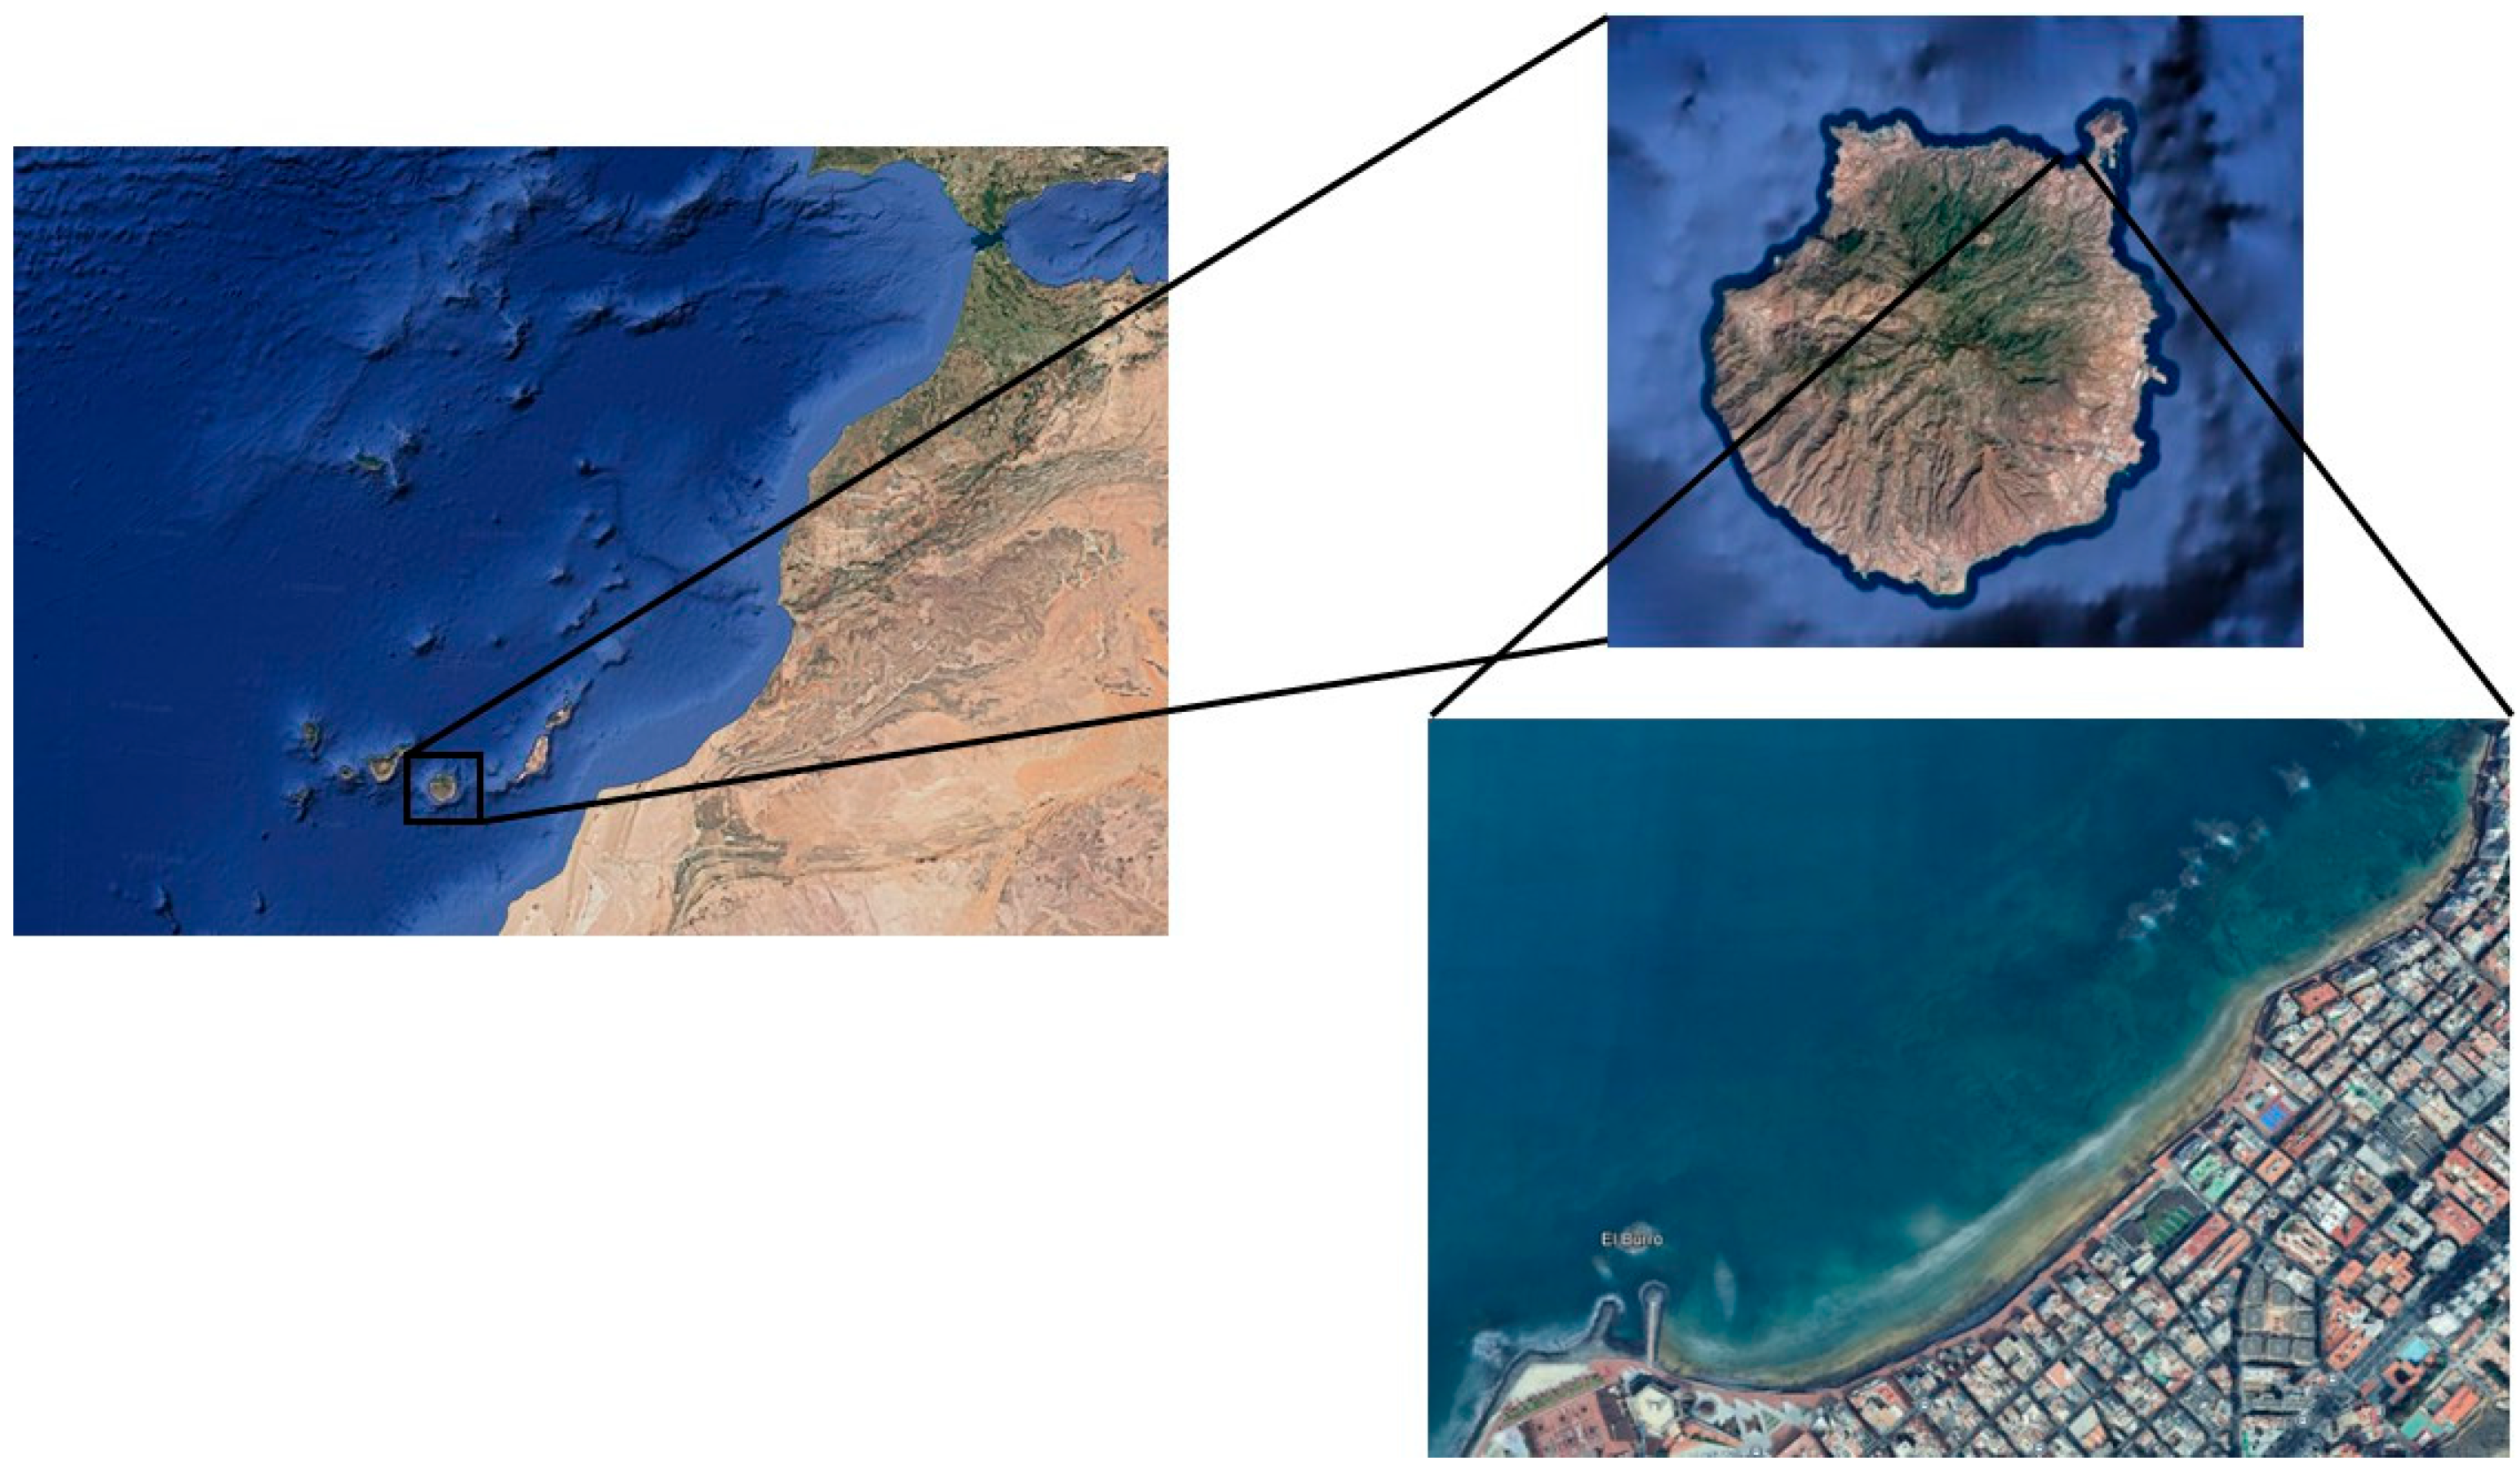
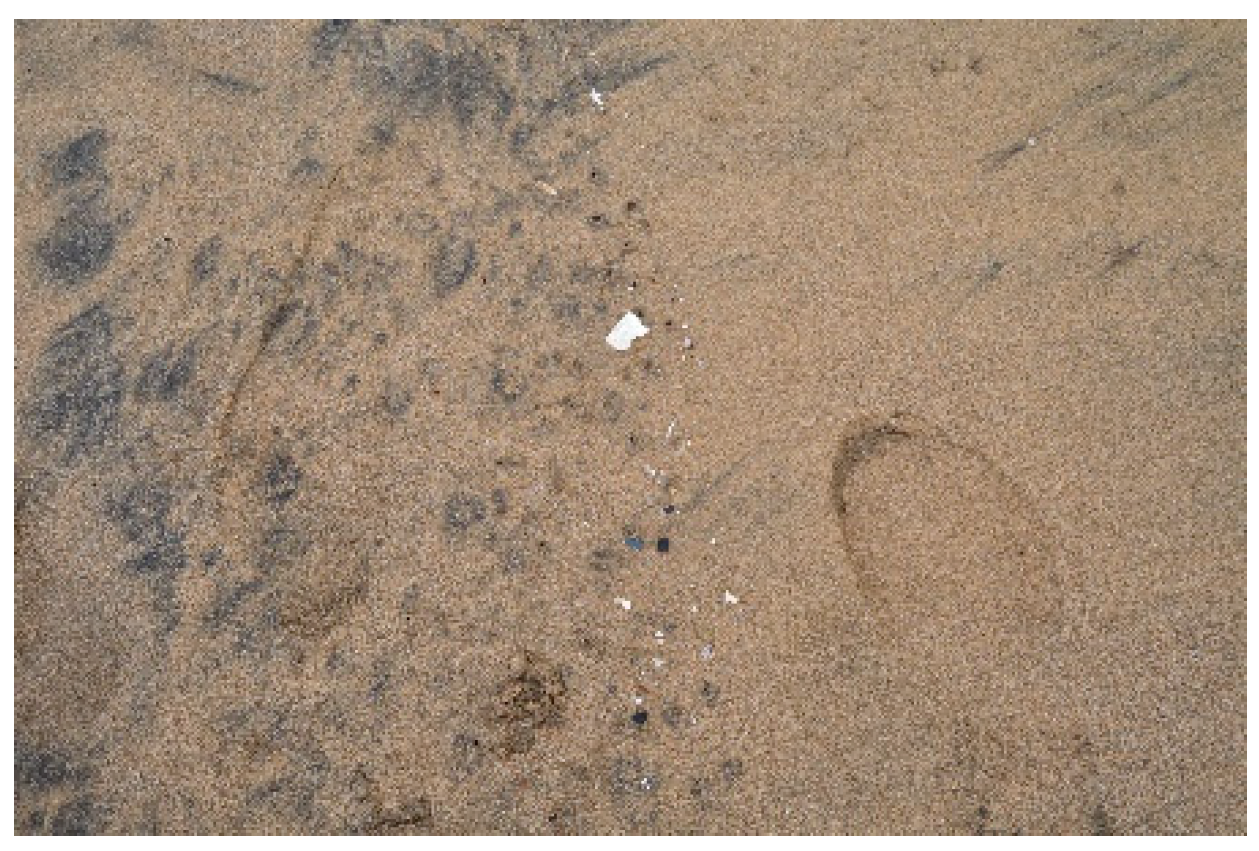
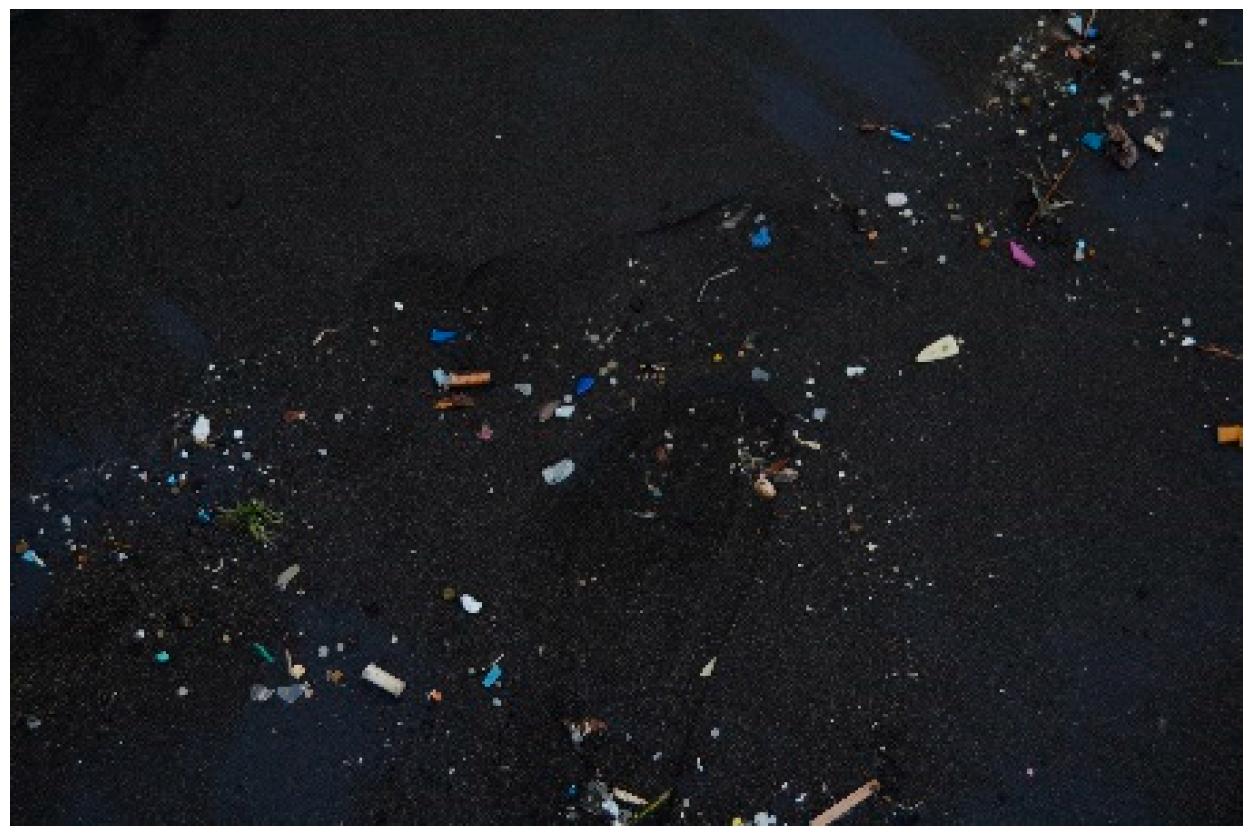
Images of the microplastics were captured using a Nikon (Nikon Corp., Tokyo, Japan) D5100 digital camera (4928 × 3264 pixels) and an iPhone 12 (Apple Inc., Cupertino, CA, USA) with a 12-megapixel camera (4032 × 3024 pixels), both positioned at a height of approximately 1 m. Data collection took place at Las Canteras Beach (28°08′02″ N, 15°26′30″ W), a sandy urban beach located on the northern coast of Gran Canaria (Spain) facing the North Atlantic Ocean (Figure 1). The total length of the beach is approximately 3 km, but the area under consideration is the westernmost part, as it is the most exposed to currents and spans roughly 800 m. In this part of the beach, the sand displays several shades, ranging from yellow (Figure 2) to dark gray (Figure 3).
The use of a drone was discarded because achieving sufficient resolution to detect small plastic particles requires the drone to fly at very low altitudes, which, as noted by Andriolo [25], poses significant safety risks for people on the beach. For example, Topouzelis et al. [26] report that using a Sony A5100 24.3-megapixel camera mounted on a drone flying at an altitude of 100 m results in a spatial resolution of approximately 5 cm/pixel, making this approach unfeasible for detecting microplastics with sizes on the order of millimeters.
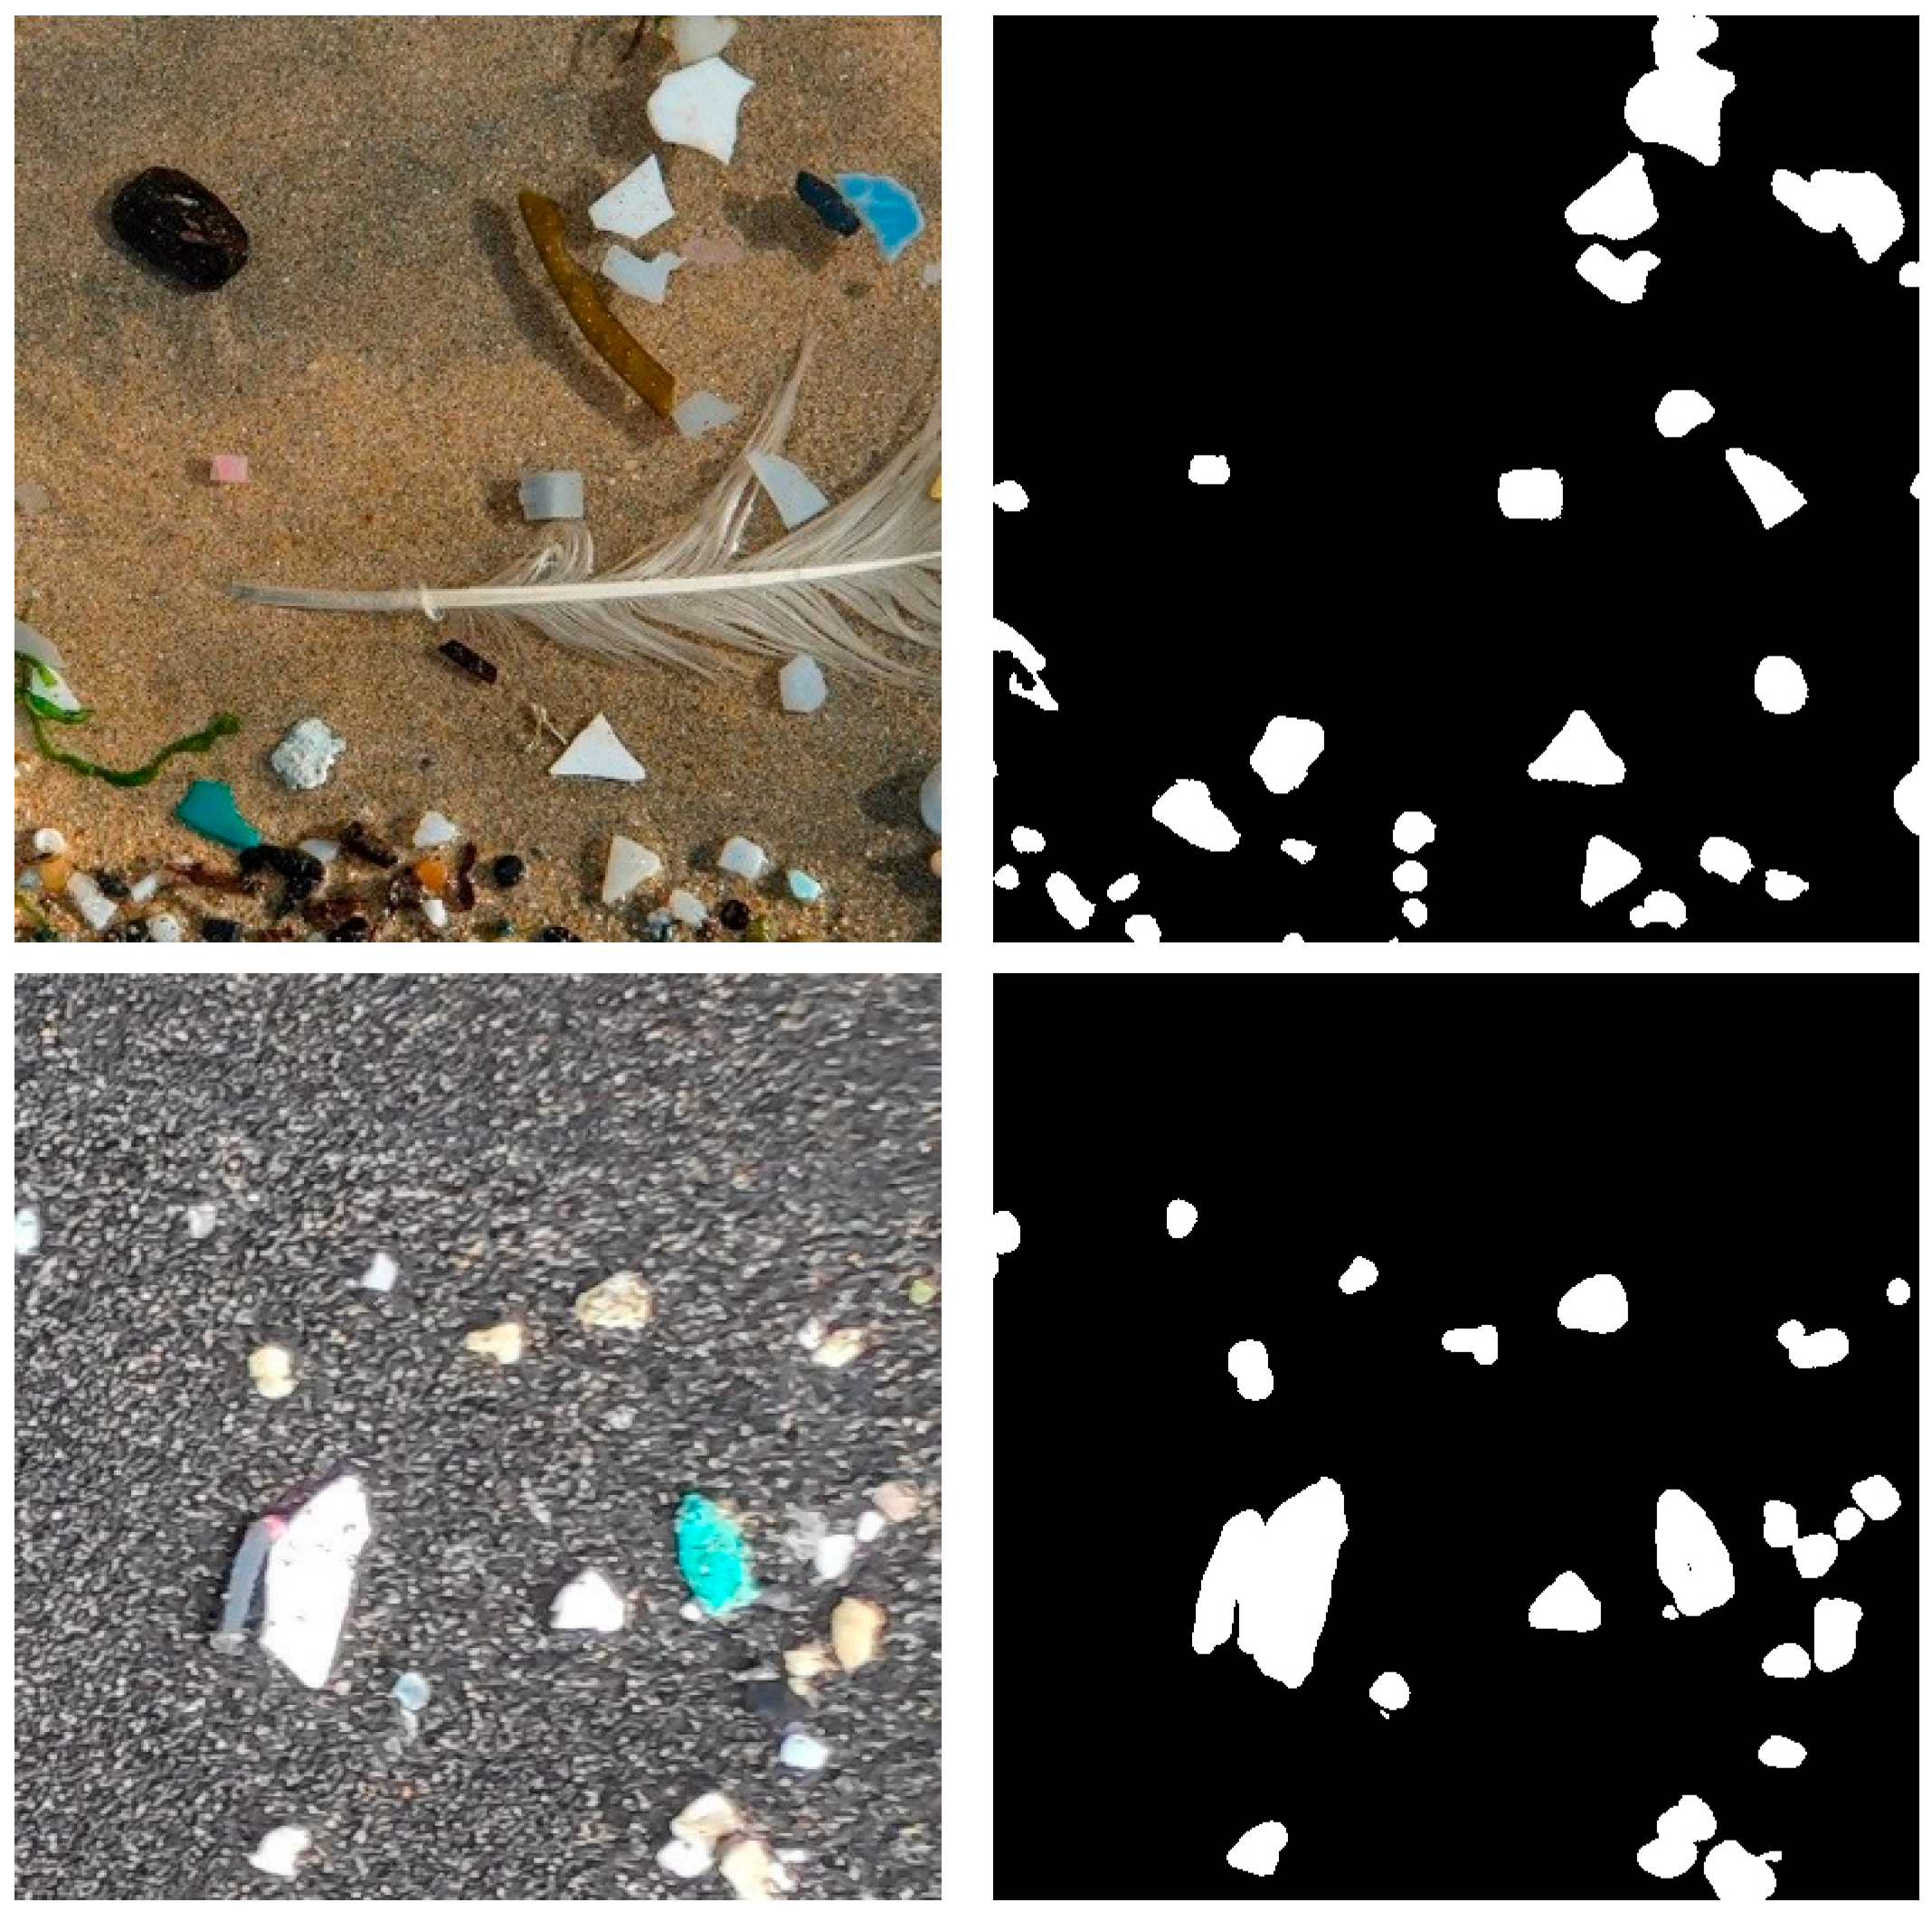
The images acquired with the camera and mobile phone are of high resolution, 4928 × 3264 pixels and 3840 × 2160 pixels, respectively, which implies that the models need to increase their number of parameters to process the original images at full size. These 72 images were obtained from two image acquisition campaigns conducted as part of two master’s theses [27,28]. A common technique widely used to address this issue is dividing high-resolution images into smaller patches. For example, Han et al. [29] employed 512 × 512-sized patches as input to the Mask R-CNN network to segment images of microplastics captured in a laboratory setting against a white background. In this paper, we have opted to divide the images into patches of 256 × 256 pixels. As a result, a dataset comprising 604 images with corresponding annotations was created. Figure 4 shows examples of the cropped images alongside their corresponding annotations. A similar approach was applied by Lorenzo-Navarro et al. [30] to classify microplastic particles using a combination of U-Net as segmenter and VGG16 as classifier.

2.2. Methods

As stated in the introduction, the aim of this paper is to evaluate whether segmentation methods can effectively segment microplastics on the beach that have been washed ashore by the tide. In this study, we considered six architectures, including some variations, resulting in a total of 12 methods. The methods were implemented in Python 3.10 using PyTorch 2.9.1 and trained on an NVIDIA GPU with CUDA 12.6.
A brief description of each method is provided below.

2.2.1. U-Net

The U-Net architecture comprises a contracting path for feature extraction and an expansive path for precise localization. The contracting path includes repeated 3 × 3 convolutions with ReLU activation, followed by 2 × 2 max pooling for downsampling, doubling the feature channels at each step. The expansive path involves upsampling, 2 × 2 “up-convolutions” to halve feature channels, concatenation with corresponding cropped features from the contracting path, and 3 × 3 convolutions with ReLU activation. A final 1 × 1 convolution map features the desired classes. The network contains 23 convolutional layers.
Some variations of the original architecture have been proposed. Attention U-Net [31] incorporates attention gates (AGs) to refine the skip connections by emphasizing salient features and filtering out irrelevant or noisy responses before the concatenation step. AGs also downweight gradients from background regions during the backward pass, ensuring that updates to the shallow layers prioritize spatially relevant areas. Another variant of the U-Net is ResUNet [32] where convolutional blocks in the U-Net are replaced by residual blocks [33] to ease training, enhance information propagation through skip connections, and achieve high performance with fewer parameters.

2.2.2. YOLO

YOLO [20] is a series of models initially proposed as real-time object detection framework that treat detection as a single regression problem, predicting bounding boxes and class probabilities directly from an image in one evaluation. Recent versions, such as those developed by Ultralytics (e.g., YOLOv8), have extended YOLO’s capabilities to include instance segmentation. These models retain the core YOLO architecture made up of a backbone for feature extraction, a neck for multi-scale feature aggregation, and a detection head, but augment it with a segmentation head that generates mask prototypes and affinity maps to delineate object boundaries. The segmentation head operates in parallel with the bounding box and class prediction heads, leveraging the same multi-scale features to ensure efficient, real-time performance.

2.2.3. LinkNet

The LinkNet architecture consists of an encoding path for feature extraction and a decoding path for reconstruction. The encoding path follows one of the ResNet backbones, using residual blocks with repeated 3 × 3 convolutions, batch normalization, and ReLU activation. Downsampling is achieved through strided convolutions, reducing spatial resolution and increasing the number of feature channels.
The decoding path mirrors the encoding process, but progressively restores spatial resolution using transposed convolutions (“up-convolutions”). Each decoder block is directly linked to its corresponding encoder block through residual connections, which transfer spatial information without additional learnable parameters. This linkage compensates for information loss caused by downsampling, enabling efficient reconstruction with minimal computational overhead. A final 1 × 1 convolution maps the feature maps to the desired segmentation classes.

2.2.4. Feature Pyramid Network

Feature Pyramid Network (FPN) [34] is not a standalone architecture but a feature enhancement strategy that can be integrated into various models. It is a top-down feature fusion mechanism designed to enhance multi-scale feature representations in deep convolutional networks. Unlike traditional approaches that use single-scale features or computationally expensive featurized image pyramids, FPN leverages the inherent pyramidal hierarchy of convolutional networks while maintaining high-level semantic information across all scales.
FPN consists of a bottom-up pathway, a top-down pathway, and lateral connections. The bottom-up pathway extracts hierarchical features using a convolutional backbone (e.g., ResNet), where deeper layers capture more abstract representations at progressively lower resolutions. The top-down pathway upsamples these high-level features, while lateral connections merge them with semantically weaker but spatially richer features from earlier layers using 1 × 1 convolutions and element-wise addition. A final 3 × 3 convolution is applied to refine the fused features. This approach ensures that all levels of the feature pyramid contain strong semantic representations, making it well-suited for tasks like object detection and segmentation.

2.2.5. Pyramid Attention Network

The Pyramid Attention Network (PAN) [34] is a deep learning model designed for semantic segmentation that combines attention mechanisms with spatial pyramids to improve feature extraction and pixel-wise classification. Unlike traditional approaches that rely on complex decoder structures or dilated convolutions, PAN integrates Feature Pyramid Attention (FPA) and Global Attention Upsample (GAU) modules to enhance multi-scale feature representation and spatial precision.
The Feature Pyramid Attention (FPA) module employs a spatial pyramid attention structure to capture multi-scale contextual information effectively while preserving localization details. It utilizes multiple convolutional kernels of different sizes, followed by global average pooling, to refine high-level feature maps.
The Global Attention Upsample (GAU) module improves the decoding process by using high-level global context to guide the upsampling of lower-level features, ensuring that category-specific information is retained while reducing computational overhead.

2.2.6. Pyramid Scene Parsing Network

Pyramid Scene Parsing network (PSP) [35] is a deep learning model designed to improve semantic segmentation by effectively capturing both local and global context information. Traditional Fully Convolutional Networks (FCNs) often struggle to understand complex scenes due to limited contextual awareness. PSPNet addresses this by introducing a pyramid pooling module that aggregates context from multiple regions, enabling the network to consider various scales of contextual information.
The pyramid pooling module operates by pooling features from different subregions of the image, generating representations that encompass diverse contextual scopes. These pooled features are then combined with the original feature map to produce a global prior, which enhances the network’s ability to parse scenes with complex and varied objects.

2.2.7. Loss

To mitigate segmentation bias [36], the models were trained using binary cross-entropy loss (Equation (1)). Binary cross-entropy is a widely used loss function for binary classification tasks, including binary segmentation, where the goal is to classify each pixel as belonging to either the foreground (class 1) or the background (class 0). The loss function measures the difference between the ground truth labels y i and the predicted probabilities y ^ i  for each pixel i. It is defined as:
L y , y ^ = 1 N i = 1 N [ y i log y ^ i + 1 y i log ( 1 y ^ i ) ]  
Here, y i represents the ground truth label (0 or 1) for pixel i, y ^ i is the predicted probability that pixel i belongs to the foreground, and N is the total number of pixels. The loss function penalizes incorrect predictions more heavily when the model is confident but wrong, encouraging the model to produce well-calibrated probabilities.

3. Results

To evaluate the performance of the segmentation models described in Section 2.2, we will use both the Intersection over Union (IoU) and the Dice coefficient (Dice) metrics. The IoU is a widely used metric for evaluating segmentation methods, as it measures the percentage of overlapping pixels between the ground truth and the predicted segmentation relative to their total union. The IoU is defined as:
I o U = A B A B  
where A represents the ground truth (i.e., the labeled image), and B denotes the predicted regions of the segmentation method. Here, A B is the number of overlapping pixels between the ground truth and predictions, while A B corresponds to the total number of pixels covered by either the ground truth or the predictions.
However, the Dice coefficient is particularly useful due to its sensitivity to small overlaps, making it well suited to detect fine-grained objects such as microplastic particles, which are small relative to the total area of the image (see Figure 2 and Figure 3). Additionally, the Dice coefficient balances the union and intersection by normalizing against the combined size of the predicted and ground truth regions, improving interpretability for imbalanced tasks like ours. The Dice coefficient is defined as:
D i c e = 2 A B A + B  
where A B is the number of overlapping pixels, and | A | and | B | represent the total number of pixels in the ground truth and predictions, respectively. Unlike the IoU, the Dice coefficient’s denominator accounts for the sum of pixels in both regions, effectively giving double weight to the overlapping area.
To evaluate the segmentation models, the initial dataset described in Section 2 was partitioned into three disjoint subsets: training (483 samples), validation (60 samples), and test (61 samples). To enhance training data diversity, we applied an augmentation pipeline to the training images, which included vertical and horizontal flips (each with a probability of 0.5), color adjustments to simulate varying illumination conditions modifying brightness (0–0.1), hue (0–0.05), and saturation (0–0.1), rotations to simulate different camera orientations (0–10 degrees), and perspective transformations to simulate changes in camera position with a distortion scale between 0 and 0.2.
This process expanded the training subset to 1449 images. The validation subset was used to optimize model hyperparameters, while the test subset, never exposed during training or validation, provided the final performance evaluation. This strict separation ensures that the generalizability of the model is assessed without bias.
Table 1 presents the results for the evaluated models. The results for all evaluation metrics are normalized and expressed as percentages (%), with a scale ranging from 0% to 100%. Higher values indicate superior model performance in segmenting microplastic particles. Two models achieved an IoU above 70% in the test set, which is considered a strong result. Regarding the Dice coefficient, eleven models surpassed 70%, LinkNet reaching 80%, a notable performance given that the Dice coefficient is a more stringent metric than the IoU. The lowest IoU and Dice coefficient are obtained with the ResUNet architecture. With respect to YOLOv11 models, they exhibit a low performance except the medium size model (YOLOv11m) that achieves the third best results in Dice coefficient and fourth best result with IoU metric. This fact can be explained by the resolution of the images being better suited for the medium model than for the rest.
Table 2 reports the segmentation results at the pixel level, in contrast to Table 1, which focuses on region-based overlap metrics. The total number of pixels labeled as microplastic particles in the 61 images of the test subset is 150,371. The column True Positive corresponds to the number of pixels correctly classified as microplastics by the model, False Positive represents the number of pixels incorrectly classified as microplastics (i.e., pixels belonging to sand or other types of debris), and False Negative denotes the number of microplastic pixels that were not correctly detected by the models. The two rightmost columns correspond to accuracy, defined as the proportion of correctly classified pixels, and the F1-score, which is the harmonic mean of precision and recall, as introduced in Section 1.
Analyzing the results by model family, clear performance trends emerge. The specific semantic segmentation architectures (U-Net, ResUNet, LinkNet, and PAN) consistently outperform the YOLO-based segmentation models in terms of F1-score. This behavior indicates a superior ability to balance precision and recall at the pixel level, which is critical for accurately delineating small and irregular microplastic particles. It is important to note that pixel-wise accuracy is not a reliable performance metric in this context due to the highly imbalanced nature of the problem, where the vast majority of pixels do not correspond to microplastics particles. In such scenarios, a model can achieve high accuracy by correctly classifying background pixels while still missing a large fraction of microplastic particles. For this reason, the F1-score provides a more informative and robust measure of performance, as it jointly accounts for false positives and false negatives and better reflects the model’s effectiveness in detecting microplastic pixels.
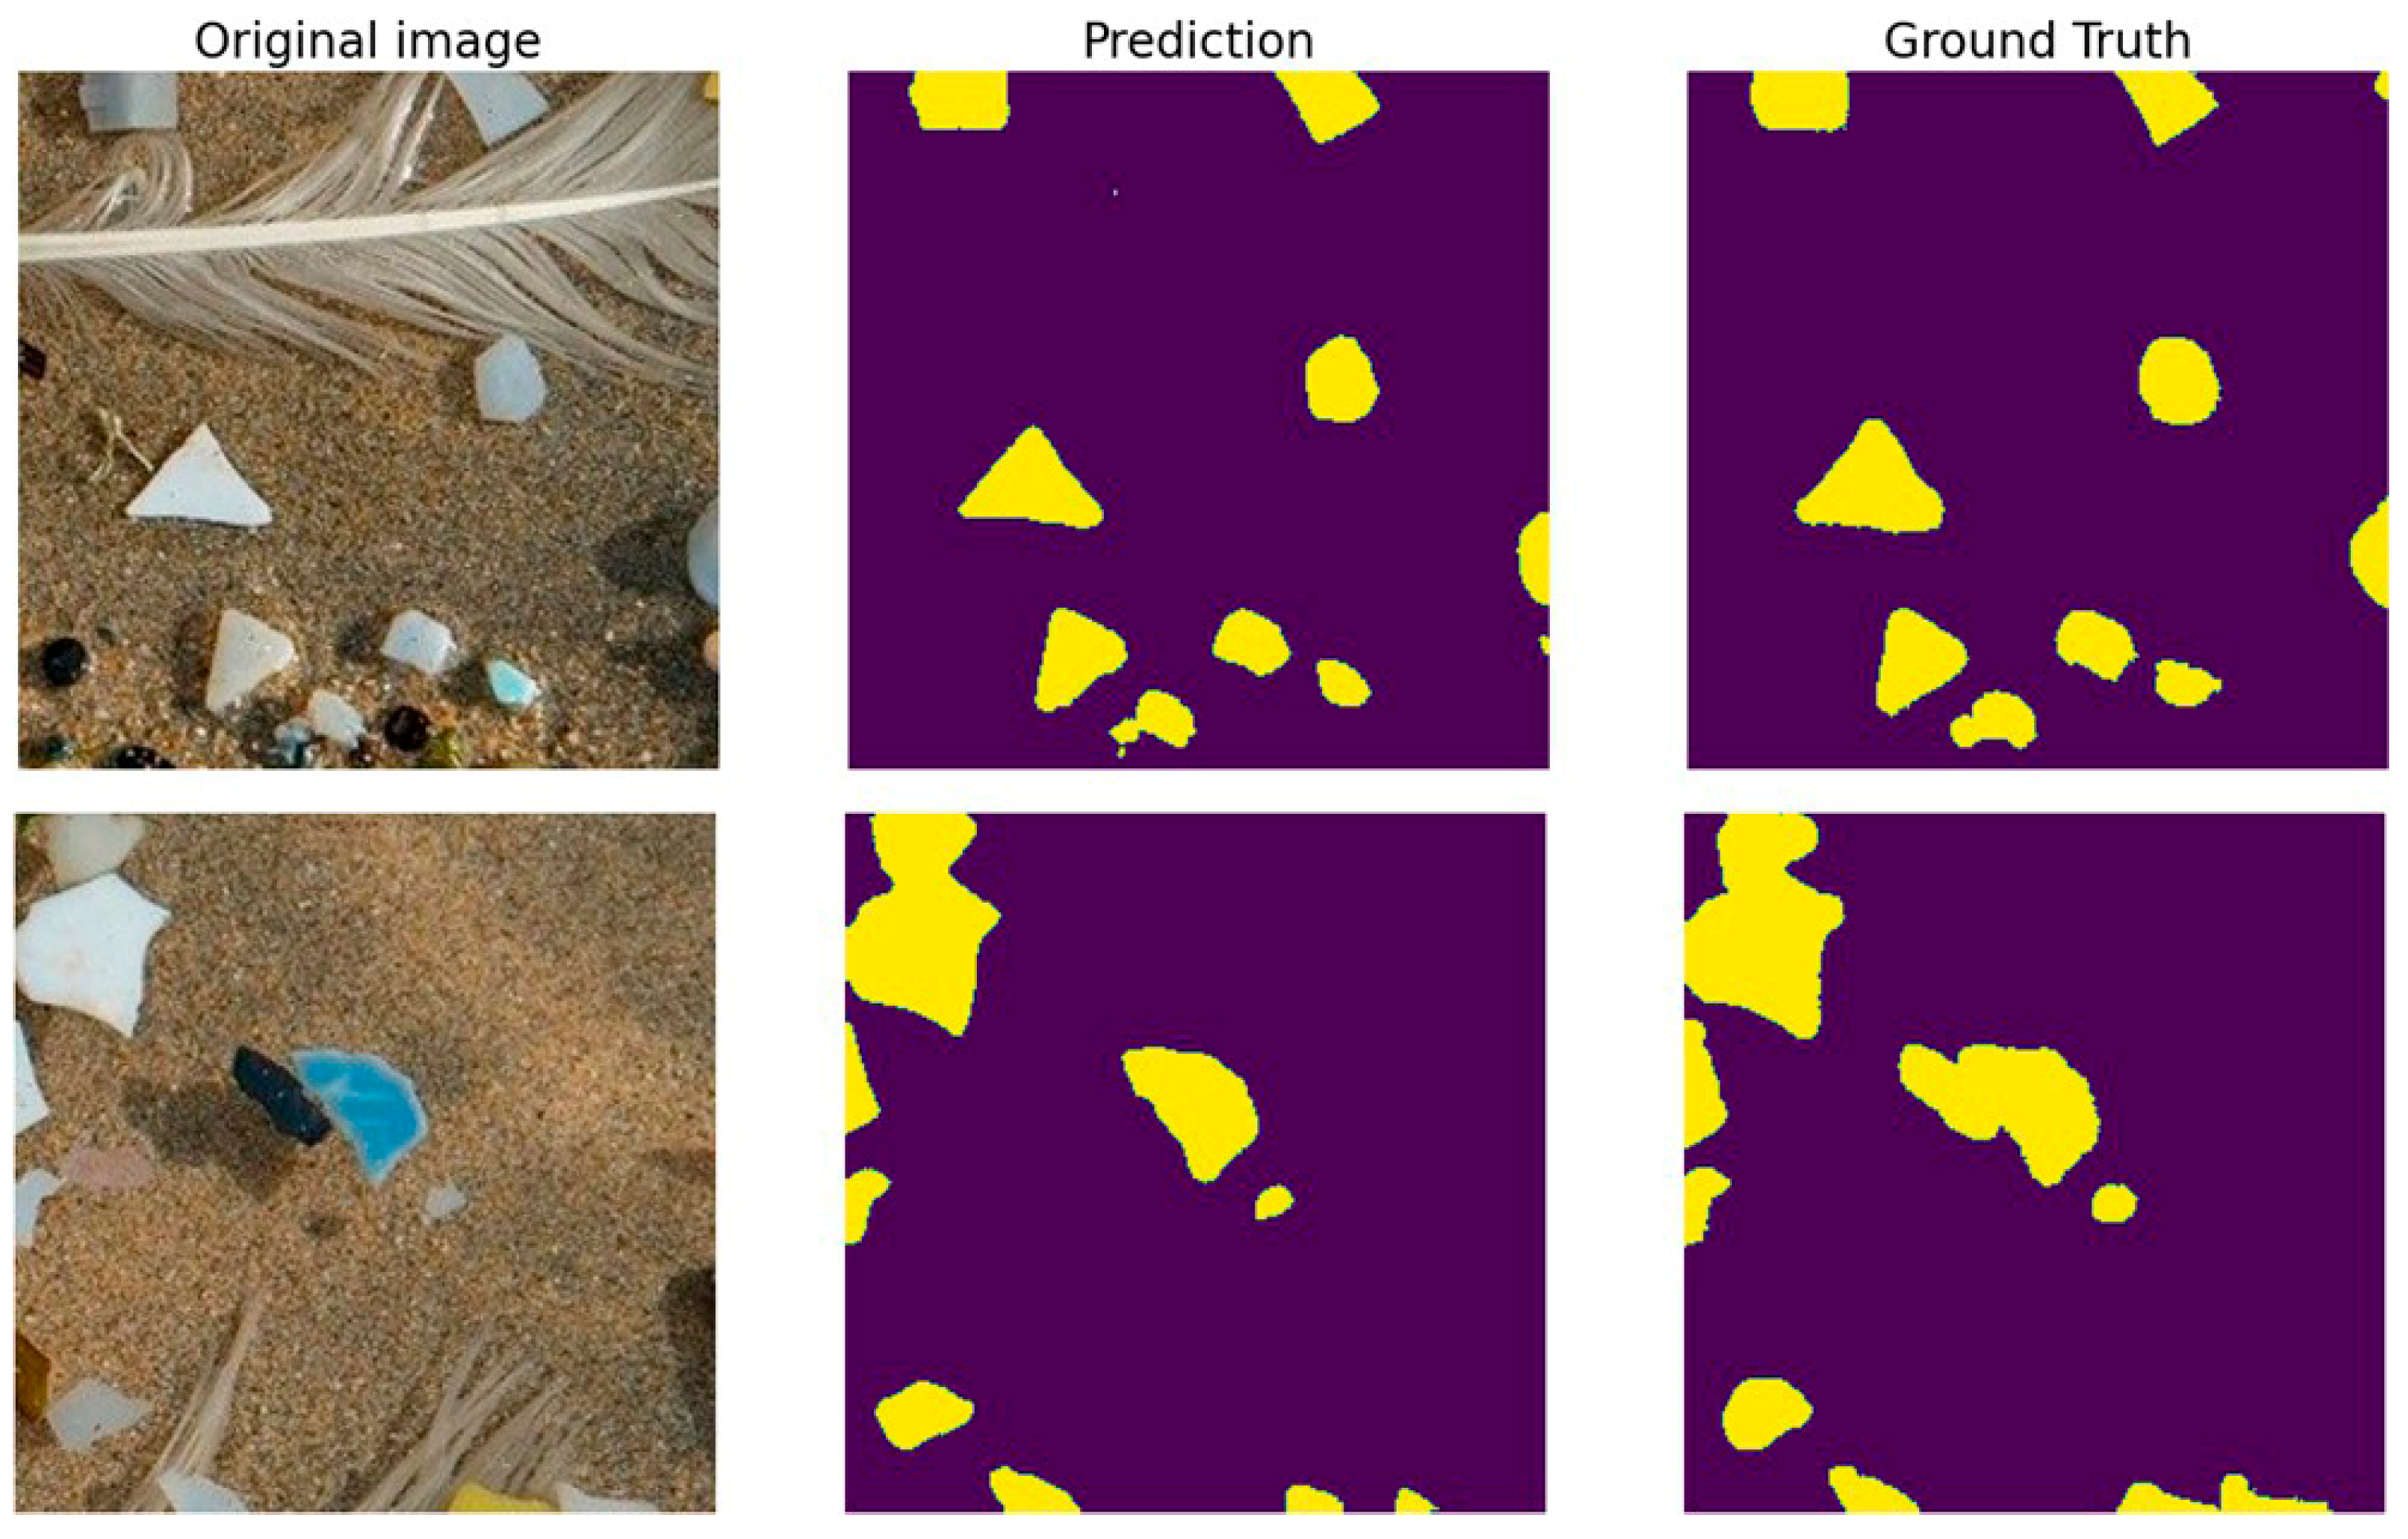
Apart from the quantitative results measured by IoU and Dice metrics, qualitative evaluation is essential in computer vision applications, including this microplastics segmentation task, to analyze model behavior across diverse scenarios. Figure 5 displays the original images, ground truth masks, and LinkNet’s segmentation results for two test set images. These images contain not only microplastics but also debris. The model successfully segments only the microplastics particles, with one exception: a black particle adjacent to the blue one in the lower row, which is misclassified due to its visual similarity to unlabeled small rocks. In the upper image, non-microplastics objects (e.g., small rocks and a bird feather) are correctly ignored.
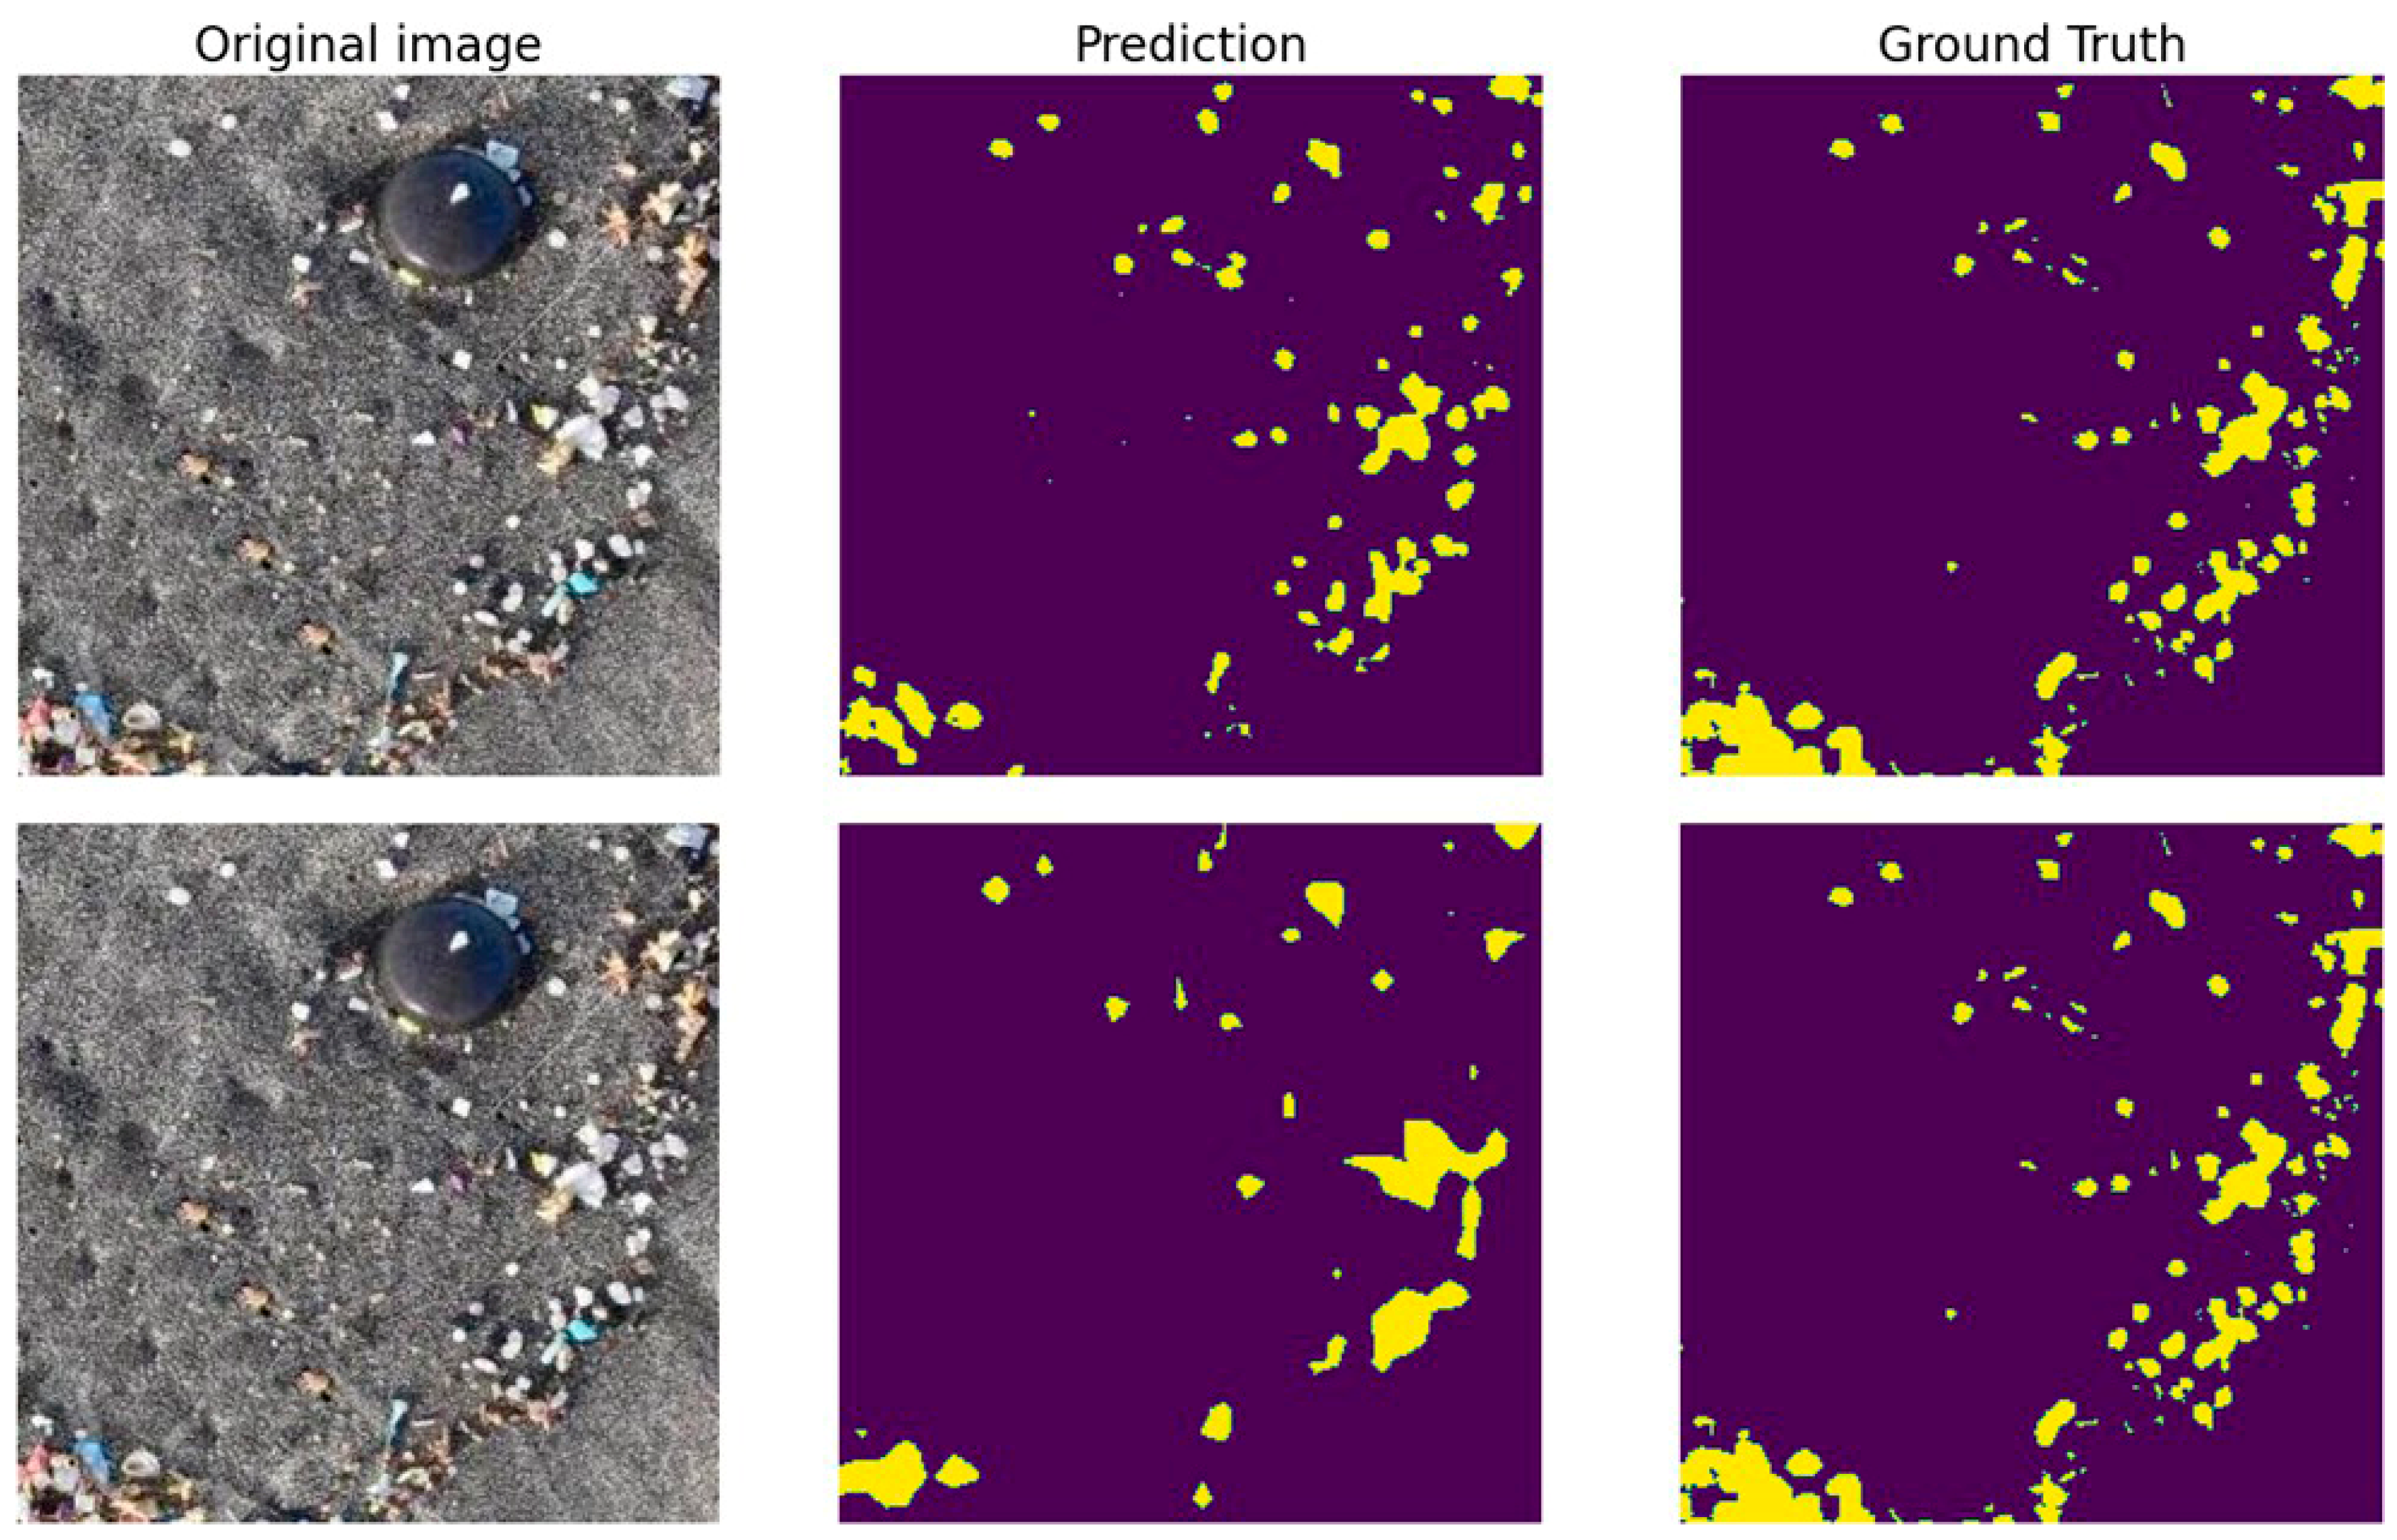
Figure 6 highlights the performance gap between LinkNet (the top-performing model) and PSPNet. While LinkNet correctly segments almost all microplastic particles, missing only a few very small ones on the right side of the image, PSPNet fails to detect many particles and produces low-resolution predictions. This is evident on the right side of its output, where multiple particles are grouped into a single, larger detection.

4. Discussion

The segmentation of microplastics on sandy beaches remains a particularly challenging computer vision problem due to the small size of the targets, their wide variability in color and shape, and the strong visual similarity between microplastics and naturally occurring materials such as small rocks, shell fragments, organic debris, and dark mineral grains. Illumination variability, cast shadows, and heterogeneous sand textures further increase intra-class variance and reduce the contrast between foreground and background. These factors jointly explain why microplastic segmentation represents a more demanding task than macro- or meso-litter detection, which has been the focus of most previous vision-based coastal monitoring studies.
A key consideration in the automated detection of coastal debris is the discrimination between microplastics and natural elements (e.g., shell fragments, small rocks, or organic matter). In this study, the semantic segmentation models were trained specifically to isolate microplastics, leveraging the expert-labeled ground truth. While visual-based RGB analysis cannot provide the chemical certainty of Fourier-Transform Infrared (FTIR) spectroscopy, the results indicate that the deep learning architectures, particularly those with high spatial resolution preservation like LinkNet, effectively distinguish the geometric and textural signatures of plastic polymers from those of surrounding natural debris. Nonetheless, the lack of spectral data remains a limitation; visual ’mimicry’ by certain minerals or bleached organic matter may lead to false positives.
Among the evaluated models, LinkNet and PAN achieved the most robust and consistent performance. LinkNet’s advantage appears to stem from its efficient encoder–decoder design with residual skip connections based on element-wise addition. This design preserves spatial detail while avoiding the parameter inflation associated with concatenation-based skip connections, as used in U-Net. In a data-constrained scenario such as the one considered here, this architectural efficiency likely contributes to better generalization on the test set. PAN also achieved competitive results, which can be attributed to its attention mechanisms that explicitly model multi-scale contextual information. However, this comes at the cost of increased computational complexity, which may limit its applicability in resource-constrained or edge-computing scenarios.
The comparatively lower performance of ResUNet and some YOLOv11 variants highlights an important trade-off between architectural complexity, input resolution, and dataset size. While residual connections are generally beneficial in deep networks, in this case they did not translate into improved segmentation accuracy, possibly due to overfitting or insufficient representation of fine-grained microplastic structures in deeper layers. Similarly, YOLO-based segmentation models, originally optimized for instance-level object detection, may be less suited to capturing the subtle boundaries and thin structures typical of microplastics, especially when operating on relatively small image patches.
A key strength of the proposed approach lies in the use of semantic segmentation rather than object detection. Pixel-level delineation enables more informative measurements than bounding-box-based methods, particularly for irregular particles such as fragments. Although the current setup does not allow for precise physical area estimation due to the lack of camera calibration and scale normalization, the relative area covered by microplastics can still be used as an approximate indicator to analyze spatial and temporal trends. This represents a substantial practical advantage over traditional manual counting and weighing procedures, which are time-consuming, labor-intensive, and difficult to scale.
Despite the encouraging results, several limitations must be acknowledged. First, although the dataset includes a range of sand colors and microplastic appearances representative of many sandy beaches, it was collected from a single geographical location. Although the robustness of the proposed approach is supported by the inclusion of varied sand backgrounds in the training set, ranging from light yellow to dark gray (Figure 2 and Figure 3), extending the dataset to beaches with different sediment compositions, lighting conditions, and pollution profiles will be essential to fully assess the generalizability of the models. Second, fiber-shaped microplastics are underrepresented, reflecting both their lower persistence on beaches and the difficulty of manual annotation. Since fibers are environmentally relevant, future datasets should aim to include them more systematically, potentially supported by semi-automatic labeling tools.
Annotation quality is another factor that may influence performance. Pixel-level labeling of millimeter-scale objects is inherently prone to uncertainty, particularly along object boundaries. Small discrepancies between annotations and predictions can disproportionately affect quantitative metrics such as IoU and Dice. From this perspective, the reported results should be interpreted as conservative estimates of model performance. Exploring boundary-tolerant metrics or uncertainty-aware evaluation protocols could provide additional insight into real-world effectiveness.
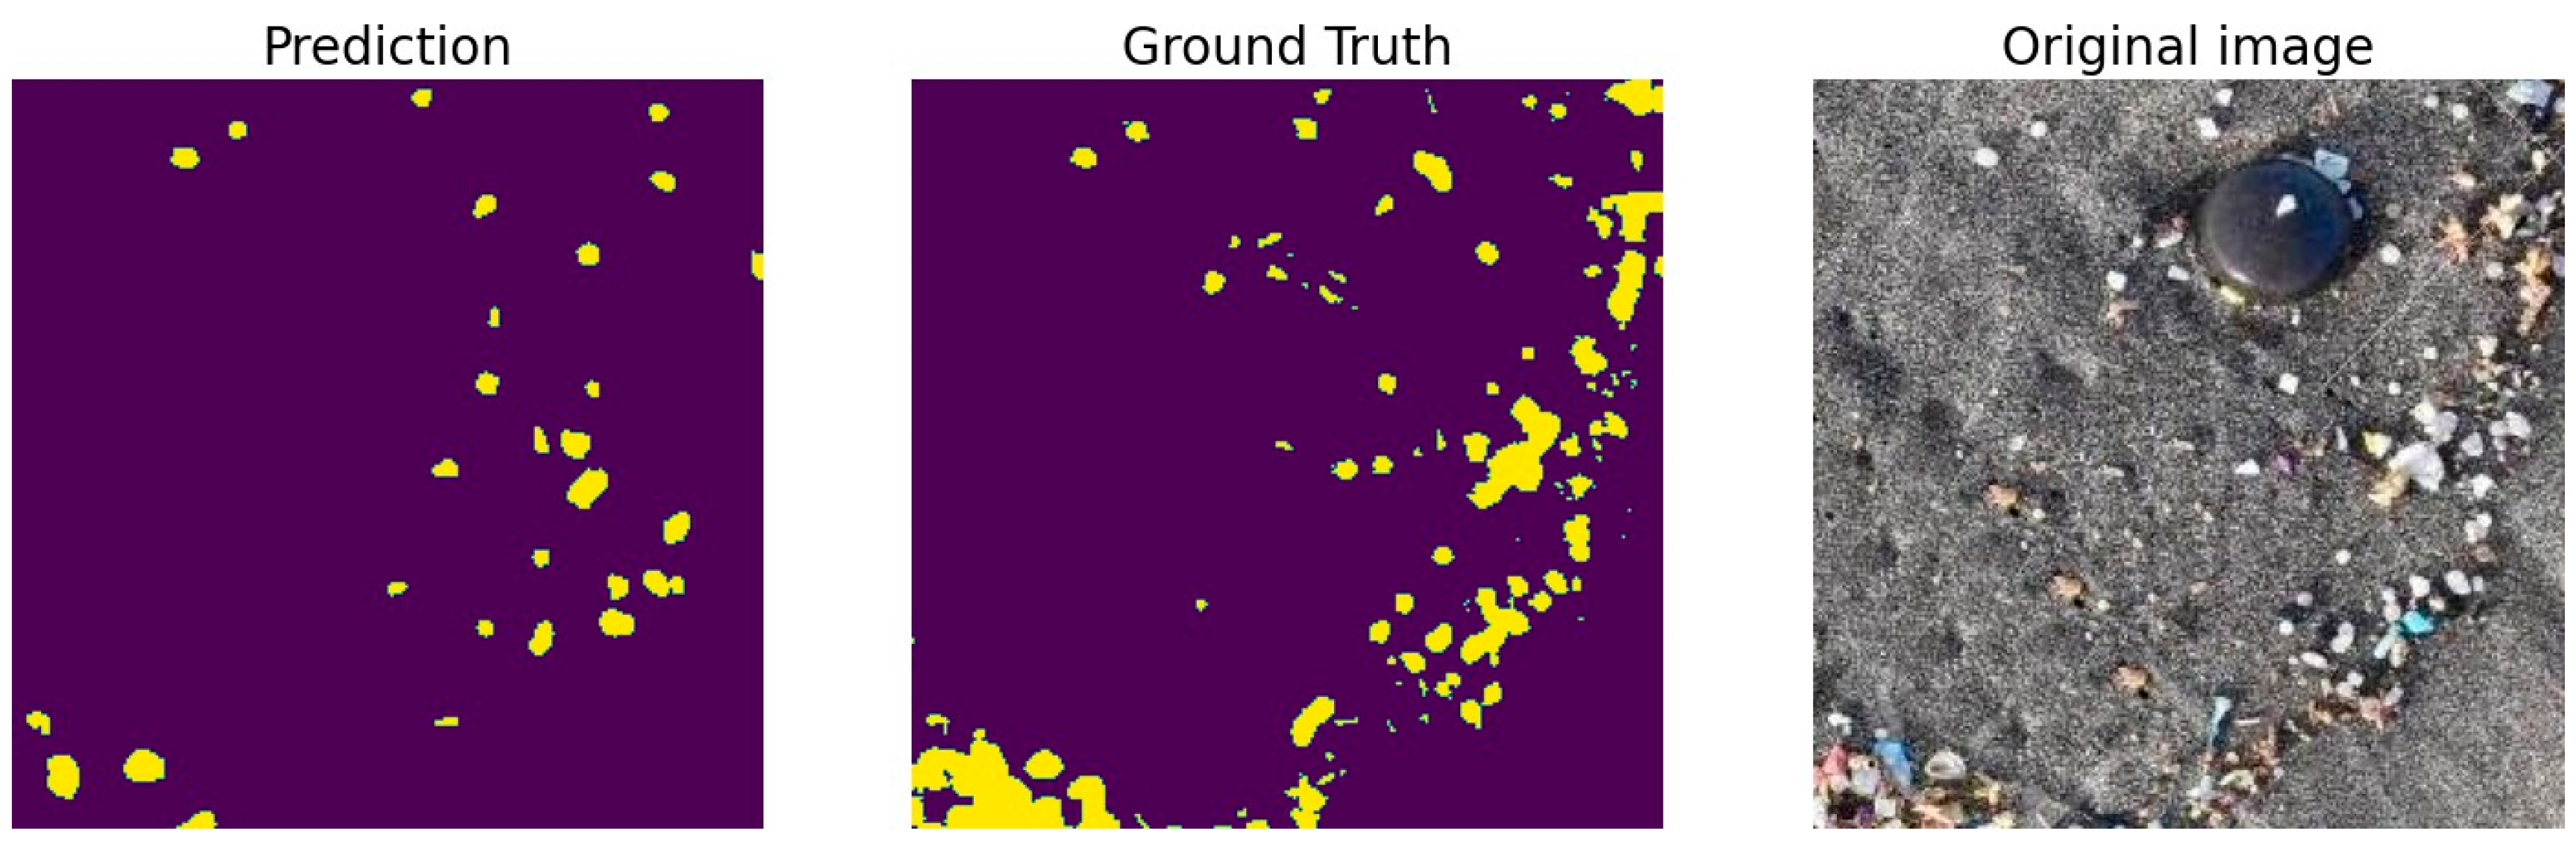
The comparison with foundation models such as Meta’s Segment Anything Model (SAM) further underscores the importance of task-specific training. While SAM demonstrates impressive zero-shot capabilities, its performance on microplastic segmentation remains inferior to that of a model explicitly trained on domain-specific data (Figure 7). This suggests that, for fine-grained environmental monitoring tasks, specialized datasets and targeted training still play a crucial role, even in the era of large-scale foundation models.
Finally, from an application standpoint, the results indicate that an automated, image-based microplastic monitoring system is feasible using off-the-shelf cameras or smartphones. Such a system could support daily or near-real-time monitoring, enabling early detection of anomalous microplastic accumulation events and facilitating rapid response by local authorities. When combined with citizen science initiatives and existing marine litter monitoring platforms, this approach has the potential to significantly enhance spatial coverage and temporal resolution in coastal pollution assessment. Furthermore, while the current study focuses on sandy beaches, the robustness of the specific semantic segmentation models used suggests they could be adapted for freshwater or marine pond environments through future transfer learning applications on diverse substrates.

5. Conclusions

This study demonstrates the viability of using deep learning-based segmentation models to detect microplastics in coastal environments with a high degree of precision, addressing a critical gap in automated environmental monitoring. Among the 12 tested approaches, LinkNet consistently outperformed others, achieving the highest performance (Dice: 80.0%, IoU: 72.6% in the test set), demonstrating its efficacy in identifying small microplastics amidst complex backgrounds like sand and organic debris. PAN also performed competitively, leveraging attention mechanisms to enhance localization, albeit with higher resource demands.
Our results show that segmentation-based approaches offer significant advantages over traditional object detection techniques, particularly in their ability to deliver pixel-level delineation of microplastic particles. This not only enables more accurate quantification of contamination but also provides a scalable solution for environmental monitoring. While foundation models like SAM offer some zero-shot segmentation capabilities, our results suggest that task-specific models, fine-tuned on domain-specific data, remain more reliable for fine-grained environmental monitoring tasks such as microplastic detection.
Furthermore, the dataset compiled for this study which includes diverse sand backgrounds and microplastic types strengthens the generalizability of segmentation-based approaches to other beach environments. The deployment of these models in embedded systems for edge computing applications opens a promising avenue for real-time, in situ monitoring of microplastic pollution, potentially reducing the need for labor-intensive manual surveys.
Future work will focus on expanding the dataset, integrating the models into mobile and low-power devices, and exploring calibration techniques to enable reliable area estimation. These advances could play a crucial role in supporting regulatory frameworks and cleanup efforts by providing timely and accurate information on microplastic distribution in coastal zones.


Author Contributions

Conceptualization: J.L.-N. and A.H.; Methodology: J.L.-N.; Software: J.L.-N. and J.S.-C.; Writing—Original Draft: J.L.-N.; Writing—Review and Editing: J.L.-N., J.S.-C., M.C.-S., M.G. and A.H.; Funding acquisition: J.L.-N., M.C.-S. and M.G. All authors have read and agreed to the published version of the manuscript.

Funding

This work is partially funded by project PID2021-122402OB-C22/MICIU/ AEI/10.13039/501100011033 FEDER, UE, by projects IMPLAMAC (MAC2/1.1a/265) and IMPLAMAC: Capitalización (2/MAC/3/6.1/0214_CAP) financed by the Interreg MAC (European Fund to Regional Development, Macaronesian Cooperation), by the ACIISI-Gobierno de Canarias and European FEDER funds under project ULPGC Facilities Net and Grant EIS 2021 04, and by the Consejería de Universidades, Ciencia e Innovación y Cultura (Gobierno de Canarias) and the European Social Fund Plus (FSE+) under the funding framework for doctoral research.

Data Availability Statement

The dataset used in this study is publicly available in the Zenodo repository at https://doi.org/10.5281/zenodo.19367415.

Conflicts of Interest

The authors declare no conflicts of interest.

References

  1. Jambeck, J.R.; Geyer, R.; Wilcox, C.; Siegler, T.R.; Perryman, M.; Andrady, A.; Narayan, R.; Law, K.L. Plastic waste inputs from land into the ocean. Science 2015, 347, 768–771. [Google Scholar] [CrossRef] [PubMed]
  2. Herrera, A.; Asensio, M.; Martínez, I.; Santana, A.; Packard, T.; Gómez, M. Microplastic and tar pollution on three Canary Islands beaches: An annual study. Mar. Pollut. Bull. 2018, 129, 494–502. [Google Scholar] [CrossRef] [PubMed]
  3. United Nations Environment Programme. Global Waste Management Outlook 2024: Beyond an Age of Waste—Turning Rubbish into a Resource; Technical report; United Nations: New York, NY, USA, 2024. [Google Scholar] [CrossRef]
  4. Domínguez-Hernández, C.; Villanova-Solano, C.; Álvarez, S.; Álvarez Méndez, S.J.; Alves, A.; Canning- Clode, J.; de Castro Abu-Raya, M.; Díaz-Peña, F.J.; Garcia, S.; Gómez, M.; et al. Plastic occurrence in Macaronesia: Three years of monitoring on forty-six beaches across nineteen islands in an Atlantic region. Sci. Total Environ. 2026, 1010, 181064. [Google Scholar] [CrossRef] [PubMed]
  5. European Parliament. Directive 2008/56/EC of the European Parliament and of the Council of 17 June 2008 establishing a framework for community action in the field of marine environmental policy (Marine Strategy Framework Directive). Off. J. Eur. Union 2008, 164, 19–40. [Google Scholar]
  6. Galgani, F.; Lusher, A.L.; Strand, J.; Haarr, M.L.; Vinci, M.; Jack, E.M.; Kagi, R.; Aliani, S.; Herzke, D.; Nikiforov, V.; et al. Revisiting the strategy for marine litter monitoring within the european marine strategy framework directive (MSFD). Ocean. Coast. Manag. 2024, 255, 107254. [Google Scholar] [CrossRef]
  7. Agency, E.E. Marine Litter Watch—Citizens Collect Plastic and Data to Protect Europe’s Marine Environment, 2018. Available online: https://www.eea.europa.eu/en/analysis/publications/marine-litter-watch (accessed on 16 December 2025).
  8. Cero, A.V. MARNOBA App, 2024. Available online: https://vertidoscero.com/marnoba/ (accessed on 16 December 2025).
  9. Moy, K.; Neilson, B.; Chung, A.; Meadows, A.; Castrence, M.; Ambagis, S.; Davidson, K. Mapping coastal marine debris using aerial imagery and spatial analysis. Mar. Pollut. Bull. 2018, 132, 52–59. [Google Scholar] [CrossRef] [PubMed]
  10. Deidun, A.; Gauci, A.; Lagorio, S.; Galgani, F. Optimising beached litter monitoring protocols through aerial imagery. Mar. Pollut. Bull. 2018, 131, 212–217. [Google Scholar] [CrossRef] [PubMed]
  11. Kako, S.; Isobe, A.; Kataoka, T.; Yufu, K.; Sugizono, S.; Plybon, C.; Murphy, T.A. Sequential webcam monitoring and modeling of marine debris abundance. Mar. Pollut. Bull. 2018, 132, 33–43. [Google Scholar] [CrossRef] [PubMed]
  12. Gonçalves, G.; Andriolo, U.; Pinto, L.; Bessa, F. Mapping marine litter using UAS on a beach-dune system: A multidisciplinary approach. Sci. Total Environ. 2020, 706, 135742. [Google Scholar] [CrossRef] [PubMed]
  13. Breiman, L. Random forests. Mach. Learn. 2001, 45, 5–32. [Google Scholar] [CrossRef]
  14. Pinto, L.; Andriolo, U.; Gonçalves, G. Detecting stranded macro-litter categories on drone orthophoto by a multi-class Neural Network. Mar. Pollut. Bull. 2021, 169, 112594. [Google Scholar] [CrossRef] [PubMed]
  15. Winans, W.R.; Chen, Q.; Qiang, Y.; Franklin, E.C. Large-area automatic detection of shoreline stranded marine debris using deep learning. Int. J. Appl. Earth Obs. Geoinf. 2023, 124, 103515. [Google Scholar] [CrossRef]
  16. Liu, W.; Anguelov, D.; Erhan, D.; Szegedy, C.; Reed, S.; Fu, C.Y.; Berg, A.C. SSD: Single Shot MultiBox Detector. In Proceedings of the Computer Vision—ECCV 2016; Leibe, B., Matas, J., Sebe, N., Welling, M., Eds.; Springer: New York, NY, USA, 2016; pp. 21–37. [Google Scholar]
  17. Sandler, M.; Howard, A.G.; Zhu, M.; Zhmoginov, A.; Chen, L.C. MobileNetV2: Inverted Residuals and Linear Bottlenecks. In Proceedings of the 2018 IEEE/CVF Conference on Computer Vision and Pattern Recognition, Salt Lake City, UT, USA, 18–22 June 2018; pp. 4510–4520. [Google Scholar]
  18. Long, J.; Shelhamer, E.; Darrell, T. Fully convolutional networks for semantic segmentation. In Proceedings of the IEEE Conference on Computer Vision and Pattern Recognition, Boston, MA, USA, 7–12 June 2015; pp. 3431–3440. [Google Scholar]
  19. He, K.; Gkioxari, G.; Dollár, P.; Girshick, R. Mask r-cnn. In Proceedings of the IEEE International Conference on Computer Vision, Venice, Italy, 22–29 October 2017; pp. 2961–2969. [Google Scholar]
  20. Redmon, J. You only look once: Unified, real-time object detection. In Proceedings of the IEEE Conference on Computer Vision and Pattern Recognition, Las Vegas, NV, USA, 27–30 June 2016; pp. 779–788. [Google Scholar]
  21. Ren, S.; He, K.; Girshick, R.; Sun, J. Faster R-CNN: Towards real-time object detection with region proposal networks. IEEE Trans. Pattern Anal. Mach. Intell. 2016, 39, 1137–1149. [Google Scholar] [CrossRef] [PubMed]
  22. Ronneberger, O.; Fischer, P.; Brox, T. U-net: Convolutional networks for biomedical image segmentation. In Proceedings of the Medical Image Computing and Computer-Assisted Intervention–MICCAI 2015: 18th International Conference, Munich, Germany, 5–9 October 2015; Proceedings, Part III 18; Springer: Cham, Switzerland, 2015; pp. 234–241. [Google Scholar]
  23. Chaurasia, A.; Culurciello, E. Linknet: Exploiting encoder representations for efficient semantic segmentation. In Proceedings of the 2017 IEEE Visual Communications and Image Processing (VCIP), St. Petersburg, FL, USA, 10–13 December 2017; IEEE: New York, NY, USA, 2017; pp. 1–4. [Google Scholar]
  24. Li, H.; Xiong, P.; An, J.; Wang, L. Pyramid attention network for semantic segmentation. arXiv 2018, arXiv:1805.10180. [Google Scholar] [CrossRef]
  25. Andriolo, U.; Topouzelis, K.; van Emmerik, T.H.; Papakonstantinou, A.; Monteiro, J.G.; Isobe, A.; Hidaka, M.; Kako, S.; Kataoka, T.; Gonçalves, G. Drones for litter monitoring on coasts and rivers: Suitable flight altitude and image resolution. Mar. Pollut. Bull. 2023, 195, 115521. [Google Scholar] [CrossRef] [PubMed]
  26. Topouzelis, K.; Papakonstantinou, A.; Garaba, S.P. Detection of floating plastics from satellite and unmanned aerial systems (Plastic Litter Project 2018). Int. J. Appl. Earth Obs. Geoinf. 2019, 79, 175–183. [Google Scholar] [CrossRef]
  27. Mesa Santana, F. Detección de Microplásticos dn Playas Utilizando Técnicas de Visión por Computador. Master’s Thesis, Instituto Universitario SIANI, Universidad de Las Palmas de Gran Canaria, Las Palmas de Gran Canaria, Spain, 2023. [Google Scholar]
  28. Ortiz Campos, E. Exploración de Técnicas Avanzadas de Visión por Computador Para la Segmentación Eficiente de Microplásticos. Master’s Thesis, Instituto Universitario SIANI, Universidad de Las Palmas de Gran Canaria, Las Palmas de Gran Canaria, Spain, 2024. [Google Scholar]
  29. Han, X.L.; Jiang, N.J.; Hata, T.; Choi, J.; Du, Y.J.; Wang, Y.J. Deep learning based approach for automated characterization of large marine microplastic particles. Mar. Environ. Res. 2023, 183, 105829. [Google Scholar] [CrossRef]
  30. Lorenzo-Navarro, J.; Castrillón-Santana, M.; Sánchez-Nielsen, E.; Zarco, B.; Herrera, A.; Martínez, I.; Gómez, M. Deep learning approach for automatic microplastics counting and classification. Sci. Total Environ. 2021, 765, 142728. [Google Scholar] [CrossRef] [PubMed]
  31. Oktay, O.; Schlemper, J.; Folgoc, L.L.; Lee, M.; Heinrich, M.; Misawa, K.; Mori, K.; McDonagh, S.; Hammerla, N.Y.; Kainz, B.; et al. Attention U-Net: Learning Where to Look for the Pancreas. arXiv 2018, arXiv:1804.03999. [Google Scholar] [CrossRef]
  32. Zhang, Z.; Liu, Q.; Wang, Y. Road extraction by deep residual u-net. IEEE Geosci. Remote Sens. Lett. 2018, 15, 749–753. [Google Scholar] [CrossRef]
  33. He, K.; Zhang, X.; Ren, S.; Sun, J. Deep residual learning for image recognition. In Proceedings of the IEEE Conference on Computer Vision and Pattern Recognition, Las Vegas, NV, USA, 27–30 June 2016; pp. 770–778. [Google Scholar]
  34. Lin, T.Y.; Dollár, P.; Girshick, R.; He, K.; Hariharan, B.; Belongie, S. Feature Pyramid Networks for Object Detection. In Proceedings of the IEEE Conference on Computer Vision and Pattern Recognition (CVPR), Honolulu, HI, USA, 21–26 July 2017; pp. 2117–2125. [Google Scholar]
  35. Zhao, H.; Shi, J.; Qi, X.; Wang, X.; Jia, J. Pyramid Scene Parsing Network. In Proceedings of the IEEE Conference on Computer Vision and Pattern Recognition (CVPR), Honolulu, HI, USA, 21–26 July 2017; pp. 2881–2890. [Google Scholar]
  36. Wang, Z.; Berman, M.; Rannen-Triki, A.; Torr, P.H.S.; Tuia, D.; Tuytelaars, T.; Gool, L.V.; Yu, J.; Blaschko, M.B. Revisiting Evaluation Metrics for Semantic Segmentation: Optimization and Evaluation of Fine-grained Intersection over Union. In Proceedings of the Advances in Neural Information Processing Systems 36, New Orleans, LA, USA, 10–16 December 2023. [Google Scholar]
Figure 1. Las Canteras Beach. Las Palmas de Gran Canaria. Spain.
Microplastics 05 00066 g001
Figure 2. Example of microplastics on yellow sand.
Microplastics 05 00066 g002
Figure 3. Example of microplastics on dark gray sand.
Microplastics 05 00066 g003
Figure 4. Example dataset images paired with their corresponding annotations.
Microplastics 05 00066 g004
Figure 5. Qualitative segmentation results of LinkNet on complex test-set images with environmental debris. From left to right: original image, ground truth, and predicted segmentation. Most microplastic particles are correctly detected, while non-plastic debris is largely ignored.
Microplastics 05 00066 g005
Figure 6. Qualitative segmentation results of LinkNet (top row) and PSPNet (bottom row) on a test image. From left to right: original image, ground truth, and predicted segmentation. Differences in detection accuracy and segmentation quality can be observed between both models.
Microplastics 05 00066 g006
Figure 7. Segmentation results obtained with the SAM 2 Meta’s model.
Microplastics 05 00066 g007
Table 1. Performance comparison of the evaluated semantic segmentation models. All metrics are expressed as percentages (%).
ModelVal. Dice (%)Val. IoU (%)Test Dice (%)Test IoU (%)
LinkNet82.073.680.072.6
PAN76.271.379.271.3
YOLOv11m73.964.478.669.2
FPN75.366.677.769.4
PSP72.863.576.467.3
AttentionUnet78.769.376.468.0
Unet78.569.076.067.9
YOLOv11s75.666.076.067.2
YOLOv11n71.862.074.465.8
YOLOv11x72.762.474.265.4
YOLOv11l67.557.973.464.1
ResUnet74.665.367.860.3
Table 2. Performance comparison at pixel level of the evaluated semantic segmentation models (Pos.: Positive, Neg.: Negative).
ModelTrue Pos.False Pos.False Neg.Accuracy (%)F1-Score (%)
LinkNet122,11316,96328,25898.991.5
PAN118,41014,52631,96198.891.5
YOLOv11m123,65739,94726,71467.184.9
FPN117,33517,97633,03698.790.9
PSP108,01419,46542,35798.589.7
AttentionUnet110,237551840,13469.291.0
Unet110,936586439,43569.590.9
YOLOv11s124,55837,31825,81367.185.8
YOLOv11n122,80840,63627,56366.688.1
YOLOv11x107,73832,53142,63367.790.7
YOLOv11l124,89043,01625,48165.985.9
ResUnet100,617610549,75469.788.7
Disclaimer/Publisher’s Note: The statements, opinions and data contained in all publications are solely those of the individual author(s) and contributor(s) and not of MDPI and/or the editor(s). MDPI and/or the editor(s) disclaim responsibility for any injury to people or property resulting from any ideas, methods, instructions or products referred to in the content.