Article

Comparative Assessment of Protocols for Microplastic Quantification in Wastewater

by
Rubén Rodríguez-Alegre
,
Sergi Durán-Videra
,
David Carmona-Fernández
,
Laura Pérez Megías
,
Carlos Andecochea Saiz
and
Xialei You
*
Circular Economy & Decarbonization Department, Leitat Technological Center, Carrer de La Innovació 2, 08225 Terrassa, Spain
*
Author to whom correspondence should be addressed.
Microplastics 2025, 4(3), 49; https://doi.org/10.3390/microplastics4030049
Submission received: 27 June 2025 / Revised: 23 July 2025 / Accepted: 30 July 2025 / Published: 5 August 2025
(This article belongs to the Collection Feature Paper in Microplastics)

Abstract

Microplastics are an increasing concern due to their widespread occurrence in aquatic environments worldwide. The lack of a harmonised protocol for their reliable quantification remains a major challenge in current scientific efforts. This study presents a comparative evaluation of three protocols for the detection and quantification of microplastics in aqueous samples. The protocols were assessed based on quantification efficiency, risk of particle degradation, staining performance, operational complexity, and cost per sample. Protocol A combined Rhodamine B and ethanol staining with NaCl-based density separation, demonstrating strong isolation performance while maintaining minimal chemical hazards and moderate cost (2.45€ per sample) that could be further reduced to 0.45€ per sample by substituting reagent-grade NaCl with table salt. Protocol B offered moderate isolation capacity and presented the highest risk of particle fragmentation, likely due to the use of acetone and high-temperature digestion. Protocol C, based on the combined use of Nile Red and ZnCl2, also presented a risk of particle fragmentation, resulting in the highest MP count for small and hydrophobic particles. In addition, its high cost (15.23€ per sample) limits its suitability for routine application.

1. Introduction

Microplastics (MPs) are increasingly detected in various aquatic environments, from surface waters to wastewater treatment effluents, and even in bottled water [1]. The concern about MPs goes beyond their widespread distribution. As porous contaminants, MPs can adsorb other hazardous substances such as pharmaceuticals, potentially increasing human exposure and associated health risks, including resistance and side effects [2]. This issue is particularly relevant considering the bioaccumulation of MPs through the food chain, with humans positioned as one of its final recipients [3].
One of the main challenges when addressing MP pollution monitoring is the lack of harmonised methods for their isolation and quantification. Although several procedures have been proposed in the literature, no consensus has yet been reached [4]. Some techniques are more commonly used than others, but they are still far from being established as standardised references [5].
Among the existing techniques for sample pre-treatment, density separation and chemical digestion (using acids or oxidising agents such as H2O2) are some of the most widely applied. Density separation is a simple and low-cost method, although it may be less effective in matrices with high organic load [6,7]. Chemical digestion using acids or oxidising agents is effective in removing organic matter, but it may damage certain polymers if not properly controlled [8].
On the other hand, staining is a widely studied technique used to facilitate MP detection and quantification. Previous studies have reported the use of two main staining solutions: Nile Red, which is commonly applied due to its strong affinity for non-polar polymers such as polypropylene and polyethene, although its selectivity may be affected by the presence of organic matter; and Rhodamine B, which is considered particularly suitable for complex matrices such as wastewater [9,10] due to its improved stability in matrices with high organic content [11,12]. The use of a single technique usually results in incomplete treatment; thus, the combination of multiple methods is often recommended to achieve optimal MP isolation and staining [13].
Given the methodological heterogeneity in MPs’ research, variations in sample pre-treatment, staining procedures, and detection techniques can significantly influence the results obtained, thus limiting the comparability of studies [14]. To address this issue, it is necessary to standardise key procedural steps, ensuring that differences in performance are attributable to the protocols themselves rather than to external variables. The comparison of protocols under harmonised experimental conditions is therefore essential to evaluate their actual performance [15]. Methodological comparisons conducted under unified conditions are fundamental to advancing towards a more consistent and reliable framework for MPs’ analysis [16].
This study aims to compare the performance of three MP isolation and quantification protocols under harmonised experimental conditions. A statistical analysis was conducted to assess whether the results obtained by using the protocols are significantly different. Moreover, protocols were evaluated by using an integrated approach considering their effectiveness for the monitoring of MPs in a wastewater treatment plant (WWTP) effluent in terms of particle quantification and isolation capacity, classified by morphology and size; analytical cost; and operational and safety considerations. This integrated evaluation aims to identify the most suitable and scalable protocol for routine MP monitoring, thereby contributing to the effort towards methodological harmonisation in environmental microplastic analysis.

2. Materials and Methods

2.1. Reagents & Equipment

Sulfuric acid (H2SO4), used for pH adjustment in the Fenton process, Rhodamine B, zinc chloride (ZnCl2), and glass fibre filters were supplied by Scharlab (Barcelona, Spain). Ferrous sulphate heptahydrate (FeSO4·7H2O) and hydrogen peroxide (H2O2, 30% and 35%), for organic matter removal, sodium chloride (NaCl) for density separation, and Nile Red stain were all obtained from Carlo Erba (Barcelona, Spain).
For MP identification and quantification, samples were observed using an Axioplan 2 optical microscope (Zeiss, Barcelona, Spain) equipped with a UV light lamp.
Statistical analyses were carried out using one-way ANOVA in Minitab Statistical Software 22.3.0 (Minitab, State College, PA, USA).

2.2. Description of Evaluated Protocols

Wastewater samples were collected after secondary treatment from the Terrassa municipal WWTP (Barcelona, Spain). This matrix was selected as representative of complex effluents containing a wide range of organic matter and potential microplastic sources.
In this study, three different protocols are assessed. To facilitate direct comparison between protocols, all filtration steps in this study were carried out using glass fibre filters with a pore size of 1.2 µm and the analysis was performed in triplicate. In addition, blank filters were prepared to avoid interference from staining or MPs’ release from filters themselves, and no false positives coming from the filters were found. In Figure 1, the three protocols are presented:
It is important to note that, for the purpose of this study, particles were considered MPs if they were sized between 5 mm and 1.2 µm, consistent with widely accepted definitions in the literature [5]. This size range was used as the standard for particle classification during analysis.

2.2.1. Protocol A: Rhodamine B Staining Detection with NaCl Flotation and Fenton Oxidation

A 500 mL of WWTP effluent sample is treated by the Fenton process, adding FeSO4·7H2O and H2O2 (30%) in variable concentrations according to the organic carbon demand of the sample, following a fixed proportion of H2O2:COD = 1:0.5 (w/w) and H2O2:Fe2+ = 1:10 (molar ratio) [20]. The sample is then stirred at room temperature (20 ± 0.5 °C). NaCl is added to the solution up to saturation (120 g L−1, with a density of 1.10 g mL−1 and 1.21 mPa·s of viscosity), and after 1 h of settling, the supernatant is vacuum-filtered using a glass fibre filter with a pore size of 1.2 µm, which is then air-dried. To enable selective quantification of MPs, filters are stained with Rhodamine B (200 mg L−1) and left in the dark for 30 min. The filters are then examined under a fluorescence optical microscope (567 nm). The whole protocol is detailed elsewhere [17].

2.2.2. Protocol B: Nile Red Staining Detection with H2O2 Digestion

A 500 mL sample was first filtered to retain suspended solids, which were then rinsed and digested with 20 mL of H2O2 (35%) and a small amount (3–5 grains) of FeSO4·7H2O. The suspension was brought to boiling point and then kept at 80 ± 0.5 °C for 4 h, followed by 20 h at room temperature (20 ± 0.5 °C) to ensure degradation of natural organic matter. After digestion, the sample was filtered using a 1.2 µm filter and stained with a Nile Red solution in acetone (0.1 g L−1). The filter was subsequently examined under a fluorescence microscope (485 nm). This protocol follows the approach described by Sturm et al. [18], with minor adjustments.

2.2.3. Protocol C: Nile Red Staining Detection with ZnCl2 Flotation

ZnCl2 is initially added to a WWTP effluent sample (500 mL) at a concentration of 1.3 g L−1 for MPs flotation (density of 1.66 g mL−1 and 1.82 mPa·s). The supernatant is then filtered through a glass fibre filter with a pore size of 1 µm using a vacuum filtration unit. Following filtration, the filters were stained with 5 mL of Nile Red solution (1 g L−1 in acetone) and kept in the dark for 30 min to facilitate dye adsorption onto plastic surfaces. The filters were subsequently examined under a fluorescence microscope with an excitation wavelength of 485 nm. MPs were manually identified and counted based on fluorescence and morphology. The protocol was first presented by Maes et al. [19].

2.3. Statistical Analysis

To determine if the methods are statistically comparable, a one-way analysis of variance (ANOVA) of the MPs detection among the explored protocols is performed. The dependent variable was the number of microplastic particles detected in each 500 mL of WWTP effluent sample (in triplicate), based on visual counting under optical microscopy coupled with a UV lamp. The independent variable was the protocol applied (A, B or C). On the other hand, the same analysis is used for MP morphology. In this case, the independent variable was the morphology of MPs (fragments, fibres or films). The significance level was set at a p-value of 0.1 for both analyses, considering that the null hypothesis is that protocols show no significant differences in MPs counting, thus statistical significance regarding lower and upper values was taken into account.

3. Results and Discussion

3.1. Protocols Testing

The distribution of MPs by size and morphology across the three protocols is presented in Table 1:
The results indicate a higher presence of fragments across all three protocols evaluated. These fragments are mainly distributed within the smaller size ranges (<100 µm), with protocol C reporting the highest number of MPs, mainly in those with the smaller sizes (58%), followed by protocol A (33%) and, finally, protocol B (9%). However, this trend changes when considering fibres (in all the size ranges studied). In this case, protocol A demonstrates higher efficiency in the identification of this morphology (57%). A similar pattern is observed for films, where protocol A also achieves the highest quantification among the three protocols (41%) (as can be seen in Figure 2).
The higher number of small particles observed in some protocols may be partially explained by microplastic alteration during sample processing. These results support previous findings related to MPs’ alteration during sample processing. Munno et al. [21] evaluated the impact of temperature on MPs’ integrity during chemical digestion procedures, particularly at temperatures exceeding 70 °C. The authors reported partial or complete degradation of MPs (such as PET, PS or PVC) under these conditions, especially during wet peroxide oxidation. In this regard, recent studies have highlighted the presence of PET, PS, PP, PVC, PA, and PES as the most abundant in WWTPs, demonstrating the possibility of degrading a high fraction of MPs normally found in wastewater [22,23,24].
The use of acetone in MPs’ processing was also investigated in previous studies, such as that of García-Sobrino et al. [25], which reported structural degradation and fragmentation of some plastic polymers when they are put into contact with this solvent. In this context, using less aggressive organic solvents, such as ethanol, may reduce the risk of unintended MP degradation.
In this study, the suspension of MPs by density separation was explored using NaCl and ZnCl2. The amount of reagent required to saturate the solution differs between the two salts. While NaCl reaches saturation at approximately 1.20 g mL−1, ZnCl2 allows higher density solutions (up to 1.37 g mL−1), which enhances separation efficiency, although the increase on solution viscosity (1.82 mPa·s in the case of ZnCl2 compared with 1.21 mPa·s in the case of NaCl) could slightly mitigate the effect of density separation. Moreover, from a safety perspective, ZnCl2 could lead to several risks due to its toxicity to both human health and the environment and should require additional efforts for its appropriate disposal.
Regarding staining performance, Rhodamine B showed improved effectiveness in detecting fibres and film particles. This dye also proved particularly useful in samples containing high organic load, which could interfere with quantification. Moreover, its stability under oxidative conditions, such as those involving hydrogen peroxide, makes it suitable for protocols that include chemical digestion [10]. On the other hand, Nile Red combined with acetone is frequently reported to enhance the visualisation of smaller and more hydrophobic particles [26].
These findings reported an overestimation of quantification for smaller fragments using protocol C, as the use of acetone increases the fragmentation in smaller particles. Even when used at low concentrations, acetone can affect certain types of plastics. Materials like polystyrene or acrylics are particularly sensitive and may partially dissolve, weaken or become more brittle after contact, even at room temperature. Several studies have shown that this kind of chemical exposure can lead to fragmentation or surface changes that are not always visible but still affect particle size and shape. In the case of this study, this explains the higher number of small particles observed in Protocol C, which exceeds what would be expected from the actual microplastic abundance [23]. In protocol B, the quantification of MPs was lower than with the other two protocols, as the fragmentation of smaller MPs due to high temperature and acetone reduces the size, entering the definition of nanoplastics, which are out of the scope of this study. Protocol A, by contrast, appears to offer a more balanced and reliable quantification across MP types and size ranges.

3.2. Protocols Statistical Comparison

The performance of the three protocols was compared using a one-way ANOVA (n = 9, p = 0.1) to assess the statistical significance of the results. The analysis revealed significant overall differences among the protocols (F(2, 6) = 5.54; p = 0.043). However, post-hoc analysis using Tukey’s method at a 95% confidence level showed that the difference was only statistically significant between Protocols B and C (Figure 3). No significant differences were found between Protocol A and either of the other two.
These findings demonstrate that protocols B and C differ in their quantification efficiency due to their different pre-treatment strategies. While protocol C detects a higher number of particles, this is partly due to the fragmentation of bigger MPs. At the same time, protocol B presented lower MP counts since the degradation of smaller MPs results in the obtaining of particles with a size range lower than 1 µm, which is out of the scope of this study since the definition chosen for considering a plastic particle an MP was from 5 mm to 1 µm. The lack of significant difference between protocol A and the others suggests an intermediate performance, balancing detection efficiency and pre-treatment aggressiveness.
When evaluating statistical differences based on particle morphology (significance level = 0.1), no significant differences were found among the protocols. However, both fragments and fibres showed p-values close to the significance threshold (F(2, 6) = 4.83; p = 0.056), while no difference was observed for films (F(2, 6) = 2.01; p = 0.215).

3.3. Implementation Cost Estimation

To assess the economic feasibility of the protocols, the cost per sample was estimated based on the amount of reagents and materials required for each procedure. Prices were obtained from current commercial products (Carlo Erba and Sharlab, Barcelona, Spain) and refer to standard laboratory-grade reagents. Table 2 summarises the quantities used, unit prices, and resulting cost per sample for each protocol. The quantities used in this study (“Needed”) were standardised to be able to compare the costs of each protocol.
Protocol B was the most affordable, with an estimated cost of 0.73€ per sample. Protocol A was the second one with a lower cost of 2.67€ per sample due to the use of reagent grade NaCl. However, the use of lower quality (table salt) could yield similar results but reducing the cost to up to 0.45€ per sample. Protocol C was by far the most expensive, with a cost of 15.23€ per sample, largely due to the high quantity of ZnCl2 required to reach the necessary density for particle separation and the larger amount of Nile Red used.
However, it is important to note that the use of density separation with ZnCl2 is not recommended for samples with low organic matter content, as its contribution to separation efficiency is limited. In such cases, the cost of protocol C can be significantly reduced to 3.67€ per sample, making it more economically viable.
These differences in cost must be considered in relation to the performance of each protocol in terms of MP quantification, detection sensitivity, and operational complexity. From this perspective, protocol A may offer the most balanced compromise between affordability and analytical reliability.

3.4. Integrated Evaluation of Protocol Performance

Based on the quantitative findings from MP quantification, statistical significance, and economic assessment, a multicriteria evaluation was conducted to compare the overall feasibility of each protocol.
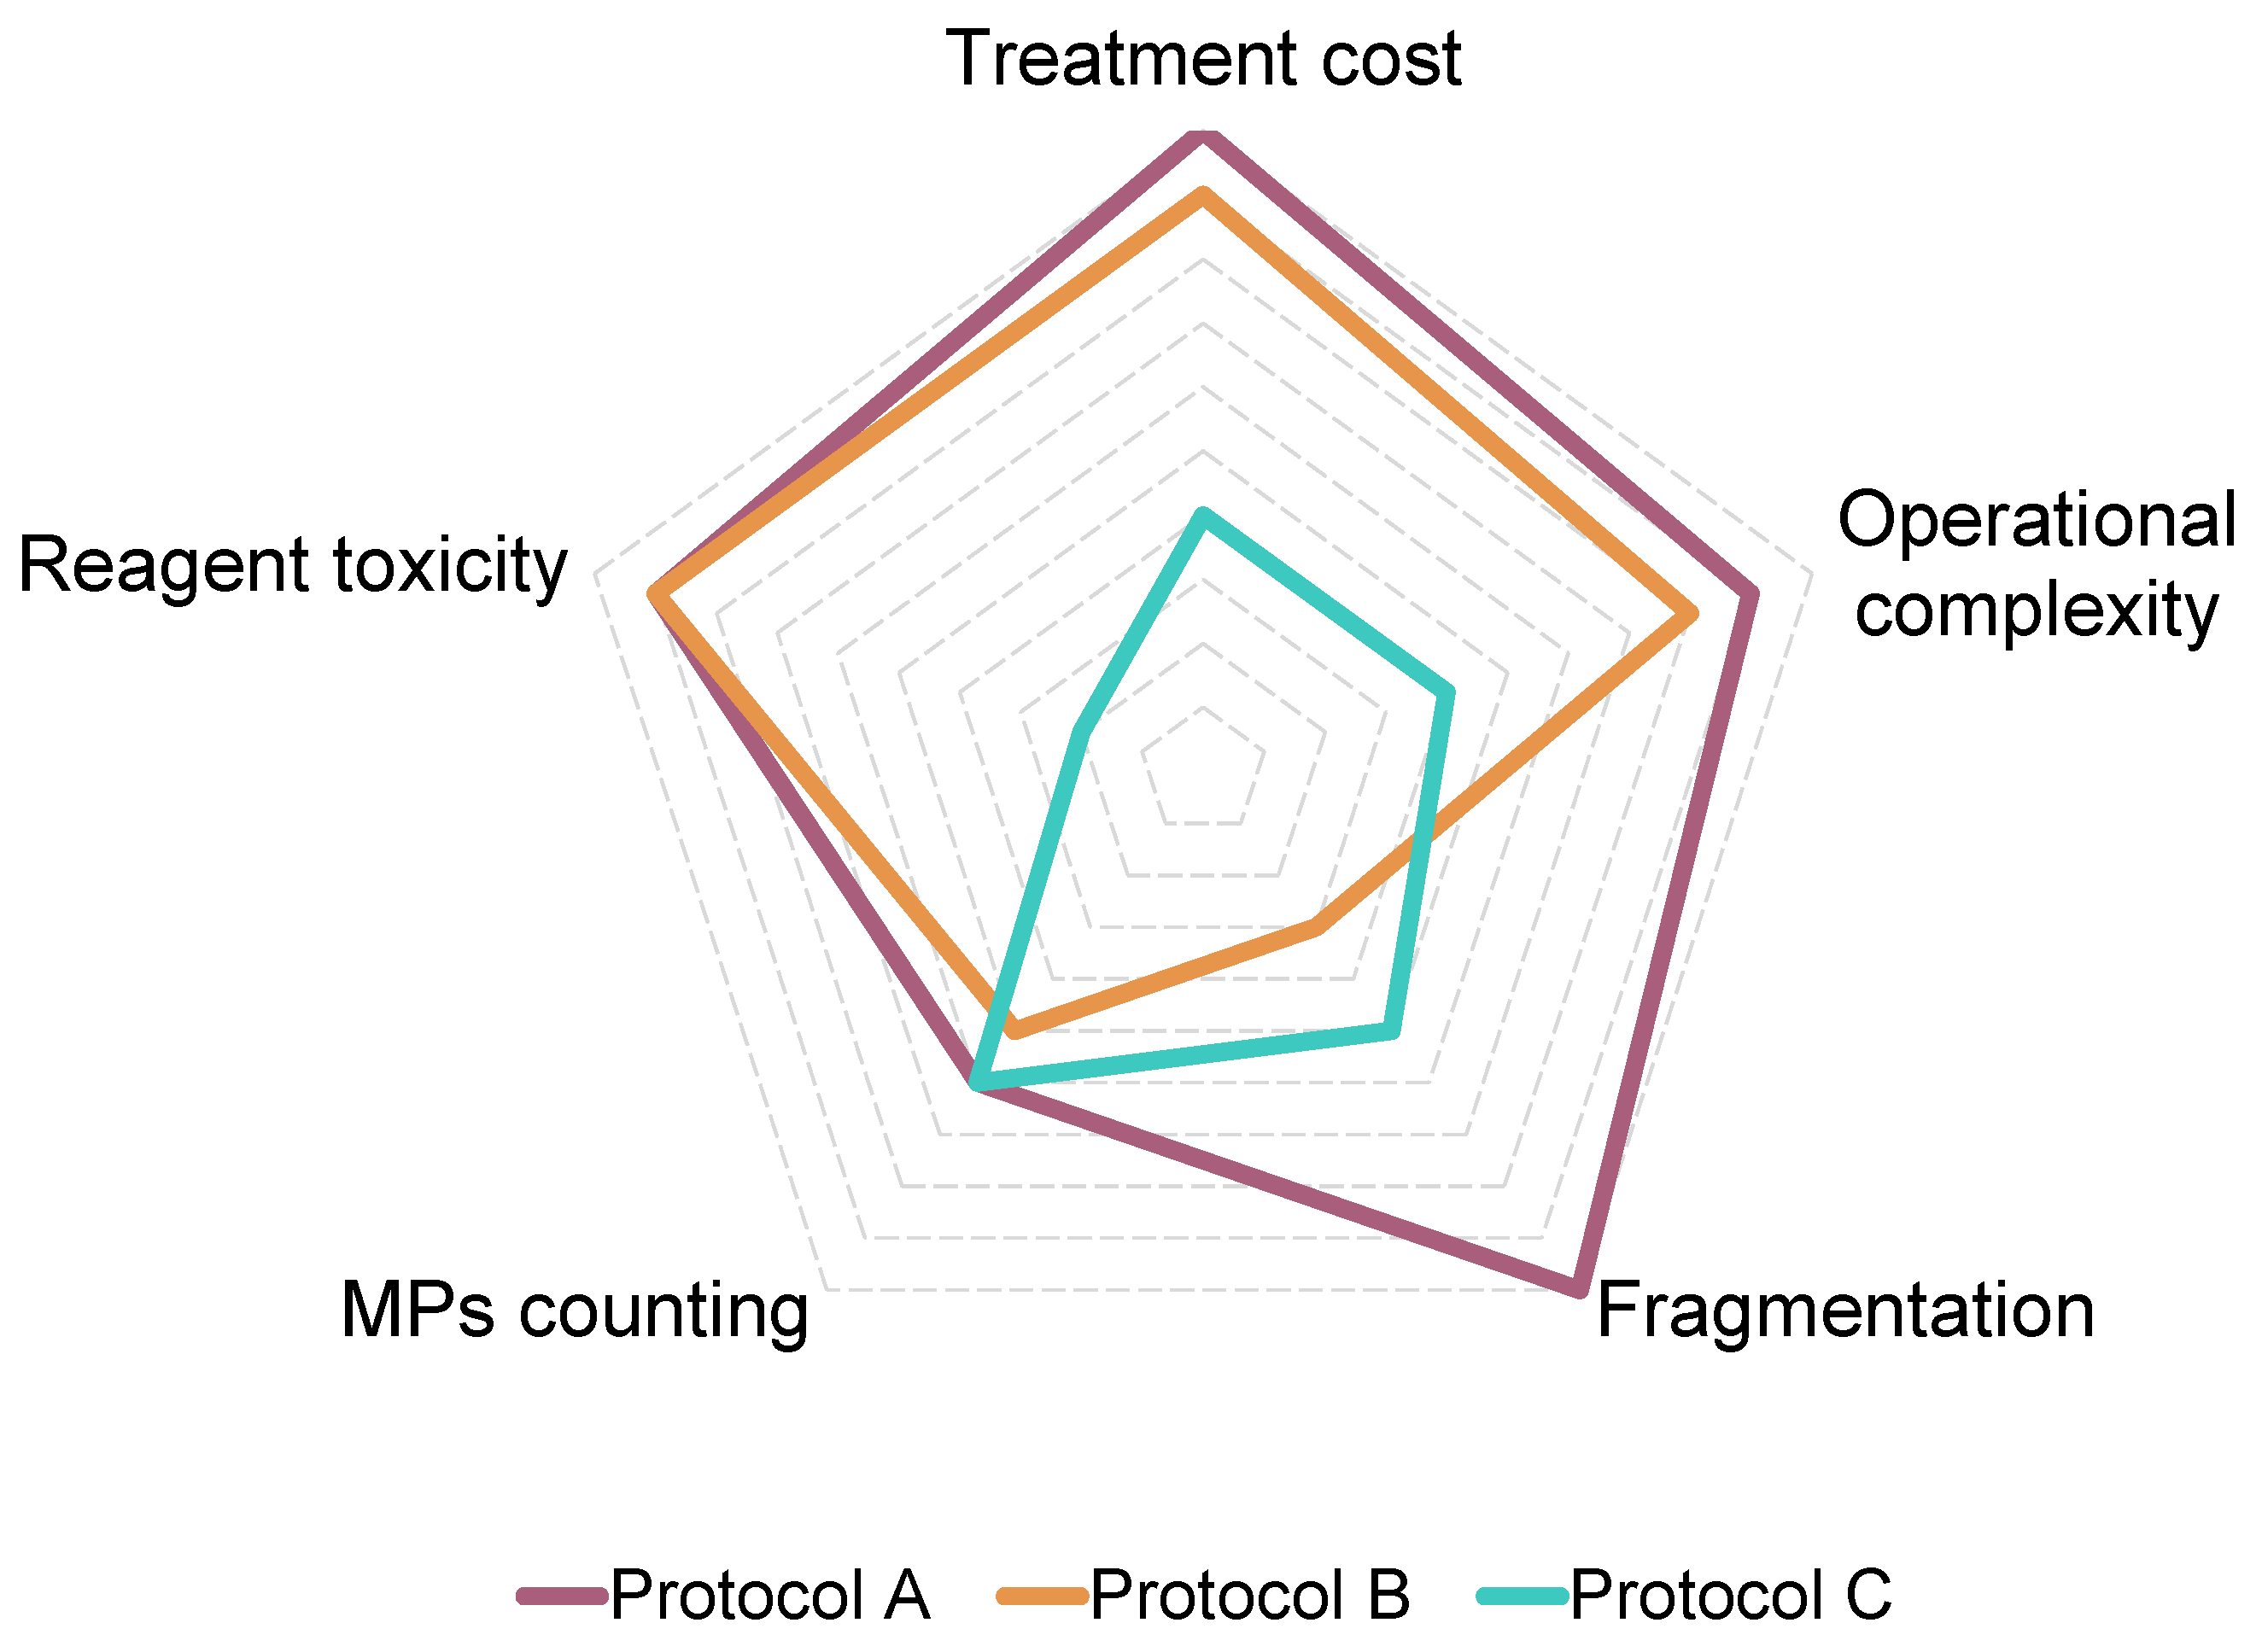
To summarise the main differences between the evaluated protocols, a radar chart was used based on five categories (Figure 4). It was assigned a score from 1 (least favourable) to 5 (most favourable) in five key categories for routine application: treatment cost, operational complexity, risk of particle fragmentation, detection efficiency, and reagent toxicity.
The scoring was based on a combination of experimental results and practical experience from running the tests. For instance, the “treatment cost” score reflects the actual estimated cost per sample. “Operational complexity” took into account how easy the procedure is to carry out in the lab, including steps, required equipment, and handling of reagents. Fragmentation was evaluated based on the observed size distribution and references reporting possible damage to MPs, especially under high temperatures or in contact with solvents like acetone.
In terms of detection efficiency, we considered not just the total number of particles detected but also how consistent and reliable those results were across replicates and morphologies. Lastly, reagent toxicity was assessed by looking at the type and amount of hazardous substances used (for example, ZnCl2 in Protocol C). ZnCl2 and acetone are highly hazardous, and their use in the lab and disposal should be managed with caution. Although Nile Red is commonly used for MP staining, it is also considered potentially toxic and should be handled with care. It is not a fully benign alternative to dyes like Rhodamine B, which also carries toxicological concerns.
While this kind of chart does not replace detailed data analysis, it helps highlight which protocol strikes the best balance overall (especially in contexts where simplicity, safety, and cost matter just as much as analytical sensitivity).
Protocol A shows a very balanced performance. It scores high in all categories, which means it is not only effective in quantifying microplastics but also easy to apply, low-cost, and safe to handle. This makes it a strong candidate for routine use, especially in settings where resources or time are limited.
Protocol B performs well in quantification, but it is less simple to carry out and involves reagents that require more careful handling. These aspects might make it harder to use in regular laboratory work, particularly where safety and time are important.
Protocol C stands out for different reasons. While it helps with visual detection of particles thanks to fluorescence, it comes with several drawbacks. It uses acetone, which increases both the cost and the chemical risk, and may also cause plastic fragmentation. This could lead to an overestimation of small particles. For these reasons, Protocol C seems less suitable for routine quantification, even if it might be useful in specific research contexts.

4. Conclusions

This study presents a comparative assessment of three protocols for MP detection, combining quantification data, statistical analysis, cost estimation, and operational considerations. Among the three, protocol A is reported as the most balanced among the other two protocols explored in terms of overall feasibility for routine microplastic monitoring.
While protocol C appeared to yield more small and hydrophobic particles, this is likely due to particle fragmentation caused by the chemical reagents used, rather than enhanced sensitivity. Moreover, the higher cost (15.23€ per sample), greater operational complexity, and the use of hazardous reagents such as ZnCl2 reduce the feasibility of its use as a routine analysis. Protocol B also presented limitations, including a higher risk of microplastic fragmentation and lower cost-effectiveness compared to protocol A, although its relatively low cost (0.73€ per sample) may be advantageous in certain contexts.
In contrast, protocol A proved to be the most balanced and robust approach, offering reliable quantification performance, minimal chemical and physical alteration of particles, and the lowest cost per sample (0.45€) when using table salt, which drastically reduces the cost of the treatment without compromising the reliability of the results. Its use of ethanol and Rhodamine B reduced both toxicity and background interference, while NaCl ensured effective density separation without the risks associated with heavier salts.
Based on all the results presented in this study, protocol A is recommended as the standard protocol for microplastic analysis in environmental samples, particularly where complex matrices or high sample volumes are involved. Its adoption could significantly improve comparability, reproducibility, and long-term monitoring efficiency across laboratories.

Author Contributions

R.R.-A. was responsible for conceptualization, formal analysis, methodology, results, and writing and editing of the original draft. S.D.-V. contributed to the analytical work, experimentation, writing—editing, and reviewing. D.C.-F. contributed to the analytical work, experimentation, writing—editing, and reviewing. L.P.M. contributed to the literature search, MPs identification and counting, writing—editing, and reviewing. C.A.S. was involved in conceptualization and writing—editing, reviewing. X.Y. was responsible for conceptualization and visualization, writing—editing, and reviewing. All authors have read and agreed to the published version of the manuscript.

Funding

This research received no funding.

Institutional Review Board Statement

Not applicable.

Informed Consent Statement

Not applicable.

Data Availability Statement

The data is available at https://doi.org/10.5281/zenodo.16355344 (accessed on 23 July 2025).

Conflicts of Interest

The authors declare no conflict of interest.

References

  1. Li, H.; Zhu, L.; Ma, M.; Wu, H.; An, L.; Yang, Z. Occurrence of microplastics in commercially sold bottled water. Sci. Total Environ. 2023, 867, 61553. [Google Scholar] [CrossRef] [PubMed]
  2. Upadhyay, R.; Singh, S.; Kaur, G. Sorption of pharmaceuticals over microplastics’ surfaces: Interaction mechanisms and governing factors. Environ. Monit. Assess. 2022, 194, 803. [Google Scholar] [CrossRef] [PubMed]
  3. Bhatt, V.; Chauhan, J.S. Microplastic in freshwater ecosystem: Bioaccumulation, trophic transfer, and biomagnification. Environ. Sci. Pollut. Res. 2022, 30, 9389–9400. [Google Scholar] [CrossRef] [PubMed]
  4. Almuhtaram, H.; Andrews, R.C. Sampling Microplastics in Water Matrices: A Need for Standardization. ACS EST Water 2022, 2, 1276–1278. [Google Scholar] [CrossRef]
  5. Prata, J.C.; Padrão, J.; Khan, M.T.; Walker, T.R. Do’s and don’ts of microplastic research: A comprehensive guide. Water Emerg. Contam. Nanoplast. 2024, 3, 8. [Google Scholar] [CrossRef]
  6. Quinn, B.; Murphy, F.; Ewins, C. Validation of density separation for the rapid recovery of microplastics from sediment. Anal. Methods 2017, 9, 1491–1498. [Google Scholar] [CrossRef]
  7. Rani, M.; Ducoli, S.; Depero, L.E.; Prica, M.; Tubić, A.; Ademovic, Z.; Morrison, L.; Federici, S. A Complete Guide to Extraction Methods of Microplastics from Complex Environmental Matrices. Molecules 2023, 28, 5710. [Google Scholar] [CrossRef]
  8. Pfeiffer, F.; Fischer, E.K. Various Digestion Protocols Within Microplastic Sample Processing—Evaluating the Resistance of Different Synthetic Polymers and the Efficiency of Biogenic Organic Matter Destruction. Front. Environ. Sci. 2020, 8, 572424. [Google Scholar] [CrossRef]
  9. Prasad, S.; Bennett, A.; Triantafyllou, M. Characterization of Nile Red-Stained Microplastics through Fluorescence Spectroscopy. J. Mar. Sci. Eng. 2024, 12, 1403. [Google Scholar] [CrossRef]
  10. Tong, H.; Jiang, Q.; Zhong, X.; Hu, X. Rhodamine B dye staining for visualizing microplastics in laboratory-based studies. Environ. Sci. Pollut. Res. 2021, 28, 4209–4215. [Google Scholar] [CrossRef]
  11. Aoki, H. Material-Specific Determination Based on Microscopic Observation of Single Microplastic Particles Stained with Fluorescent Dyes. Sensors 2022, 22, 3390. [Google Scholar] [CrossRef]
  12. Kang, H.; Park, S.; Lee, B.; Ahn, J.; Kim, S. Modification of a Nile Red Staining Method for Microplastics Analysis: A Nile Red Plate Method. Water 2020, 12, 3251. [Google Scholar] [CrossRef]
  13. Li, Y.; Chen, P.; Tang, Y.; Yang, Y.; Zhou, C.; Bu, J.; Zhong, S. Microplastics in Water: A Review of Characterization and Removal Methods. Sustainability 2024, 16, 4033. [Google Scholar] [CrossRef]
  14. Lv, L.; Yan, X.; Feng, L.; Jiang, S.; Lu, Z.; Xie, H.; Sun, S.; Chen, J.; Li, C. Challenge for the detection of microplastics in the environment. Water Environ. Res. 2021, 93, 5–15. [Google Scholar] [CrossRef] [PubMed]
  15. Bakir, A.; McGoran, A.R.; Silburn, B.; Russell, J.; Nel, H.; Lusher, A.L.; Amos, R.; Shadrack, R.S.; Arnold, S.J.; Castillo, C.; et al. Creation of an international laboratory network towards global microplastics monitoring harmonization. Sci. Rep. 2024, 14, 12714. [Google Scholar] [CrossRef] [PubMed]
  16. Lu, H.-C.; Ziajahromi, S.; Neale, P.A.; Leusch, F.D.L. A systematic review of freshwater microplastics in water and sediments: Recommendations for harmonisation to enhance future study comparisons. Sci. Total Environ. 2021, 781, 146693. [Google Scholar] [CrossRef]
  17. Rodríguez-Alegre, R.; Durán-Videra, S.; Megías, L.P.; Pérez-Moya, M.; García-Montaño, J.; Saiz, C.A.; You, X. Effect of Microfiltration Membrane Configuration in Microplastics Recovery from Wastewater Treatment Effluent. Membranes 2025, 15, 137. [Google Scholar] [CrossRef]
  18. Sturm, M.T.; Myers, E.; Schober, D.; Korzin, A.; Schuhen, K. Development of an inexpensive and comparable microplastic detection method using fluorescent staining with novel nile red derivatives. Analytica 2023, 4, 27–44. [Google Scholar] [CrossRef]
  19. Maes, T.; Jessop, R.; Wellner, N.; Haupt, K.; Mayes, A.G. A rapid-screening approach to detect and quantify microplastics based on fluorescent tagging with Nile Red. Sci. Rep. 2017, 7, 44501. [Google Scholar] [CrossRef]
  20. Tiwari, A.K.; Upadhyay, V.K. Fenton’s reagent dose calculation with respect to COD value and the process requirement optimization for effective oxidation of Aqueous Mother Liquor Effluent of an API manufacturing industry at large scale. Int. J. Adv. Res. 2013, 1, 158–164. [Google Scholar]
  21. Munno, K.; Helm, P.A.; Jackson, D.A.; Rochman, C.; Sims, A. Impacts of temperature and selected chemical digestion methods on microplastic particles. Environ. Toxicol. Chem. 2017, 37, 91–98. [Google Scholar] [CrossRef]
  22. Ormaniec, P. Occurrence and analysis of microplastics in municipal wastewater, Poland. Environ. Sci. Pollut. Res. 2024, 31, 49646–49655. [Google Scholar] [CrossRef]
  23. Bodzek, M.; Pohl, A.; Rosik-Dulewska, C. Microplastics in Wastewater Treatment Plants: Characteristics, Occurrence and Removal Technologies. Water 2024, 16, 3574. [Google Scholar] [CrossRef]
  24. Miino, M.C.; Galafassi, S.; Zullo, R.; Torretta, V.; Rada, E.C. Microplastics removal in wastewater treatment plants: A review of the different approaches to limit their release in the environment. Sci. Total Environ. 2024, 930, 172675. [Google Scholar] [CrossRef]
  25. García-Sobrino, R.; Cortés, A.; Calderón-Villajos, R.; Díaz, J.G.; Muñoz, M. Novel and Accessible Physical Recycling for Expanded Polystyrene Waste with the Use of Acetone as a Solvent and Additive Manufacturing (Direct Ink-Write 3D Printing). Polymers 2023, 15, 3888. [Google Scholar] [CrossRef]
  26. Bianco, A.; Carena, L.; Peitsaro, N.; Sordello, F.; Vione, D.; Passananti, M. Rapid detection of nanoplastics and small microplastics by Nile-Red staining and flow cytometry. Environ. Chem. Lett. 2023, 21, 647–653. [Google Scholar] [CrossRef]
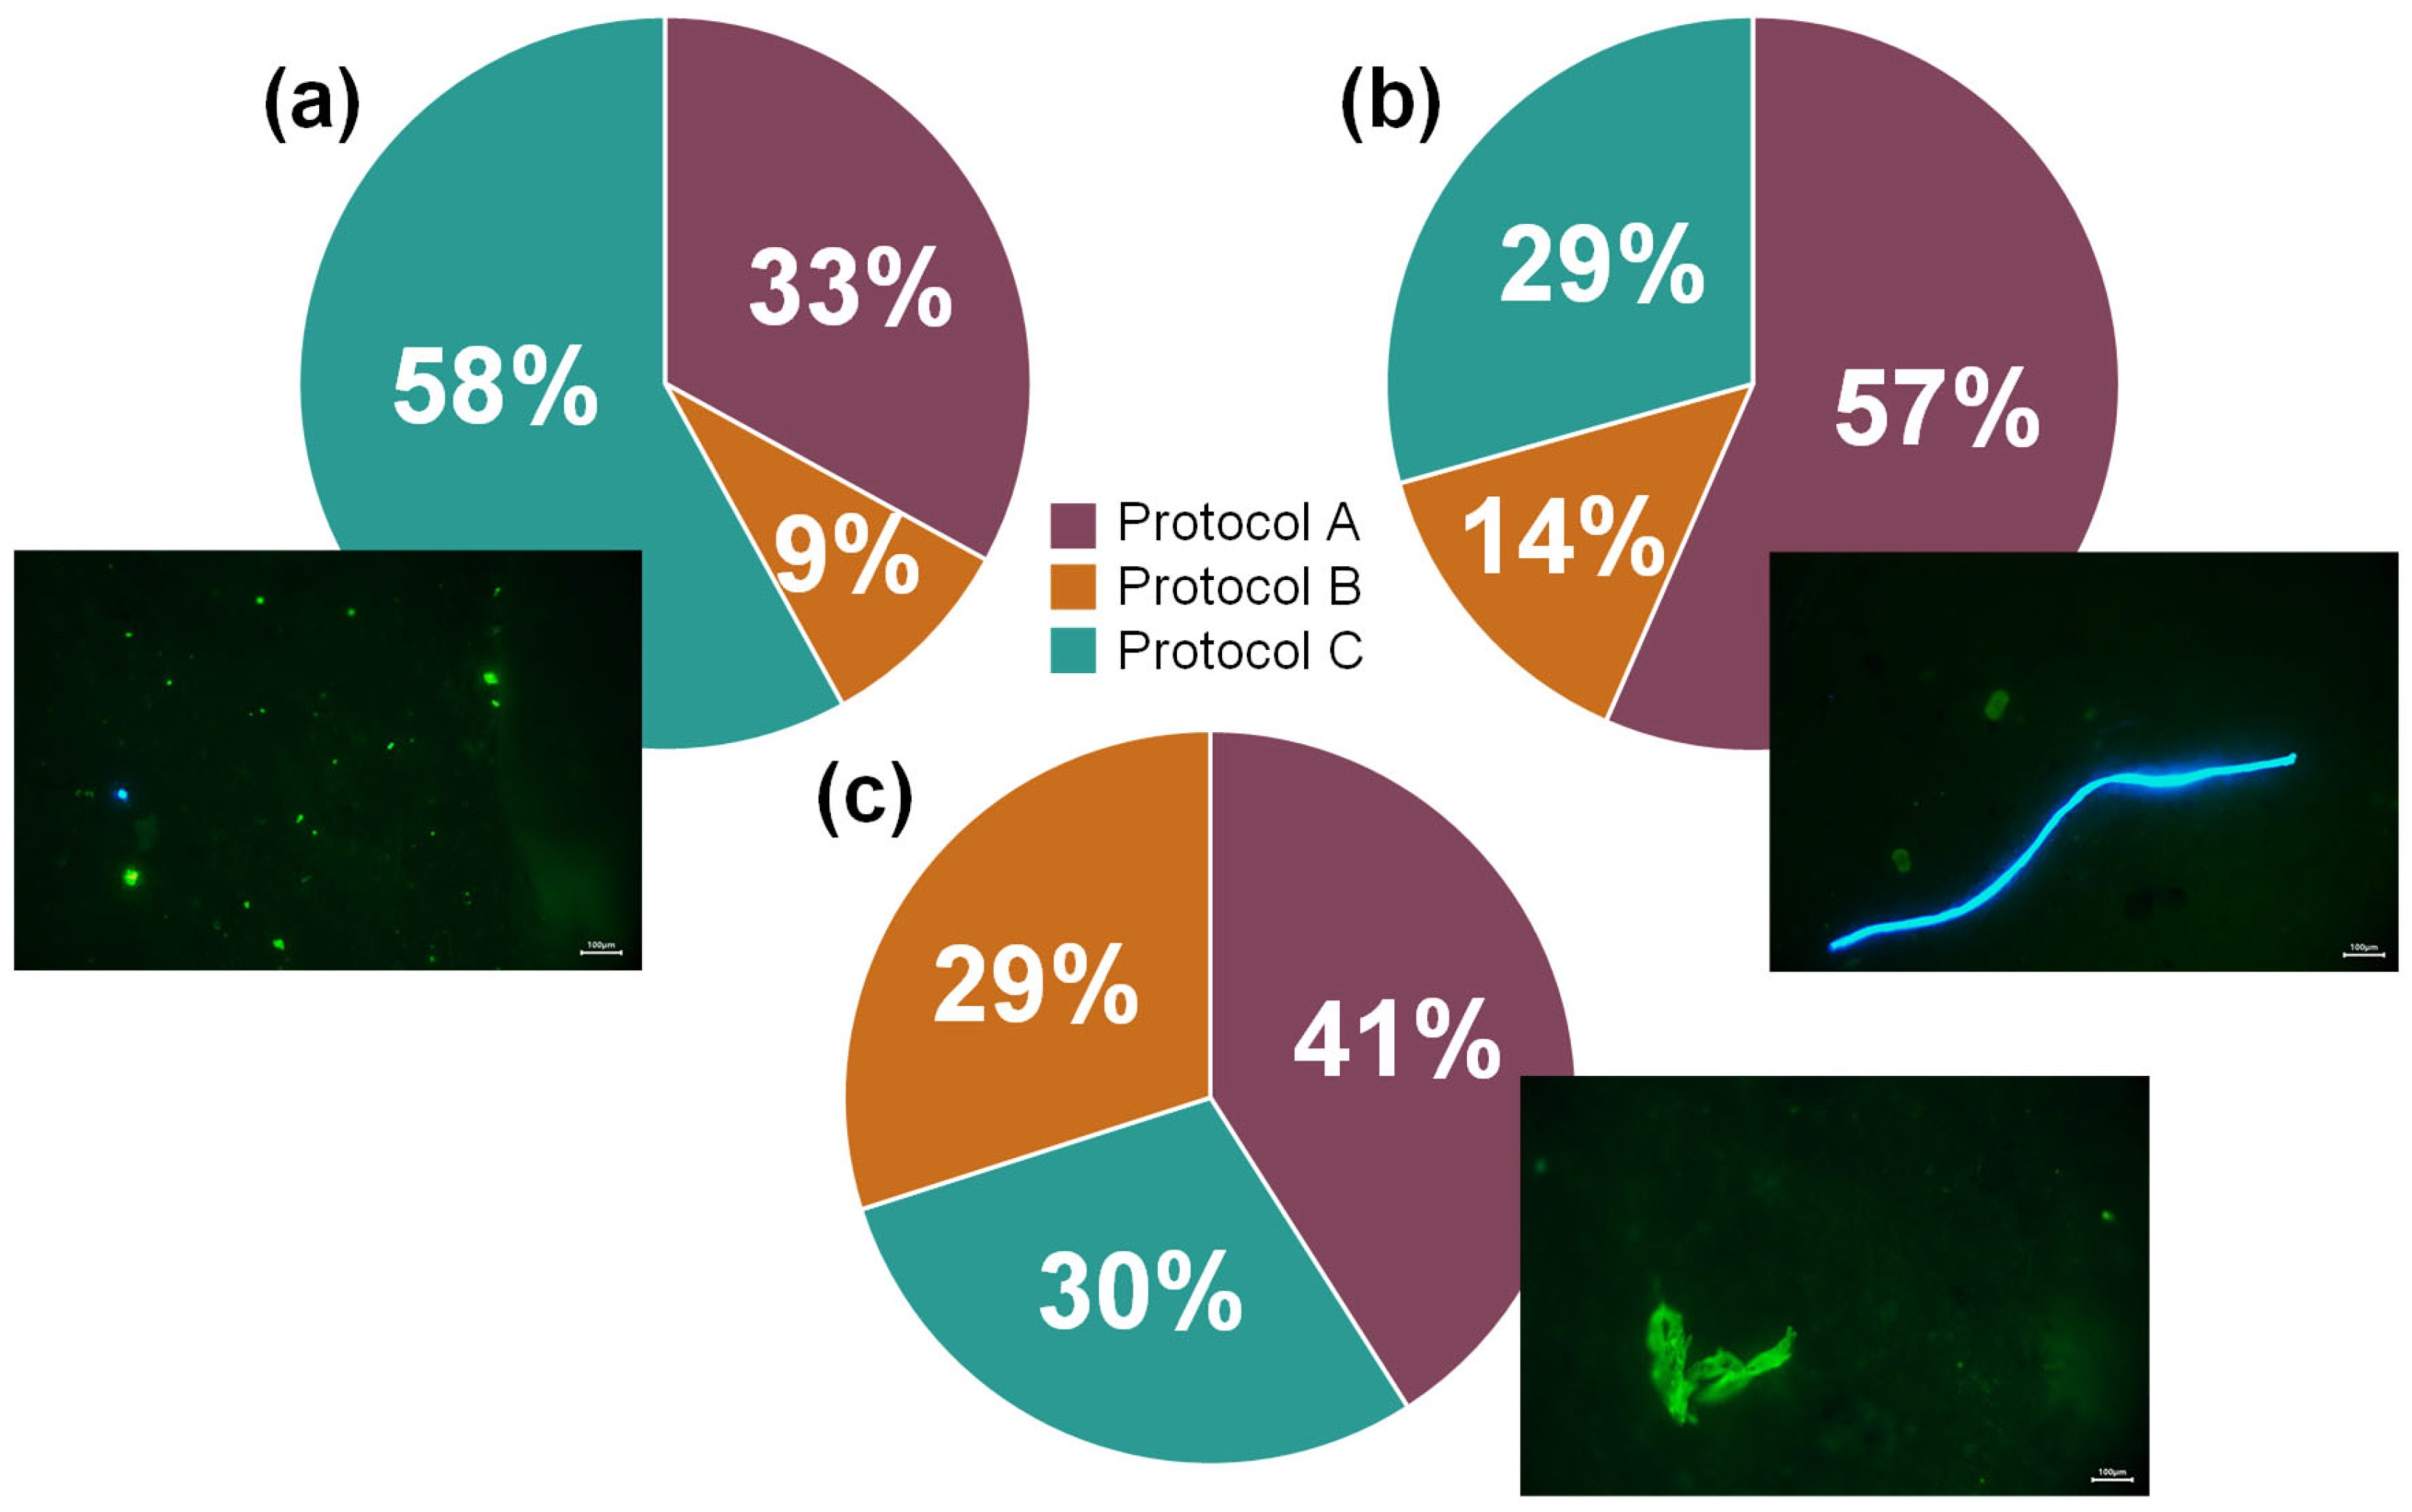
Figure 1. Sample preparation procedures for protocols A, B and C [17,18,19].
Microplastics 04 00049 g001
Figure 2. Distribution of microplastic morphology—fragments (a), fibres (b) and films (c)—for each protocol, expressed as relative abundance.
Microplastics 04 00049 g002
Figure 3. Total microplastic counts per sample obtained using each protocol, expressed as mean ± standard deviation (n = 9).
Microplastics 04 00049 g003
Figure 4. Multicriteria evaluation of the three protocols for microplastic analysis.
Microplastics 04 00049 g004
Table 1. Quantification of MPs by size range and morphology for the three tested protocols.
ProtocolUnitFragmentsFibresFilms
<50 µm50–100 µm>100 µm<100 µm100–500 µm500–1000 µm>1000 µm<100 µm100–500 µm500–1000 µm>1000 µm
AMP sample−11819 ± 1557135 ± 5725 ± 513 ± 289 ± 2947 ± 2843 ± 191 ± 115 ± 11 ± 200 ± 00
%83.096.151.160.614.052.161.980.030.700.060.00
BMP sample−1499 ± 30126 ± 2813 ± 33 ± 136 ± 125 ± 14 ± 300 ± 0011 ± 31 ± 11 ± 1
%83.444.352.120.456.020.890.670.001.780.170.11
CMP sample−13335 ± 133275 ± 1573 ± 4115 ± 958 ± 3813 ± 613 ± 172 ± 29 ± 41 ± 11 ± 1
%92.752.092.020.431.610.370.370.060.240.040.02
Table 2. Cost estimation for the protocols explored in this study.
ReagentQuantityUnitPriceUnitNeededUnitTotalUnit
Protocol A
NaCl (99%)1000g37.5060.00g2.250
Glass fibre filter100u20.461.00u0.205
H2O2 (30%)1000mL24.593.00mL0.074
Rhodamine B100,000mg80.681.00mg0.001
Ethanol1000mL25.015.00mL0.125
FeSO4·7H2O1000g45.500.27g0.012
Total2.667€ sample−1
Protocol B
Glass fibre filter100u20.461.00u0.205
H2O2 (35%)1000mL60.9020.00mL0.006
Red Nile250mg164.630.50mg0.329
Acetone1000mL34.775.00mL0.174
FeSO4·7H2O1000g45.500.32g0.015
Total0.728€ sample−1
Protocol C
Glass fibre filter100u20.461.00u0.205
Red Nile250mg164.635.00mg3.293
Acetone1000mL34.775.00mL0.174
ZnCl21000g62.48185.00g11.559
Total 15.230€ sample−1
Disclaimer/Publisher’s Note: The statements, opinions and data contained in all publications are solely those of the individual author(s) and contributor(s) and not of MDPI and/or the editor(s). MDPI and/or the editor(s) disclaim responsibility for any injury to people or property resulting from any ideas, methods, instructions or products referred to in the content.