Article

The Use of FLIM for Characterising Chromosomes and Their Structure in Response to Low-Dose X-Ray Irradiation

by
Mohammed Yusuf
1,2,*,†,
Sarah L. Berger
3,4,†,
Rosie Sanders
4,
Archana Bhartiya
2,
Rinyaporn Phengchat
5,
Stephen Barnard
6,
Benji Bateman
4,
Ian K. Robinson
2 and
Stanley W. Botchway
4,*
1
The Rosalind Franklin Institute, Rutherford Appleton Laboratory, Harwell Campus, Didcot OX11 0QX, UK
2
London Centre for Nanotechnology, University College London, London WC1H 0AH, UK
3
School of Molecular Biosciences, University of Glasgow, University Avenue, Glasgow G12 8QQ, UK
4
Central Laser Facility, Research Complex at Harwell, UKRI-Science and Technology Facilities Council, Rutherford Appleton Laboratory, Harwell Science and Innovation Campus, Oxfordshire OX11 0QX, UK
5
Quantum and Nanotechnology Research Centre, National Research Council Canada, 11421 Saskatchewan Drive, Edmonton, AB T6G 2M9, Canada
6
UK Health Security Agency, Radiation, Chemical, Climate and Environmental Hazards (RCCE), Chilton, Oxfordshire OX11 0RQ, UK
*
Authors to whom correspondence should be addressed.
These authors contributed equally to this work.
Submission received: 12 September 2025 / Revised: 18 April 2026 / Accepted: 24 April 2026 / Published: 25 May 2026

Abstract

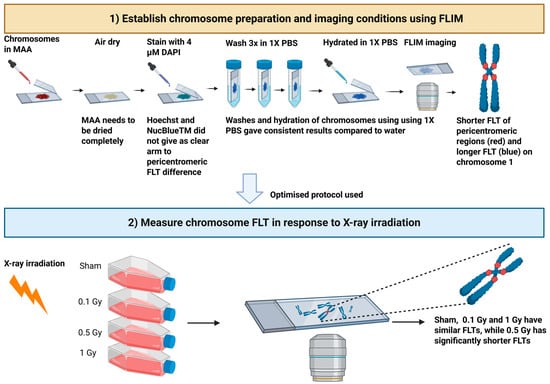
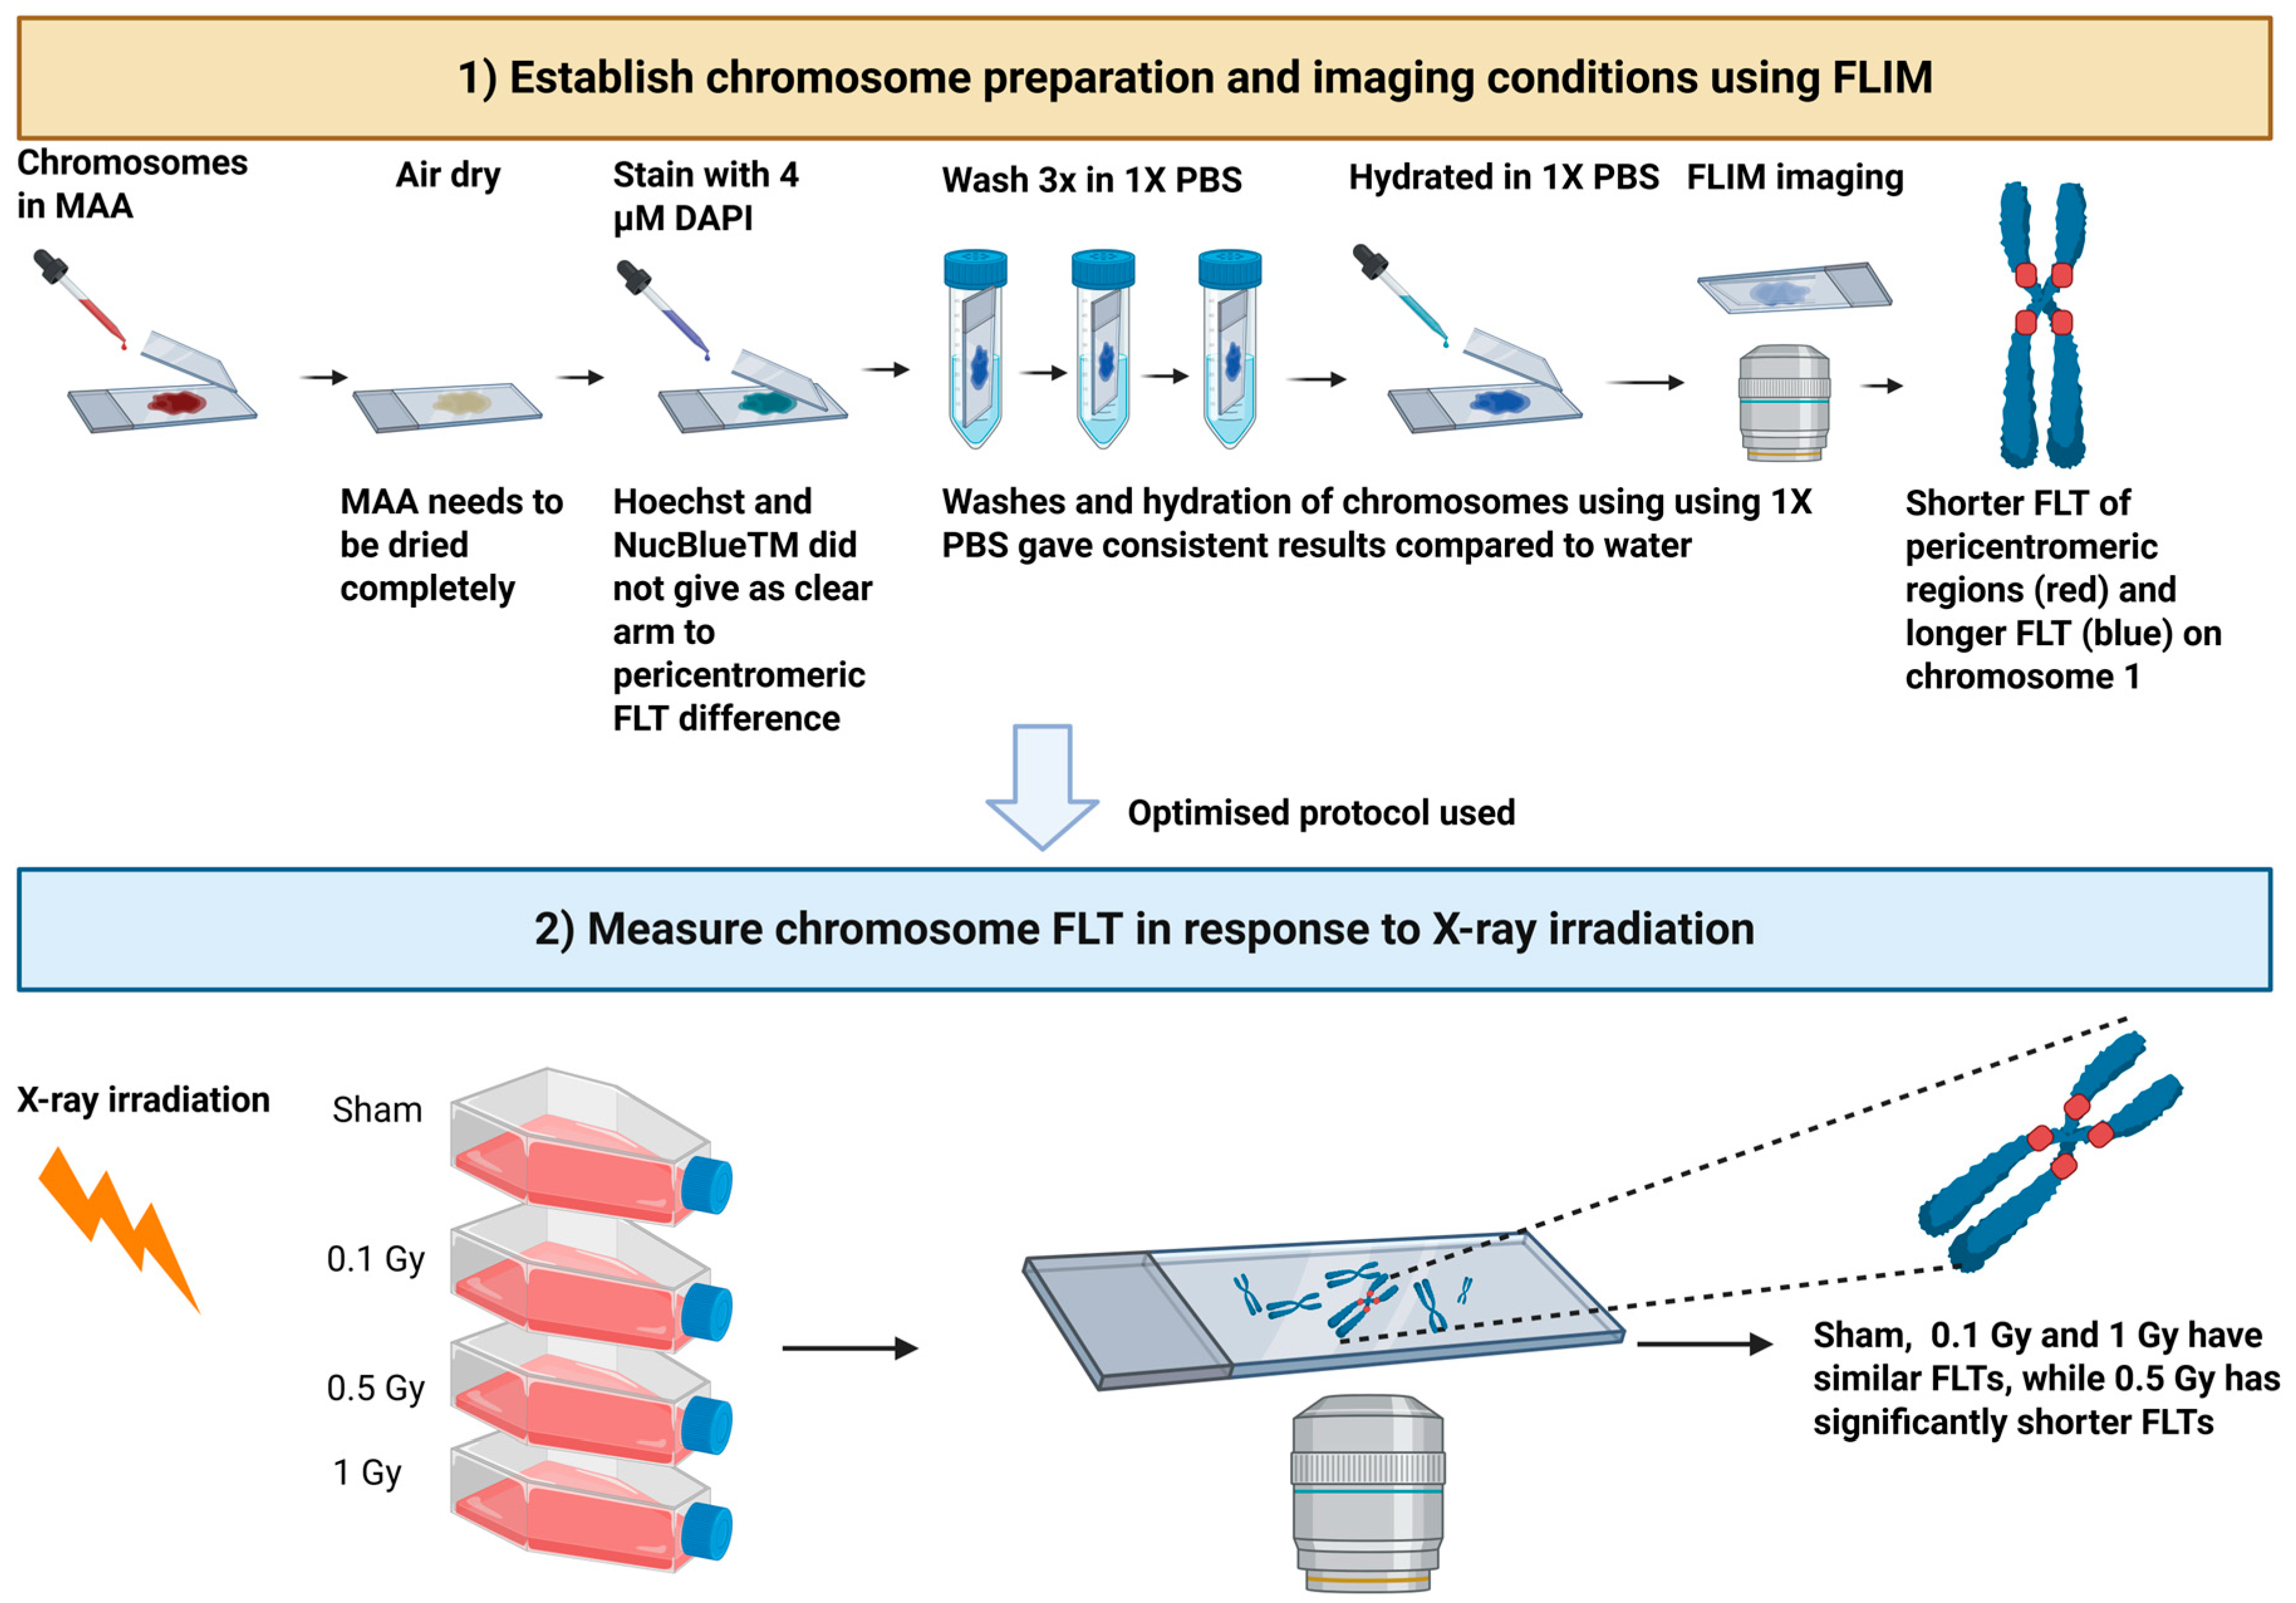
Background/Objectives: Chromosome research is essential for advancing our understanding of cytogenetics, gene regulation and numerous aspects of organismal health. Staining chromosomes with 4′,6-diamidino-2-phenylindole (DAPI) and applying Fluorescence Lifetime Imaging Microscopy (FLIM) enables the assessment of structural changes in pericentromeric and heterochromatin-rich region of chromosomes 1, with a shorter fluorescence lifetime (FLT) in the pericentromeric regions compared to the arms. Methods: We used FLIM to optimise sample preparation conditions for more robust imaging and furthermore to measure the impact of low-dose X-ray ionising radiation on chromosome structure when labelled with DAPI. Results: We applied this method to different DNA stains bound to chromosomes where only DAPI led to a clear FLT difference between the chromosome arms (p,q) with 2.98 ± 0.12 ns and 2.65 ± 0.07 ns at the pericentromeric region, while similar stains, such as Hoechst 33258 and NucBlueTM did not highlight these regions as clearly following FLIM analysis. Our data showed that chromosomes of cells irradiated with 0.1 Gy and 1 Gy did not show a significant change in FLTs (2.94 ± 0.09 ns on the arms and 2.60 ± 0.06 ns on the pericentromeric region) of chromosome 1. Whilst irradiation with 0.5 Gy led to a noticeable and significant reduction in FLT with 2.42 ± 0.13 ns on the arms and 2.12 ± 0.06 ns on the pericentromeric region of HeLa chromosomes. The same pattern could also be seen on X-ray-irradiated T-cell chromosomes. Conclusions: These findings indicate that DAPI FLT may be a useful tool to measure chromosomal structural changes and further suggests that chromosomes undergo distinct structural changes at the pericentromeric region following low-dose irradiation.

Graphical Abstract

1. Introduction

Chromosomes serve as the fundamental units for storing and transmitting hereditary information, including genetic variation. They are essential for ensuring correct cell growth, proper functioning as well as normal genetic and inheritance of traits. Thus, chromosomal DNA damage is a critical contributor to a range of pathological conditions, including genomic instability, mutagenesis and oncogenesis. Such damage can arise from both endogenous and exogenous sources [1]. Their preparation and analysis, particularly through karyotyping using Giemsa banding (G-banding), remain essential diagnostic tools in clinical medicine. These analyses are typically performed on metaphase chromosome “spreads,” allowing for detailed visualisation of individual chromosomes and their banding patterns [2,3]. Analysis of chromosome spreads as well as high resolution imaging offers critical insights into genome organisation [4,5] and enables the investigation of various disease states, including chromosomal DNA damage [6,7].
Pericentromeric regions are essential genomic domains that play an important role in maintaining chromosome stability. These regions are characterised by the formation of heterochromatin, driven by coordinated epigenetic modifications such as DNA methylation and specific histone marks. The resulting transcriptionally repressive chromatin environment is crucial for silencing gene expression and preserving chromosomal integrity. Disruption of these epigenetic mechanisms has also been associated with pathological conditions including cancer and premature ageing, where chromosomal instability is a common feature. Therefore, investigating the structure and regulation of pericentromeric heterochromatin is fundamental to understanding disease aetiology and identifying novel avenues for clinical intervention [8].
Certain individual chromosomes, particularly 1, 9, 15, 16 and Y, have pericentromeric heterochromatin that are highly condensed regions of DNA. These regions are known to be rich in repetitive DNA sequence. They play an important role in maintaining genome integrity, control gene expression and correct chromosome segregation during cell division [8].
Endogenous chromosomal DNA damage is typically associated with cellular metabolic processes, including hydrolysis, oxidation, alkylation, and base mismatches [1,9]. Exogenous damage, on the other hand, may result from exposure to ionising and non-ionising radiation such as ultraviolet (UV) light and various chemical agents. Direct interaction with DNA can lead to ionisation events that release hydrated electrons from atomic bonds and hydroxyl radicals, causing single- and double-strand breaks [9,10].
Fluorescence imaging remains a cornerstone in chromosome analysis and karyotyping. Furthermore, it is the most widely employed method for investigating chromosome organisation, structure and dynamics, offering high sensitivity and spatial resolution. Time-resolved techniques such as excited-state fluorescence lifetime (FLT) measurements are a critical photophysical parameter determination that provides insights into the local molecular environment. These measurements can reveal information about molecular quenching (static or dynamic), pH, oxygen concentration, energy relaxation pathways, rotational dynamics, viscosity and energy transfer processes [10,11,12,13,14,15]. FLT refers to the average time a fluorophore remains in its excited state before emitting a photon and returning to the ground state. Fluorescence Lifetime Imaging Microscopy (FLIM) integrates these FLT measurements with spatial fluorescence imaging, using either one-photon or multiphoton excitation [15]. There are three principal methods for acquiring FLIM data: (1) frequency-domain FLT measurements, (2) time-gated detection using sub-nanosecond gated cameras, and (3) time-correlated single-photon counting (TCSPC) combined with scanning or widefield imaging systems [15,16]. In this study, we employed TCSPC-FLIM, which requires a pulsed excitation source (e.g., laser), a photon-sensitive detector with sub-nanosecond resolution, and a precise timing system to synchronise photon arrival with the excitation pulse-ideally with picosecond accuracy [17]. FLIM thus offers a powerful approach for probing and visualising chromosomal environments at sub-micron resolution using intercalating chemical probes.
FLIM has emerged as a valuable tool for investigating the structural organisation and compaction state of mitotic chromosomes when labelled with specific fluorescent probes [17,18,19], representing a growing area of research in chromatin DNA biology. It has been shown that FLIM of non-irradiated, fixed human metaphase chromosomes revealed shorter FLT in chromosomes 1, 9, 15, 16, and Y, specifically in their heterochromatic rich regions, compared to the other chromosomes [18]. These chromosomes are commonly referred to as heterochromatic due to the presence of distinct heterochromatin blocks near the pericentromeric regions. Pericentromeric regions are made up of repetitive tandem satellite repeats that are important for accurate chromosome segregation in mitosis [20]. Constitutive heterochromatin is notably located at the pericentromeric regions of chromosomes 1, 9, and 16 [21], the short p-arm of chromosome 15 [22,23], and the distal region of chromosome Y [24,25].
In this paper, first, we optimised sample preparation conditions specifically the effect of DNA labelling dye and hydration for imaging chromosomes using FLIM. Once these conditions had been established, we investigated how X-ray irradiation at different doses (0.1, 0.5 and 1 Gy) appear to impact chromosome FLT, mainly the heterochromatin-rich pericentromeric region of the human chromosomes. Further, we show that the use of FLT is an excellent method to monitor chromosomal change processes in response to X-ray-induced DNA damage and hydration changes. Considering that the FLT of DAPI is lower in more condensed regions (heterochromatin) than less condensed (euchromatin), the reduced FLTs observed following ionising radiation damage may be reporting on such condensation changes.

2. Materials and Methods

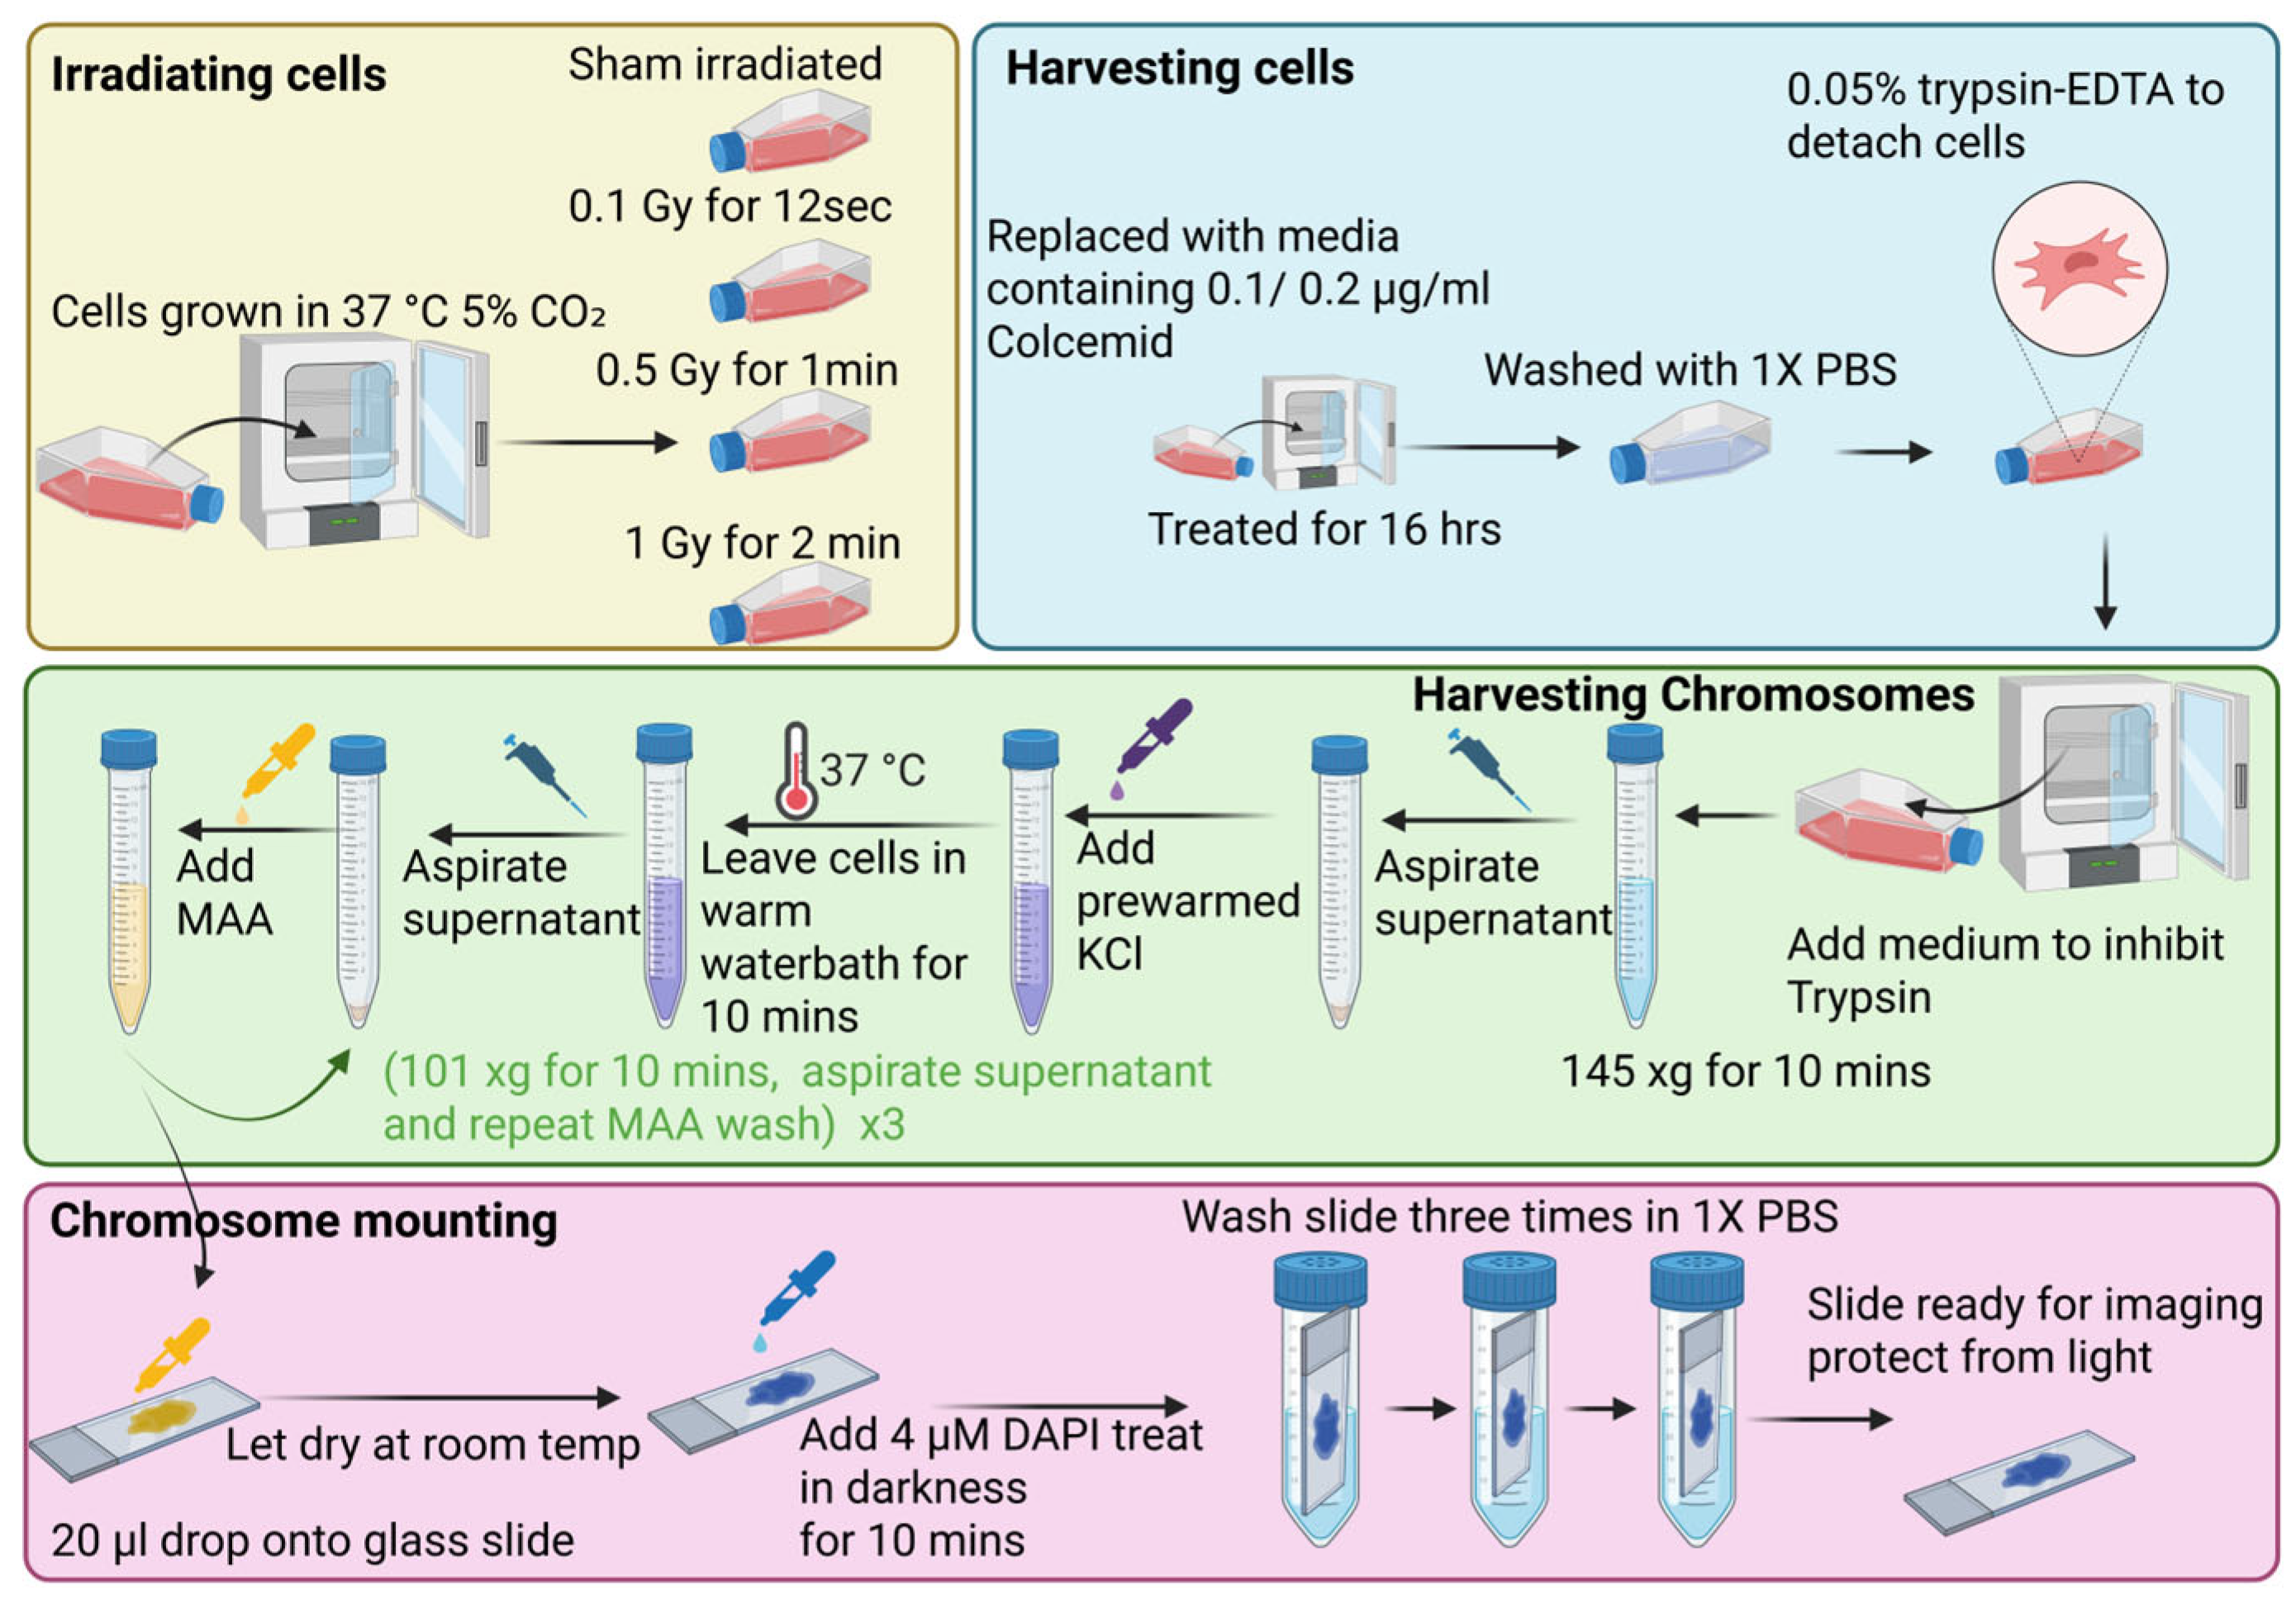
Figure 1 presents a flowchart outlining the complete procedure for chromosome sample preparation and live cell X-irradiation.

2.1. Cell Culture

In this work, two cell types were used. We wanted to investigate a normal cell type (human T-cells) with the correct chromosome number and structure, compared to an abnormal (Henrietta Lacks, HeLa cervical cancer) cell line. Cancer cell lines are well known to be relatively resistant to ionising radiation (as in radiotherapy) even when the effect of hypoxia is excluded, whilst they also have more often irregular chromosome number.
HeLa cells were cultured at passage 5 in T75 flasks using phenol red-free DMEM (Gibco, Life Technologies, Thermo Fisher Scientific UK), supplemented with 10% foetal bovine serum (FBS), 5 mM glutamine/1% GlutaMAX, and 1% penicillin-streptomycin (all from Gibco, Life Technologies, UK). Cultures were maintained at 37 °C in a humidified atmosphere with 5% CO2. Chromosome preparations were performed when the cells reached 70–80% confluency.
Human T-cells (primary cells) were extracted from an anonymised healthy female blood donor (provided by Dr. Sylwia Kabacik, UK Health and Security Agency as per local ethical approval from West Midlands-Solihull Research Ethics Committee (REC 14/WM/1182)). T-lymphocyte isolation and culture followed the protocol described by [7]. Once T-lymphocytes were extracted (following all ethical approval and procedure), cells were incubated at 37 °C in a humidified 5% CO2 environment, tilted at a 10° angle from horizontal. Once the culture reached a density of approximately 3 × 10⁵ cells/mL, the cells were ready for X-ray irradiation and chromosome preparation. Briefly, to extract the T-lymphocyte chromosomes, 7.5 mL of volunteer’s blood was added to 7.5 mL of Hank’s balanced salt solution (HBSS), before adding 5 mL of histoplaque-1077. This was centrifuged at 258× g for 20 min. This separates the blood into layers, allowing the top serum layer to be removed and the bottom buffy coat layer to be collected. HBSS in the amount of 10 mL of is added to the buffy coat cell layer and it is centrifuged for 5 min at 145× g. The supernatant is once again removed and followed by a final wash with 10 mL of HBSS. The washed sample was centrifuged once more at 5 min at 145× g, and the supernatant removed. The subsequent pellet was added to 10 mL of serum-free stimulating growth media (SR10), comprising RPMI 1640 supplemented with heat-inactivated 10% FBS, 1 mM sodium pyruvate, 1% penicillin-streptomycin, 20 U/mL recombinant interleukin-2, 0.4 µg/mL of phytohemagglutinin (Sigma-Aldrich, Dorset, UK), 2 mM Glutamate (Sigma-Aldrich) and 50 µM 2-mercaptoethanol (GIBCO/Life Technologies).

2.2. X-Ray Irradiation for Induction of Cellular DNA Damage

HeLa and human T-lymphocyte cells were irradiated with doses of 0.1 (12 s), 0.5 (1 min), and 1 Gy (2 min), alongside a sham-irradiated control (the initial hard X-rays dose rate from the instrument of 1.7 Gy/min was adjusted for the irradiation times used here). This dose range was chosen to reflect previous experiments performed by others that gave chromosome aberrations. Doses higher than this do not show clear chromosome aberrations. Another reason for this dose selection is that a hyper-radiation sensitivity was observed below 1 Gy for cell survival assay [26]. Irradiation was conducted at the UK Health Security Agency (UKHSA, Harwell, UK) under room temperature conditions. X-irradiations were conducted using a self-contained 250 kVp X-ray unit (CD160/1, AGO X-ray Ltd., Martock, UK) with aluminium and copper filtration (~1 mm) containing a Varian NDI-320 source. Acute doses of X-rays were delivered at 0.5 Gy/min. Dosimetry was performed with a calibrated reference ionisation chamber for the exact exposure setup used. Exposures were always monitored using a calibrated UNIDOS E electrometer and ‘in-beam’ monitor ionisation chamber (all from PTW, Freiburg, Germany) located at source. Correction factors were used to calculate exact dose.

2.3. Chromosome Preparation and Mounting on Microscope Glass Slides

Chromosomes were prepared using previously established protocols [18,19,27,28,29]. Once cell cultures reached 70–90% confluency, colcemid (Thermo Fisher Scientific, UK) was added (0.1 µg/mL for HeLa cells and 0.2 µg/mL for T-cells), and cells were incubated for 16 h at 37 °C in a humidified atmosphere with 5% CO2. Following incubation, cells were harvested for chromosome preparation. The HeLa cells were detached by adding 3 mL of 0.05% trypsin-EDTA (Gibco, Life Technologies, Paisley, UK) and incubating for 5 min at 145× g 37 °C. Detached cells were resuspended in 3 mL of culture medium and centrifuged at for 10 min. The supernatant was discarded, and pre-warmed (37 °C) 75 mM potassium chloride (KCl; VWR, Lutterworth, UK) was added dropwise to the pellet. Cells were incubated in a water bath at 37 °C for 10 min to induce hypotonic swelling, followed by centrifugation at 145× g for 10 min. A freshly prepared 3:1 methanol (Scientific Laboratory Supplies, Fairham, UK) and acetic acid (Sigma-Aldrich, Dorset, UK) solution (MAA) was used for fixation. Fresh preparation is essential to prevent esterification and maintain effectiveness of the solution. After centrifugation, the supernatant was removed, and the MAA was added dropwise to the pellet while vortexing. The mixture was centrifuged again at 101× g for 10 min. This MAA washing step was repeated three times. Fixed samples were stable for several months when stored at 4 °C.
The fixed chromosome suspension in the amount of 20–30 µL was dropped onto the microscope slide from a height of approximately 30 cm to ensure optimal spreading. For T-cell preparations, the suspension was dropped from a reduced height of approximately 5 cm above the slide to accommodate the different physical properties of the sample.
All microscope slides were thoroughly dried on a glass slide hot plate (unless otherwise stated) and then stained with 15 µL of 4 µM (unless otherwise stated) DAPI (Thermo Fisher Scientific, UK) in the dark at room temperature for 10 min. The slides were washed three times in 1 X Phosphate-Buffered Saline (PBS) (Thermo Fisher Scientific, UK) for 5 min in total (unless otherwise stated). A coverslip was then carefully placed over the stained and washed chromosome sample on the glass slide and kept hydrated in 1 X PBS (Figure 1). The same protocol was followed for other DNA stains such as 15 µL of 4 µM Hoechst 33258 (Thermo Fisher Scientific, UK) and 1 drop of NucBlueTM (Hoechst 33342) (Thermo Fisher Scientific, UK) was applied to separate slides.

2.4. FLIM Acquisition and Data Analysis

Prior to the FLIM data acquisition, chromosomes spreads were identified using wide-field epifluorescence microscopy. A Zeiss Z2 Axio Imager equipped with ISIS software (also from Zeiss) was used to scan entire slides at 10× magnification (NA 0.3), allowing the positions of chromosome spreads to be recorded. Higher magnification imaging was also used for assessing individual chromosome quality using a 60× (NA 1.25) oil immersion objective, which was subsequently imaged using confocal microscopy with FLIM acquisition. Confocal FLIM of chromosomes was performed with a high magnification 60× water immersion objective (Nikon, NA 1.27), described below. The confocal-FLIM setup used in this study has been previously described with some slight modifications below [18].
Briefly, single-photon excitation was achieved using a Super K Extreme NKT-SC 390–2000 nm super continuum laser (NKT Photonics, purchased though Photonic Solutions, Edinburgh, UK) (variable repetition rate with 40–60 ps pulse width). The laser repetition rate was reduced to 39 MHz. A SuperK SELECT (NKT, Photonic Solutions, Edinburgh, UK) wavelength selection unit was used to obtain 405 or 410 nm for the excitation. Imaging was conducted on a Nikon Ti-E or Ti2-E microscope equipped with a 60×, NA 1.27 water immersion objective. A Nikon EC2-Si confocal scan head was used to raster-scan the laser and fluorescence was collected through the same objective. Detection was performed using a hybrid photomultiplier tube (HPM100-40, Becker and Hickl, Berlin, Germany), with a 460/60 bandpass filter to block the laser light. A long-pass filter (FEL450 Thorlabs, Ely, UK) was used to eliminate laser scatter.
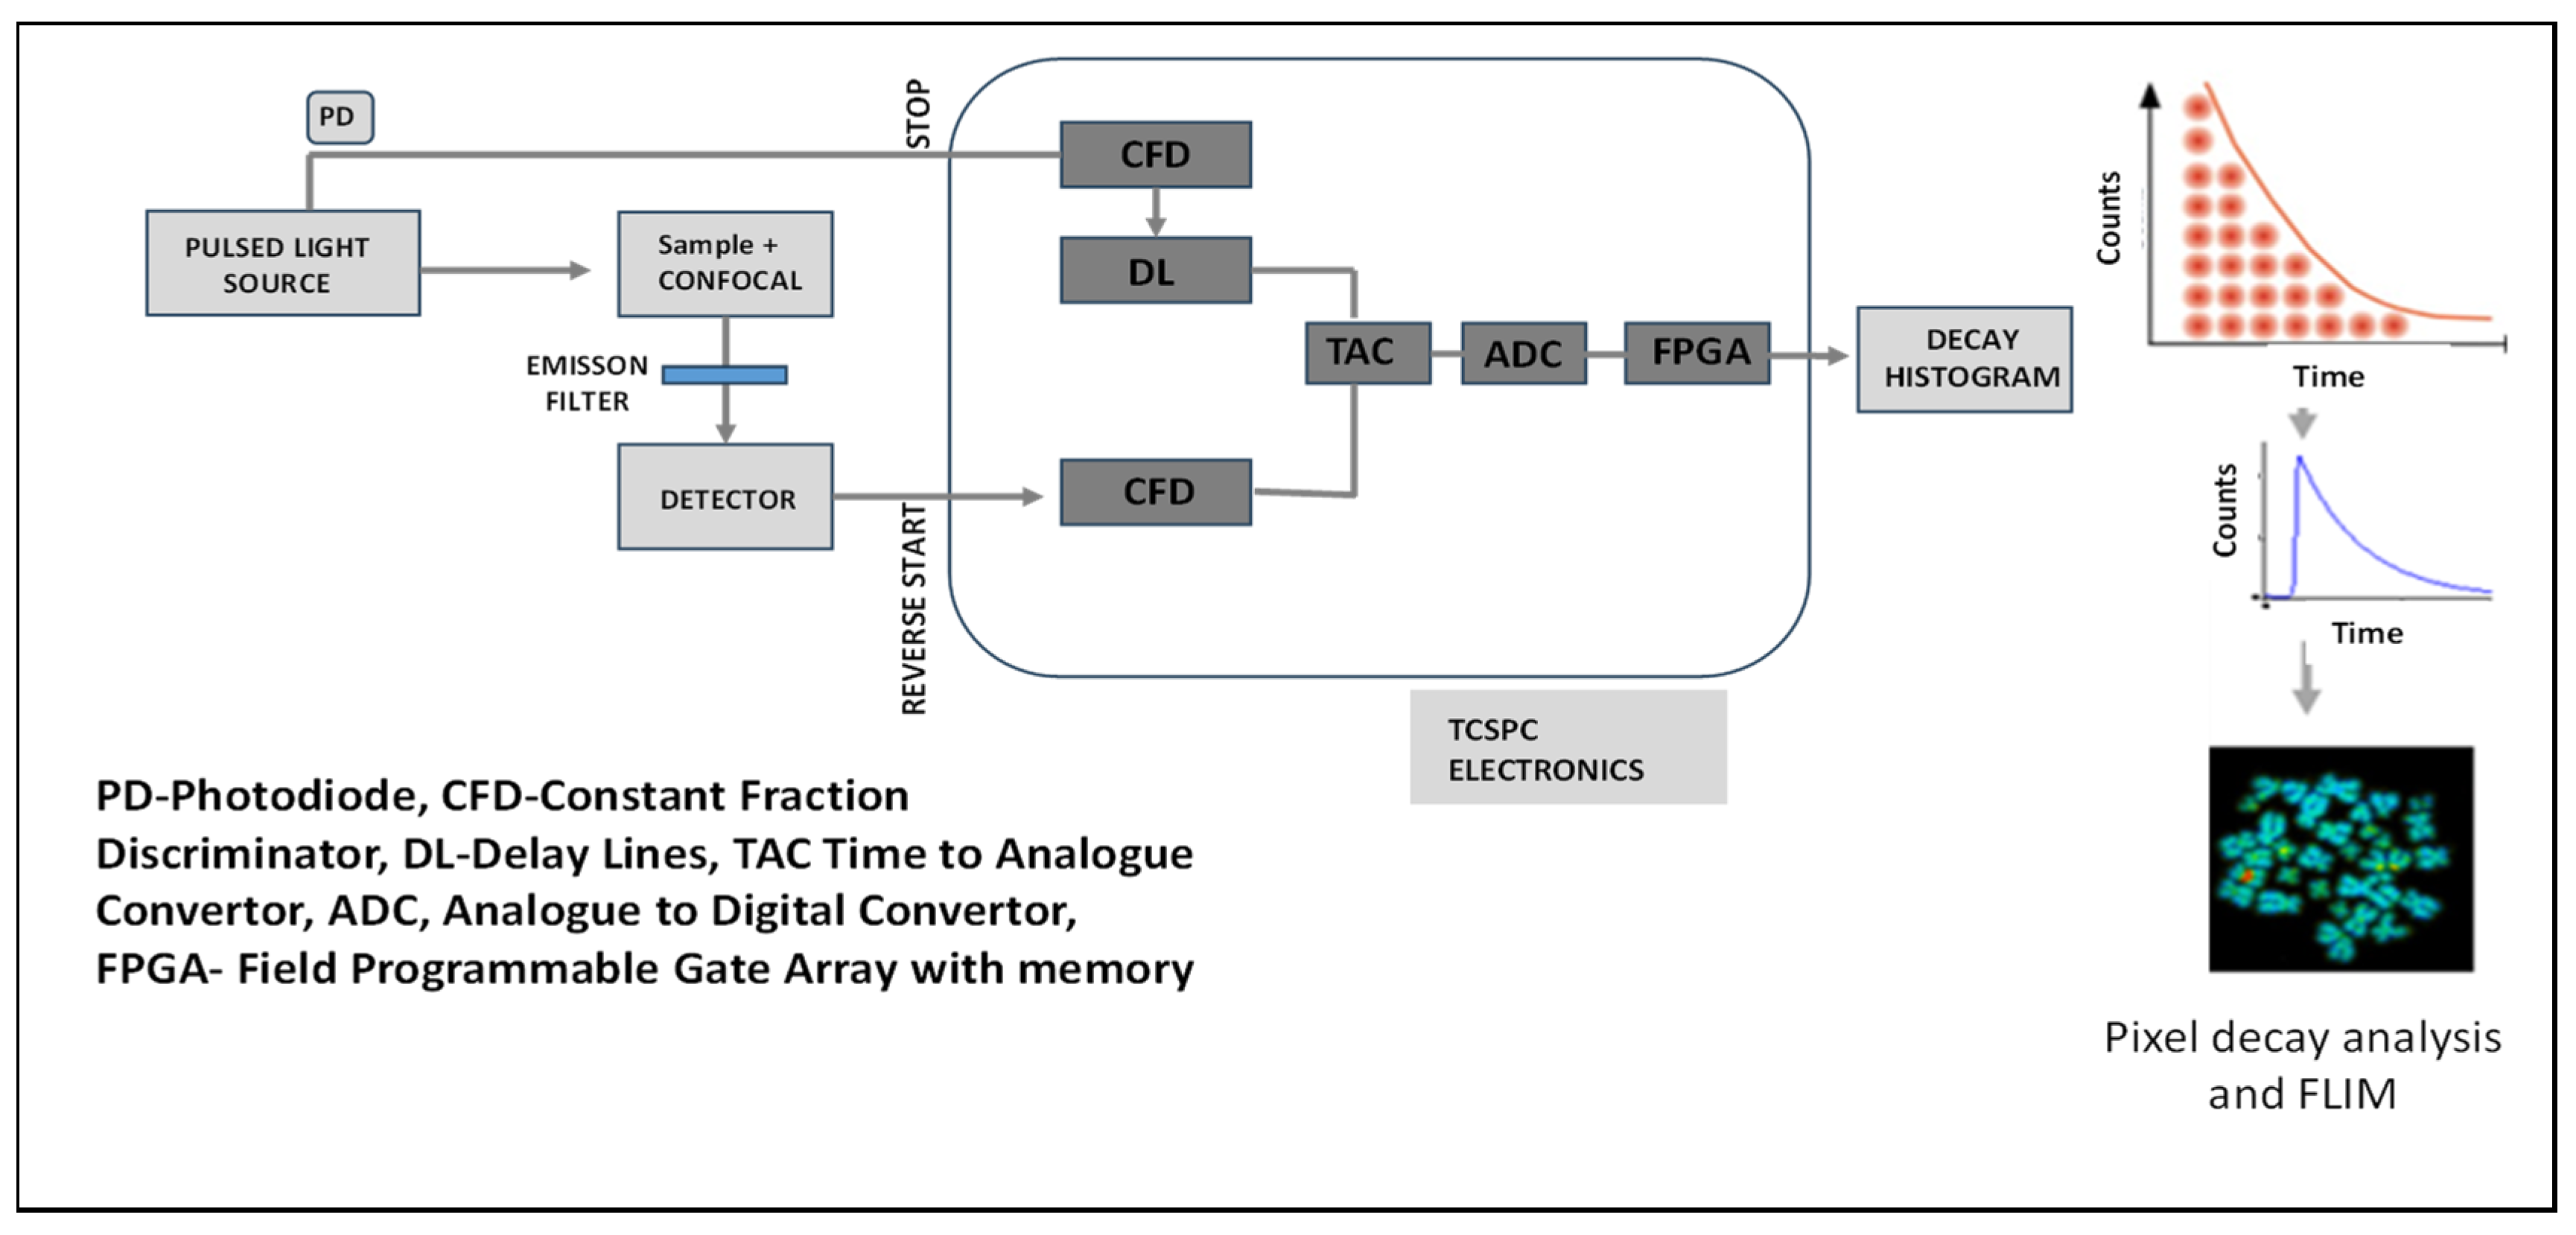
FLIM acquisition was carried out using the same confocal setup, integrated with a Becker and Hickl SPC830 or SPC-QC 104 time-correlated single-photon counting (TCSPC) module, controlled via SPCM software (version 9.0, 64-bit) (Figure 2). The pixel, line and frame clocks from the Nikon EC2-Si were synchronised with the SPC card. The pixel dwell time was 5 μs throughout the FLIM acquisition. Images were acquired at a resolution of 256 × 256 or 512 × 512 pixels using FiFo (first-in first-out) mode, which records individual photon arrival times and spatial coordinates, storing the data on the TCSPC PC card. Before FLIM data acquisition, the instrument response function (IRF) was determined to correct for electronic noise and laser pulse fluctuations. Calibration was performed using fluorophores with well-characterised FLTs, including 1 µM fluorescein, rhodamine B, and 7-hydroxycoumarin carboxylic acid in water. Imaging proceeded only when measured FLTs were within 5% of published values [14].
Following data acquisition, FLIM images were processed using SPCImage software version 8.8 (Becker and Hickl GmbH). The initial step in the analysis involved setting a photon count threshold to exclude pixels with insufficient signal. Typically, pixels with fewer than 25 and 35 photons in the peak channel were discarded, and 2–3× binning was applied, depending on the background signal level, to ensure only pixels with adequate photon counts were analysed using Equation (1). The FLT obtained from fewer than 100 photons per pixel in the initial photon recording (arrival) channel was found to have a large error and deviated from the expected FLT value when standard dyes such as fluorescein and rhodamine were used to calibrate the instrument. Binning next nearest pixels together allowed greater certainty in the FLTs. Photon binning would only reduce the image quality rather than the measured FLT.
I t = i = 1 n a i e x p ( t / τ i ) τ a v e = a i τ i
where I(t) is the photon count or intensity at a specific time, ∑ summed over i to n, τ is the predicted FLT, representing the average time a molecule spends in its excited state before decay to the ground state and α is pre-exponential factor for a single exponential decay. More than one decay component is calculated as contribution of the (i)-th component.
Typically, the threshold, low photon counts, is set to between 25 and 35 for the initial peak channel, with the exact threshold being determined by the level of the background signal. The main aim of this step is only to analyse pixels that have sufficient photon counts above the set threshold using Equation 1. Next, the model for the exponential decay is set based on the decay curve observed, with the majority of FLIM readings requiring ‘multiexponential decay function’ for a FLT using a repetition rate time of 25 ns for the 39 MHz laser. Where an average photon count of 100 is lower than expected for most of the peak pixel count, binning up to 3 times may be applied to increase the photon count for the analysis. We note that the lateral resolution of our confocal system is roughly 300 nm following excitation with 405 nm, and when a medium pinhole is applied. However, this has the effect of reducing the overall resolution of the FLIM image. The data points are fitted to a maximum-likelihood estimation model. The next parameter tested for is the chi-squared value, which needs to be between 0.9 and 1.3, as this is a measure of goodness of fit. Therefore, a Chi-squared value of >1.3 suggests there are multiple FLT components, whereas <0.8 may indicate a poor fit of the data. Both of which indicate that the data requires further and careful interpretation. Perfect data points from FLT determination should provide a Chi square of 1.0. The decay fitting for every pixel in the image generates a mean histogram FLT distribution as well as individual distribution and FLT values for each pixel. A false-colour range may also be generated to allow comparison of different chromosome spreads.
The FLT data was treated as follows: R-studio R version 4.5.1 (2025-06-13 UCRT) was used to perform a Welch two-sample t-test comparing the different datasets obtained, and p-values of less than 0.05 were characterised as a significant difference in means between two samples.

3. Results

3.1. The Effect of Hydration and Drying on DAPI FLT

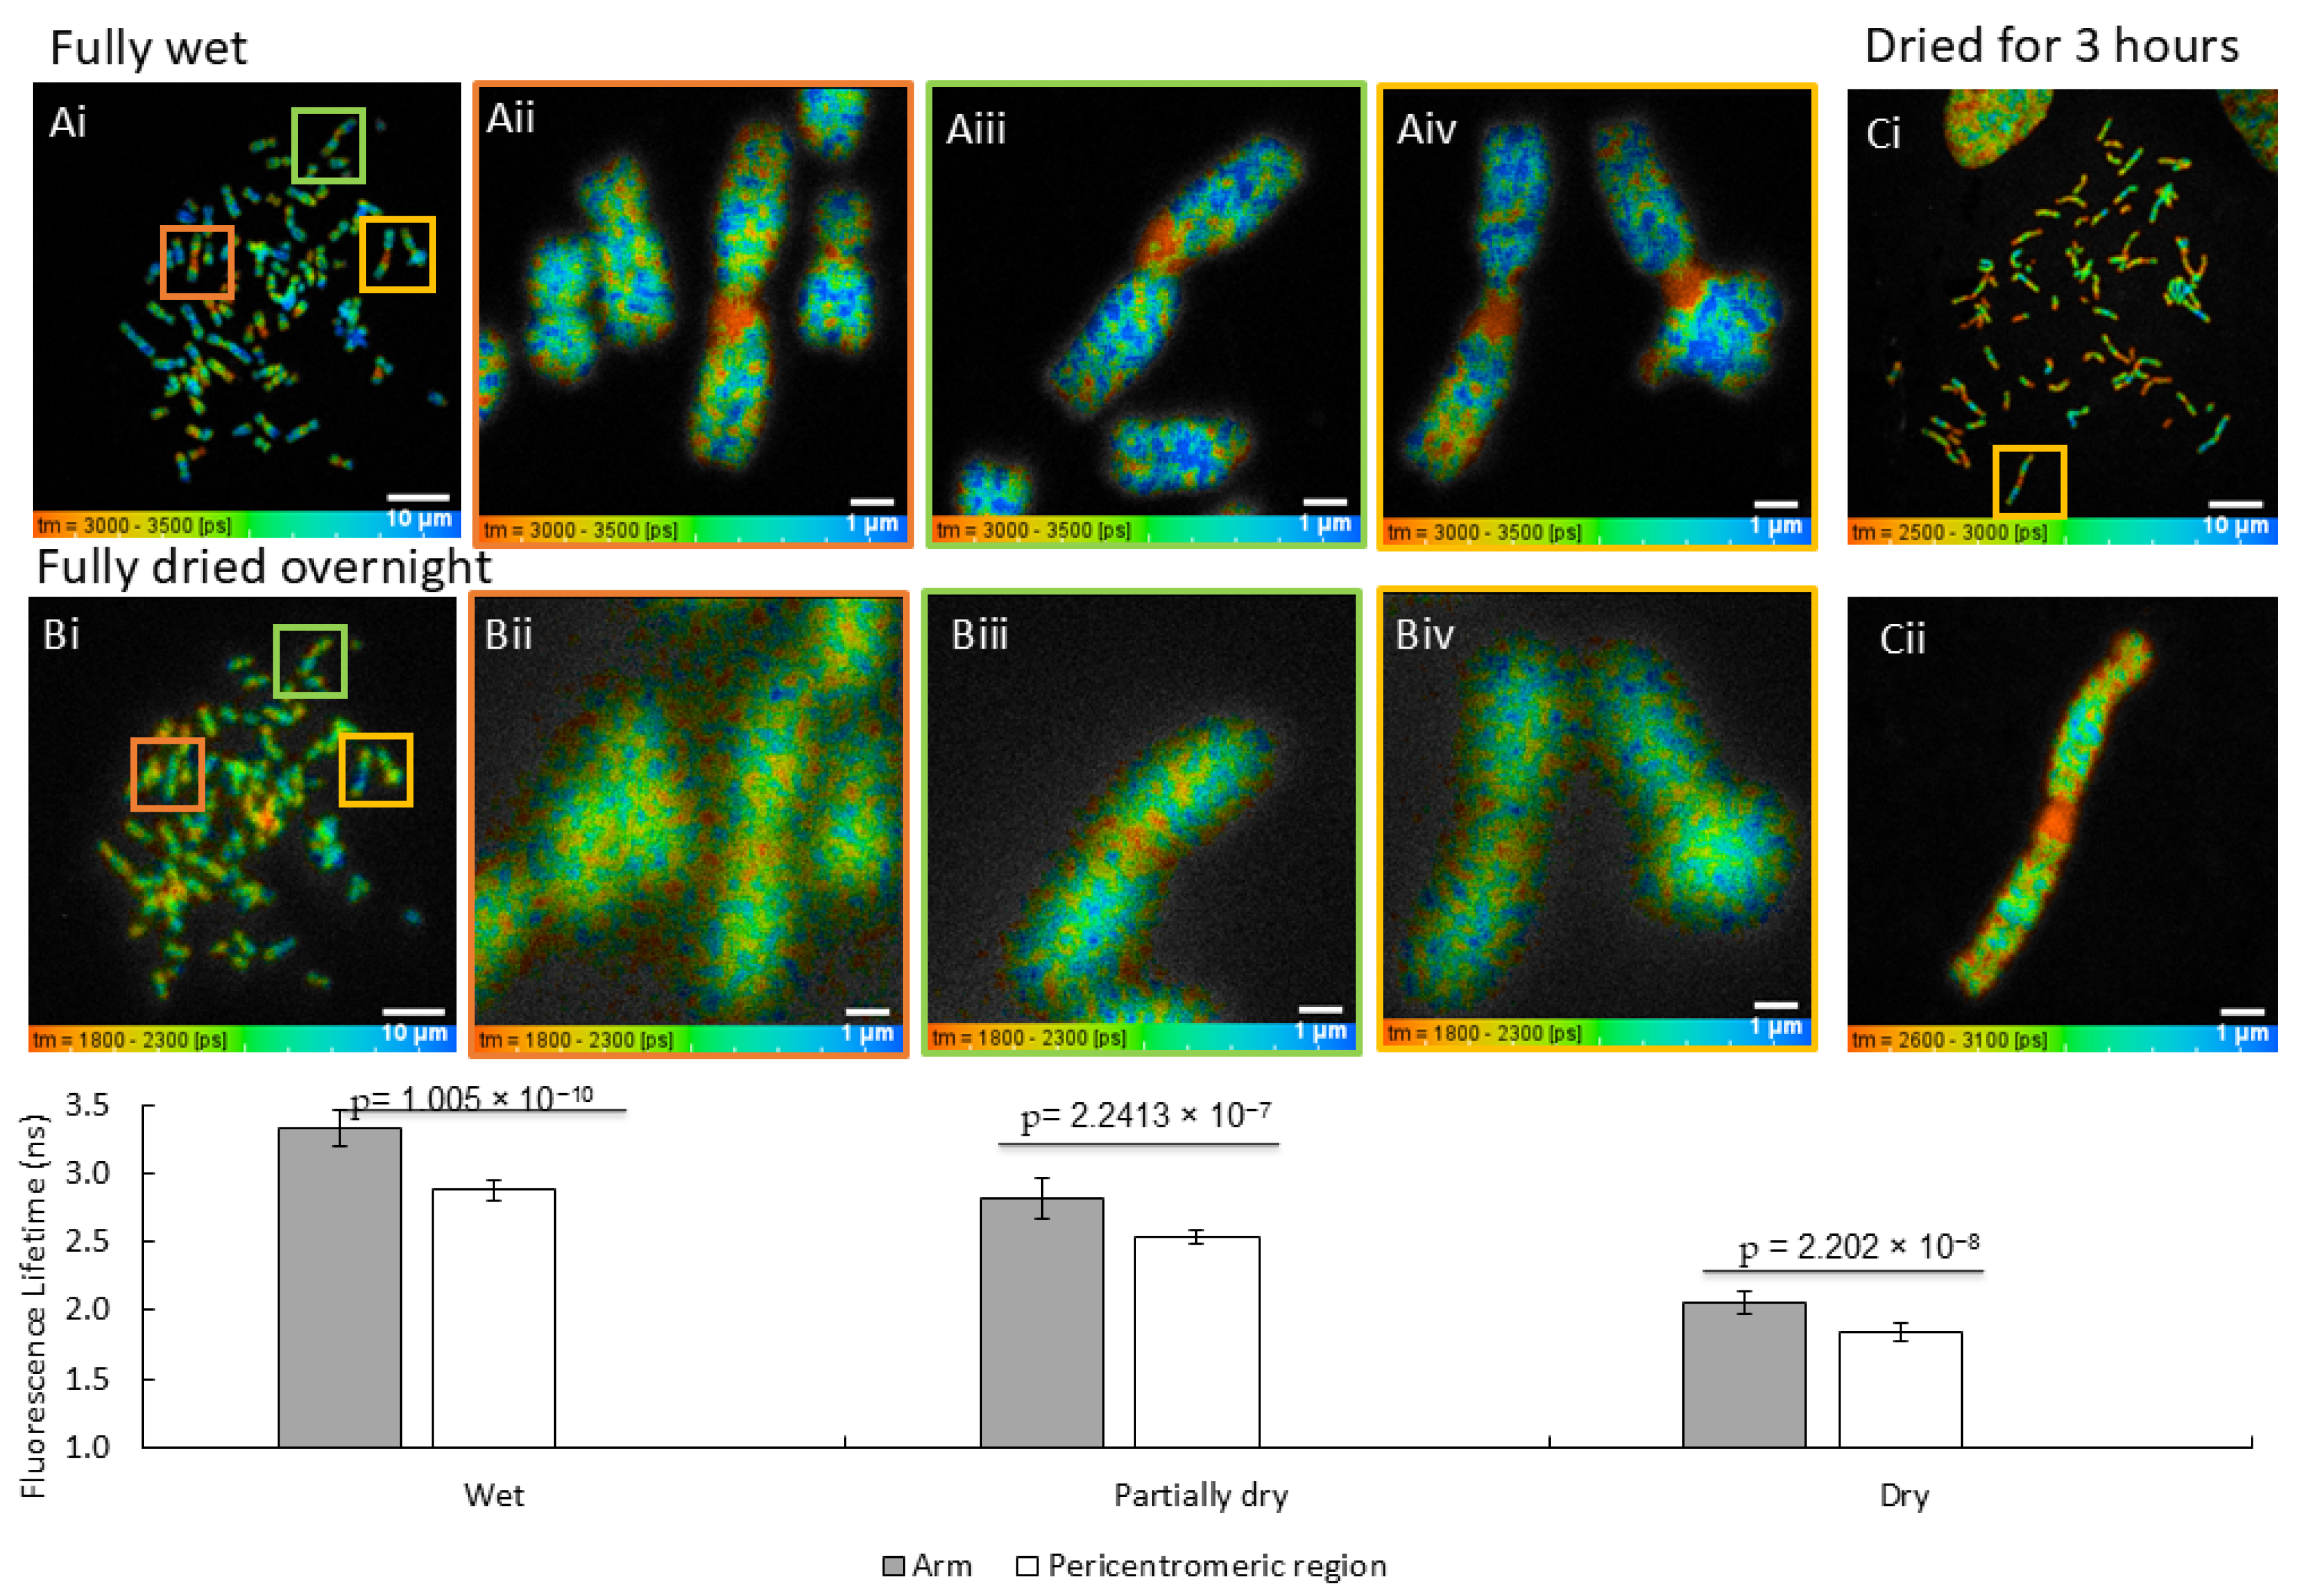
Considering DAPI particularly appears to be an excellent reporter of the DNA tertiary structure, it is important to investigate the factors that may influence the observed FLT changes between the pericentromeric and p, q arm regions. DAPI FLT is also known to be sensitive to water solvation. It is therefore necessary to determine how water (or hydration) affects the chromosomes and reported by DAPI. We initially examined the effects of chromosome hydration on FLT of HeLa chromosomes. The chromosome spread was first imaged while fully hydrated in 1× PBS then left to dry at room temperature overnight to be reimaged the following day. FLTs on chromosome 1 arms and pericentromeric regions of wet and dry states were compared. The pericentromeric and arm regions were manually selected based on morphological identification of the centromeric constricts. From a minimum of three biological experimental repeats and at least ten-pixel selection from each experiment, the wet spread resulted in a significant FLT difference between the arm of 3.33 ± 0.13 ns and the pericentromeric region of 2.88 ± 0.08 ns chromosome 1 with a p-value of 1.005 × 10⁻¹⁰ (Figure 3(Ai–Aiv)). However, the FLT of completely dry slides reduced to 2.05 ± 0.08 ns on the arms and 1.84 ± 0.06 ns on the pericentromeric regions of chromosome 1. Drying reduced the FLT difference between pericentromeric regions and arms with a p-value of 2.202 × 10⁻⁸, in addition to blurrier images (Figure 3(Bi–Biv)). Interestingly, when the chromosomes are only allowed to dry partially for 3 h at room temperature, the FLTs are between the fully wet and dried conditions with 2.82 ± 0.15 ns on the arms and 2.54 ± 0.05 ns on the pericentromeric region of chromosome 1 s. Compared to fully wet and dried conditions the partially dried conditions lead to the least significant difference between pericentromeric and arm FLTs with a p value of 2.2413 × 10⁻⁷.

3.2. Effect of DAPI Concentration on Chromosome FLT

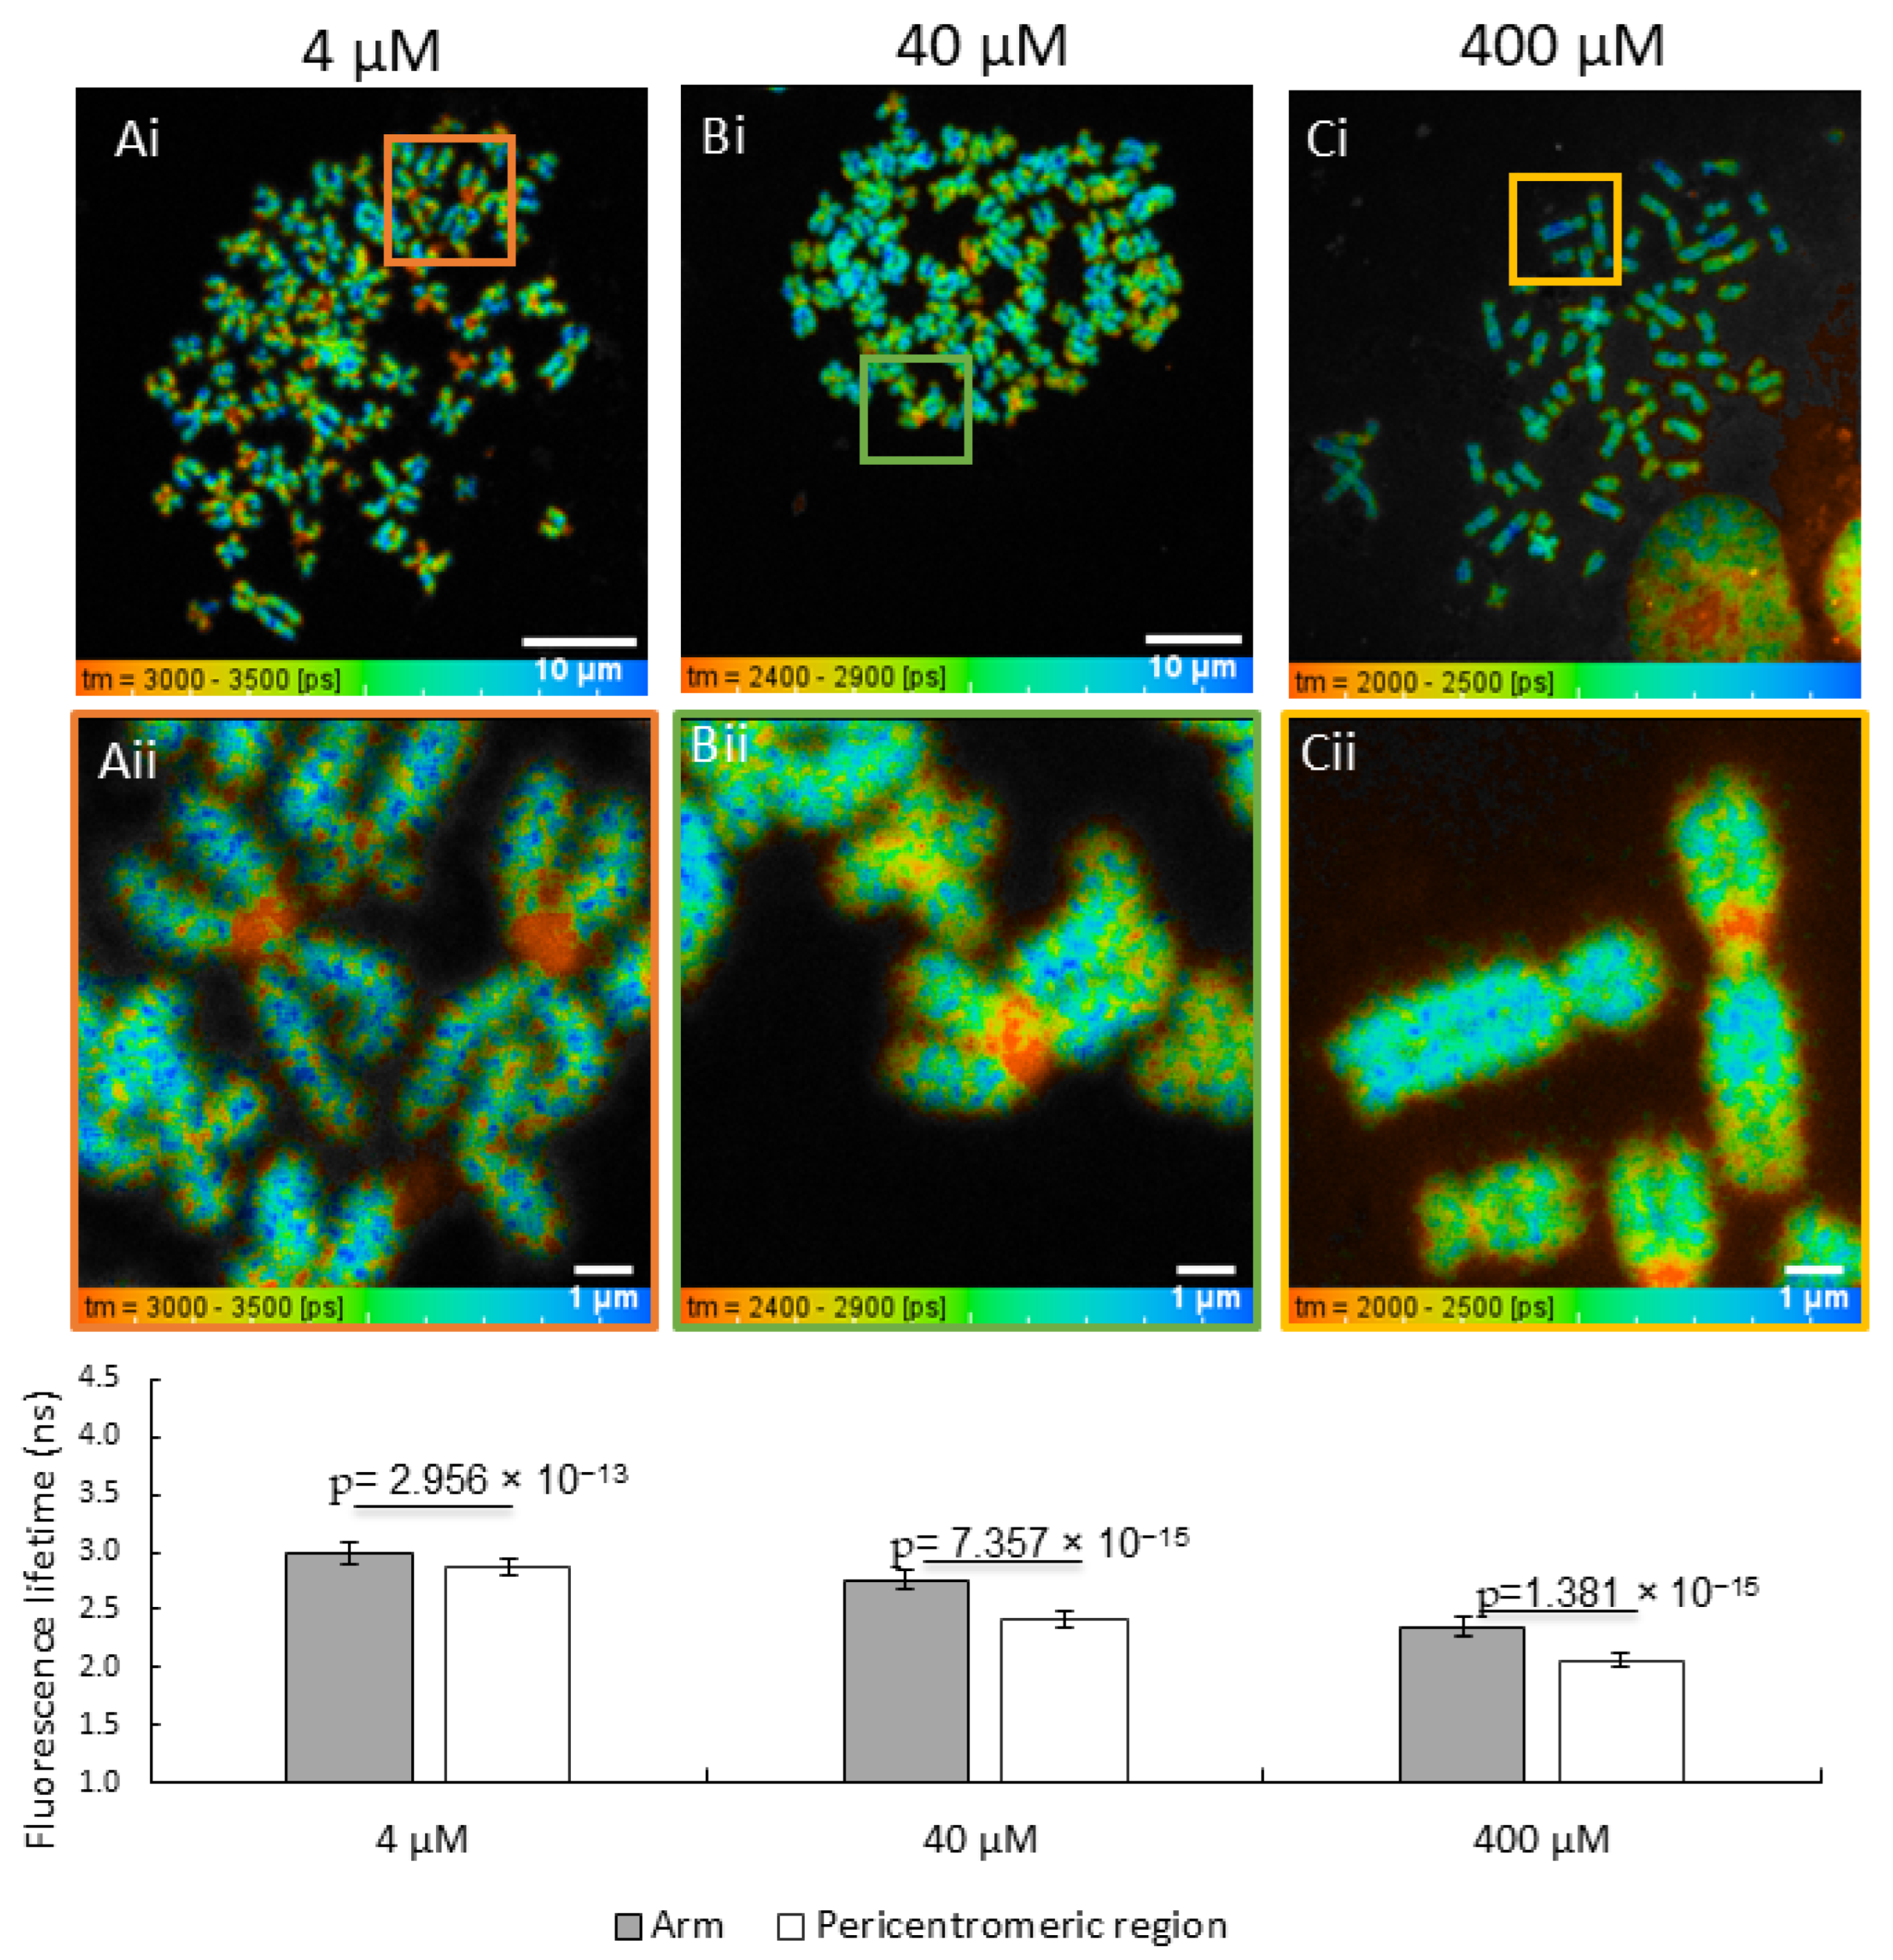
Although the FLT of a fluorescing species is generally not dependent on intensity (increase in photon count as concentration increases) [30], we aimed to determine any concentration effect on the FLT due to possible factors such as self-quenching. Hence, in this section, the effect of DAPI concentration was measured on HeLa chromosomes to determine how the DAPI concentration affects the FLT (under hydrated conditions). The HeLa chromosomes were prepared as described previously and stained with 4 µM, 40 µM and 400 µM of DAPI, followed by FLT measurements as described in Section 3.1. The results are shown in Figure 4, where a reduction in arm and pericentromeric region FLT is seen with increased concentration of DAPI from 4 µM with 3.00 ± 0.15 ns on the arms and 2.64 ± 0.14 ns on the pericentromeric region in Figure 4(Ai, Aii) to 40 µM with 2.76 ± 0.12 ns on the arms and 2.41 ± 0.07 ns on the pericentromeric region in Figure 4(Bi, Bii) and 400 µM DAPI with 2.35 ± 0.09 ns on the arms and 2.07 ± 0.09 ns on the pericentromeric region of chromosome 1’s in Figure 4(Ci,Cii). In all concentrations tested, the difference between arm and pericentromeric FLT of chromosome 1 remains significant, with p- values 2.956 × 10⁻¹³, 7.357 × 10⁻¹⁵ and 1.381 × 10⁻¹⁵ for 4 µM, 40 µM and 400 µM respectively and the difference in FLT between the different concentrations is also significant with a p-value of <2.2 × 10⁻¹⁶ in Figure 4.

3.3. Investigating the Sensitivity of Different Fluorescence Stains for FLIM of Chromosomes

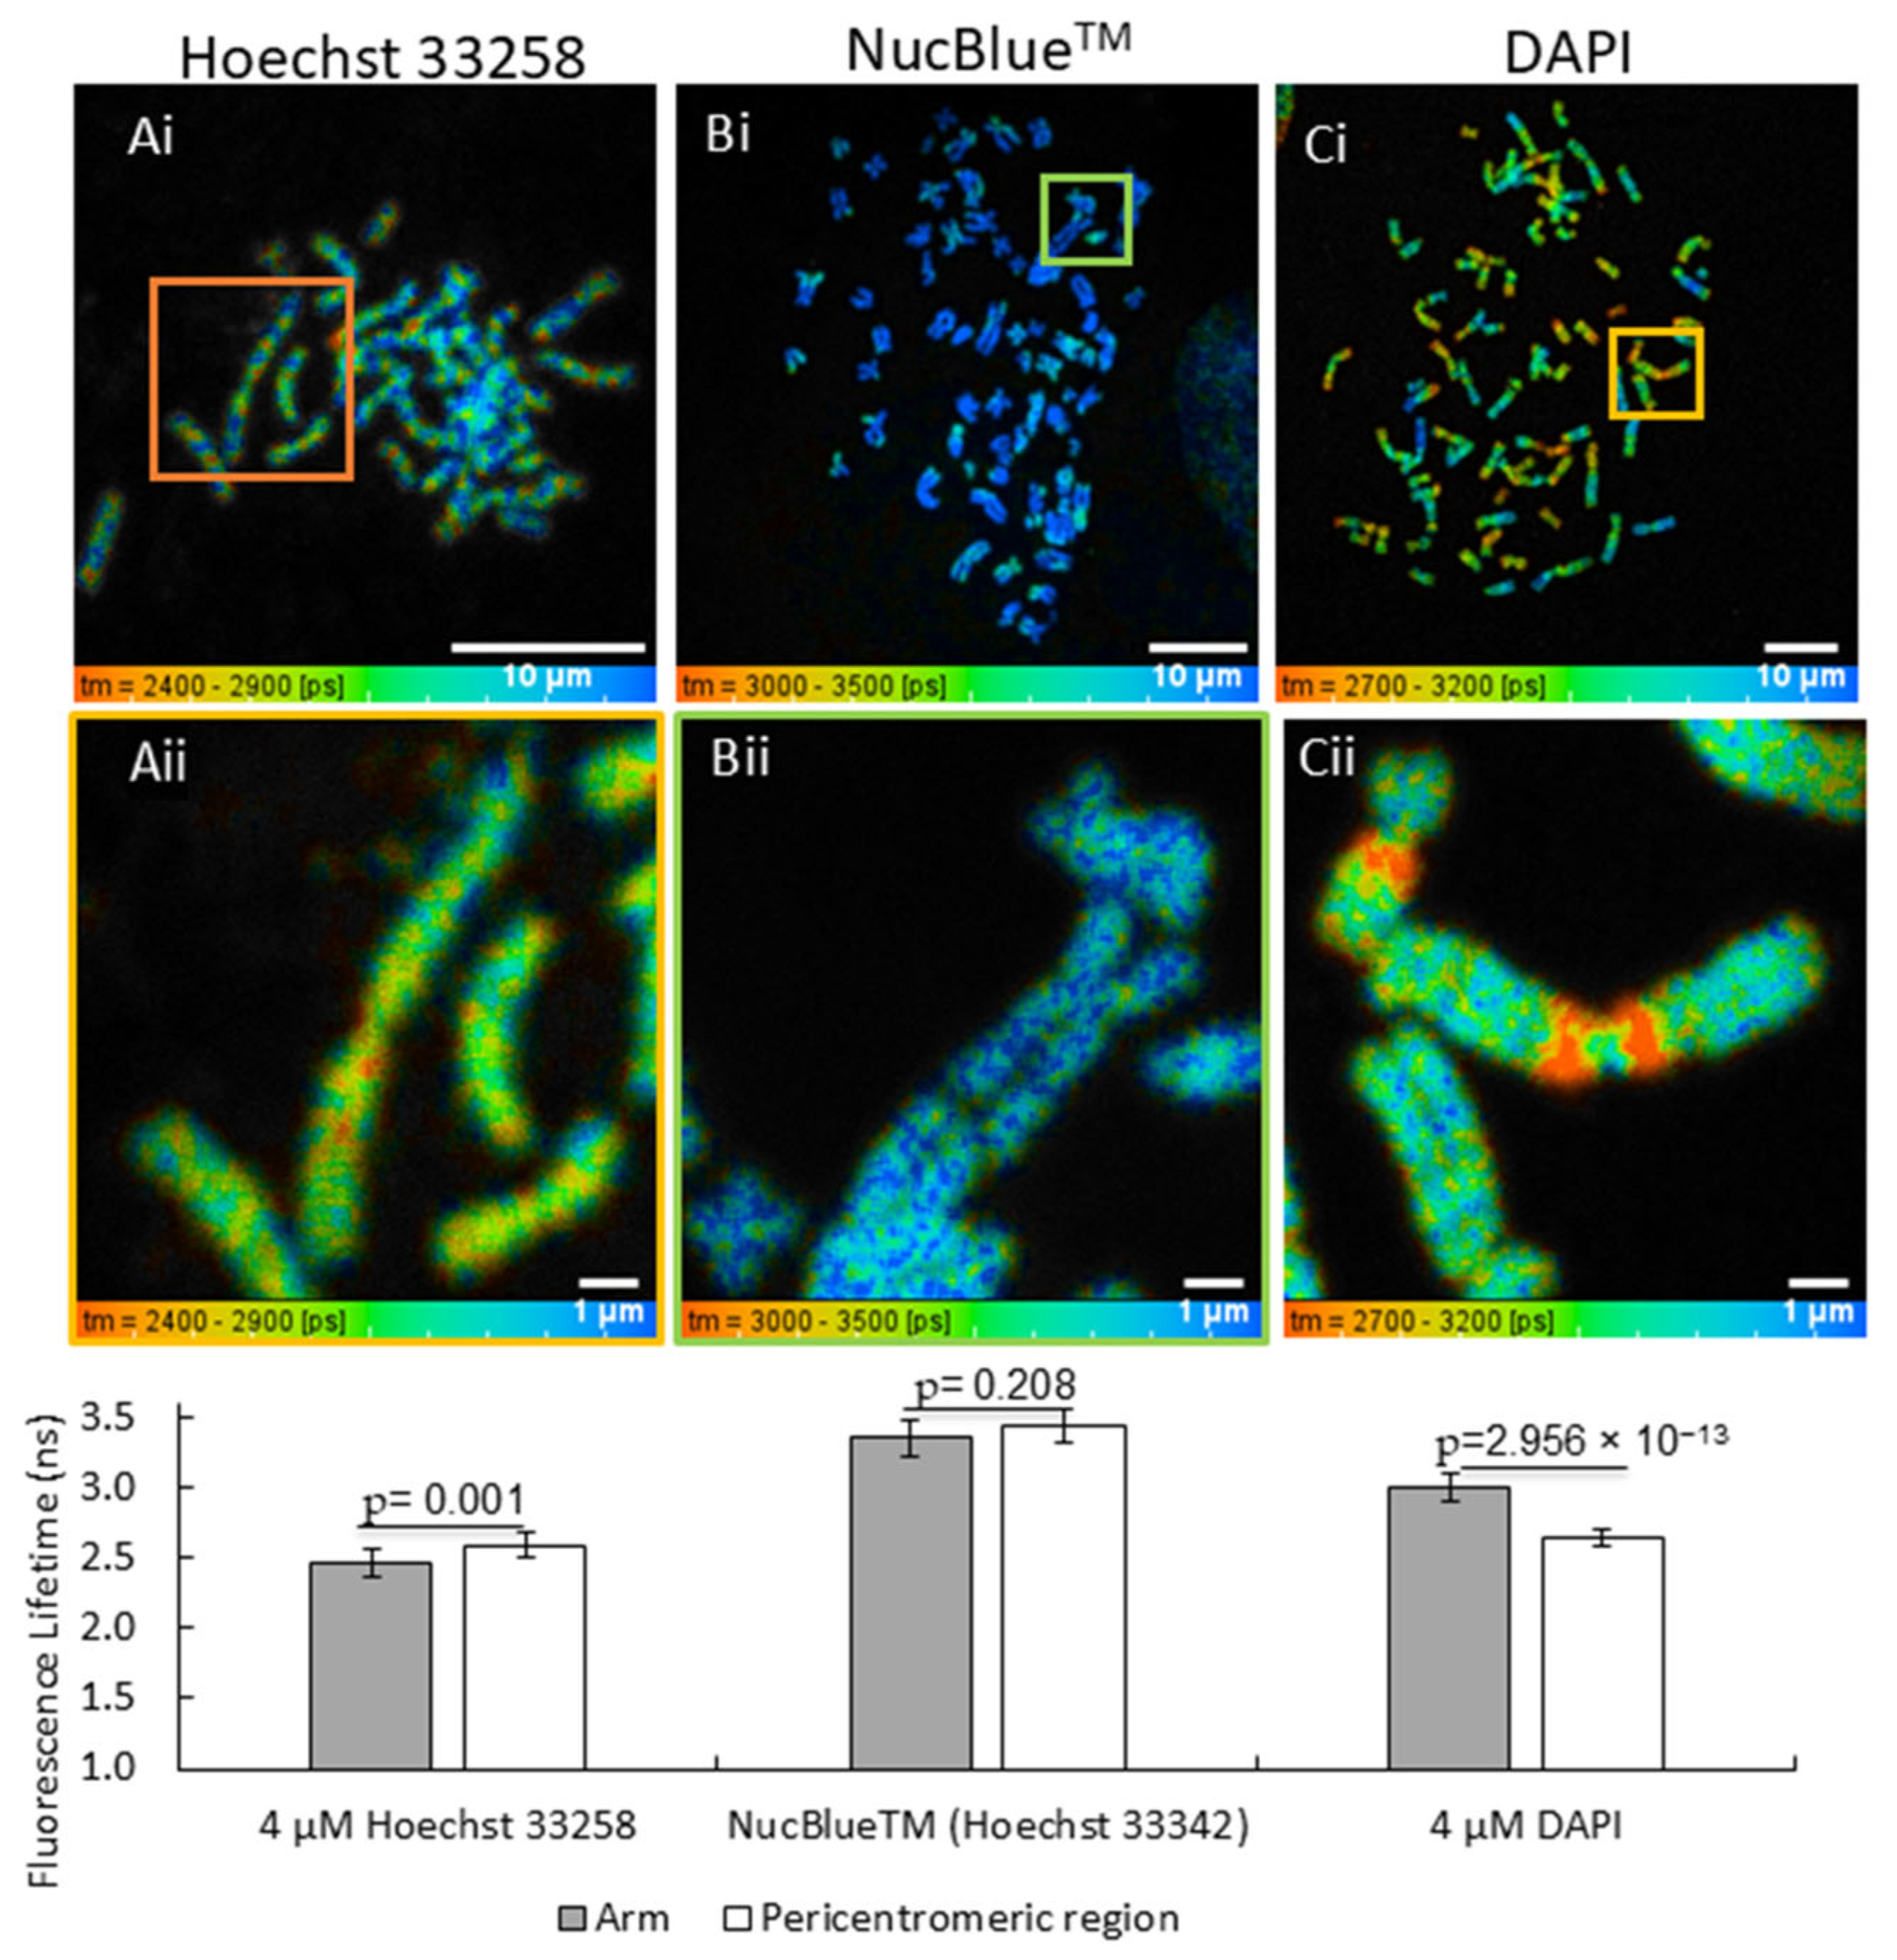
The FLT of three different DNA binding dyes Hoechst 33258, NucBlueTM (Hoechst 33342) and DAPI were compared. We aimed to establish the effectiveness of these DNA stains to determine if there was any improvement in the experimental protocol compared to previously published work [18] where chromosomes were not fully hydrated/not monitored. It was found that 4 µM Hoechst 33258 resulted some FLT difference between the chromosome arms 2.59 ± 0.11 ns and the pericentromeric region 2.45 ± 0.09 ns with a p-value of 0.001, as shown in Figure 5(Aii). Similarly, experiments were performed using one drop of NucBlueTM staining and showed little (not significant) difference between the arm of 3.43 ± 0.17 ns to the pericentromeric region of 3.35 ± 0.17 ns with a p-value of 0.208, as shown in Figure 5(Bii). Changes were found for 4 µM DAPI-stained chromosomes showing a clear arm of 3.00 ± 0.15 ns and a pericentromeric region of 2.64 ± 0.15 ns FLT difference with a p-value of 2.956 × 10⁻¹³, as shown in Figure 5(Cii).

3.4. Ionising Radiation Causes Noticeable FLT Changes in the Pericentromeric and Arm Regions of Chromosomes

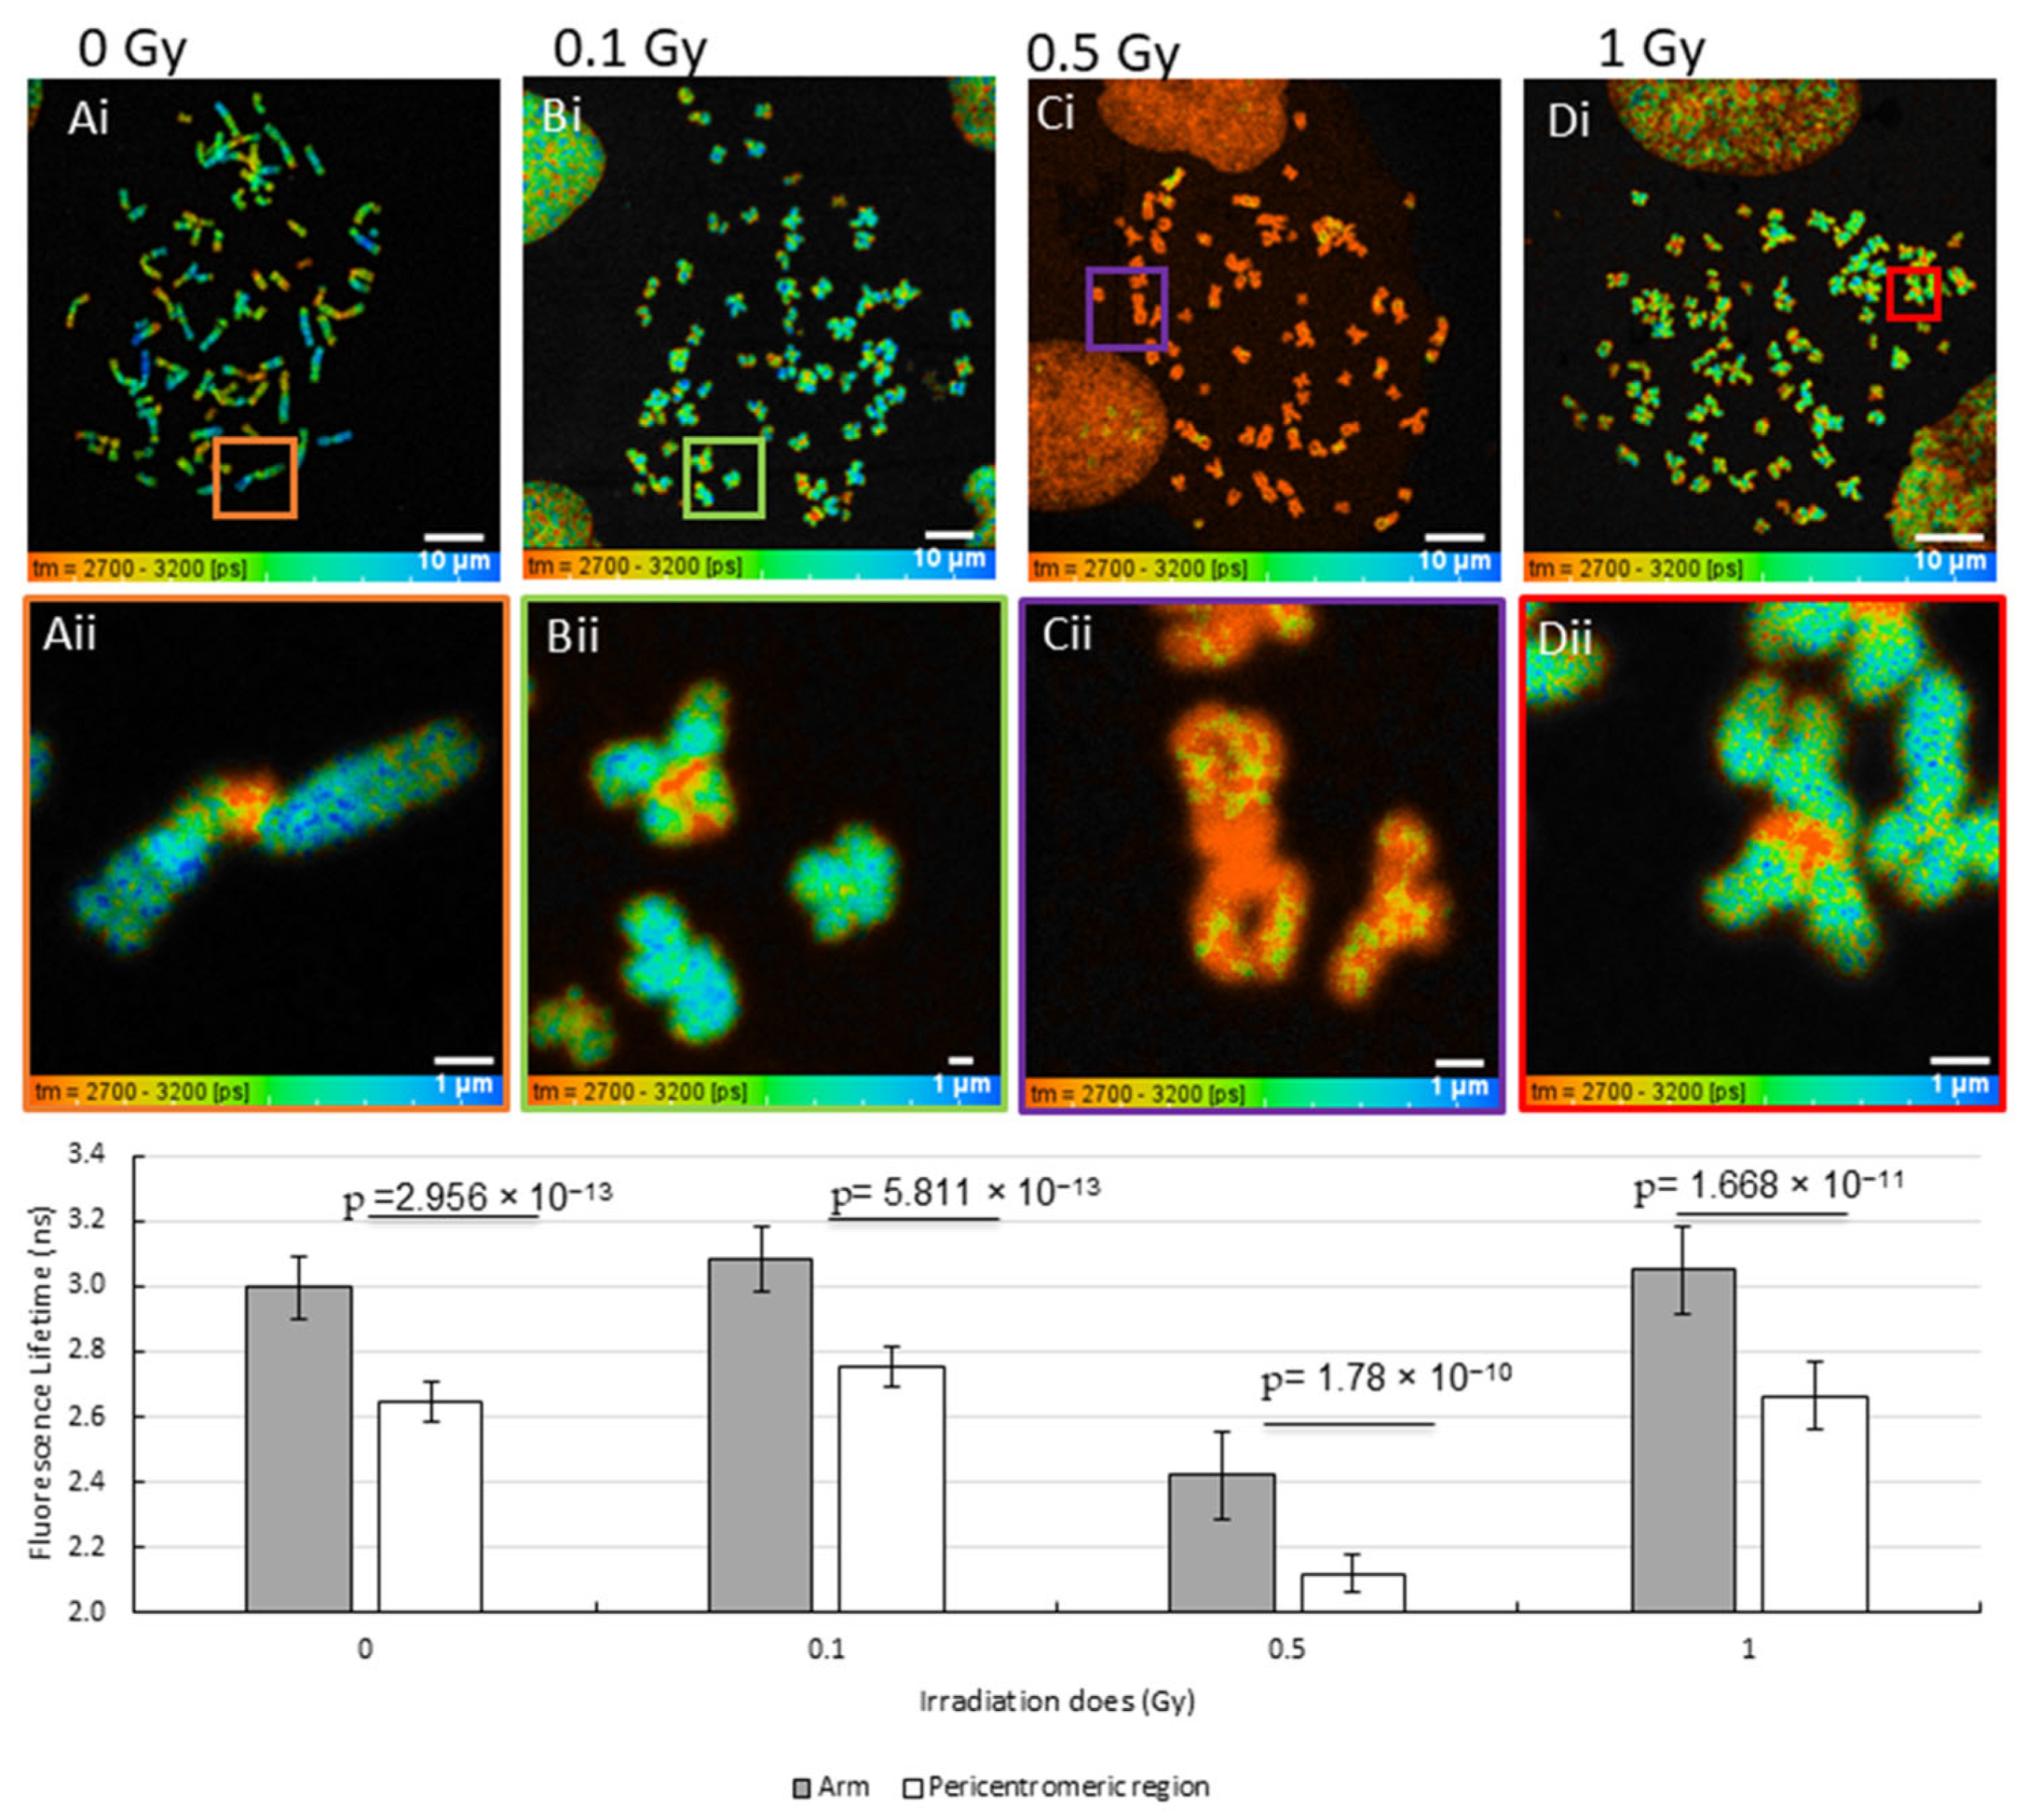
Once the physical parameters were established and the experimental condition optimisation process completed, we proceeded to test the effect of ionising irradiation on chromosomes using FLIM. After irradiating cells with a range of X-ray doses, 0.1, 0.5 and 1 Gy, chromosomes were prepared using the newly improved and optimised protocol as in Section 3.1 [29]. The control sham irradiation, a FLT of 3.00 ± 0.15 ns on the arms and 2.64 ± 0.14 ns on the pericentromeric region of chromosome 1 was measured, with a p-value of 2.956× 10⁻¹³ showing a significant difference between the mean FLTs between two regions (Figure 6A). At 0.1 Gy, both the arm and pericentromeric FLTs were determined to be 3.08 ± 0.10 ns (p-values of 0.0003) and 2.75 ± 0.06 ns (p-values of 0.0002) on the arms and pericentromeric region, respectively (Figure 6B) in line with those measured throughout this work. Interestingly, when irradiation at 0.5 Gy was used, this led to a significant FLT reduction of 2.42 ± 0.13 ns on the arms and 2.12 ± 0.06 ns on the pericentromeric region (Figure 6C). Noteworthy, at 1 Gy, the FLTs was determined to be 3.05 ± 0.13 ns on the arms and 2.67 ± 0.10 ns on the pericentromeric region with p-values of 0.01 on the arms and 0.06 on the pericentromeric region (Figure 6D). This 1 Gy FLT is similar to the FLT measured at 0 Gy. The difference in FLT between arms and pericentromeric region of chromosome 1 was seen in all conditions.

4. Discussion

In this study we established a suitable chromosome sample preparation condition for FLIM by keeping the sample hydrated. This allowed us to optimise the sample and imaging conditions further and to measure chromosome FLT consistently and reproducibly in response to different X-ray irradiation doses. In this paper, we focused specifically on chromosome 1, as it is the largest in the human genome, the easiest to identify, and shows a clear excited state FLT difference between the chromosome arm and pericentromeric region. This was an essential first step due to the very subtle changes in FLT values expected to be a few tens to hundreds of picoseconds. Previous studies have shown pericentromeric regions as universal hotspots of DNA breakage, indicating the need to verify these observations further [31].
A reduced DAPI FLT when bound to DNA was measured in the dried environment. FLIM measurements are sensitive to a fluorophore’s environment. Previously, FLT of red emitting dyes has been found to be responsive to the presence or absence of water. However, in red emitting dyes FLTs have been found to increase in response to drying [32]. Further experiments need to be done to confirm this opposite trend that we have found in blue emitting dyes such as DAPI that exhibit shorter FLTs in dry environments compared to when hydrated in water or whether this may be due to chromosomal structural changes itself, as the presence of water encourages chromosomal swelling [33].
The FLTs of chromosomes measured when fully hydrated in water or 1X PBS are supported by [34], who found that pure water interacts with MAA and leads to chromosome structural changes. Moreover, 1X PBS is commonly used as a buffer for washing and maintaining samples and has also been used previously for hydrating MAA chromosomes during imaging [18,19]. Together, this highlights the importance of using 1X PBS for hydrating and washing chromosomes instead of using pure water (Figure A1). The ions present in PBS, such as Na+ and K+, are essential in maintaining a correct DNA structure compared with water alone, as shown by [35] who measured an increased DNA stability in salt concentrations of ~0.5–1 M, leading to an increased melting temperature. Instead, a clear destabilisation can be measured when salt concentration exceeds this range due to overcharging of the DNA as cations such as Na+ and K+ increase DNA twisting and thus affect DNA structure [35,36,37]. In the context of chromosomes specifically, Na+ and K+ have been shown to lead to DNA decondensation due to the interaction between the negatively charged chromatin and the positively charged cations, leading to osmotic pressure which results in water taken up by the chromosomes, leading to chromosomal swelling [33].
The deterioration in image quality (of the dry sample) is not surprising since the high numerical aperture (>1) microscope objectives require an immersion medium such as water, oil or glycerol. The sample, therefore, needs to match this media refractive index. In our experiments, we have used a 60× water, NA 1.27 microscope objective. The imaging microscope objective is matched to water–glass–water light transfer. It is worth noting that blurring of images does not affect the FLT measurements. Hence the reduction in the dry sample is a clear indication of chromosome structural changes reported by DAPI in DNA and excited state sensitivities. The photon counts will also be reduced since the refractive index of the sample and objective immersion (as well as the NA or angle of light collection from the sample by the objective) is reduced. However, the reduced photon count does not affect the recorded and calculated excited state FLT. It should be emphasised that where anisotropy is determined, high NA microscope objectives are likely to have a noticeable effect. The acquisition of good FLIM images relies on the level of photon count during the imaging process. Low photon counts require long acquisition times or higher than ideal laser powers, which may lead to sample photo-bleaching and damage. We report that one source of low photon counts may be due to dry chromosome samples on the glass slide.
Therefore, in our experiments, we kept the slides hydrated by placing a drop of 1X PBS against the edge of the coverslip and allowing it to spread underneath until the entire surface area is covered (Figure 3). It is worth noting that this reduction in FLT (between wet and dry samples) is not a consequence of the microscope NA but rather an indication of the chromosome preparation quality and structural characteristics that are missing from the dried chromosome. This suggests that dried chromosomal DNA is somewhat different to that of a fully hydrated one and reported by the time-resolved measurement. The reduced FLT effect is generally ameliorated by rehydrating the sample. We also checked and noted the effect of FLT of DAPI during MAA fixation drying (a critical step in chromosome preparation) (Figure A2) that gave a FLT reduction. This may be explained by considering the chemical properties of DAPI, which has two amidine functional groups, and both can be involved in an alcohol and acid’s reaction [38]. It is assumed that DAPI would react with the remaining MAA fixation solution, and as a result, its fluorescent properties may change. Overall, our data indicates that FLT can be an alternative method to determine the quality of chromosome preparation via FLIM. This is particularly important to ensure that any difference in FLT is reproducible and not influenced by large variations in sample preparation.
Once we established a reliable and reproducible method for FLIM of chromosomes (keeping the sample constantly hydrated), we then measured the FLT of 3 different DAPI concentrations (4 µM, 40 µM, and 400 µM). Concentration effects on the FLT may include self-quenching-induced lifetime changes. The use of DAPI-stained chromosomes for FLIM has begun to gain interest although there are few reports so far [18,19]. However, the hydration effect during imaging was not considered by these earlier studies. Previous measurements similar to the work here, obtained an average FLT of chromosome 1 s derived from GM18507 cells and showed no significant variations in DAPI FLT in response to concentration increase (0.4 µM, 4 µM, 40 µM, and 400 µM) [18]. In this study, we enhanced our imaging by further measuring FLT on both the pericentromeric region of chromosome 1 and its arm for the 3 different DAPI concentrations (4 µM, 40 µM, and 400 µM). However, we observed a significant reduction in DAPI FLT at 400 µM (Figure 4). We speculate this may be due to aspects of the following reasons: (i) that DAPI self-quenching may be occurring, leading to the reduction in FLT as the concentration increases; (ii) DAPI binds at a higher affinity to the pericentromeric region of chromosome 1 compared to its arms, leading to the reduced DAPI FLT on the pericentromeric region compared to the arms; and (iii) this may be due to the probe-DNA binding characteristics such as disruption of induced fit at the higher concentrations or sample preparation conditions (hydration vs. no hydration).
We further validated our hydrated chromosome FLIM protocol by investigating the FLT of three different dyes, Hoechst 33258, DAPI and NucBlueTM (Hoechst 33342) that all bind to the minor groove of DNA and favour AT-rich regions [39,40]. A further motivation for selecting these dyes was mainly due to the greater cell permeability by Hoechst [41,42]; thus it is used mostly for live cell imaging. NucBlueTM labels the DNA in live cells faster than Hoechst 33258 and DAPI and has an excellent cell permeability. DAPI has been shown to give a strong difference in FLT between the pericentromeric region and the arms of chromosome 1 but gave a shorter FLT on chromosome 1 than the FLT measured in this study [18]. Hoechst 33258 has previously shown some FLT difference between arm and pericentromeric regions of chromosome 1 [18] which we can confirm in this study. However, whilst Hoechst 33258 was able to differentiate the arm and pericentromeric regions with a significant value, the difference in FLT between pericentromeric region and arms is less than that of DAPI. NucBlueTM was unable to provide much information on chromosome structure and environment since there were no significant changes in the FLT values between the pericentromeric region and arms of chromosome 1, unlike with DAPI (Figure 5). Overall, our study suggests that DAPI is a better chromosome stain to use for detecting FLT changes in chromosomes than Hoechst 33258 and NucBlueTM under hydrated conditions.
Finally, we measured FLT of metaphase chromosomes in response to X-ray irradiation of live cells (Figure 6). The reason for the significant change in FLTs, both at the arms and pericentromeric regions measured for 0.5 Gy, is unknown. Previous work [7] reported an X-ray Ptychography study that after irradiating T-cells with different X-ray doses (0.1, 0.5 and 1 Gy), the total mass of chromosomes at 0.1 Gy and 1 Gy was increased compared to the total mass of chromosomes at 0.5 Gy and was also reduced compared to 0 Gy (control). It is suggested that fewer proteins may be present on the chromosomes after the irradiation dose of 0.5 Gy. At 0.1 Gy and 1 Gy, proteins involved in the DNA damage response could be recruited to the chromosome DNA damage sites, thus increasing the total chromosome mass compared to no irradiation. The recruitment of these proteins to the irradiated chromosomes may also be reflected in the FLT values in this study following irradiation of HeLa and T-cell chromosomes (Figure 6), which show a FLT reduction at 0.5 Gy and a slight FLT change with significant p-values at 0.1 Gy and 1 Gy compared to the non-irradiated cell chromosome on both the pericentromeric and arm regions of chromosome 1. The clearest reduction in FLT at 0.5 Gy can be found when the chromosomes are prepared, maintained and imaged with the newly established improved protocol keeping the coverslip hydrated (Figure A3A). Hence, our work suggests a need to continuously monitor the mounting procedure throughout imaging, with coverslip hydration representing one of the first factors to check where unexpected FLTs are found.
The difference in FLTs in irradiated chromosomes may provide insight into the chromosomal structural changes, such as compaction status. Recruitment of the DNA damage repair protein to the DNA-damaged sites could alter chromosome compaction as both DNA condensation and decondensation are part of the DNA damage-and-repair response pathway [43]. Additionally, it has been demonstrated that when exposing Human Umbilical Vein Endothelial Cells to 0.125 Gy, 0.25 Gy or 0.5 Gy X-ray irradiation, only at 0.5 Gy an increase in γ-H2AX foci occurred. An indication for DNA double-stranded breaks can be observed compared to the sham non-irradiated cells [44]. The studies above could explain the clear FLT response measured in HeLa and T-cells at 0.5 Gy compared to 0.1 Gy. However, the reason why the FLT of 1 Gy-irradiated chromosomes is similar to that of the non-irradiated chromosomes remains unknown and needs further investigation.
While it is unclear why there is an increased sensitivity at 0.5 Gy for live cell irradiation, it is interesting to note that we observe a difference in the FLT of the pericentromeric heterochromatin region at doses below 1 Gy. We therefore speculate that there may be a link between the hypersensitivity previously observed and what we observe in this study. Indeed, radiotherapy irradiations with 0.5 Gy fractions have been suggested as a more effective way of providing radiotherapy ultrafractionation [26]. Further research is need to establish the nature of the change in lifetime following X-ray irradiation between 0.1 and 0.5 Gy since it is still inconclusive.

5. Conclusions

The importance of sample preparation in chromosome research is vital for medical, cellular and chromosome structural research. Here, we aimed to critically investigate and highlight experimental factors that influence the current chromosome preparation and imaging protocol, as well as a novel ionising radiation effect on the human pericentromeric region. We identified a number of optimisation procedures and applied them to human cell lines, focusing primarily on the following steps: fixation process, hydration, staining with DNA-binding probes, washing and imaging conditions. Although this study specifically focuses on the optimisation of chromosome sample preparation for the use in FLIM, this, in turn, informs on the quality of the chromosomes prepared. Using the FLIM technique together with the optimised process, we show that imaging of prepared chromosome slides should be ideally imaged immediately after staining, whilst the sample should be hydrated throughout the duration of imaging. Moreover, DAPI was found to be a more sensitive probe for FLIM for chromosome study than Hoechst and its derivatives. The technique improvements identified allowed determination of changes in chromosomes and the heterochromatin-rich pericentromeric region following ionising radiation, thus opening a new research direction for this difficult-to-study chromosome compaction and structure area. We showed that irradiating live cells with 0.5 Gy X-ray dose resulted in a change in the FLT at the pericentromeric region of chromosome 1, potentially indicating a damage-dependent chromosome compaction at this dose.
In this study, DAPI showed the largest difference (around 0.33 ns) between the pericentromeric region and arm of specific chromosomes, such as chromosome 1 in FLT of the stains investigated, suggesting that it might also be the most sensitive to other changes in the micro- and nano-environment for future work involving chromosome imaging. It would be interesting to explore other pericentric heterochromatin-rich chromosomes such as chromosome 9, 15, 16 and Y and apply Muliticolor Fluorescence In Situ Hybridization (MFISH) assay for chromosome identification. Other DNA stains could be explored in order to improve FLT sensitivity further. New phosphorescence-emitting DNA probes are emerging. Such probes may allow hundreds of nanoseconds to microseconds sensitivity in future studies. Moreover, in the future it would be interesting to explore the FLT of chromosomes after exposure of cells to other DNA-damaging agents, i.e., non-ionising radiation sources such as UV and environmental chemicals.
While this study focused on the impact of the optimisations described above on FLIM, many of the optimisation parameters explored have potential for other microscopy techniques such as epifluorescence, confocal, super resolution, transmission electron microscopy and Ptychography. The latter two, with a resolution of ~10 nm, demand careful and excellent chromosome preparation techniques to determine the true structure.


Supplementary Materials

The following supporting information can be downloaded at https://www.mdpi.com/article/10.3390/dna6020026/s1, Figure S1: Wet chromosomes shows longer lifetime to dried preparation; Figure S2: FLT comparisons between chromosomes stained with different DAPI concentrations show clear difference between arm and pericentromeric region; Figure S3: FLT comparisons between chromosomes stained with different DAPI concentrations.

Author Contributions

Conceptualisation: S.W.B. and M.Y.; Methodology: S.L.B., R.P., R.S., S.B., A.B., B.B., S.W.B. and M.Y.; Validation: S.L.B., R.S., A.B., S.W.B. and M.Y.; Formal analysis: S.L.B., R.S., A.B., S.W.B. and M.Y.; Investigation: S.W.B., I.K.R. and M.Y.; Data curation: S.L.B., R.S., A.B., S.W.B. and M.Y.; Writing—original draft preparation: S.W.B., R.S.; Writing—second draft: S.L.B., S.W.B. and M.Y.; Writing—review and editing: S.L.B., R.P., R.S., A.B., S.W.B. and M.Y.; Visualisation: S.L.B., R.P., R.S., A.B., S.W.B. and M.Y.; Supervision: S.W.B., I.K.R. and M.Y.; Project administration: S.W.B. and M.Y.; Funding acquisition: S.W.B., I.K.R. and M.Y. All authors have read and agreed to the published version of the manuscript.

Funding

This work is supported by UKRI- STFC, funding access to the Central Laser Facility (SWB IM research). This work was also supported by BBSRC grant BB/H022597/1. The Rosalind Franklin Institute is funded by the UK Research and Innovation, Engineering and Physical Sciences Research Council.

Institutional Review Board Statement

Human T-cells, a primary cell line, were extracted from an anonymised healthy female blood donor (provided by Dr. Sylwia Kabacik, UK Health and Security Agency as per local ethical approval from West Midlands-Solihull Research Ethics Committee (REC 14/WM/1182, 31 January 2023)).

Informed Consent Statement

Informed consent was obtained from all subjects involved in the study.

Data Availability Statement

The raw data supporting this paper are openly available from the corresponding author and also at STFC’s eData repository at https://doi.org/10.5286/edata/959 and https://doi.org/10.5286/edata/962.

Acknowledgments

We are grateful to Sylwia Kabacik, who performed the T-cell extraction and some of the X-ray irradiations. Rob Lees is also thanked for providing helpful comments on the manuscript. The Rosalind Franklin Institute is funded by the UK Research and Innovation, Engineering and Physical Sciences Research Council. The Rosalind Franklin Institute is funded by the UK Research and Innovation, Engineering and Physical Sciences Research Council. The authors have reviewed and edited the output and take full responsibility for the content of this publication.

Conflicts of Interest

The authors declare no conflicts of interest.

Abbreviations

DAPI4′,6-diamidino-2-phenylindole
DMEMDulbecco’s Modified Eagle Medium
FBSFoetal Bovine Serum
FLIMFluorescence Lifetime Imaging Microscopy
FLTFluorescence Lifetime
HBSSHank’s Balanced Salt Solution
HeLaHenrietta Lacks
KClPotassium Chloride
MAAMethanol Acetic Acid
MFISHMulticolour Fluorescence In Situ Hybridization
PBSPhosphate-Buffered Saline
RPMIRoswell Park Memorial Institute
TCSPCTime-Correlated Single-Photon Counting
UKHSAUK Health Security Agency

Appendix A

Appendix A.1

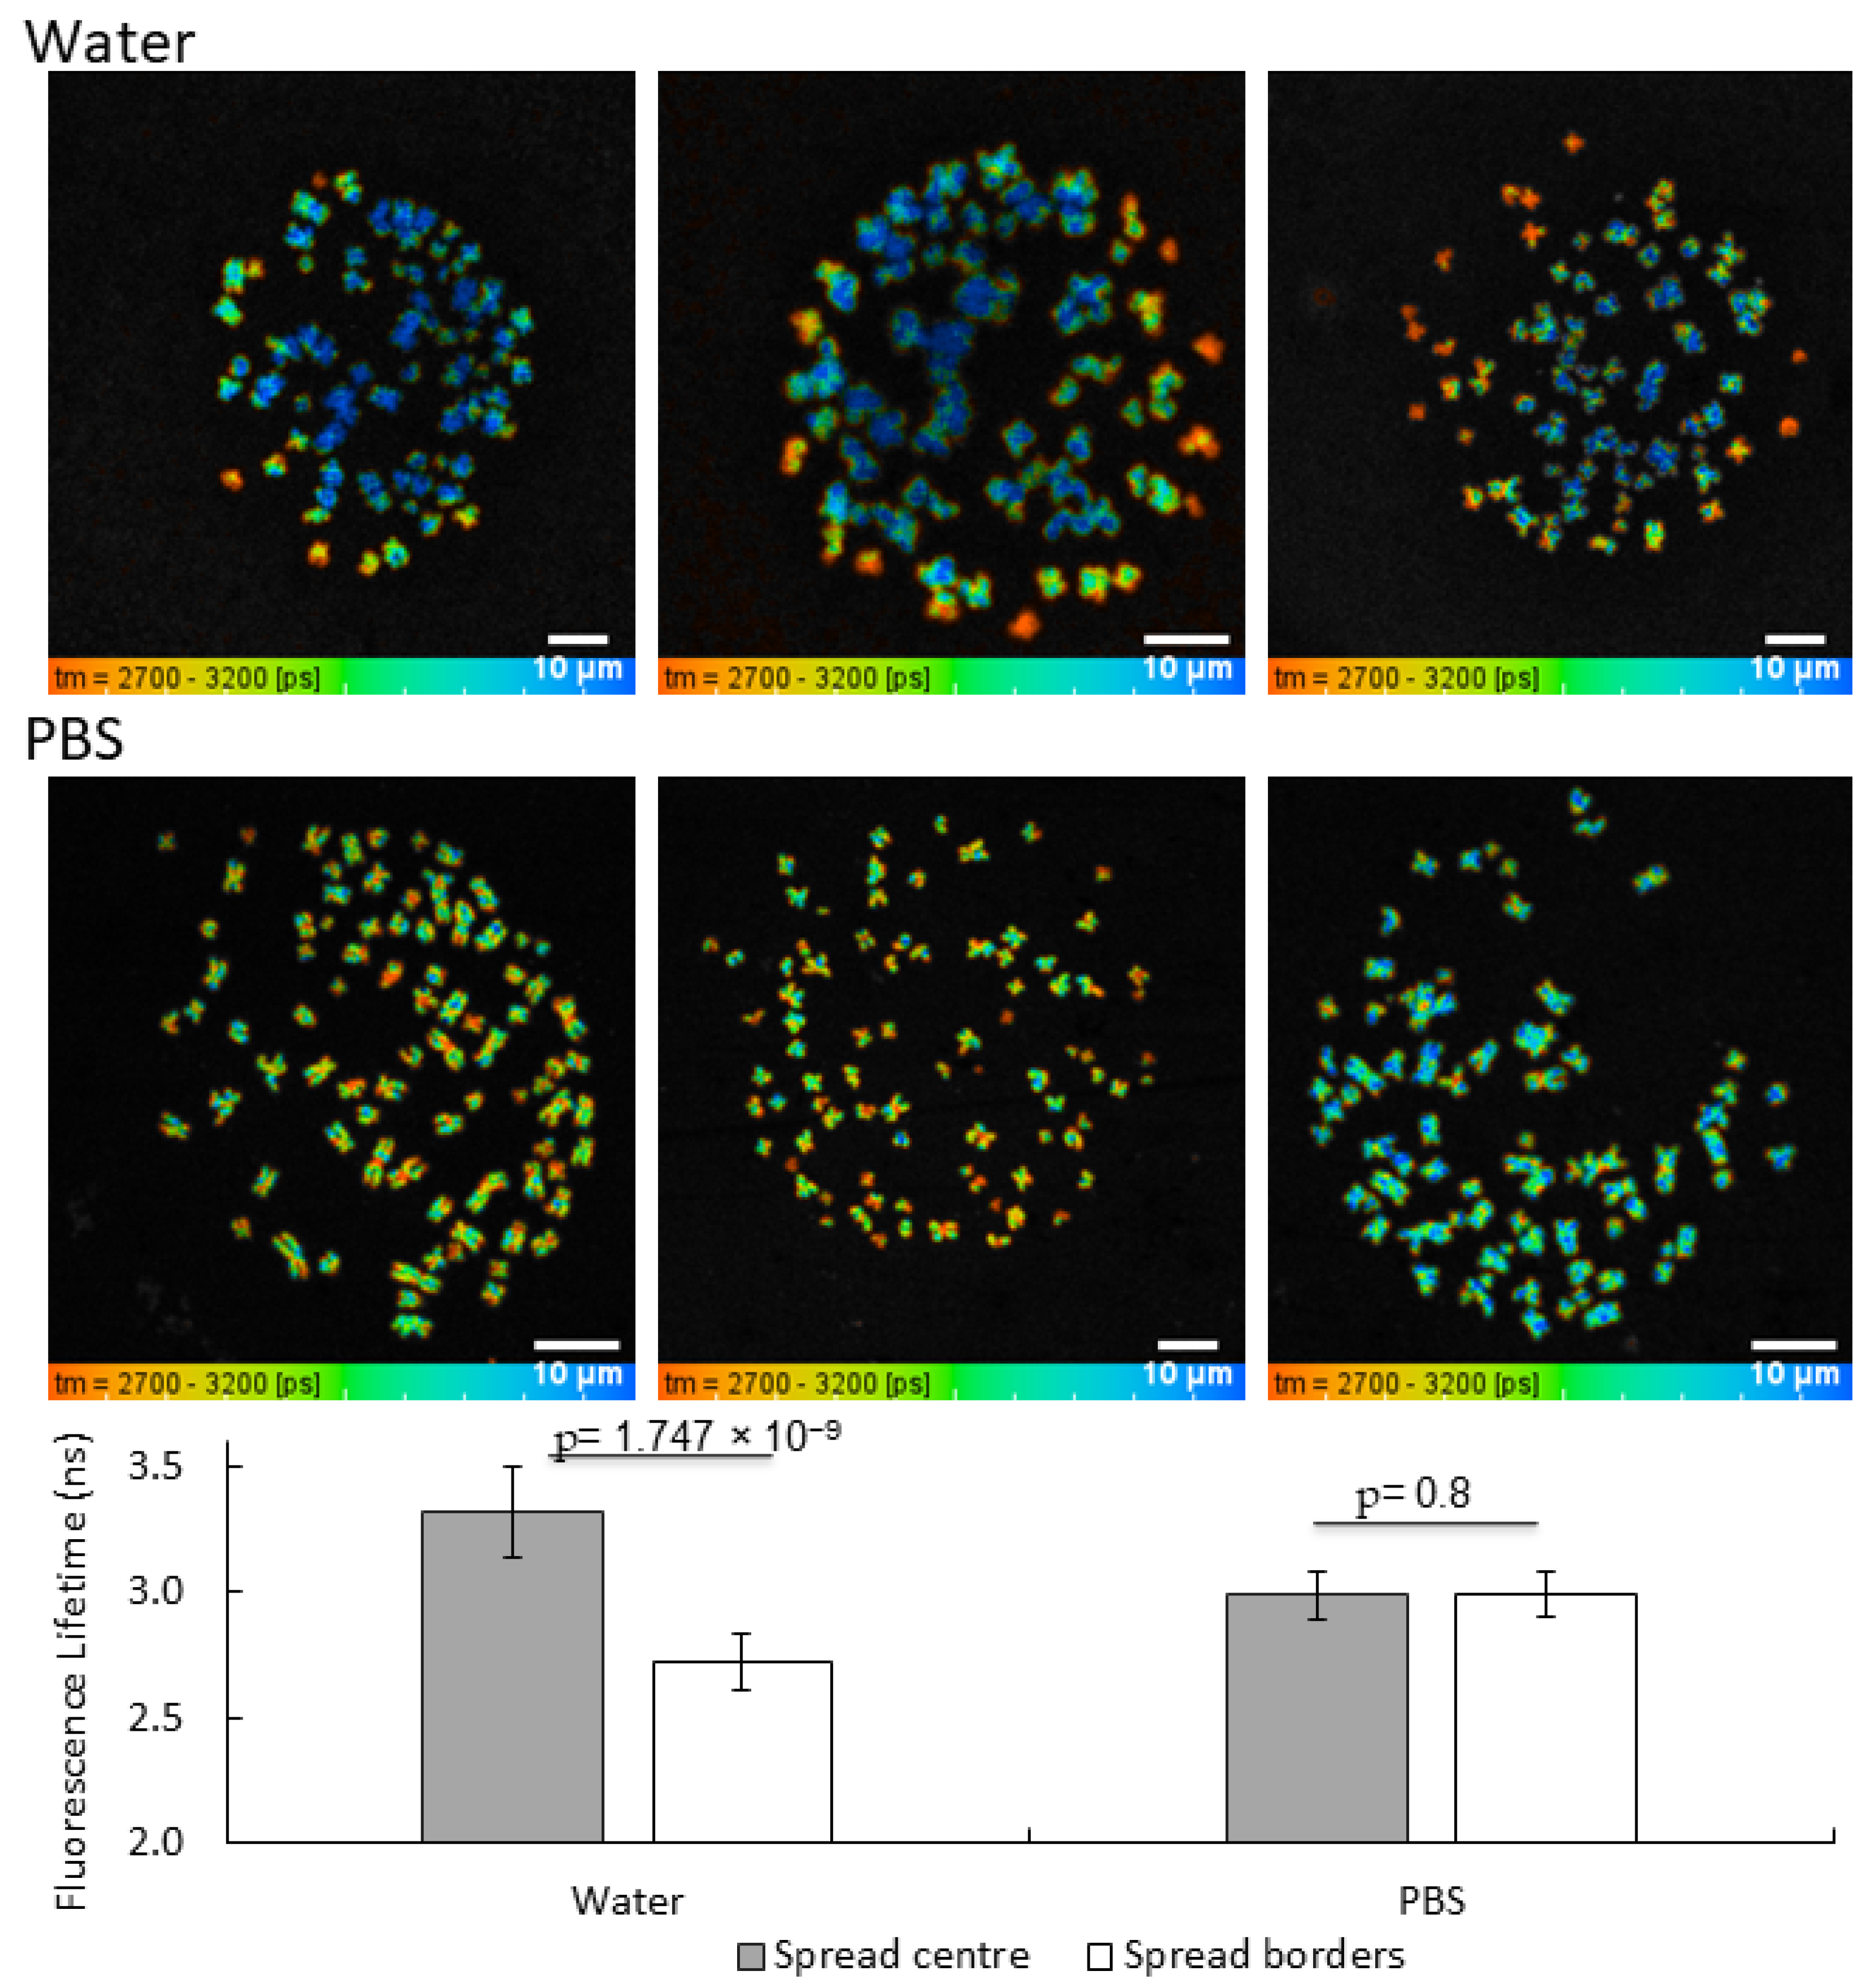
1X PBS was chosen to hydrate the slide during washing and imaging, as pure deionised water led to significantly reduced FLT on the periphery of the chromosome spread as compared to the centre of the spread. Instead, when 1X PBS was used there was no FLT difference between the chromosome spread boarders and centre. Figure 2 shows that pure deionised water led to significantly shorter FLTs on the chromosome spread periphery with a FLT 2.72 ± 0.18 ns compared to the spread centre of 3.32 ± 0.19 ns with a p-value of 1.747 × 10⁻⁹. Instead, when 1X PBS was used to wash the chromosomes and were kept hydrated during imaging, both the chromosome spread periphery, and the centre had no significant FLT difference between. Thay had an average FLT of 2.99 ± 0.09 ns throughout the spreads (3 spreads were analysed for each condition (at least three biological repeats)). While the FLTs differed significantly between the 1X PBS and water-maintained spreads, with a p-value of 6.798 × 10⁻⁶ between centres and 4.144 × 10⁻⁵ their peripheries (Figure A1).
Figure A1. FLT comparison between chromosomes hydrated with pure water or PBS 1X. FLT images of HeLa chromosome spreads stained with 4 µM DAPI and then either washed and hydrated with pure water or PBS 1X. The bar graph shows the average and standard deviation of three spreads per condition, in which 5 random FLTs were taken per centre/ border region (n = 3). p-values from a two-sample t-test compare the FLTs measured between pericentromeric and arm regions for each condition and the arm and pericentromeric regions between the conditions with the first value representing the arm FLTs and the latter the pericentromeric FLTs. A 60× water objective, NA 1.27 was used.
Dna 06 00026 g0a1

Appendix A.2

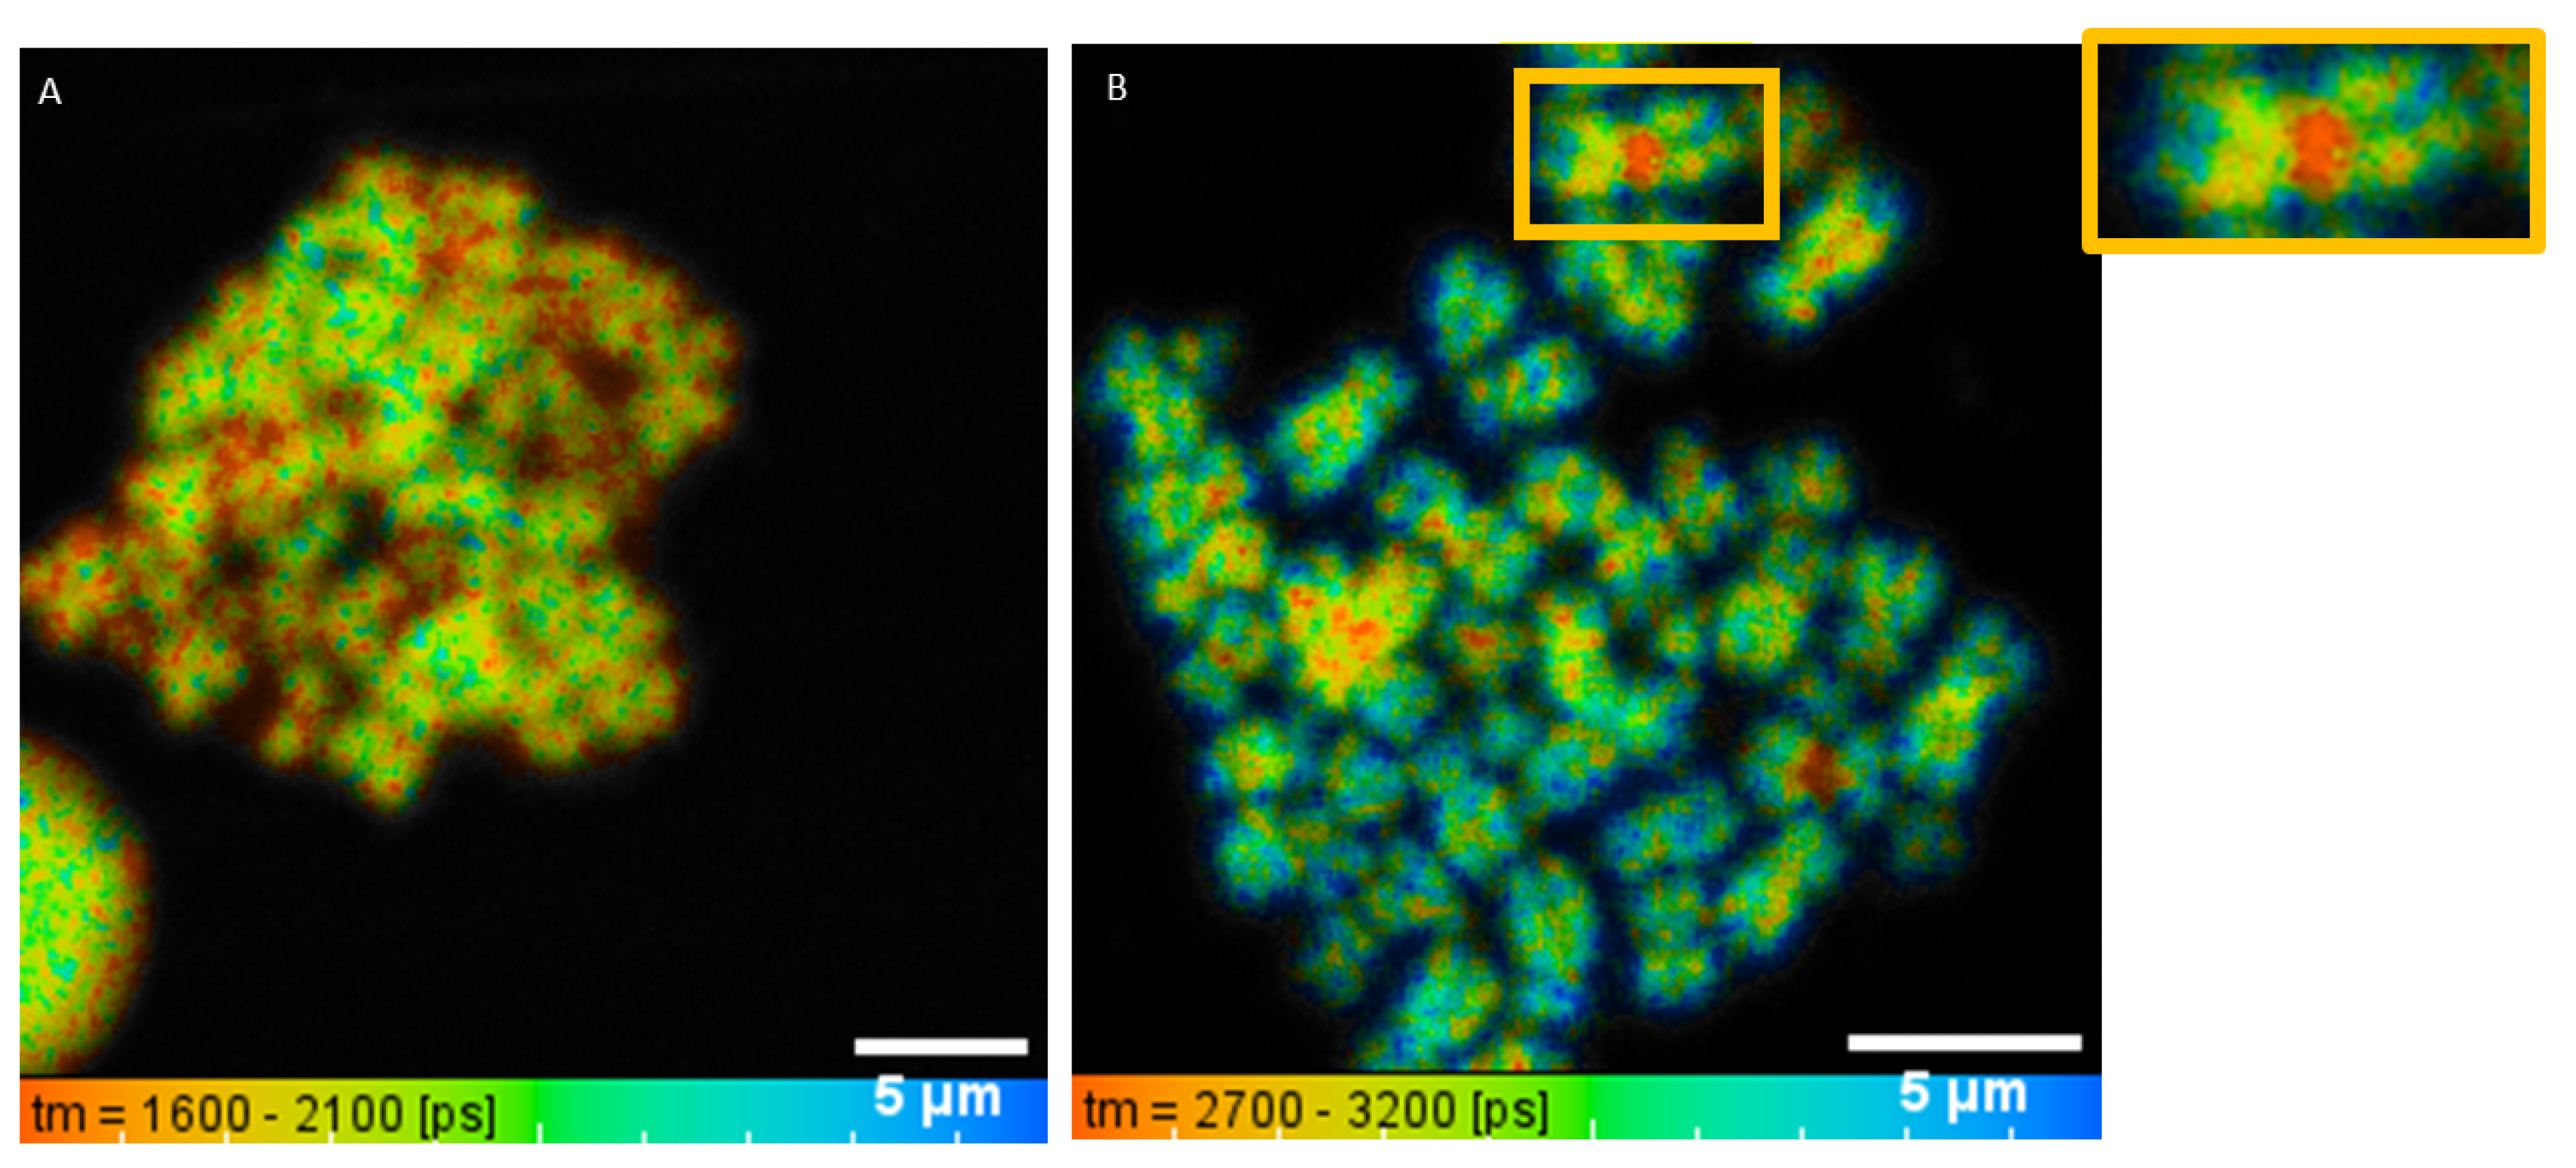
As we preserved chromosomes using MAA, the FLT of HeLa chromosomes was measured in response to MAA drying time on a glass slide. Previously, the slides have always been allowed to dry completely before staining with 4 µM DAPI followed by washing three times with 1X PBS. Here, a FLT comparison between completely dried MAA and wet MAA before adding DAPI was performed. However, when the MAA was not allowed to dry completely before staining with DAPI, no clear FLT difference between the pericentromeric region and arms could be seen with an FLT overall of 1.78 ± 0.04 ns (Figure A2A). Here, the reaction with MAA results in a quenching of DAPI’s fluorescent properties, leading to the observed lower FLT (Figure A2). Slides where the MAA was allowed to dry completely before adding DAPI led to a FLT of 3.0 ± 0.05 ns on the arms and 2.7 ± 0.06 ns on the pericentromeric regions of chromosome 1 (Figure A2B).
Figure A2. The influence of MAA on chromosome FLT. Example image from at least three repeat experiments. A T-cell chromosome spread was either (A) wet or (B) fully dried before staining the slide with 4 µM DAPI. A 60× water objective, NA 1.27 was used.
Dna 06 00026 g0a2

Appendix A.3

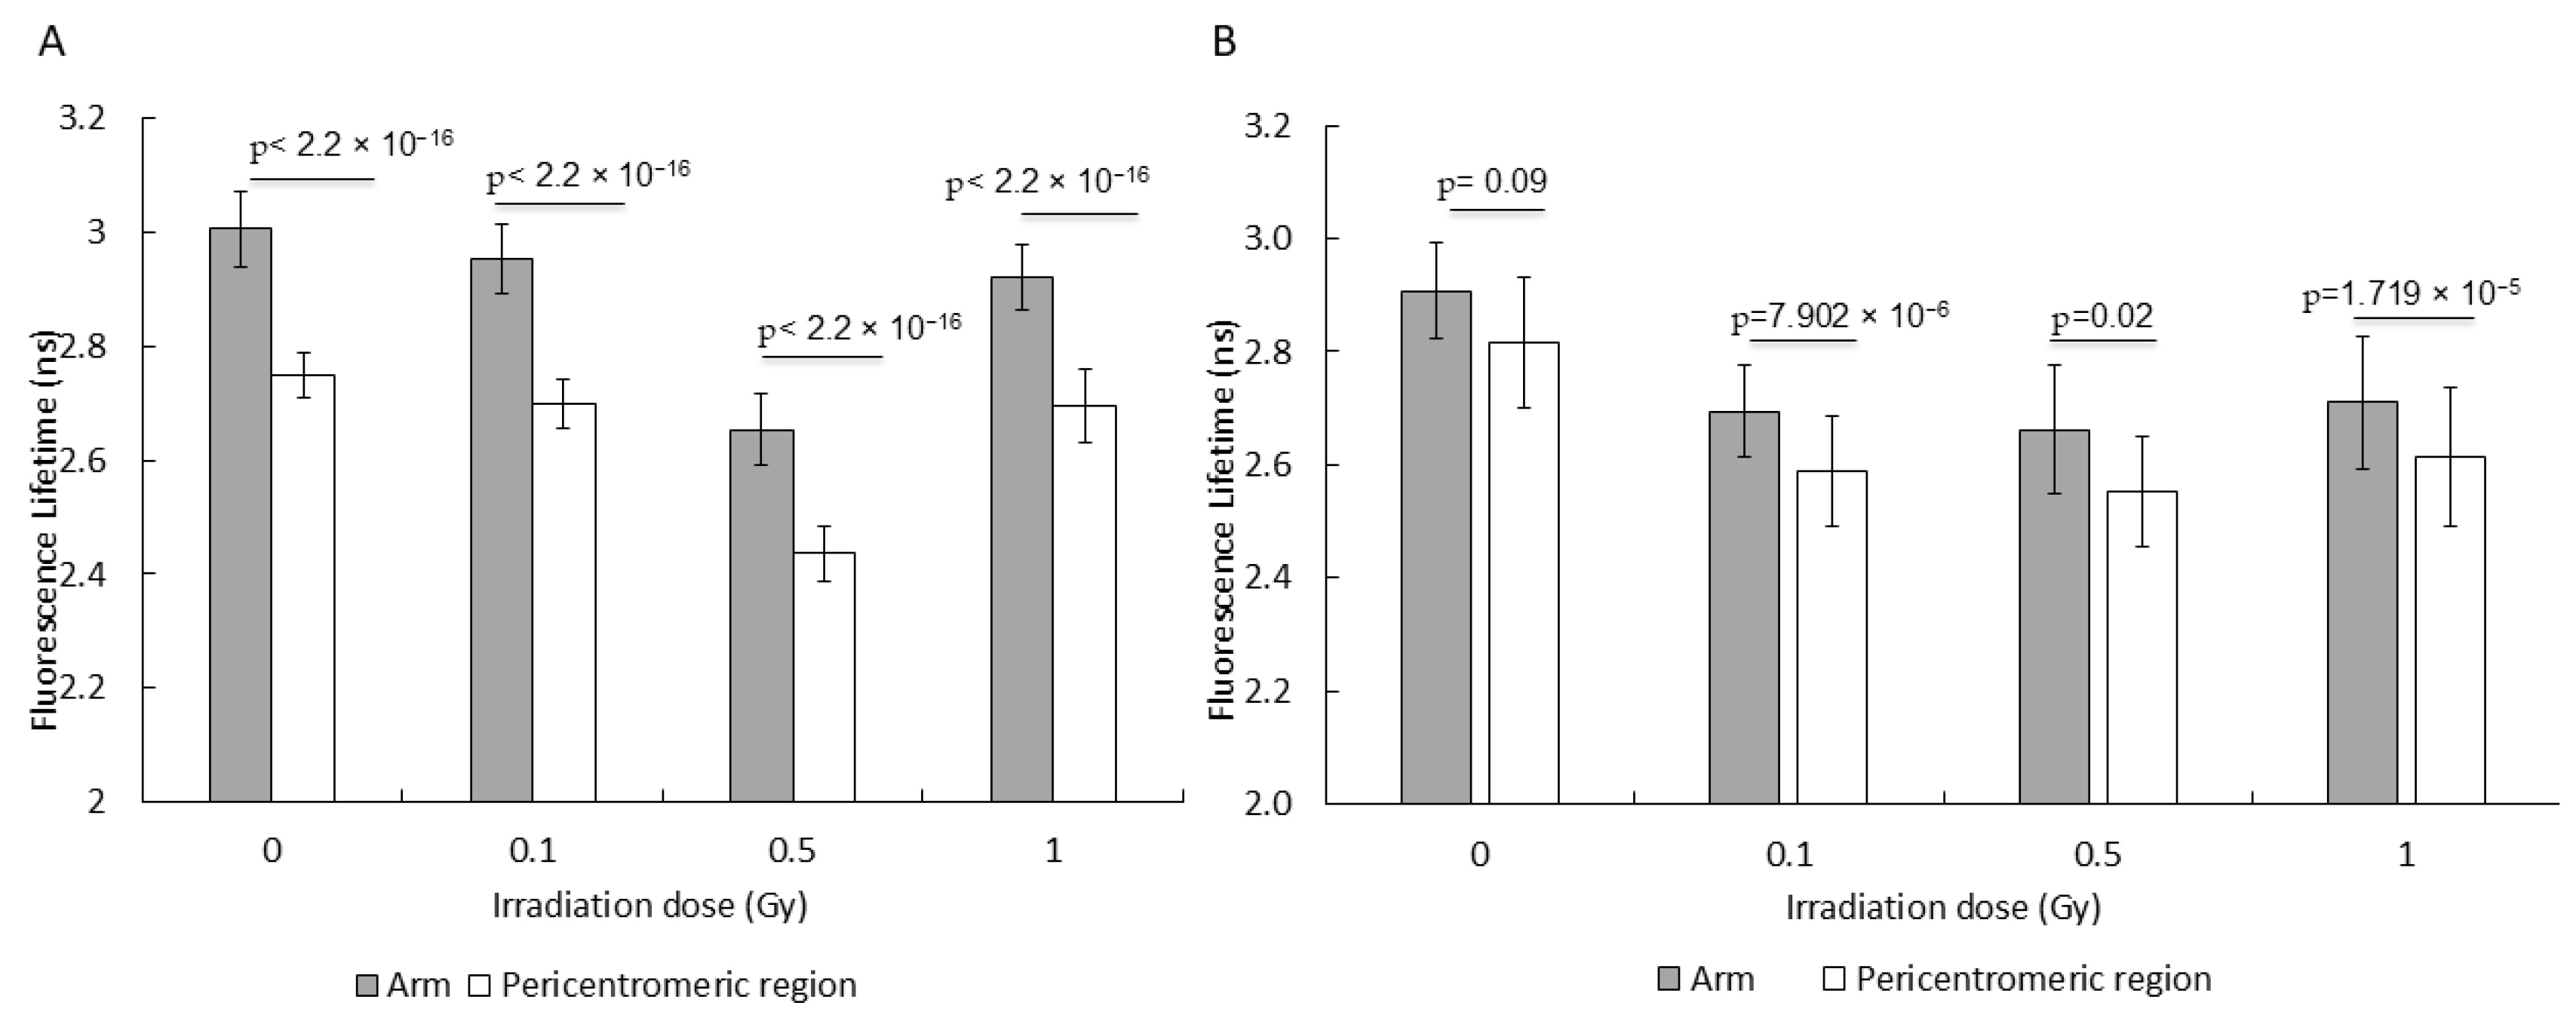
When comparing the FLTs of X-ray-irradiated T-cells with the same doses as with the HeLa chromosomes, only the improved methods showed a clear FLT reduction with 0.5 Gy compared to the other doses (Figure A3A), whereas sub-optimal chromosome preparation conditions (likely due to improper drying of MAA, chromosome dehydration and lack of PBS 1X washing) led to a large variation in FLT, and a similar reduction in FLTs of arms and pericentromeric region for all irradiation doses compared to at 0 Gy (control with no irradiation) (Figure A3B). In addition, at sham irradiation in the sub-optimal preparation, the significant difference in FLT between pericentromeric to arm FLTs was no longer observed (FLTs of 2.91 ± 0.09 ns on the arms and 2.81 ± 0.12 ns on the pericentromeric region, with a p-value of 0.09). In Figure A3B of repeat experiments reported in main text, the FLT difference between 0 Gy and 0.1 Gy is more significant, with 2.69 ± 0.08 ns on the arms and 2.59 ± 0.10 ns on the pericentromeric regions of chromosome 1 and p-values of 9.31 × 10⁻⁹ and 5.328 × 10⁻⁶ respectively, and also a clear FLT difference between pericentromeric and arm regions at this dose with a p-value of 7.902 × 10⁻⁶. At 0.5 Gy, the FLT in Figure A3A reduces significantly with p-values < 2.2 × 10⁻¹⁶ for both the arms and pericentromeric regions, with an arm FLT of 2.65 ± 0.06 ns and 2.40 ± 0.05 ns on the pericentromeric regions. On the other hand, in Figure A3B, the pericentromeric-to-arm FLT difference at 0.5 Gy is not significant, with a p-value of 0.02 and 2.66 ± 0.11 ns on the arms and 2.55 ± 0.10 ns on the pericentromeric regions. While in Figure A3B the difference between the FLTs measured with 0 Gy and 0.5 Gy is significant, with p-values of 6.731 × 10⁻¹² on the arms and 2.156 × 10⁻⁷ on the pericentromeric regions, this difference becomes more significant in the improved protocol in Figure A3A, with p-values < 2.2 × 10⁻¹⁶ for both the arms and pericentromeric regions.
For both Figure A3A,B, an FLT increase from 0.5 Gy, which is similar to the one measured with 0 Gy, can be measured. However, the FLTs increase more with the improved protocol, with an arm FLT of 2.92 ± 0.06 ns and a pericentromeric FLT of 2.70 ± 0.06 ns at 1 Gy and p-values comparing the 0 Gy FLTs with the 1 Gy FLTs of 2.025 × 10⁻⁵ and 0.001, respectively. This indicates that the pericentromeric regions of 0.1 Gy and 0 Gy are more similar to each other than their arm FLTs in Figure A3. Instead, in Figure A3B, the arm FLTs at 1 Gy are more similar to the arm FLTs at 0 Gy, with a p-value of 0.007 compared to the pericentromeric region FLTs with a p-value of 8.903 × 10⁻⁵, with FLTs of 2.71 ± 0.12 ns on the 1 Gy arms and 2.61 ± 0.12 ns on the 1 Gy pericentromeric regions.
Figure A3. DAPI FLT change in T-cell chromosome 1s after different X-ray irradiation doses. (A) Improved chromosome spread preparation (wet chromosome preparation); (n = 5) and (B) dry sample preparation (chromosome spreads n = 9). The mean FLT in the arm and heteromorphic regions of cells irradiated with 0 Gy, 0.1 Gy, 0.5 Gy and 1 Gy is shown in the graphs. A 60× water objective, NA 1.27 was used for A and B. Grey bars show the FLT of the chromosome 1 arms whereas white bars show the FLT of the shorter heteromorphic regions of chromosome. Error bars represent standard deviation. For both graphs p-values from a two-sample t-test compare the FLTs measured between pericentromeric and arm regions for each condition and regions between the conditions with the first value representing the arm FLTs, and the latter the pericentromeric FLTs.
Dna 06 00026 g0a3

References

  1. Huang, R.; Zhou, P.K. DNA damage repair: Historical perspectives, mechanistic pathways and clinical translation for targeted cancer therapy. Signal Transduct. Target. Ther. 2021, 6, 254. [Google Scholar] [CrossRef]
  2. Sumner, A.T. The nature and mechanisms of chromosome banding. Cancer Genet. Cytogenet. 1982, 6, 59–87. [Google Scholar] [CrossRef] [PubMed]
  3. Tobias, E.S.; Connor, M.; Ferguson-Smith, M. Essential Medical Genetics; Wiley-Blackwell: Chichester, UK, 2016. [Google Scholar]
  4. Cremer, T.; Cremer, C. Chromosome territories, nuclear architecture and gene regulation in mammalian cells. Nat. Rev. Genet. 2001, 2, 292–301. [Google Scholar] [CrossRef] [PubMed]
  5. Sajid, A.; Lalani, E.-N.; Chen, B.; Hashimoto, T.; Griffin, D.K.; Bhartiya, A.; Thompson, G.; Robinson, I.K.; Yusuf, M. Ultra-Structural Imaging Provides 3D Organization of 46 Chromosomes of a Human Lymphocyte Prophase Nucleus. Int. J. Mol. Sci. 2021, 22, 5987. [Google Scholar] [CrossRef]
  6. M’Kacher, R.; Colicchio, B.; Junker, S.; El Maalouf, E.; Heidingsfelder, L.; Plesch, A.; Dieterlen, A.; Jeandidier, E.; Carde, P.; Voisin, P. High Resolution and Automatable Cytogenetic Biodosimetry Using In Situ Telomere and Centromere Hybridization for the Accurate Detection of DNA Damage: An Overview. Int. J. Mol. Sci. 2023, 24, 5699. [Google Scholar] [CrossRef]
  7. Bhartiya, A.; Batey, D.; Cipiccia, S.; Shi, X.; Rau, C.; Botchway, S.; Yusuf, M.; Robinson, I.K. X-ray Ptychography Imaging of Human Chromosomes After Low-dose Irradiation. Chromosome Res. 2021, 29, 107–126. [Google Scholar] [CrossRef]
  8. Fioriniello, S.; Marano, D.; Fiorillo, F.; D’Esposito, M.; Della Ragione, F. Epigenetic Factors that Control Pericentric Heterochromatin Organization in Mammals. Genes 2020, 11, 595. [Google Scholar] [CrossRef]
  9. Swarts, S.G.; Gilbert, D.C.; Sharma, K.K.; Razskazovskiy, Y.; Purkayastha, S.; Naumenko, K.A.; Bernhard, W.A. Mechanisms of Direct Radiation Damage in DNA, Based on a Study of the Yields of Base Damage, Deoxyribose Damage, and Trapped Radicals in d(GCACGCGTGC)2. Radiat. Res. 2007, 168, 367–381. [Google Scholar] [CrossRef]
  10. Botchway, S.W. Characteristics of DNA Damage Induced by Ultrasoft X-Rays and upon Photoionization. Ph.D. Thesis, University of Leicester, Leicester, UK, 1996. [Google Scholar]
  11. Jana, A.; Crowston, B.J.; Shewring, J.R.; McKenzie, L.K.; Bryant, H.E.; Botchway, S.W.; Ward, A.D.; Amoroso, A.J.; Baggaley, E.; Ward, M.D. Heteronuclear Ir(III)–Ln(III) Luminescent Complexes: Small-Molecule Probes for Dual Modal Imaging and Oxygen Sensing. Inorg. Chem. 2016, 55, 5623–5633. [Google Scholar] [CrossRef]
  12. Botchway, S.W.; Parker, A.W.; Bisby, R.H.; Crisostomo, A.G. Real-time cellular uptake of serotonin using fluorescence lifetime imaging with two-photon excitation. Microsc. Res. Tech. 2008, 71, 267–273. [Google Scholar] [CrossRef] [PubMed]
  13. Clancy, E.; Ramadurai, S.; Needham, S.R.; Baker, K.; Eastwood, T.A.; Weinstein, J.A.; Mulvihill, D.P.; Botchway, S.W. Fluorescence and phosphorescence lifetime imaging reveals a significant cell nuclear viscosity and refractive index changes upon DNA damage. Sci. Rep. 2023, 13, 422. [Google Scholar] [CrossRef] [PubMed]
  14. Ahmed, A.; Schoberer, J.; Cooke, E.; Botchway, S.W. Multicolor FRET-FLIM Microscopy to Analyze Multiprotein Interactions in Live Cells. In Multiprotein Complexes; Methods in Molecular Biology; Humana: New York, NY, USA, 2021; pp. 287–301. [Google Scholar] [CrossRef]
  15. Stubbs, C.D.; Botchway, S.W.; Slater, S.J.; Parker, A.W. The use of time-resolved fluorescence imaging in the study of protein kinase C localisation in cells. BMC Cell Biol. 2005, 6, 22. [Google Scholar] [CrossRef] [PubMed]
  16. Hirvonen, L.M.; Suhling, K. Wide-field TCSPC: Methods and applications. Meas. Sci. Technol. 2016, 28, 012003. [Google Scholar] [CrossRef]
  17. Botchway, S.W.; Farooq, S.; Sajid, A.; Robinson, I.K.; Yusuf, M. Contribution of advanced fluorescence nano microscopy towards revealing mitotic chromosome structure. Chromosome Res. 2021, 29, 19–36. [Google Scholar] [CrossRef]
  18. Estandarte, A.K.; Botchway, S.; Lynch, C.; Yusuf, M.; Robinson, I. The use of DAPI fluorescence lifetime imaging for investigating chromatin condensation in human chromosomes. Sci. Rep. 2016, 6, 31417. [Google Scholar] [CrossRef]
  19. Bhartiya, A.; Robinson, I.; Yusuf, M.; Botchway, S.W. Combining Multicolor FISH with Fluorescence Lifetime Imaging for Chromosomal Identification and Chromosomal Sub Structure Investigation. Front. Mol. Biosci. 2021, 8, 631774. [Google Scholar] [CrossRef]
  20. Saksouk, N.; Simboeck, E.; Déjardin, J. Constitutive heterochromatin formation and transcription in mammals. Epigenet. Chromatin 2015, 8, 3. [Google Scholar] [CrossRef]
  21. Tagarro, I.; Fernandez-Peralta Antonia, M.; Gonzalez-Aguilera Juan, J. Chromosomal localization of human satellites 2 and 3 by a FISH method using oligonucleotides as probes. Hum. Genet. 1994, 93, 383–388. [Google Scholar] [CrossRef]
  22. Friedrich, U.; Therkelsen, A.J.; Jørgensen, A.L.; Caprani, M.; Niebuhr, E. Extreme variant of the short arm of chromosome 15. Hum. Genet. 1996, 97, 710–713. [Google Scholar] [CrossRef] [PubMed]
  23. Chen, T.R.; Kao, M.L.; Marks, J.; Chen, Y.Y. Polymorphic variants in human chromosome 15. Am. J. Med. Genet. 1981, 9, 61–66. [Google Scholar] [CrossRef]
  24. Bachtrog, D.; Mank, J.E.; Peichel, C.L.; Kirkpatrick, M.; Otto, S.P.; Ashman, T.-L.; Hahn, M.W.; Kitano, J.; Mayrose, I.; Ming, R.; et al. Sex Determination: Why So Many Ways of Doing It? PLoS Biol. 2014, 12, e1001899. [Google Scholar] [CrossRef]
  25. Choo, K.H.A. Domain Organization at the Centromere and Neocentromere. Dev. Cell 2001, 1, 165–177. [Google Scholar] [CrossRef]
  26. Joiner, M.C.; Marples, B.; Lambin, P.; Short, S.C.; Turesson, I. Low-dose hypersensitivity: Current status and possible mechanisms. Int. J. Radiat. Oncol. Biol. Phys. 2001, 49, 379–389. [Google Scholar] [CrossRef] [PubMed]
  27. Yusuf, M.; Leung, K.; Morris, K.J.; Volpi, E.V. Comprehensive cytogenomic profile of the in vitro neuronal model SH-SY5Y. Neurogenetics 2012, 14, 63–70. [Google Scholar] [CrossRef]
  28. Moralli, D.; Yusuf, M.; Mandegar, M.A.; Khoja, S.; Monaco, Z.L.; Volpi, E.V. An Improved Technique for Chromosomal Analysis of Human ES and iPS Cells. Stem Cell Rev. Rep. 2010, 7, 471–477. [Google Scholar] [CrossRef] [PubMed]
  29. Berger, S.L.; Phengchat, R.; Botchway, S.W.; Yusuf, M. Optimizing chromosome yield: A comparative analysis of harvesting, preparation and waste recovery methods. BioTechniques 2025, 77, 245–256. [Google Scholar] [CrossRef]
  30. Datta, R.; Heaster, T.M.; Sharick, J.T.; Gillette, A.A.; Skala, M.C. Fluorescence lifetime imaging microscopy: Fundamentals and advances in instrumentation, analysis, and applications. J. Biomed. Opt. 2020, 25, 071203. [Google Scholar] [CrossRef] [PubMed]
  31. Saayman, X.; Graham, E.; Nathan, W.J.; Nussenzweig, A.; Esashi, F. Centromeres as universal hotspots of DNA breakage, driving RAD51-mediated recombination during quiescence. Mol. Cell 2023, 83, 523–538.e7. [Google Scholar] [CrossRef]
  32. Jana, S.; Wöll, D. Moisture changes inside hydrogel particles during their drying process investigated with fluorescence lifetime imaging. Phys. Chem. Chem. Phys. 2024, 26, 23250–23255. [Google Scholar] [CrossRef]
  33. Witt, H.; Harju, J.; Chameau, E.M.J.; Bruinsma, C.M.A.; Clement, T.V.M.; Nielsen, C.F.; Hickson, I.D.; Peterman, E.J.G.; Broedersz, C.P.; Wuite, G.J.L. Ion-mediated condensation controls the mechanics of mitotic chromosomes. Nat. Mater. 2024, 23, 1556–1562. [Google Scholar] [CrossRef]
  34. Ami, D.; Di Segni, M.; Forcella, M.; Meraviglia, V.; Baccarin, M.; Doglia, S.; Terzoli, G. Role of water in chromosome spreading and swelling induced by acetic acid treatment: A FTIR spectroscopy study. Eur. J. Histochem. 2014, 58, 2330. [Google Scholar] [CrossRef] [PubMed]
  35. Maity, A.; Singh, A.; Singh, N. Differential stability of DNA based on salt concentration. Eur. Biophys. J. 2016, 46, 33–40. [Google Scholar] [CrossRef]
  36. Zhang, C.; Tian, F.-J.; Zuo, H.-W.; Qiu, Q.-Y.; Zhang, J.-H.; Wei, W.; Tan, Z.-J.; Zhang, Y.; Wu, W.-Q.; Dai, L.; et al. Counterintuitive DNA destabilization by monovalent salt at high concentrations due to overcharging. Nat. Commun. 2025, 16, 113. [Google Scholar] [CrossRef]
  37. Cruz-León, S.; Vanderlinden, W.; Müller, P.; Forster, T.; Staudt, G.; Lin, Y.-Y.; Lipfert, J.; Schwierz, N. Twisting DNA by salt. Nucleic Acids Res. 2022, 50, 5726–5738. [Google Scholar] [CrossRef]
  38. Barcellona, M.L.; Gratton, E. Fluorescence lifetime distributions of DNA-4′,6-diamidino-2-phenylindole complex. Biochim. Biophys. Acta-Gen. Subj. 1989, 993, 174–178. [Google Scholar] [CrossRef] [PubMed]
  39. Tanious, F.A.; Veal, J.M.; Buczak, H.; Ratmeyer, L.S.; Wilson, W.D. DAPI (4′,6-diamidino-2-phenylindole) binds differently to DNA and RNA: Minor-groove binding at AT sites and intercalation at AU sites. Biochemistry 1992, 31, 3103–3112. [Google Scholar] [CrossRef] [PubMed]
  40. Cavatorta, P.; Masotti, L.; Szabo, A.G. A time-resolved fluorescence study of 4′,6′-diamidine-2-phenylindole dihydrochloride binding to polynucleotides. Biophys. Chem. 1985, 22, 11–16. [Google Scholar] [CrossRef]
  41. Portugal, J.; Waring, M.J. Assignment of DNA binding sites for 4′,6-diamidine-2-phenylindole and bisbenzimide (Hoechst 33258). A comparative footprinting study. Biochim. Biophys. Acta-Gene Struct. Expr. 1988, 949, 158–168. [Google Scholar] [CrossRef]
  42. Bucevičius, J.; Lukinavičius, G.; Gerasimaitė, R. The Use of Hoechst Dyes for DNA Staining and beyond. Chemosensors 2018, 6, 18. [Google Scholar] [CrossRef]
  43. Burgess Rebecca, C.; Burman, B.; Kruhlak Michael, J.; Misteli, T. Activation of DNA Damage Response Signaling by Condensed Chromatin. Cell Rep. 2014, 9, 1703–1717. [Google Scholar] [CrossRef]
  44. Shimura, N.; Kojima, S. The Lowest Radiation Dose Having Molecular Changes in the Living Body. Dose-Response 2018, 16, 1559325818777326. [Google Scholar] [CrossRef] [PubMed]
Figure 1. A Flow diagram showing chromosome preparation steps. Cells were X-ray irradiated using different doses (yellow box). Chromosomes are prepared after addition of colcemid (mitotic inhibitor); (blue box) followed by treatment with KCl (hypotonic) and then fixed using methanol and acetic acid solution (MAA) (green box) before mounting onto glass slides (pink box). Created in Bio Render. Berger, S. (copyright approved 2025).
Dna 06 00026 g001
Figure 2. Schematic of FLIM measurement with a confocal laser scanning microscopy setup using sub-nanosecond excited state FLT measurements by time-correlated single-photon counting, TCSPC.
Dna 06 00026 g002
Figure 3. A representative FLIM image of the importance of hydration and its effect on chromosome FLT. The same field of view of HeLa chromosome spread stained with 4 µM DAPI is shown (AiAiv) wet and (BiBiv) dried overnight. (Ci,Cii) are FLIM images of samples allowed to dry for only 3 h. The graph indicates the pericentromeric region and the arm FLTs taken from 3 chromosome 1 s, with 5 regions taken per pericentromeric region and per arm to calculate the average and standard deviations or error bars, indicating a reduced FLT and focus under dry conditions (n = 3). FLT scale bars adjusted for each condition to show the pericentromeric and arm regions. See also Supplementary Figure S1 for same FLT window. p-values from a two-sample t-test compare the FLTs measured between pericentromeric and arm regions for each condition and between the conditions with the first value representing the arm FLTs, and the latter the pericentromeric FLTs. A 60× water objective, NA 1.27 was used. Three independent experiments were conducted, each providing a minimum of 5 data points of the arm and pericentromeric region FLT, with 3 chromosome 1 s measured per condition.
Dna 06 00026 g003
Figure 4. FLT comparisons between chromosomes stained with different DAPI concentrations. HeLa chromosomes were stained with (Ai,Aii) 4 µM (orange box), (Bi,Bii) 40 µM (green box) or (Ci,Cii) 400 µM (yellow box). The graph highlights the pericentromeric region and arm FLTs of 5 chromosome 1 s, from three different spreads, with 5 FLTs per pericentromeric region/arms to calculate the average and standard deviations shown as error bars (n = 5). FLT scale bars adjusted for each condition to show the pericentromeric and arm regions. See also Supplementary Figures S2 and S3 for ROI analysis. p-values from a two-sample t-test compare the FLTs measured between pericentromeric and arm regions for each condition and between the conditions with the first value representing the arm FLTs and the latter the pericentromeric FLTs. A 60× water objective, NA 1.27 was used. Three independent experiments were conducted, each providing a minimum of 5 data points of the arm and pericentromeric region FLTs.
Dna 06 00026 g004
Figure 5. FLT comparison between different DNA staining dyes on HeLa chromosomes. Chromosomes were stained with (Ai,Aii) 4 µM Hoechst 33258 (orange box), (Bi,Bii) one drop of NucBlueTM (green box) and (Ci,Cii) with 4 µM DAPI (yellow box). The bar graph highlights the FLTs of 3–5 chromosome 1 s from three different spreads, with 5 FLTs per arm/pericentromeric region to calculate the average and standard deviations shown as error bars (n = 3–5). p-values from a two-sample t-test compare the FLTs measured between pericentromeric and arm regions for each condition and between the conditions with the first value representing the arm FLTs and the latter the pericentromeric FLTs. FLT scale bars adjusted for each condition to show the pericentromeric region and arm regions. A 60× water objective, NA 1.27 was used.
Dna 06 00026 g005
Figure 6. FLT comparison between chromosomes irradiated with different X-ray doses. FLT images of HeLa chromosomes stained with 4 µM DAPI that were (Ai,Aii)-not-irradiated, (Bi,Bii)-irradiated with 0.1 Gy, (Ci,Cii)-irradiated with 0.5 Gy or (Di,Dii)-irradiated with 1 Gy. The clustered bar graph highlights these values, that have been obtained by analysing 4–5 chromosome, 1 s per condition, with 5 FLTs per arm and per pericentromeric area (n = 4–5). p-values from a two-sample t-test compare the FLTs measured between pericentromeric and arm regions for each condition and between the conditions with the first value representing the arm FLTs and the latter the pericentromeric FLTs. A 60× water objective, NA 1.27 was used.
Dna 06 00026 g006
Disclaimer/Publisher’s Note: The statements, opinions and data contained in all publications are solely those of the individual author(s) and contributor(s) and not of MDPI and/or the editor(s). MDPI and/or the editor(s) disclaim responsibility for any injury to people or property resulting from any ideas, methods, instructions or products referred to in the content.