
3D Ultrastructural Imaging of Chromosomes Using Serial Block-Face Scanning Electron Microscopy (SBFSEM)


Abstract
:
1. Introduction
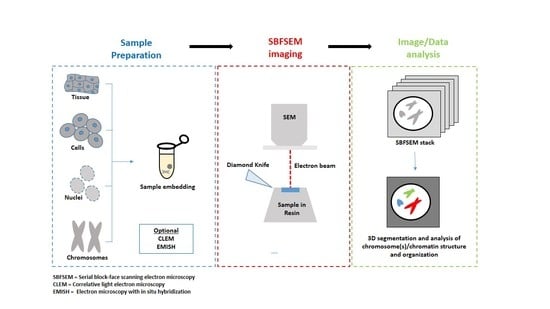
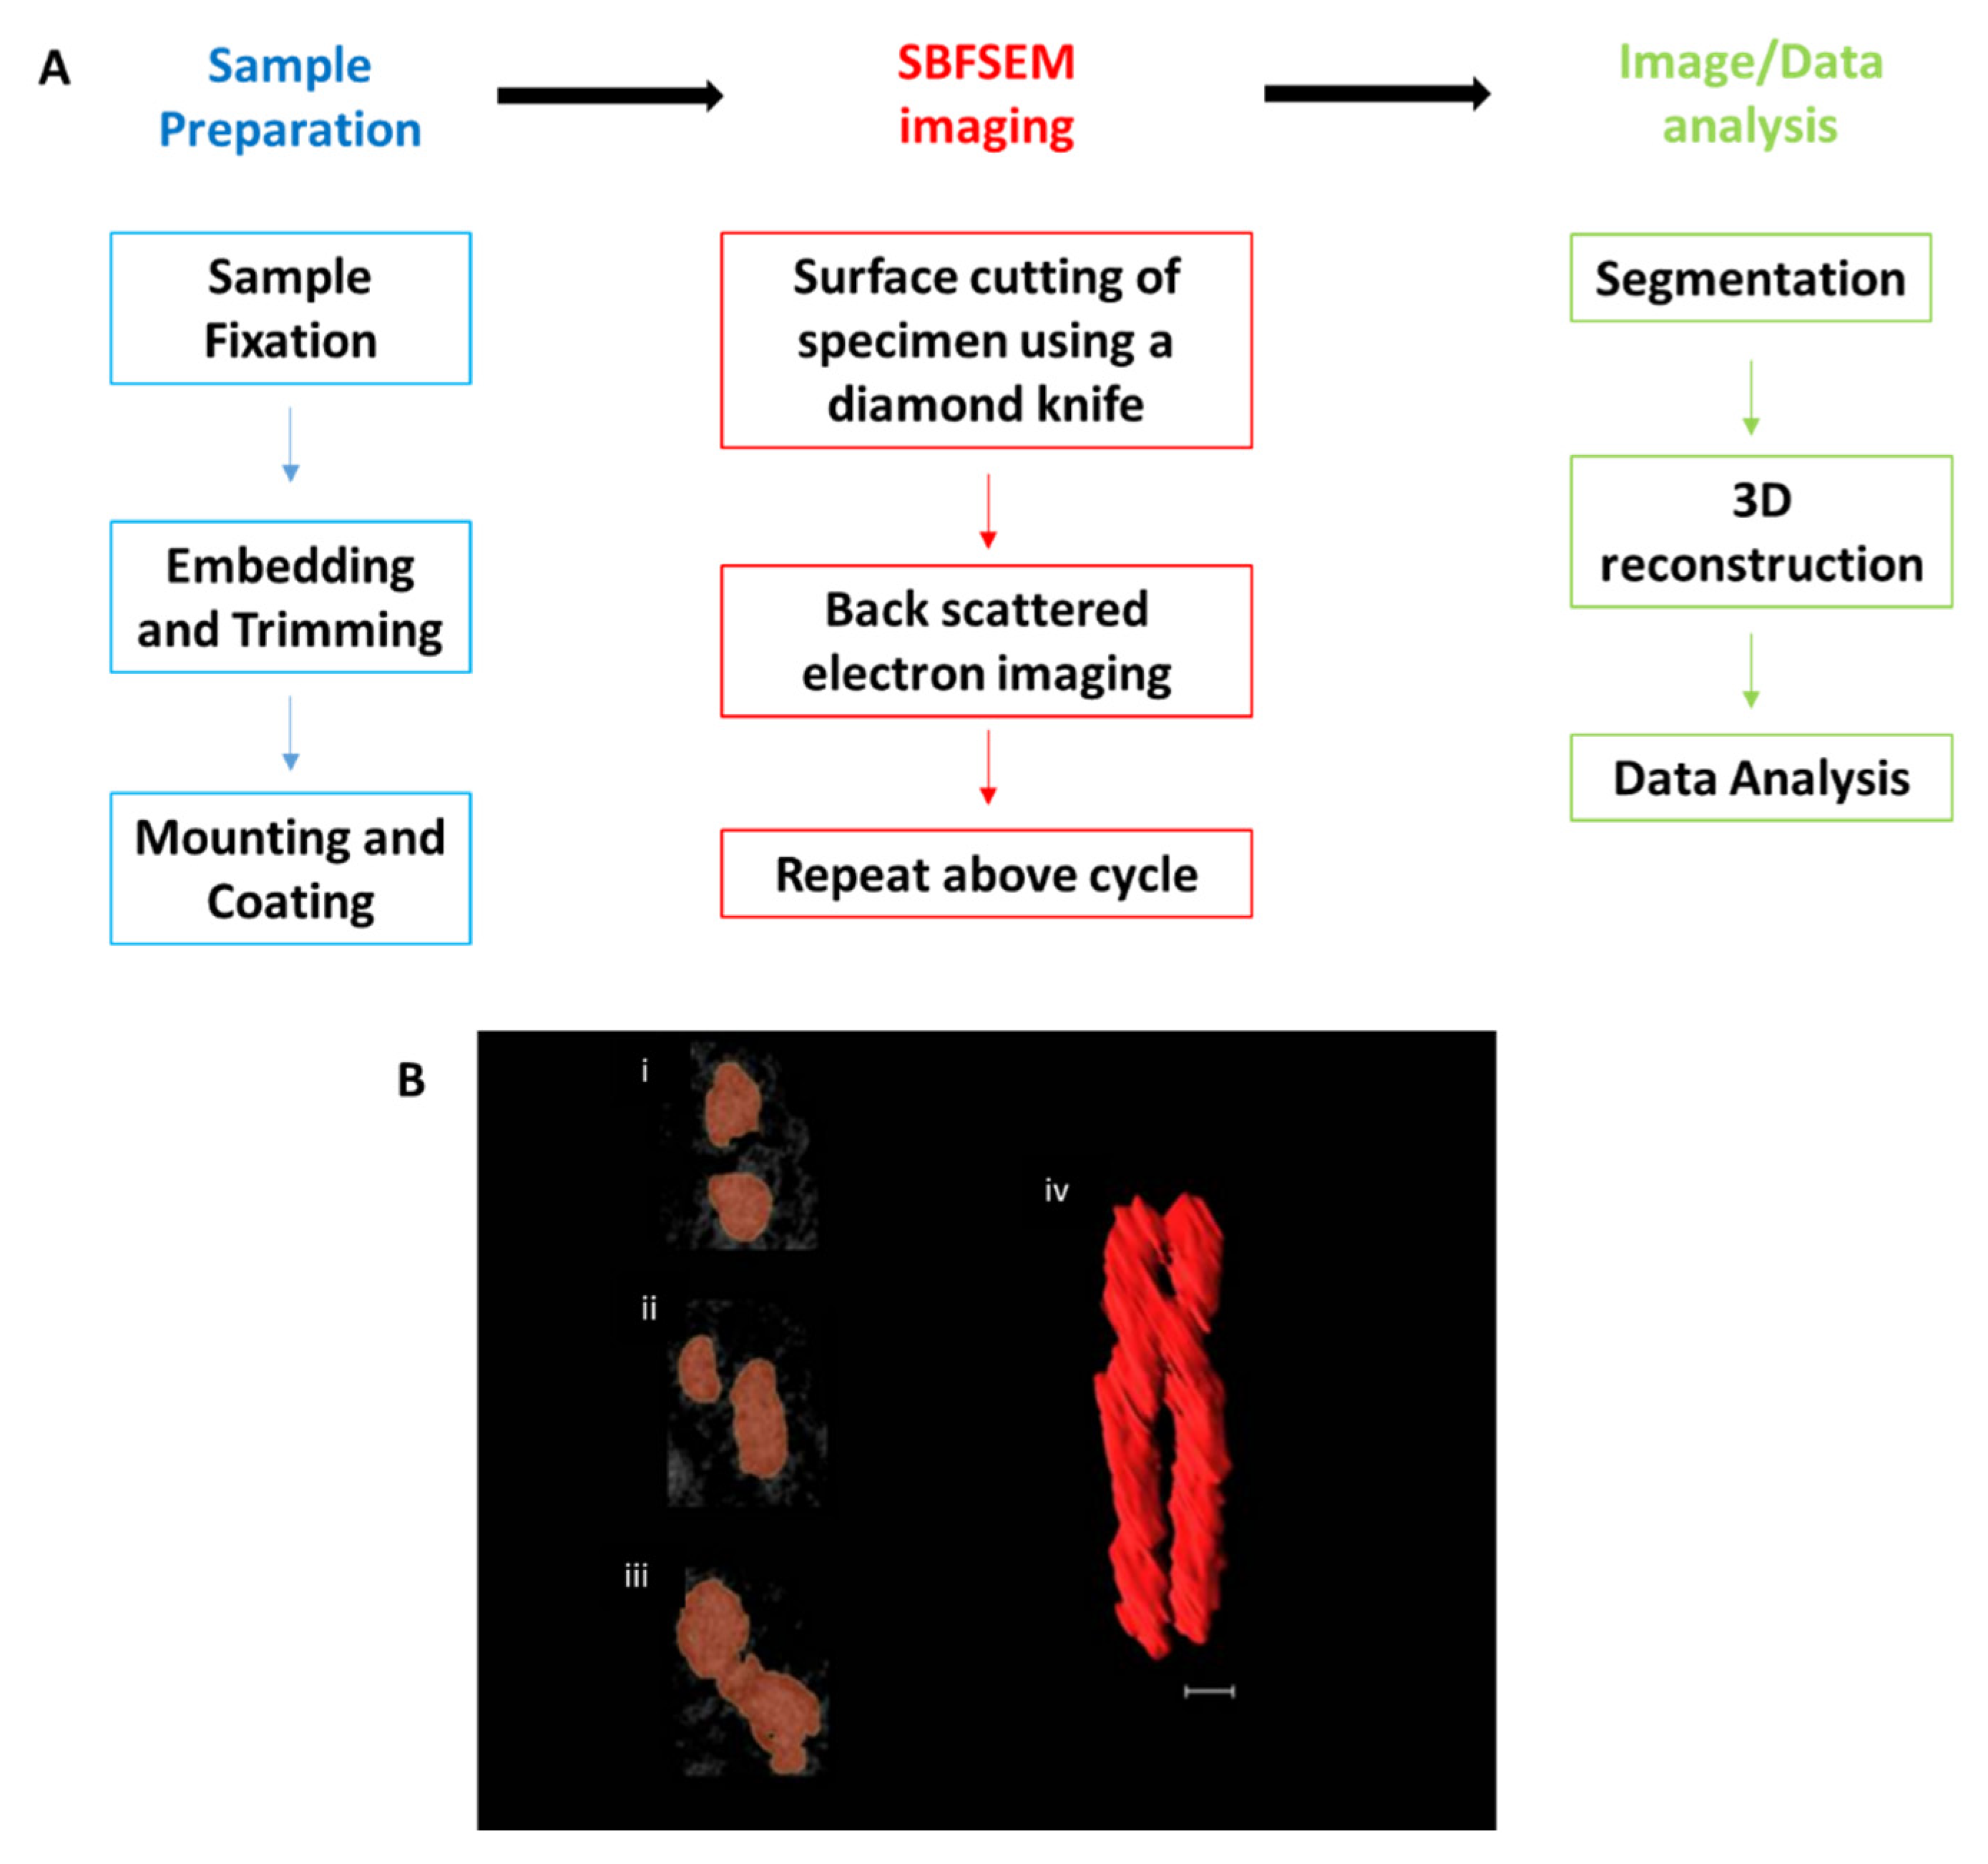
2. SBFSEM Method
3. SBFSEM 3D Reconstruction of Chromatin and Chromosomes

| Cell type | Species | Sample Type | Fixation | Staining | Resin Type | SEM Energy (kv) | Resolution (x,y,z) | Findings | Reference |
|---|---|---|---|---|---|---|---|---|---|
| Hepatocyte and endothelial | Rat | Tissue | 3% glutaraldehyde, 4% paraformaldehyde and methanol-acetic anhydride (5:1 v/v) | NAMA-Ur and uranyl acetate | Epon | 5 | 20 × 20 × 50 nm | Hepatic cell nuclei occupies 33.8 % chromatin and 66.2% of interchromatin space. Endothelial cell nuclei occupies 58.3% chromatin and 41.7% interchromatin space (This includes space occupied by nucleoli) | [53] |
| B lymphocyte | Human | Isolated chromosomes | Polyamine or Methanol acetic acid, 2.5% gluteraldehyde | Platinum blue | Agar 100 | N/A | 13 × 13 × 100 nm | Sample preparation procedures developed for chromosomes. X-shaped mitotic chromosome was reconstructed from polyamine preparations allowing q and p arm chromatids to be measured. Internal structural details or cavities were seen on methanol acetic acid prepared chromosomes only | [55] |
| Retinal Pigment Epithelial (RPE1) cells, IC7 cells, DT40 | Human, Mouse and Chicken | Cells | 3% glutarldehyde and 1% Paraformaldehyde | 2% osmium tetroxide + 1.5 potassium ferrocyanide, 0.1% tannic acid, 1% uranyl acetate, Walton’s lead aspartate (0.02 M in lead nitrate + 0.03 M in aspartic acid | TAAB Hard Premix resin | 2.5 | 24 × 24 × 60 nm | 3D analysis of chromosomes at different stages of the cell cycle revealed that the prophase chromosomes possess irregular surfaces and smaller volume than metaphase chromosomes. 30% to 47% volume of the mitotic chromosomes accounts for the periphery | [54] |
| B lymphocyte | Human | Isolated nuclei and chromosomes | 3:1 methanol/acetic acid and 2.5% (v/v) glutaraldehyde | 5 mM platinum blue | Epoxy resin | 5 | 11 × 11 × 20 nm | 36 intact prophase chromosomes were segmented and modelled. Chromosome identification and positioning within the prophase nucleus was determined by quantitative analysis. Chromosomes were found to have parallel-aligned sister chromatids with no crossovers | [49] |
| DT40 (B lymphoma) | Chicken | Cells | 3% glutarldehyde and 1% paraformaldehyde | 2% osmium tetroxide + 1.5 potassium ferrocyanide, 0.1% tannic acid, 1% uranyl acetate, Walton’s lead aspartate (0.02 M in lead nitrate + 0.03 M in aspartic acid | TAAB Hard Premix resin | N/A | 12 × 12 × 60 nm | Rapid depletion of condensins resulted in chromatin disorganization and aberrant chromosome shapes with surface area twice as the size of normal chromosomes. Condensins are essential for maintaining chromosome architecture but do not effect chromatin compaction | [56] |
| GM12878 (lymphoblastoid) | Human | Cells | 4% paraformaldehyde, 2.5% glutaraldehyde | 1.4 nm nanogold particles, 1% tannic acid, 4% uranyl acetate | Epon | 4–6 | 7 × 7 × 50 nm 5 × 5 × 30 nm | 3D-EMISH, a combination of SBSFEM and fluorescence in situ hybridization was developed. 3D chromatin folding structures were visualized at targeted 1.7 Mb region of human genome in ultra-resolution. Heterogeneity in ultrastructure chromatin folding within individual nuclei was observed | [57] |
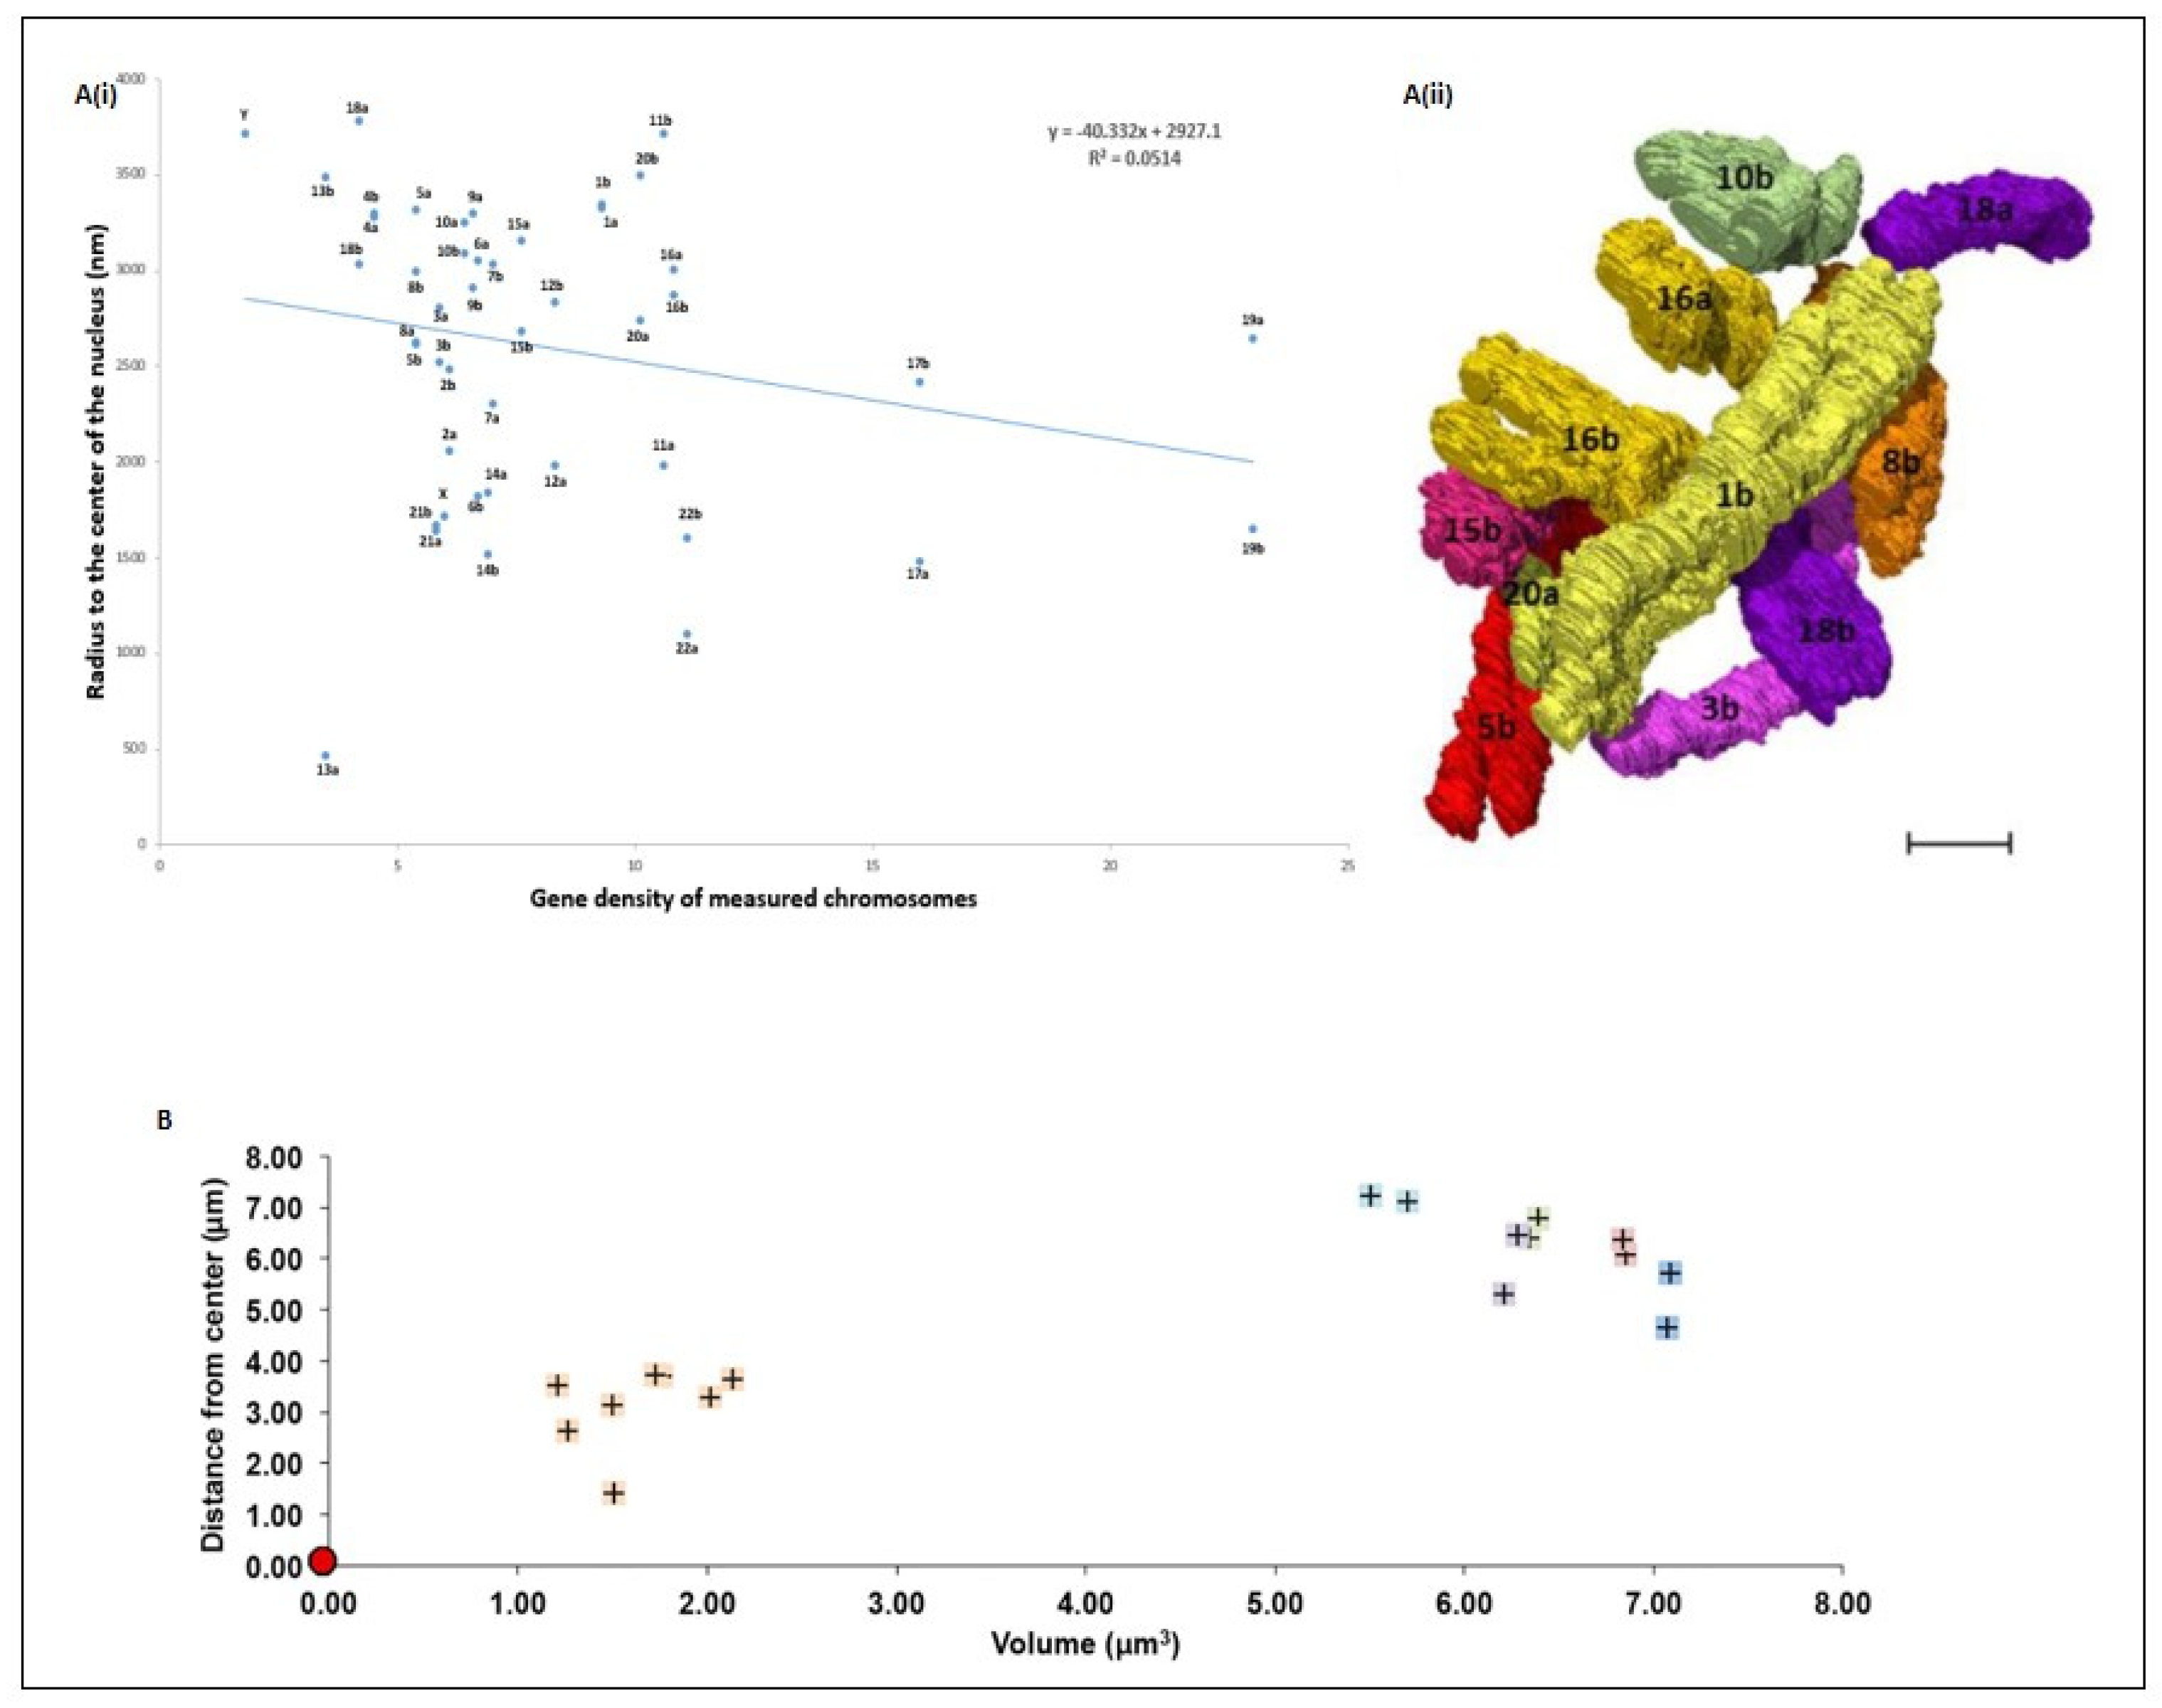
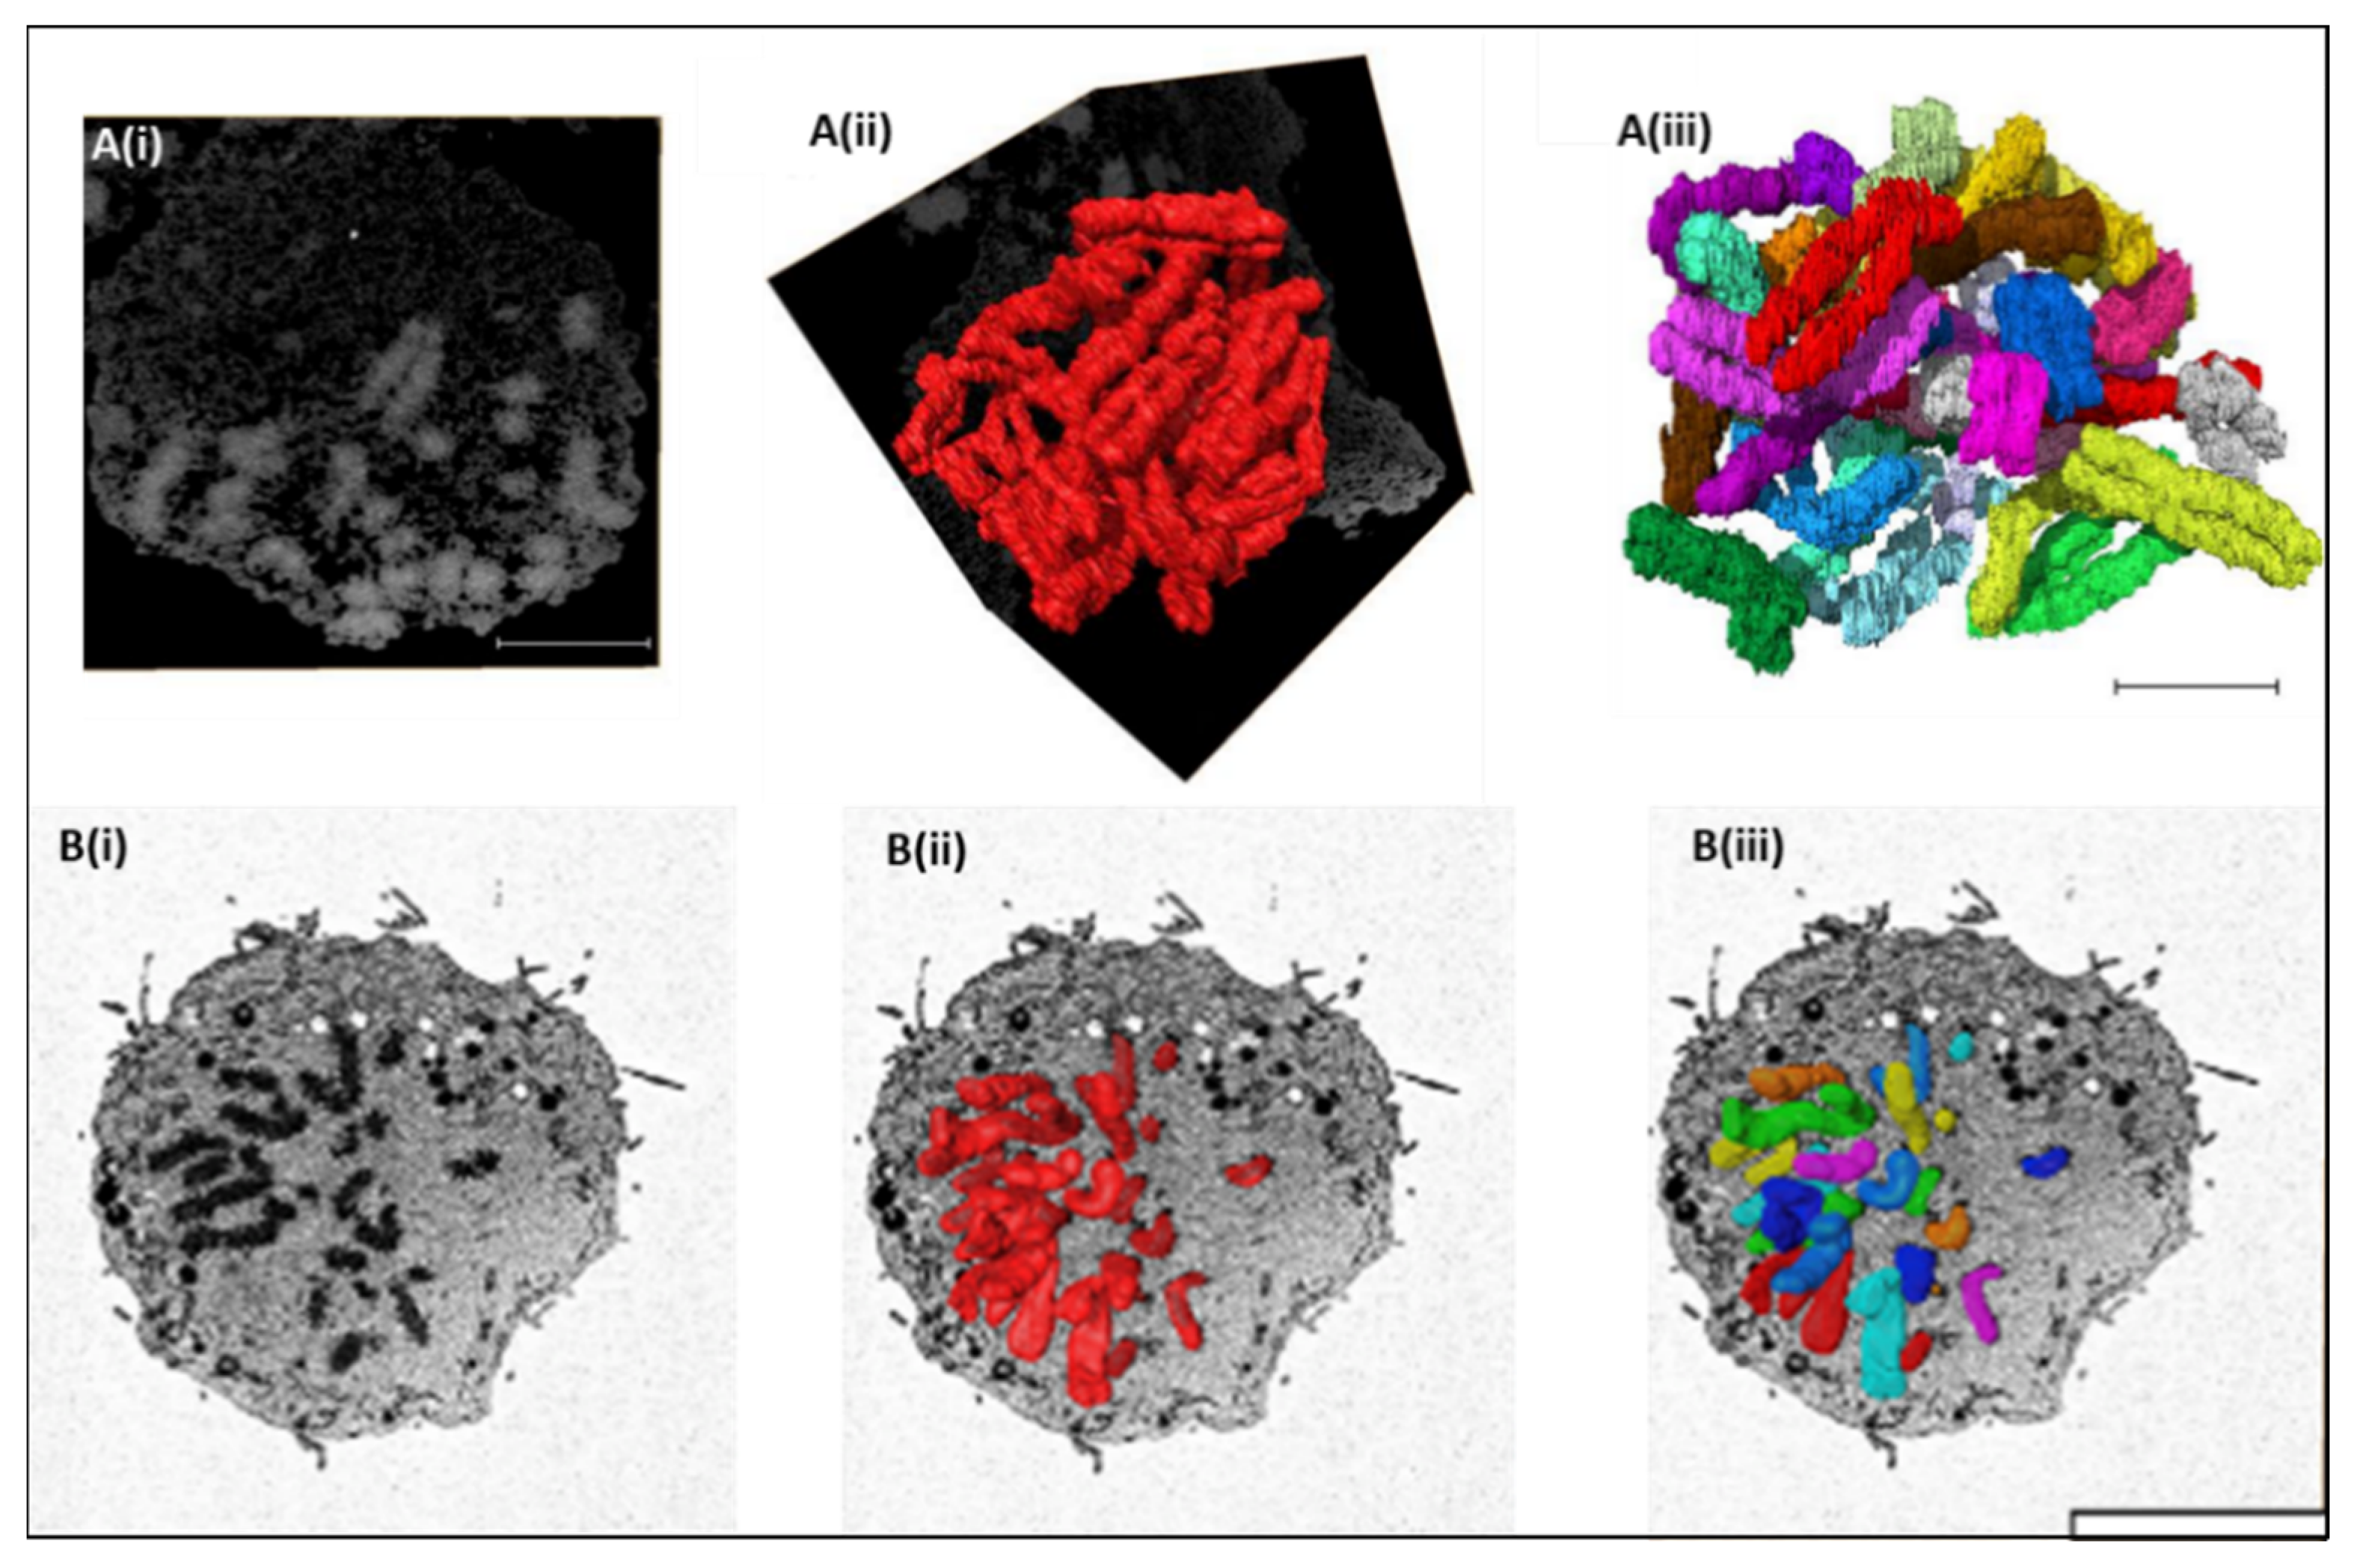
| B lymphocyte | Human | Nuclei | 2.5% (v/v) glutaraldehyde | 5 mM platinum blue | Agar 100 resin | 5 | 11 × 11 × 25 nm | 46 chromosomes were segmented and modelled from a single prophase nucleus. Each chromosome was identified and its radial organization within the nuclear space was determined. Chromosomes were found to follow a gene density based organization pattern. A neighborhood map for individual chromosomes was built | [44] |
4. Structural Examination of Chromosomes Using SBFSEM
5. Spatial Chromosome Organization Using SBFSEM
6. Way Forward
7. Conclusions
Author Contributions
Funding
Acknowledgments
Conflicts of Interest
References
- Flemming, W. Zellsubstanz, Kern und Zelltheilung; Vogel: Leipzig, Germany, 1882; pp. 1–472. [Google Scholar]
- Antonin, W.; Neumann, H. Chromosome Condensation and Decondensation during Mitosis. Curr. Opin. Cell Biol. 2016, 40, 15–22. [Google Scholar] [CrossRef] [PubMed] [Green Version]
- Naumova, N.; Imakaev, M.; Fudenberg, G.; Zhan, Y.; Lajoie, B.R.; Mirny, L.A.; Dekker, J. Organization of the Mitotic Chromosome. Science 2013, 342, 948–953. [Google Scholar] [CrossRef] [Green Version]
- Cremer, T.; Cremer, C. Chromosome Territories, Nuclear Architecture and Gene Regulation in Mammalian Cells. Nat. Rev. Genet. 2001, 2, 292–301. [Google Scholar] [CrossRef] [PubMed]
- Foster, H.A.; Bridger, J.M. The Genome and the Nucleus: A Marriage Made by Evolution. Genome Organisation and Nuclear Architecture. Chromosoma 2005, 114, 212–229. [Google Scholar] [CrossRef] [PubMed]
- Cremer, T.; Cremer, M. Chromosome Territories. Cold Spring Harb. Perspect. Biol. 2010, 2, a003889. [Google Scholar] [CrossRef] [PubMed] [Green Version]
- Meaburn, K.J.; Misteli, T. Cell Biology: Chromosome Territories. Nature 2007, 445, 379–781. [Google Scholar] [CrossRef] [PubMed]
- Fritz, A.J.; Sehgal, N.; Pliss, A.; Xu, J.; Berezney, R. Chromosome Territories and the Global Regulation of the Genome. Genes Chromosomes Cancer 2019, 58, 407–426. [Google Scholar] [CrossRef] [PubMed] [Green Version]
- Belmont, A.S. Nuclear Compartments: An Incomplete Primer to Nuclear Compartments, Bodies, and Genome Organization Relative to Nuclear Architecture. Cold Spring Harb. Perspect. Biol. 2021, a041268. [Google Scholar] [CrossRef]
- Mehta, I.S.; Kulashreshtha, M.; Chakraborty, S.; Kolthur-Seetharam, U.; Rao, B.J. Chromosome Territories Reposition during DNA Damage-Repair Response. Genome Biol. 2013, 14, R135. [Google Scholar] [CrossRef] [Green Version]
- Branco, M.R.; Pombo, A. Intermingling of Chromosome Territories in Interphase Suggests Role in Translocations and Transcription-Dependent Associations. PLoS Biol. 2006, 4, e138. [Google Scholar] [CrossRef] [PubMed] [Green Version]
- Fraser, P.; Bickmore, W. Nuclear Organization of the Genome and the Potential for Gene Regulation. Nature 2007, 447, 413–417. [Google Scholar] [CrossRef]
- Cremer, M.; Küpper, K.; Wagler, B.; Wizelman, L.; von Hase, J.; Weiland, Y.; Kreja, L.; Diebold, J.; Speicher, M.R.; Cremer, T. Inheritance of Gene Density-Related Higher Order Chromatin Arrangements in Normal and Tumor Cell Nuclei. J. Cell Biol. 2003, 162, 809–820. [Google Scholar] [CrossRef]
- Krietenstein, N.; Rando, O.J. Mesoscale Organization of the Chromatin Fiber. Curr. Opin. Genet. Dev. 2020, 61, 32–36. [Google Scholar] [CrossRef]
- Yusuf, M.; Kaneyoshi, K.; Fukui, K.; Robinson, I. Use of 3D Imaging for Providing Insights into High-Order Structure of Mitotic Chromosomes. Chromosoma 2019, 128, 7–13. [Google Scholar] [CrossRef] [Green Version]
- Woodcock, C.L.; Ghosh, R.P. Chromatin Higher-Order Structure and Dynamics. Cold Spring Harb. Perspect. Biol. 2010, 2, a000596. [Google Scholar] [CrossRef]
- Bendandi, A.; Dante, S.; Zia, S.R.; Diaspro, A.; Rocchia, W. Chromatin Compaction Multiscale Modeling: A Complex Synergy Between Theory, Simulation, and Experiment. Front. Mol. Biosci. 2020, 7, 15. [Google Scholar] [CrossRef] [PubMed] [Green Version]
- Paulson, J.R.; Hudson, D.F.; Cisneros-Soberanis, F.; Earnshaw, W.C. Mitotic Chromosomes. Semin. Cell Dev. Biol. 2021, 117, 7–29. [Google Scholar] [CrossRef]
- Chen, B.-C.; Legant, W.R.; Wang, K.; Shao, L.; Milkie, D.E.; Davidson, M.W.; Janetopoulos, C.; Wu, X.S.; Hammer, J.A.; Liu, Z.; et al. Lattice Light-Sheet Microscopy: Imaging Molecules to Embryos at High Spatiotemporal Resolution. Science 2014, 346, 1257998. [Google Scholar] [CrossRef] [PubMed] [Green Version]
- Yamashita, N.; Morita, M.; Legant, W.R.; Chen, B.-C.; Betzig, E.; Yokota, H.; Mimori-Kiyosue, Y. Three-Dimensional Tracking of plus-Tips by Lattice Light-Sheet Microscopy Permits the Quantification of Microtubule Growth Trajectories within the Mitotic Apparatus. J. Biomed. Opt. 2015, 20, 101206. [Google Scholar] [CrossRef] [PubMed]
- Mimori-Kiyosue, Y. Imaging Mitotic Processes in Three Dimensions with Lattice Light-Sheet Microscopy. Chromosome Res. 2021, 29, 37–50. [Google Scholar] [CrossRef]
- Abbe, E. Beiträge zur Theorie des Mikroskops und der mikroskopischen Wahrnehmung. Arch. Mikrosk. Anat. 1873, 9, 413–468. [Google Scholar] [CrossRef]
- Botchway, S.W.; Farooq, S.; Sajid, A.; Robinson, I.K.; Yusuf, M. Contribution of Advanced Fluorescence Nano Microscopy towards Revealing Mitotic Chromosome Structure. Chromosome Res. 2021, 29, 19–36. [Google Scholar] [CrossRef] [PubMed]
- Nishino, Y.; Takahashi, Y.; Imamoto, N.; Ishikawa, T.; Maeshima, K. Three-Dimensional Visualization of a Human Chromosome Using Coherent X-Ray Diffraction. Phys. Rev. Lett. 2009, 102, 018101. [Google Scholar] [CrossRef]
- Song, C.; Takagi, M.; Park, J.; Xu, R.; Gallagher-Jones, M.; Imamoto, N.; Ishikawa, T. Analytic 3D Imaging of Mammalian Nucleus at Nanoscale Using Coherent X-Rays and Optical Fluorescence Microscopy. Biophys. J. 2014, 107, 1074–1081. [Google Scholar] [CrossRef] [Green Version]
- Nellist, P.D.; Chisholm, M.F.; Dellby, N.; Krivanek, O.L.; Murfitt, M.F.; Szilagyi, Z.S.; Lupini, A.R.; Borisevich, A.; Sides, W.H.; Pennycook, S.J. Direct Sub-Angstrom Imaging of a Crystal Lattice. Science 2004, 305, 1741. [Google Scholar] [CrossRef] [PubMed]
- Eltsov, M.; MacLellan, K.M.; Maeshima, K.; Frangakis, A.S.; Dubochet, J. Analysis of Cryo-Electron Microscopy Images Does Not Support the Existence of 30-Nm Chromatin Fibers in Mitotic Chromosomes in Situ. Proc. Natl. Acad. Sci. USA 2008, 105, 19732–19737. [Google Scholar] [CrossRef] [PubMed] [Green Version]
- Daban, J.R. Soft-matter properties of multilayer chromosomes. Phys. Biol. 2021, 18, 053001. [Google Scholar] [CrossRef]
- Ris, H. Stereoscopic Electron Microscopy of Chromosomes. Methods Cell Biol. 1981, 22, 77–96. [Google Scholar] [CrossRef]
- Engelhardt, P. Electron Tomography of Chromosome Structure. In Encyclopedia of Analytical Chemistry; Meyers, R.A., Ed.; John Wiley & Sons, Ltd.: Chichester, UK, 2006; ISBN 978-0-471-97670-7. [Google Scholar]
- Adolph, K.W. A Serial Sectioning Study of the Structure of Human Mitotic Chromosomes. Eur. J. Cell Biol. 1981, 24, 146–153. [Google Scholar]
- Belmont, A.S.; Sedat, J.W.; Agard, D.A. A Three-Dimensional Approach to Mitotic Chromosome Structure: Evidence for a Complex Hierarchical Organization. J. Cell Biol. 1987, 105, 77–92. [Google Scholar] [CrossRef]
- Harauz, G.; Borland, L.; Bahr, G.F.; Zeitler, E.; van Heel, M. Three-Dimensional Reconstruction of a Human Metaphase Chromosome from Electron Micrographs. Chromosoma 1987, 95, 366–374. [Google Scholar] [CrossRef]
- Ou, H.D.; Phan, S.; Deerinck, T.J.; Thor, A.; Ellisman, M.H.; O’Shea, C.C. ChromEMT: Visualizing 3D Chromatin Structure and Compaction in Interphase and Mitotic Cells. Science 2017, 357, eaag0025. [Google Scholar] [CrossRef] [Green Version]
- Goggin, P.; Ho, E.M.L.; Gnaegi, H.; Searle, S.; Oreffo, R.O.C.; Schneider, P. Development of Protocols for the First Serial Block-Face Scanning Electron Microscopy (SBF SEM) Studies of Bone Tissue. Bone 2020, 131, 115107. [Google Scholar] [CrossRef]
- Titze, B.; Genoud, C. Volume Scanning Electron Microscopy for Imaging Biological Ultrastructure. Biol. Cell 2016, 108, 307–323. [Google Scholar] [CrossRef] [PubMed]
- Peddie, C.J.; Collinson, L.M. Exploring the Third Dimension: Volume Electron Microscopy Comes of Age. Micron Oxf. Engl. 1993 2014, 61, 9–19. [Google Scholar] [CrossRef] [PubMed]
- Yonehara, K.; Baba, N.; Kanaya, K. Application of Ion-Beam Etching Techniques to the Fine Structure of Biological Specimens as Examined with a Field Emission SEM at Low Voltage. J. Electron Microsc. Tech. 1989, 12, 71–77. [Google Scholar] [CrossRef]
- Schroeder-Reiter, E.; Pérez-Willard, F.; Zeile, U.; Wanner, G. Focused Ion Beam (FIB) Combined with High Resolution Scanning Electron Microscopy: A Promising Tool for 3D Analysis of Chromosome Architecture. J. Struct. Biol. 2008, 165, 97–106. [Google Scholar] [CrossRef] [PubMed]
- Hamano, T.; Dwiranti, A.; Kaneyoshi, K.; Fukuda, S.; Kometani, R.; Nakao, M.; Takata, H.; Uchiyama, S.; Ohmido, N.; Fukui, K. Chromosome Interior Observation by Focused Ion Beam/Scanning Electron Microscopy (FIB/SEM) Using Ionic Liquid Technique. Microsc. Microanal. 2014, 20, 1340–1347. [Google Scholar] [CrossRef] [PubMed]
- Poonperm, R.; Takata, H.; Hamano, T.; Matsuda, A.; Uchiyama, S.; Hiraoka, Y.; Fukui, K. Chromosome Scaffold Is a Double-Stranded Assembly of Scaffold Proteins. Sci. Rep. 2015, 5, 11916. [Google Scholar] [CrossRef] [Green Version]
- Sasakura, S.; Yoshida, A.; Wako, T.; Kaneyoshi, K.; Poonperm, R.; Ogawa, S.; Kato, J.; Otsuka, Y.; Takata, H.; Uchiyama, S.; et al. Structural Analysis of Human Chromosome by FIB/SEM. Chromosome Sci. 2016, 19, 25–31. [Google Scholar] [CrossRef]
- Denk, W.; Horstmann, H. Serial Block-Face Scanning Electron Microscopy to Reconstruct Three-Dimensional Tissue Nanostructure. PLoS Biol. 2004, 2, e329. [Google Scholar] [CrossRef] [PubMed]
- Sajid, A.; Lalani, E.-N.; Chen, B.; Hashimoto, T.; Griffin, D.K.; Bhartiya, A.; Thompson, G.; Robinson, I.K.; Yusuf, M. Ultra-Structural Imaging Provides 3D Organization of 46 Chromosomes of a Human Lymphocyte Prophase Nucleus. Int. J. Mol. Sci. 2021, 22, 5987. [Google Scholar] [CrossRef] [PubMed]
- Leighton, S.B. SEM Images of Block Faces, Cut by a Miniature Microtome within the SEM—A Technical Note. Scan. Electron Microsc. 1981, Pt 2, 73–76. [Google Scholar]
- Zankel, A.; Kraus, B.; Poelt, P.; Schaffer, M.; Ingolic, E. Ultramicrotomy in the ESEM, a Versatile Method for Materials and Life Sciences. J. Microsc. 2009, 233, 140–148. [Google Scholar] [CrossRef] [PubMed]
- Ronchi, P.; Mizzon, G.; Machado, P.; D’Imprima, E.; Best, B.T.; Cassella, L.; Schnorrenberg, S.; Montero, M.G.; Jechlinger, M.; Ephrussi, A.; et al. High-Precision Targeting Workflow for Volume Electron Microscopy. J. Cell Biol. 2021, 220, e202104069. [Google Scholar] [CrossRef] [PubMed]
- Hashimoto, T.; Thompson, G.E.; Curioni, M.; Zhou, X.R.; Skeldon, P. Three Dimensional Imaging of Light Metals Using Serial Block Face Scanning Electron Microscopy (SBFSEM). Mater. Sci. Forum 2013, 765, 501–505. [Google Scholar] [CrossRef]
- Chen, B.; Yusuf, M.; Hashimoto, T.; Estandarte, A.K.; Thompson, G.; Robinson, I. Three-Dimensional Positioning and Structure of Chromosomes in a Human Prophase Nucleus. Sci. Adv. 2017. [Google Scholar] [CrossRef] [Green Version]
- He, Q.; Hsueh, M.; Zhang, G.; Joy, D.C.; Leapman, R.D. Biological Serial Block Face Scanning Electron Microscopy at Improved Z-Resolution Based on Monte Carlo Model. Sci. Rep. 2018, 8, 12985. [Google Scholar] [CrossRef] [PubMed] [Green Version]
- Lipke, E.; Hörnschemeyer, T.; Pakzad, A.; Booth, C.R.; Michalik, P. Serial Block-Face Imaging and Its Potential for Reconstructing Diminutive Cell Systems: A Case Study from Arthropods. Microsc. Microanal. Off. J. Microsc. Soc. Am. Microbeam Anal. Soc. Microsc. Soc. Can. 2014, 20, 946–955. [Google Scholar] [CrossRef]
- Hennig, P.; Denk, W. Point-Spread Functions for Backscattered Imaging in the Scanning Electron Microscope. J. Appl. Phys. 2007, 102, 123101. [Google Scholar] [CrossRef] [Green Version]
- Rouquette, J.; Genoud, C.; Vazquez-Nin, G.H.; Kraus, B.; Cremer, T.; Fakan, S. Revealing the High-Resolution Three-Dimensional Network of Chromatin and Interchromatin Space: A Novel Electron-Microscopic Approach to Reconstructing Nuclear Architecture. Chromosome Res. Int. J. Mol. Supramol. Evol. Asp. Chromosome Biol. 2009, 17, 801–810. [Google Scholar] [CrossRef] [PubMed]
- Booth, D.G.; Beckett, A.J.; Molina, O.; Samejima, I.; Masumoto, H.; Kouprina, N.; Larionov, V.; Prior, I.A.; Earnshaw, W.C. 3D-CLEM Reveals That a Major Portion of Mitotic Chromosomes Is Not Chromatin. Mol. Cell 2016, 64, 790–802. [Google Scholar] [CrossRef] [PubMed]
- Yusuf, M.; Chen, B.; Hashimoto, T.; Estandarte, A.K.; Thompson, G.; Robinson, I. Staining and Embedding of Human Chromosomes for 3-d Serial Block-Face Scanning Electron Microscopy. BioTechniques 2014, 57, 302–307. [Google Scholar] [CrossRef] [PubMed]
- Samejima, K.; Booth, D.G.; Ogawa, H.; Paulson, J.R.; Xie, L.; Watson, C.A.; Platani, M.; Kanemaki, M.T.; Earnshaw, W.C. Functional Analysis after Rapid Degradation of Condensins and 3D-EM Reveals Chromatin Volume Is Uncoupled from Chromosome Architecture in Mitosis. J. Cell Sci. 2018, 131, jcs210187. [Google Scholar] [CrossRef] [Green Version]
- Trzaskoma, P.; Ruszczycki, B.; Lee, B.; Pels, K.K.; Krawczyk, K.; Bokota, G.; Szczepankiewicz, A.A.; Aaron, J.; Walczak, A.; Śliwińska, M.A.; et al. Ultrastructural Visualization of 3D Chromatin Folding Using Volume Electron Microscopy and DNA in Situ Hybridization. Nat. Commun. 2020, 11, 2120. [Google Scholar] [CrossRef] [PubMed]
- Polishchuk, E.V.; Polishchuk, R.S.; Luini, A. Correlative Light-Electron Microscopy as a Tool to Study in Vivo Dynamics and Ultrastructure of Intracellular Structures. Methods Mol. Biol. Clifton NJ 2013, 931, 413–422. [Google Scholar] [CrossRef]
- Uchiyama, S.; Kobayashi, S.; Takata, H.; Ishihara, T.; Hori, N.; Higashi, T.; Hayashihara, K.; Sone, T.; Higo, D.; Nirasawa, T.; et al. Proteome Analysis of Human Metaphase Chromosomes. J. Biol. Chem. 2005, 280, 16994–17004. [Google Scholar] [CrossRef] [Green Version]
- Ohta, S.; Bukowski-Wills, J.-C.; Sanchez-Pulido, L.; de Lima Alves, F.; Wood, L.; Chen, Z.A.; Platani, M.; Fischer, L.; Hudson, D.F.; Ponting, C.P.; et al. The Protein Composition of Mitotic Chromosomes Determined Using Multiclassifier Combinatorial Proteomics. Cell 2010, 142, 810–821. [Google Scholar] [CrossRef] [Green Version]
- Phengchat, R.; Takata, H.; Morii, K.; Inada, N.; Murakoshi, H.; Uchiyama, S.; Fukui, K. Calcium Ions Function as a Booster of Chromosome Condensation. Sci. Rep. 2016, 6, 38281. [Google Scholar] [CrossRef] [Green Version]
- Dwiranti, A.; Takata, H.; Fukui, K. Reversible Changes of Chromosome Structure upon Different Concentrations of Divalent Cations. Microsc. Microanal. Off. J. Microsc. Soc. Am. Microbeam Anal. Soc. Microsc. Soc. Can. 2019, 25, 817–821. [Google Scholar] [CrossRef] [Green Version]
- Yusuf, M.; Farooq, S.; Robinson, I.; Lalani, E.-N. Cryo-Nanoscale Chromosome Imaging—Future Prospects. Biophys. Rev. 2020, 12, 1257–1263. [Google Scholar] [CrossRef] [PubMed]


Publisher’s Note: MDPI stays neutral with regard to jurisdictional claims in published maps and institutional affiliations. |
© 2022 by the authors. Licensee MDPI, Basel, Switzerland. This article is an open access article distributed under the terms and conditions of the Creative Commons Attribution (CC BY) license (https://creativecommons.org/licenses/by/4.0/).
Share and Cite
Yusuf, M.; Sajid, A.; Robinson, I.K.; Lalani, E.-N. 3D Ultrastructural Imaging of Chromosomes Using Serial Block-Face Scanning Electron Microscopy (SBFSEM). DNA 2022, 2, 30-43. https://doi.org/10.3390/dna2010003
Yusuf M, Sajid A, Robinson IK, Lalani E-N. 3D Ultrastructural Imaging of Chromosomes Using Serial Block-Face Scanning Electron Microscopy (SBFSEM). DNA. 2022; 2(1):30-43. https://doi.org/10.3390/dna2010003
Chicago/Turabian StyleYusuf, Mohammed, Atiqa Sajid, Ian K. Robinson, and El-Nasir Lalani. 2022. "3D Ultrastructural Imaging of Chromosomes Using Serial Block-Face Scanning Electron Microscopy (SBFSEM)" DNA 2, no. 1: 30-43. https://doi.org/10.3390/dna2010003
APA StyleYusuf, M., Sajid, A., Robinson, I. K., & Lalani, E.-N. (2022). 3D Ultrastructural Imaging of Chromosomes Using Serial Block-Face Scanning Electron Microscopy (SBFSEM). DNA, 2(1), 30-43. https://doi.org/10.3390/dna2010003