Review

3D Ultrastructural Imaging of Chromosomes Using Serial Block-Face Scanning Electron Microscopy (SBFSEM)

1
Centre for Regenerative Medicine and Stem Cell Research, Aga Khan University, Karachi 74800, Pakistan
2
London Centre for Nanotechnology, University College London, London WC1H 0AH, UK
3
Brookhaven National Laboratory, Upton, NY 11973, USA
*
Author to whom correspondence should be addressed.
DNA 2022, 2(1), 30-43; https://doi.org/10.3390/dna2010003
Submission received: 10 January 2022 / Revised: 24 January 2022 / Accepted: 28 January 2022 / Published: 5 February 2022

Abstract

:
To date, our understanding of how DNA is packaged in the cell nucleus, condensed from chromatin into chromosomes, and organized throughout the cell cycle remains sparse. Three dimensional (3D) ultrastructural imaging is an important tool for unravelling the organizational structure of chromosomes. For large volume 3D imaging of biological samples, serial block-face scanning electron microscopy (SBFSEM) has been applied, whereby ultrastructural information is achieved by analyzing 3D reconstructions acquired from measured data sets. In this review, we summarize the contribution of SBFSEM for obtaining 3D images of chromosomes to investigate their ultrastructure and organization in the cell and its nucleus. Furthermore, this review highlights the potential of SBFSEM for advancing 3D chromosome research.

Graphical Abstract

1. Introduction

Microscopy has contributed significantly to our understanding of chromatin/chromosome biology, providing insights into their structure, compaction, and organization. Flemming, in 1882, observed and illustrated chromosomes using a light microscope and coined the term mitosis [1]. Throughout the cell cycle, chromatin condenses and undergoes conformational changes from interphase to metaphase [2,3] occupying non-random chromosomal territories (CTs) [4] (reviewed in [5,6,7,8,9]). These CTs are essential for maintaining overall genome stability and function; however, their spatial positioning in different cells and disease types is unclear and needs further investigation [10,11,12,13]. Another aspect that requires interpretation is how nucleosomes, the ‘building blocks’ of the chromosome, fold into high order structures such as the controversial 30 nm structure (reviewed in [14,15,16,17,18]). It is clear that 3D high-resolution imaging is a pre-requisite in addressing unresolved questions related to the spatial organization and structure of chromosomes.
Several fluorescence imaging modalities, including Confocal Laser Scanning Microscopy (CLSM) and, more recently, light-sheet fluorescence microscopy (LSFM) [19,20,21], have been used to study the live dynamic processes of chromatin condensation and segregation. Fluorescence 3D volume imaging, although useful, has limitations. Its light diffraction is limited to ~200 nm, making it challenging to resolve the smaller chromatin structures [22]. Super-resolution microscopy techniques are under development and can attain a resolution far beyond the diffraction limit of light; however, z resolution is still less than that can be achieved by a factor of 2 laterally [23].
Hard X-ray microscopy has been used to image intact chromosomes [24] and nuclei with nuclear substructures including condensed chromatin [25] in 3D using coherent diffraction imaging (CDI) after tilting the sample at different angles. In comparison, electron microscopy (EM) provides resolutions ranging from nanometers down to below an ångström [26] and has been extensively used to examine the chromosome high order structure and compaction [27]. Transmission electron microscopy (TEM) observations have shown that the metaphase chromosomes have a multilayered structure, whereby each individual layer has the width corresponding to a mononucleosome sheet and has been reviewed [28]. TEM requires the sample thickness to be below 100 nm [29]; therefore, intact chromosomes (over 1 micron thick) would require manual sectioning before imaging. TEM tomography has been performed on chemically treated chromosomes [30] and after serial sections have been collected and aligned in sequence to study the organization of mitotic chromosomes [31]. Furthermore, 3D image reconstructions have been made after sectioning chromosomes and taking micrographs of serial tilted images (generally tilted by ±70°) [32,33]. Recently, ChromEMT (ChromEM tomography) with improved labelling has been applied to study the 3D ultrastructure of chromatin and mitotic chromosomes after sectioning samples embedded in resin [34]. The serial section TEM (ssTEM) method is useful but poses challenges as it is susceptible to artefacts such as shrinking, distortion and section loss. It also requires manual image alignment of sections and is restricted to minimal volumes [35].
Robust automated volume SEM techniques have been developed that have revolutionized EM (reviewed in [36,37]). The focused ion beam SEM (FIB-SEM) approach uses an ion source (Gallium (G+) ions) that removes thin layers (down to 5 nm) of the sample, followed by automatic imaging of the exposed surface by the SEM [36,37,38], and has been applied to chromosomes [39,40,41,42]. This method, although practical, has a narrow field of view (~20 μm2) and a slow sputtering speed. Faster cutting speed and a larger field of view (up to ~800 μm2) can be achieved using serial block-face scanning electron microscopy (SBFSEM) that allows physical sectioning of the sample using a diamond knife instead of focused G+ ions [35,43]. This approach has been applied to chromosomes and is the review’s focus. This article has been prepared for the special issue for the Joint Meeting of the 23rd International Chromosome Conference (ICC) and the 24th International Colloquium in Animal Cytogenetics and Genomics (ICACG) that took place between 13–17 July 2021, where our work on SBFSEM of prophase chromosomes was presented [44]. Hence, this review focuses on the contribution of SBFSEM in unravelling the chromosome ultrastructure and their organization in 3D and discusses its potential application in furthering our understanding of chromosome science.

2. SBFSEM Method

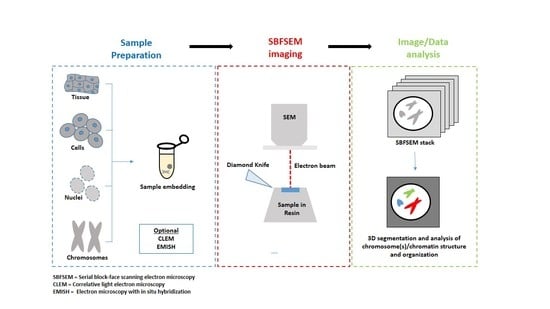
Nanoscale 3D imaging of large biological sample volumes can be achieved using SBFSEM [43]. The concept was first proposed in 1981 [45] and initially commercialized as 3view™ (Gatan, Abingdon, UK) [46], a fully automated sectioning and image collection system. This approach gives a high cutting speed and a wide area cutting [47]. The spatial resolution is determined by the lateral (x–y) and slice thickness in the z-direction [48]. In the x–y plane, a pixel size of 3–4 nm is possible [47], and in the z-direction, the voxel size is approximately 20–25 nm [49,50]. A schematic of the SBFSEM workflow is shown in Figure 1.
An extensive sample preparation procedure similar to preparation procedures for TEM is crucial for obtaining good quality images [43]. First, the sample is fixed using aldehydes followed by heavy metal staining to enhance contrast for high electron density. The sample is then dehydrated and infiltrated with resin, followed by embedding and polymerization before imaging [51]. Choices of fixatives (including glutaraldehyde and formaldehyde), heavy metal stains (e.g., osmium, uranium, lead, platinum, etc.), and resins (e.g., Epon812, Hard Plus, Spurr’s, Durcupan, etc.) are used dependent on the sample type being imaged. Overall, the sample must be able to (i) withstand the vacuum, the high energy, including the current of the electron beam, (ii) give suitable image contrast and (iii) be structurally rigid [36].
Before the sample is mounted in an SBFSEM chamber, the resin block face must be trimmed to a suitable size and pyramidal shape. It is coated with a metallic layer (e.g., gold) to prevent charging. The sample is mounted in the SEM chamber from which air is pumped out to generate a vacuum. Thereafter electron beam energies of 1–3 keV are typically applied [52]. The block surface of the specimen is imaged using SEM, and a backscattered electron (BSE) detector is used to collect the signal from heavy atoms [50]. The procedure involves sectioning using a diamond knife in the built-in ultramicrotome that resides in the chamber of the SEM. After imaging the block face, the specimen height is raised (generally between 25–100 nm) and the newly exposed surface is imaged, and the removed slice is discarded. This cut-and-image cycle is left to run continuously, acquiring thousands of aligned serial images, making it a fully automated process (Figure 1). Normal practice is to leave the SBFSEM running overnight, which acquires approximately 1000 images. A total of 345 images (11 × 11 × 25 nm) [44] took approximately 6.5 h.
Acquired data stacks are then reconstructed and analyzed using different software packages such as DigitalMicrograph® 3.5 (Gatan 3View® system software), Fiji, Imaris, Amira, Avizo and Ilasktik, providing unique and vital 3D information. This includes quantification by measuring various parameters of the sample, i.e., shape, volume, distribution [35]. Figure 1B(i–iii) shows an example of three sections from a data stack with segmented boundaries of a chromosome. Figure 1B(iv) shows a single chromosome after reconstruction [44].
Below we highlight the studies that have been carried out to date in applying SBFSEM for analyzing chromatin and chromosomes. The experimental conditions and findings of these studies are summarized in Table 1.

3. SBFSEM 3D Reconstruction of Chromatin and Chromosomes

Rouquette and colleagues applied SBFSEM to examine the global chromatin architecture of rat interphase nuclei with 20 × 20 nm resolution in x–y and 50 nm in the z-direction [53]. This study demonstrated that it is possible to image intact nuclei from tissues. The study used the pre-embedding NAMA-Ur method for DNA visualization on rat liver cells. This allowed both the chromatin and the interchromatin space to be segmented and 3D reconstructions showed a filled nuclear volume [53]. Two cell types were examined that showed a significant difference in the DNA/chromatin proportion to the nuclear volume (41.7% in endothelial cells and 66.2% in hepatocytes). This study showed that the interchromatin space occupies a large part of the nuclear volume [53].
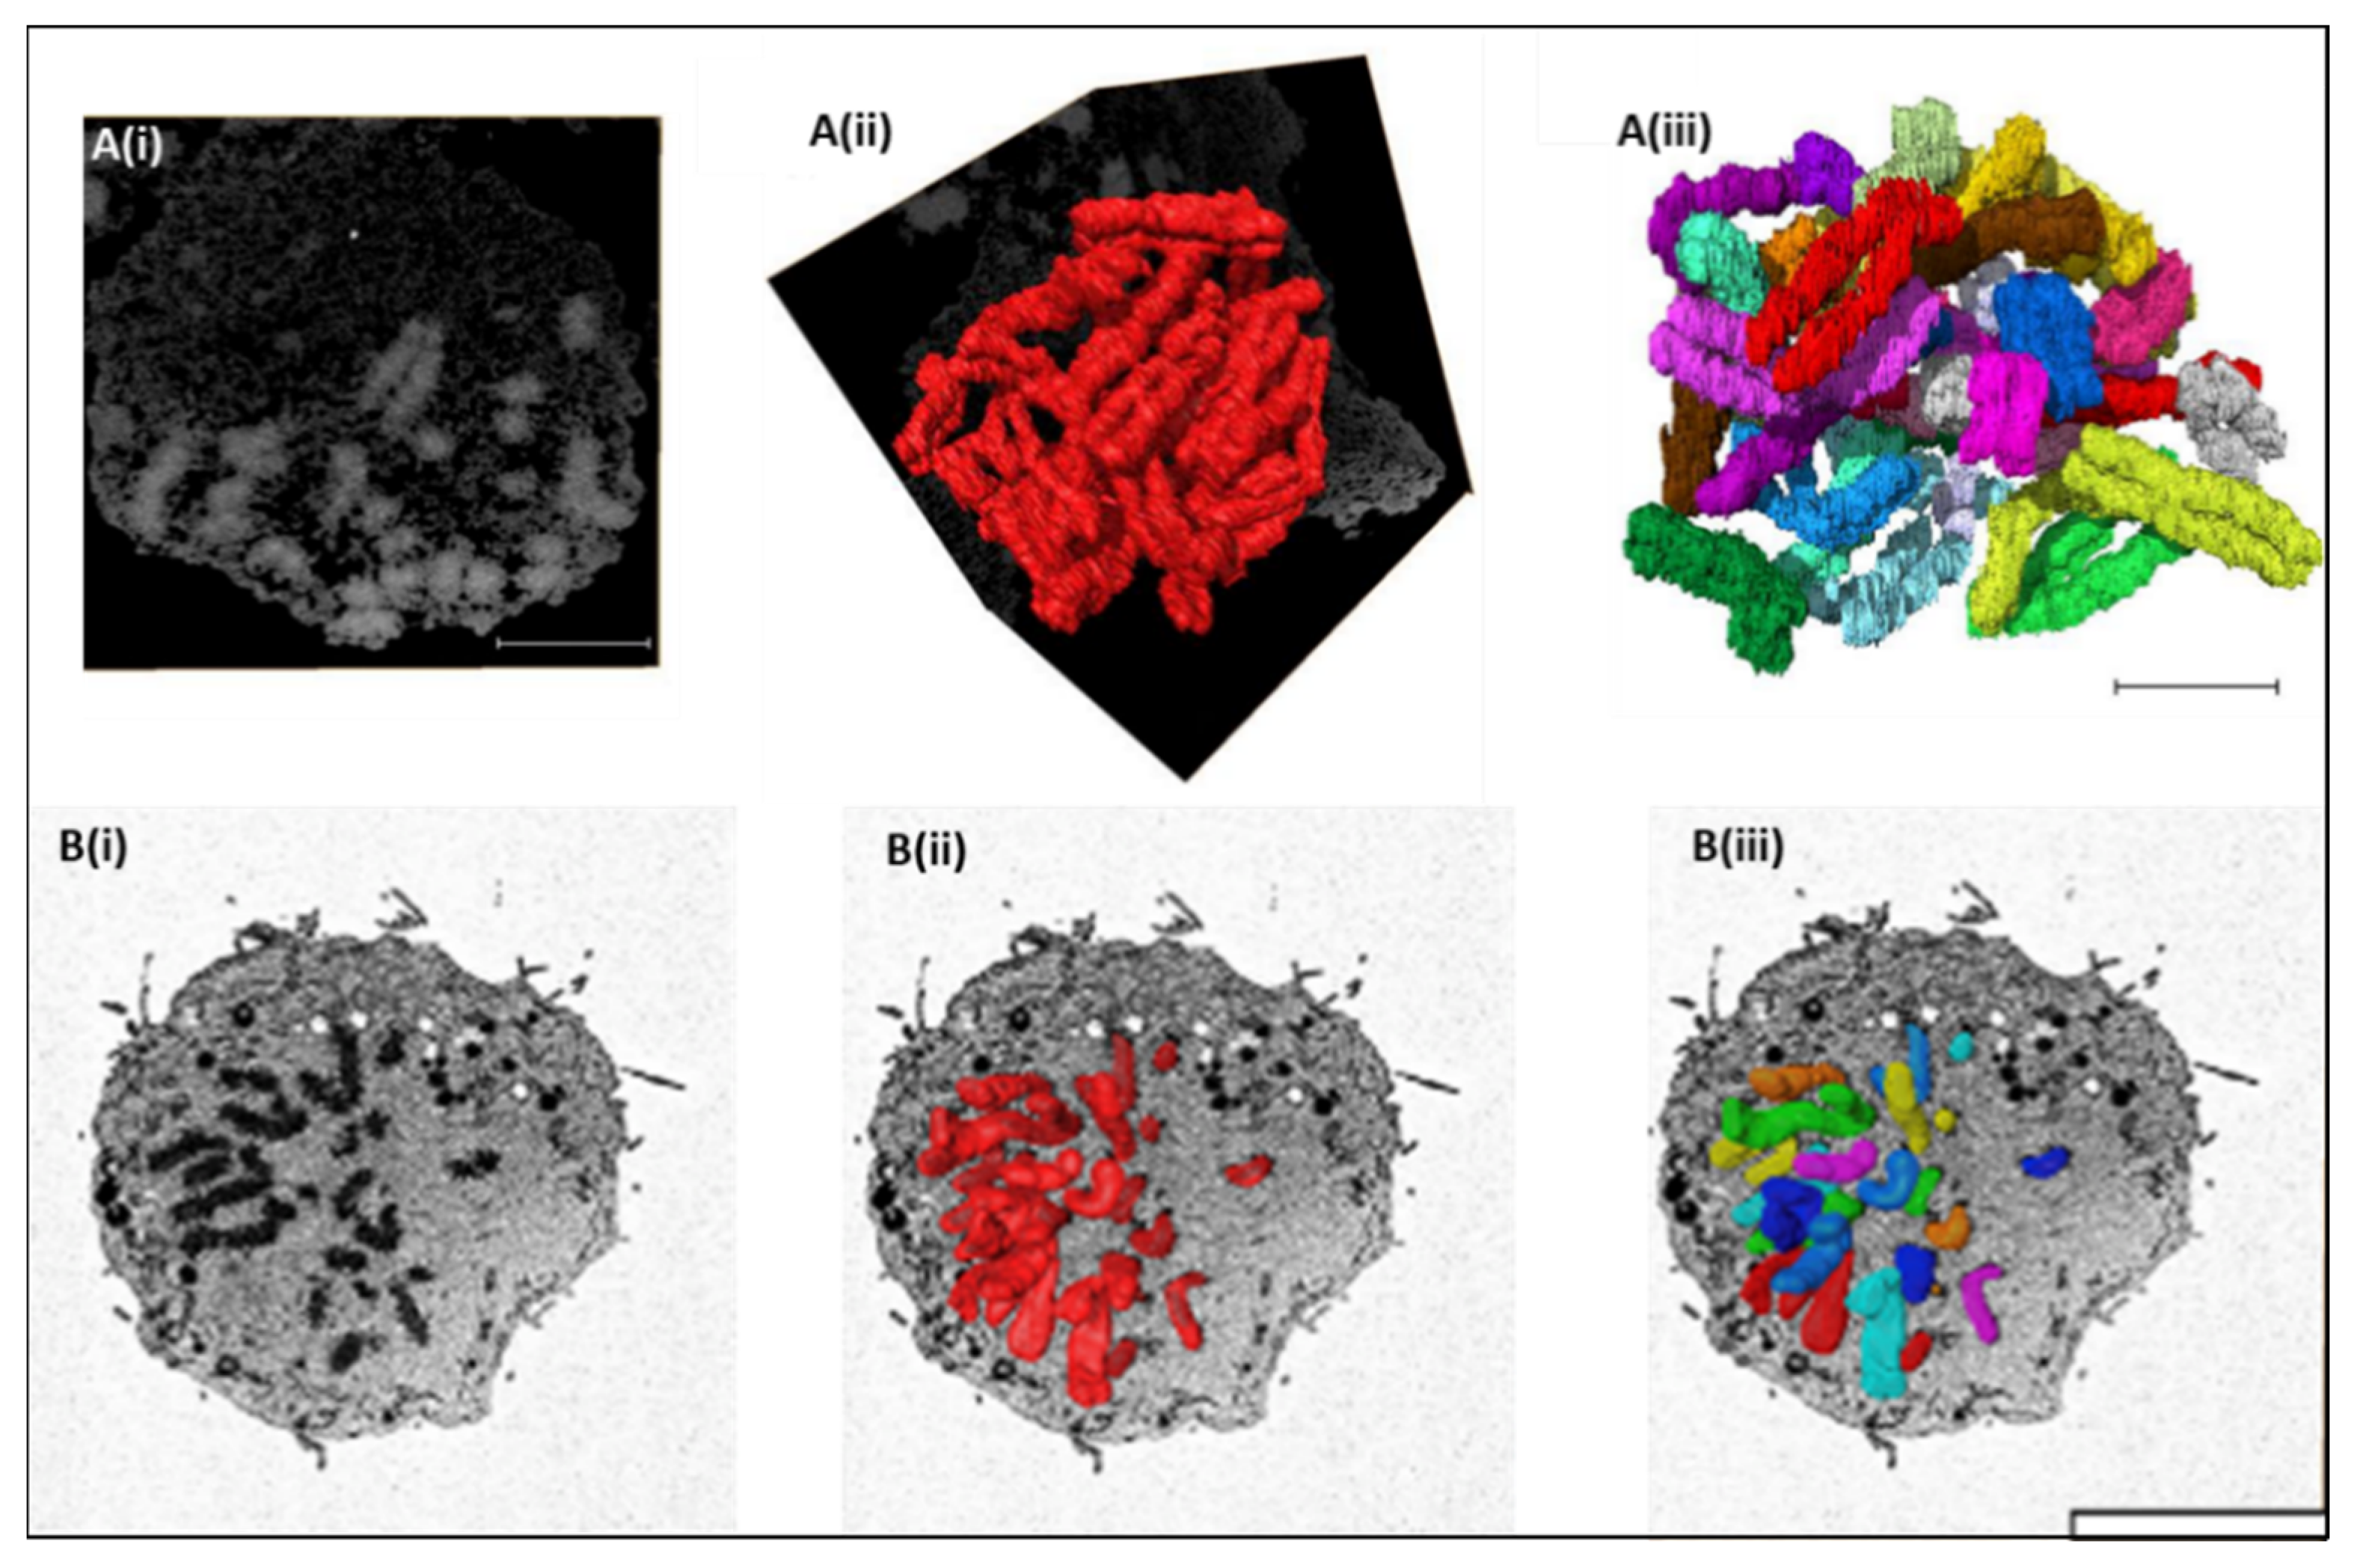
Several other groups have applied SBFSEM to study prophase chromosomes [44,49,54]. Booth et al. examined an early prophase nucleus from a human Retinal Pigment Epithelium (RPE1) cell line and mapped 43 chromosomes after staining with reduced osmium. Overall, a 24 × 24 × 60 nm resolution, in x, y, and z, respectively, was achieved [54]. Chromosomes in late prophase have also been examined after sufficient contrast was obtained from platinum blue staining [44,49]. In the first attempt, 36 out of 46 chromosomes were captured in a human lymphocyte prophase nucleus with a voxel size of 11 × 11 × 20 nm [49]. A complete lymphocyte late prophase nucleus containing all 46 chromosomes was recently imaged using a voxel size of 11 × 11 × 25 nm (Figure 2A(i)). Segmentation (Figure 2A(ii)) and 3D reconstruction (Figure 2A(iii)) of all chromosomes was performed from a stack of 345 images [44]. The chromosome morphology, length, volume and DNA content measurements were used to identify chromosomes into their respective pairs and cytogenetic groups. Chromosomes at late prophase have displayed parallel-aligned sister chromatids with no cross-overs and curved morphologies [44,49]. A compact axial structure seen on the core of prophase chromosomes allowed the assembly of a first-ever 3D karyotype [44].
The complete set of RPE1 chromosomes at metaphase have also been imaged, segmented and modelled using SBFSEM with a voxel size of 24 × 24 × 60 nm from a total of 300 images (Figure 2B(i–iii)). The largest chromosomes (1–3) and (4 and 5) and smallest chromosomes (19–22) were identified based on their volumes, surface areas and centromere position. At metaphase, chromosomes were shown to occupy 23% lesser surface area compared to prophase chromosomes, mainly due to increased chromatin condensation and surface smoothness. Furthermore, the metaphase chromosomes showed 38% greater total volume than that of prophase chromosomes. The periphery comprises 30–47% of the entire chromosome volume after analyzing wild-type and Ki-67-depleted chromosomes [54].
Table 1. SBFSEM studies performed on chromatin and chromosomes.
Cell typeSpeciesSample TypeFixationStainingResin TypeSEM Energy (kv)Resolution (x,y,z)FindingsReference
Hepatocyte and endothelialRatTissue3% glutaraldehyde, 4% paraformaldehyde and methanol-acetic anhydride (5:1 v/v)NAMA-Ur and uranyl acetateEpon520 × 20 × 50 nmHepatic cell nuclei occupies 33.8 % chromatin and 66.2% of interchromatin space. Endothelial cell nuclei occupies 58.3% chromatin and 41.7% interchromatin space (This includes space occupied by nucleoli)[53]
B lymphocyteHumanIsolated chromosomesPolyamine or Methanol acetic acid, 2.5% gluteraldehydePlatinum blueAgar 100N/A13 × 13 × 100 nmSample preparation procedures developed for chromosomes. X-shaped mitotic chromosome was reconstructed from polyamine preparations allowing q and p arm chromatids to be measured. Internal structural details or cavities were seen on methanol acetic acid prepared chromosomes only[55]
Retinal Pigment Epithelial (RPE1) cells, IC7 cells, DT40Human, Mouse and ChickenCells3% glutarldehyde and 1% Paraformaldehyde2% osmium tetroxide + 1.5 potassium ferrocyanide, 0.1% tannic acid, 1% uranyl acetate, Walton’s lead aspartate (0.02 M in lead nitrate + 0.03 M in aspartic acidTAAB Hard Premix resin2.524 × 24 × 60 nm3D analysis of chromosomes at different stages of the cell cycle revealed that the prophase chromosomes possess irregular surfaces and smaller volume than metaphase chromosomes. 30% to 47% volume of the mitotic chromosomes accounts for the periphery[54]
B lymphocyteHumanIsolated nuclei and chromosomes3:1 methanol/acetic acid and 2.5% (v/v) glutaraldehyde5 mM platinum blueEpoxy resin511 × 11 × 20 nm36 intact prophase chromosomes were segmented and modelled. Chromosome identification and positioning within the prophase nucleus was determined by quantitative analysis. Chromosomes were found to have parallel-aligned sister chromatids with no crossovers[49]
DT40 (B lymphoma)ChickenCells3% glutarldehyde and 1% paraformaldehyde2% osmium tetroxide + 1.5 potassium ferrocyanide, 0.1% tannic acid, 1% uranyl acetate, Walton’s lead aspartate (0.02 M in lead nitrate + 0.03 M in aspartic acidTAAB Hard Premix resinN/A12 × 12 × 60 nmRapid depletion of condensins resulted in chromatin disorganization and aberrant chromosome shapes with surface area twice as the size of normal chromosomes. Condensins are essential for maintaining chromosome architecture but do not effect chromatin compaction[56]
GM12878 (lymphoblastoid)HumanCells4% paraformaldehyde, 2.5% glutaraldehyde1.4 nm nanogold particles, 1% tannic acid, 4% uranyl acetateEpon4–6 7 × 7 × 50 nm 5 × 5 × 30 nm3D-EMISH, a combination of SBSFEM and fluorescence in situ hybridization was developed. 3D chromatin folding structures were visualized at targeted 1.7 Mb region of human genome in ultra-resolution. Heterogeneity in ultrastructure chromatin folding within individual nuclei was observed[57]
B lymphocyteHumanNuclei2.5% (v/v) glutaraldehyde5 mM platinum blueAgar 100 resin511 × 11 × 25 nm46 chromosomes were segmented and modelled from a single prophase nucleus. Each chromosome was identified and its radial organization within the nuclear space was determined. Chromosomes were found to follow a gene density based organization pattern. A neighborhood map for individual chromosomes was built[44]

4. Structural Examination of Chromosomes Using SBFSEM

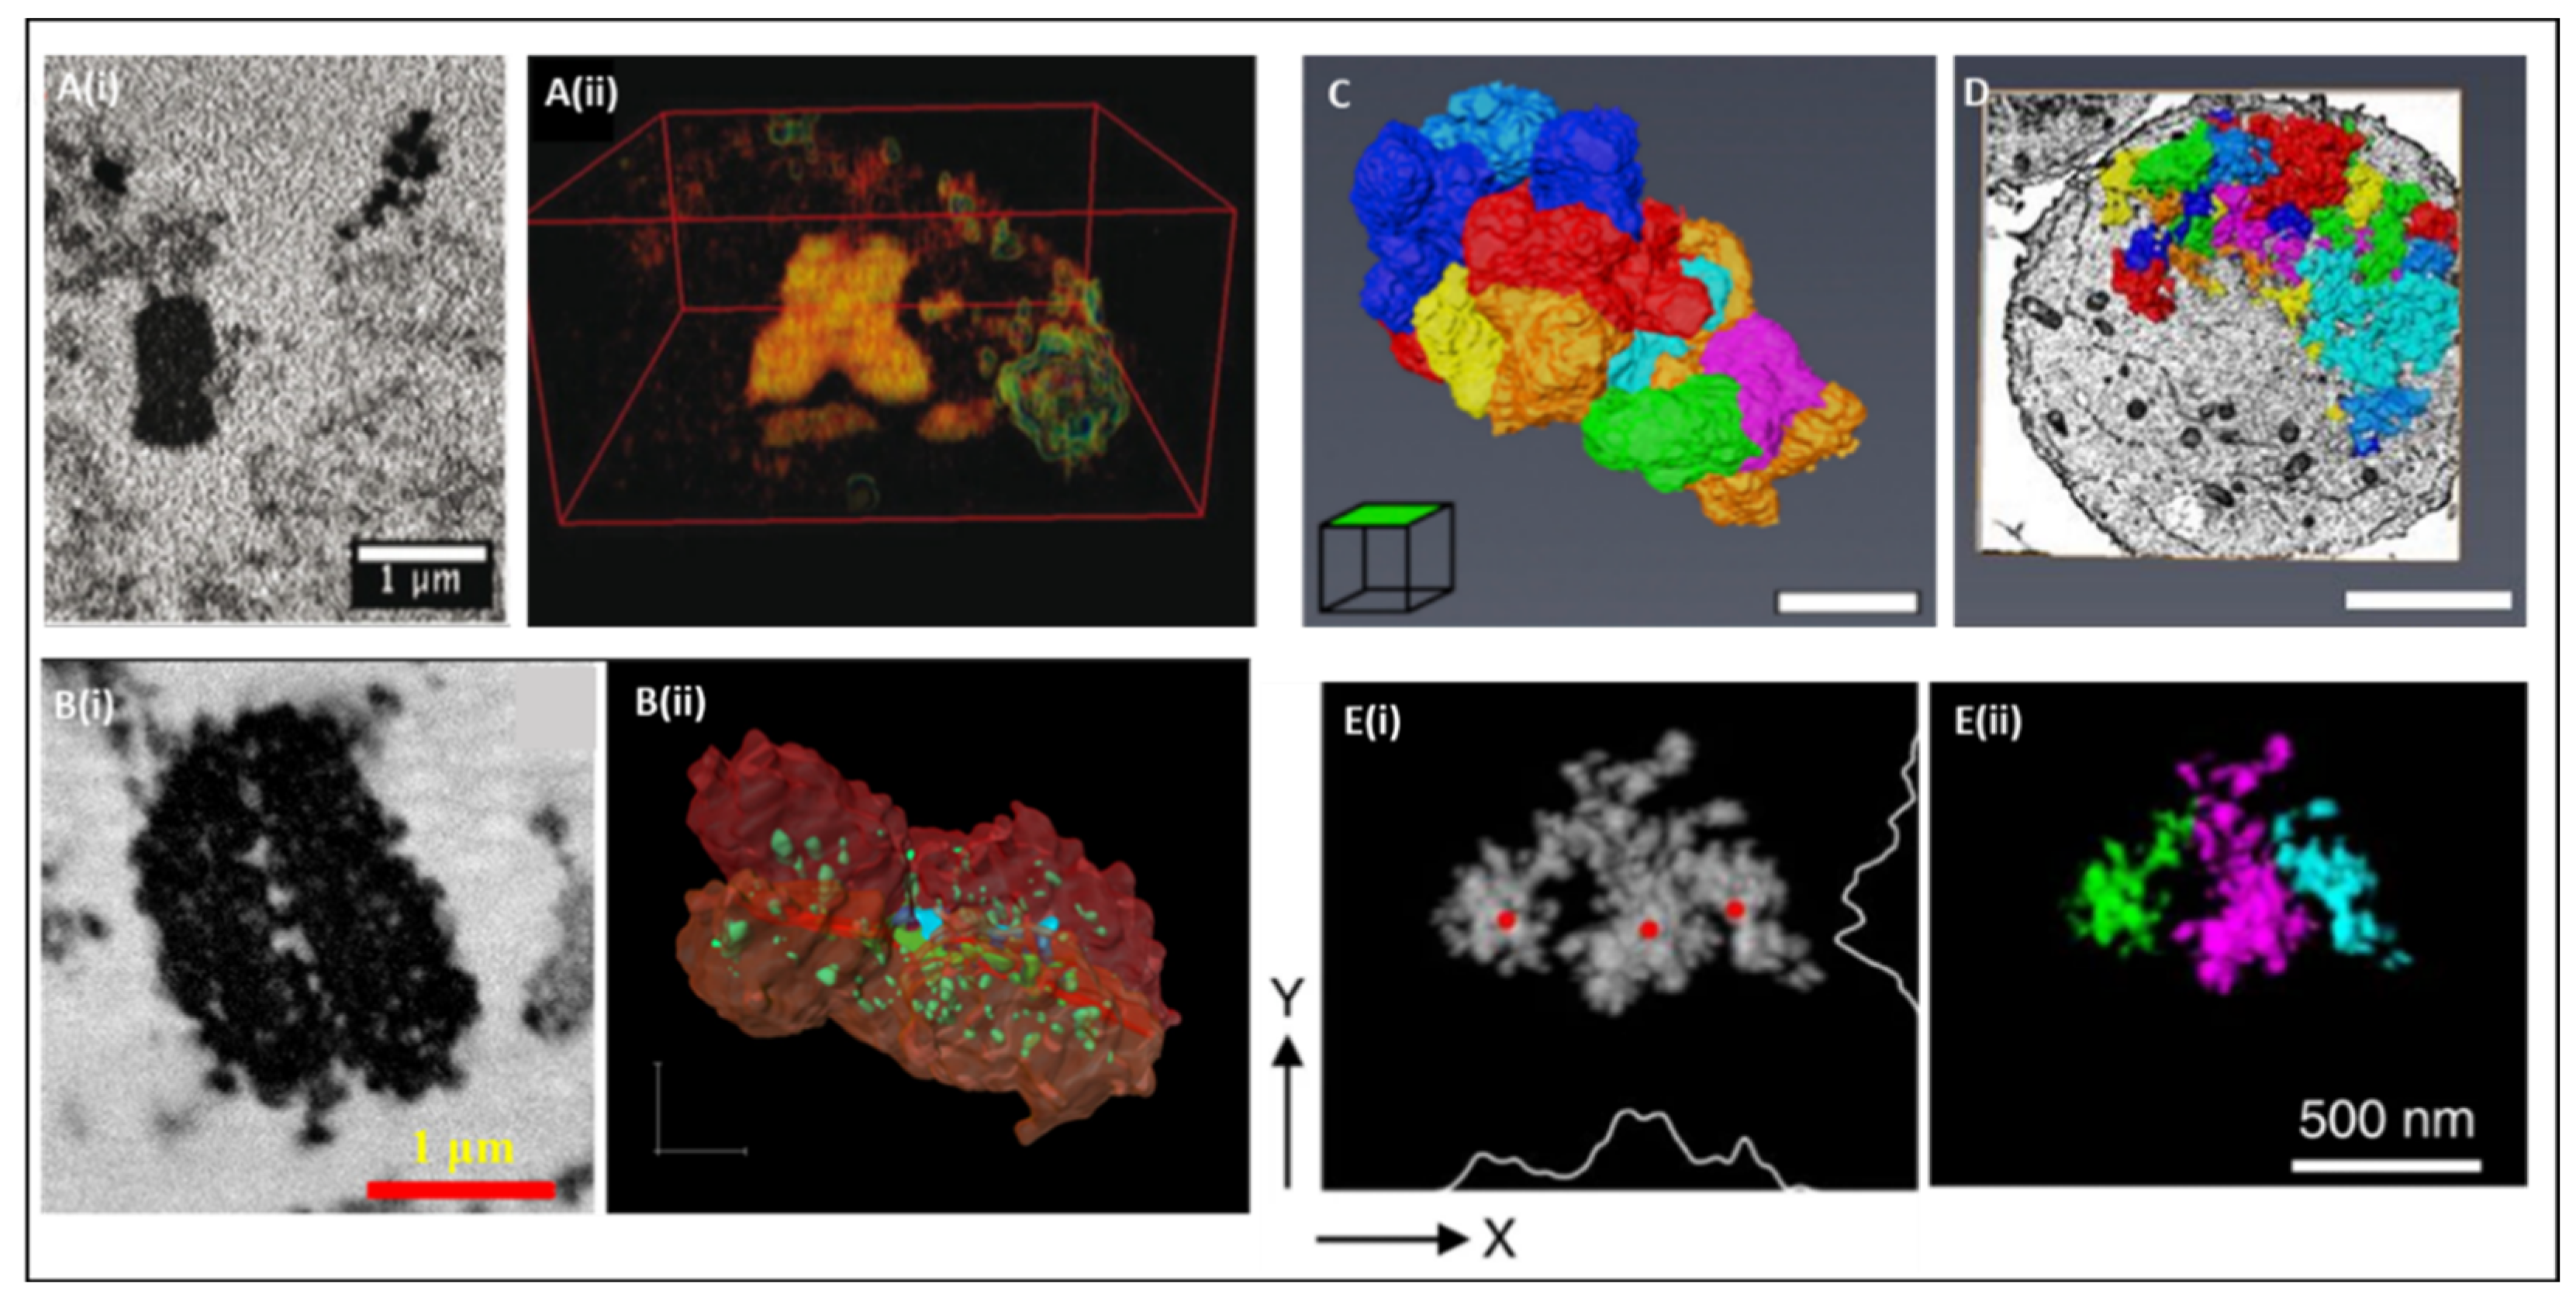
SBFSEM has been used to provide information into the structure of chromatin and chromosomes. Yusuf et al. 2014 published a sample preparation protocol for preparing isolated chromosomes, as a previously published protocol used tissue samples for SBFSEM [53]. This study optimized the sample preparation by cleaning the nuclei and debris from the sample, the concentration of the heavy metal platinum blue stain and the sample density for SBFSEM. The study showed that variation in sample preparation could affect the overall structural details of chromosomes. Chromosomes prepared from polyamine preparations were imaged using SBSFEM after platinum blue staining (Figure 3A(i)). The 3D reconstruction (13 × 13 × 100 nm) provided an X-shaped mitotic chromosome displaying visible chromatids on both the p and q arms but having no inner structural details (Figure 3A(ii)) [55]. In comparison, methanol acetic acid prepared chromosomes showed internal structural details or cavities along the length of the two sister chromatids (Figure 3B(i)) that were then rendered and measured (Figure 3B(ii)). Some of these cavities were connected to the external space surrounding the chromosome, whereas other cavities were sealed inside the chromosome, forming an average of 6% of the total chromosome volume (Figure 3B(ii)) [49]. Human polyamine chromosomes retain both their proteins and nucleic acid after preparation, compared to methanol acetic acid prepared chromosomes that have part of the histones removed, making them less condensed and potentially prone to structural degradation [55].
The role of structural proteins on chromosome stability has been explored using Correlative Light and Electron Microscopy (CLEM) [58]. Using CLEM, specific proteins are immunolabeled (fluorescence), giving positional information that can be investigated further for the ultrastructural features using SBFSEM at that same region. Depletion of Ki-67 (Figure 3C) [54] and SMC2 (scaffold protein) (Figure 3D) [56], essential proteins for maintaining the mitotic chromosome structure, led to disorganized chromosomal structures having a larger surface area [54,56] (Figure 3C,D). A targeted approach for visualizing chromatin at specific genomic regions combined SBFSEM with in situ hybridization known as 3D electron microscopic in situ hybridization (3D-EMISH). This approach enabled the visualization of 3D chromatin folding at targeted genomic regions using BAC probes (1.7 Mb segment) with ultra-resolution (5 × 5 × 30 nm in x, y, z dimensions, respectively) after hybridizing biotinylated DNA probes. Many chromatin structures from multiple human lymphoblastoid cells were analyzed simultaneously. Heterogeneity in chromatin folding structures and volume within individual nuclei was observed due to the differences in transcriptional and epigenetic states. An example of three distinct chromatin folding domains is given in Figure 3E(i), along with its 3D reconstruction in Figure 3E(ii) [57].

5. Spatial Chromosome Organization Using SBFSEM

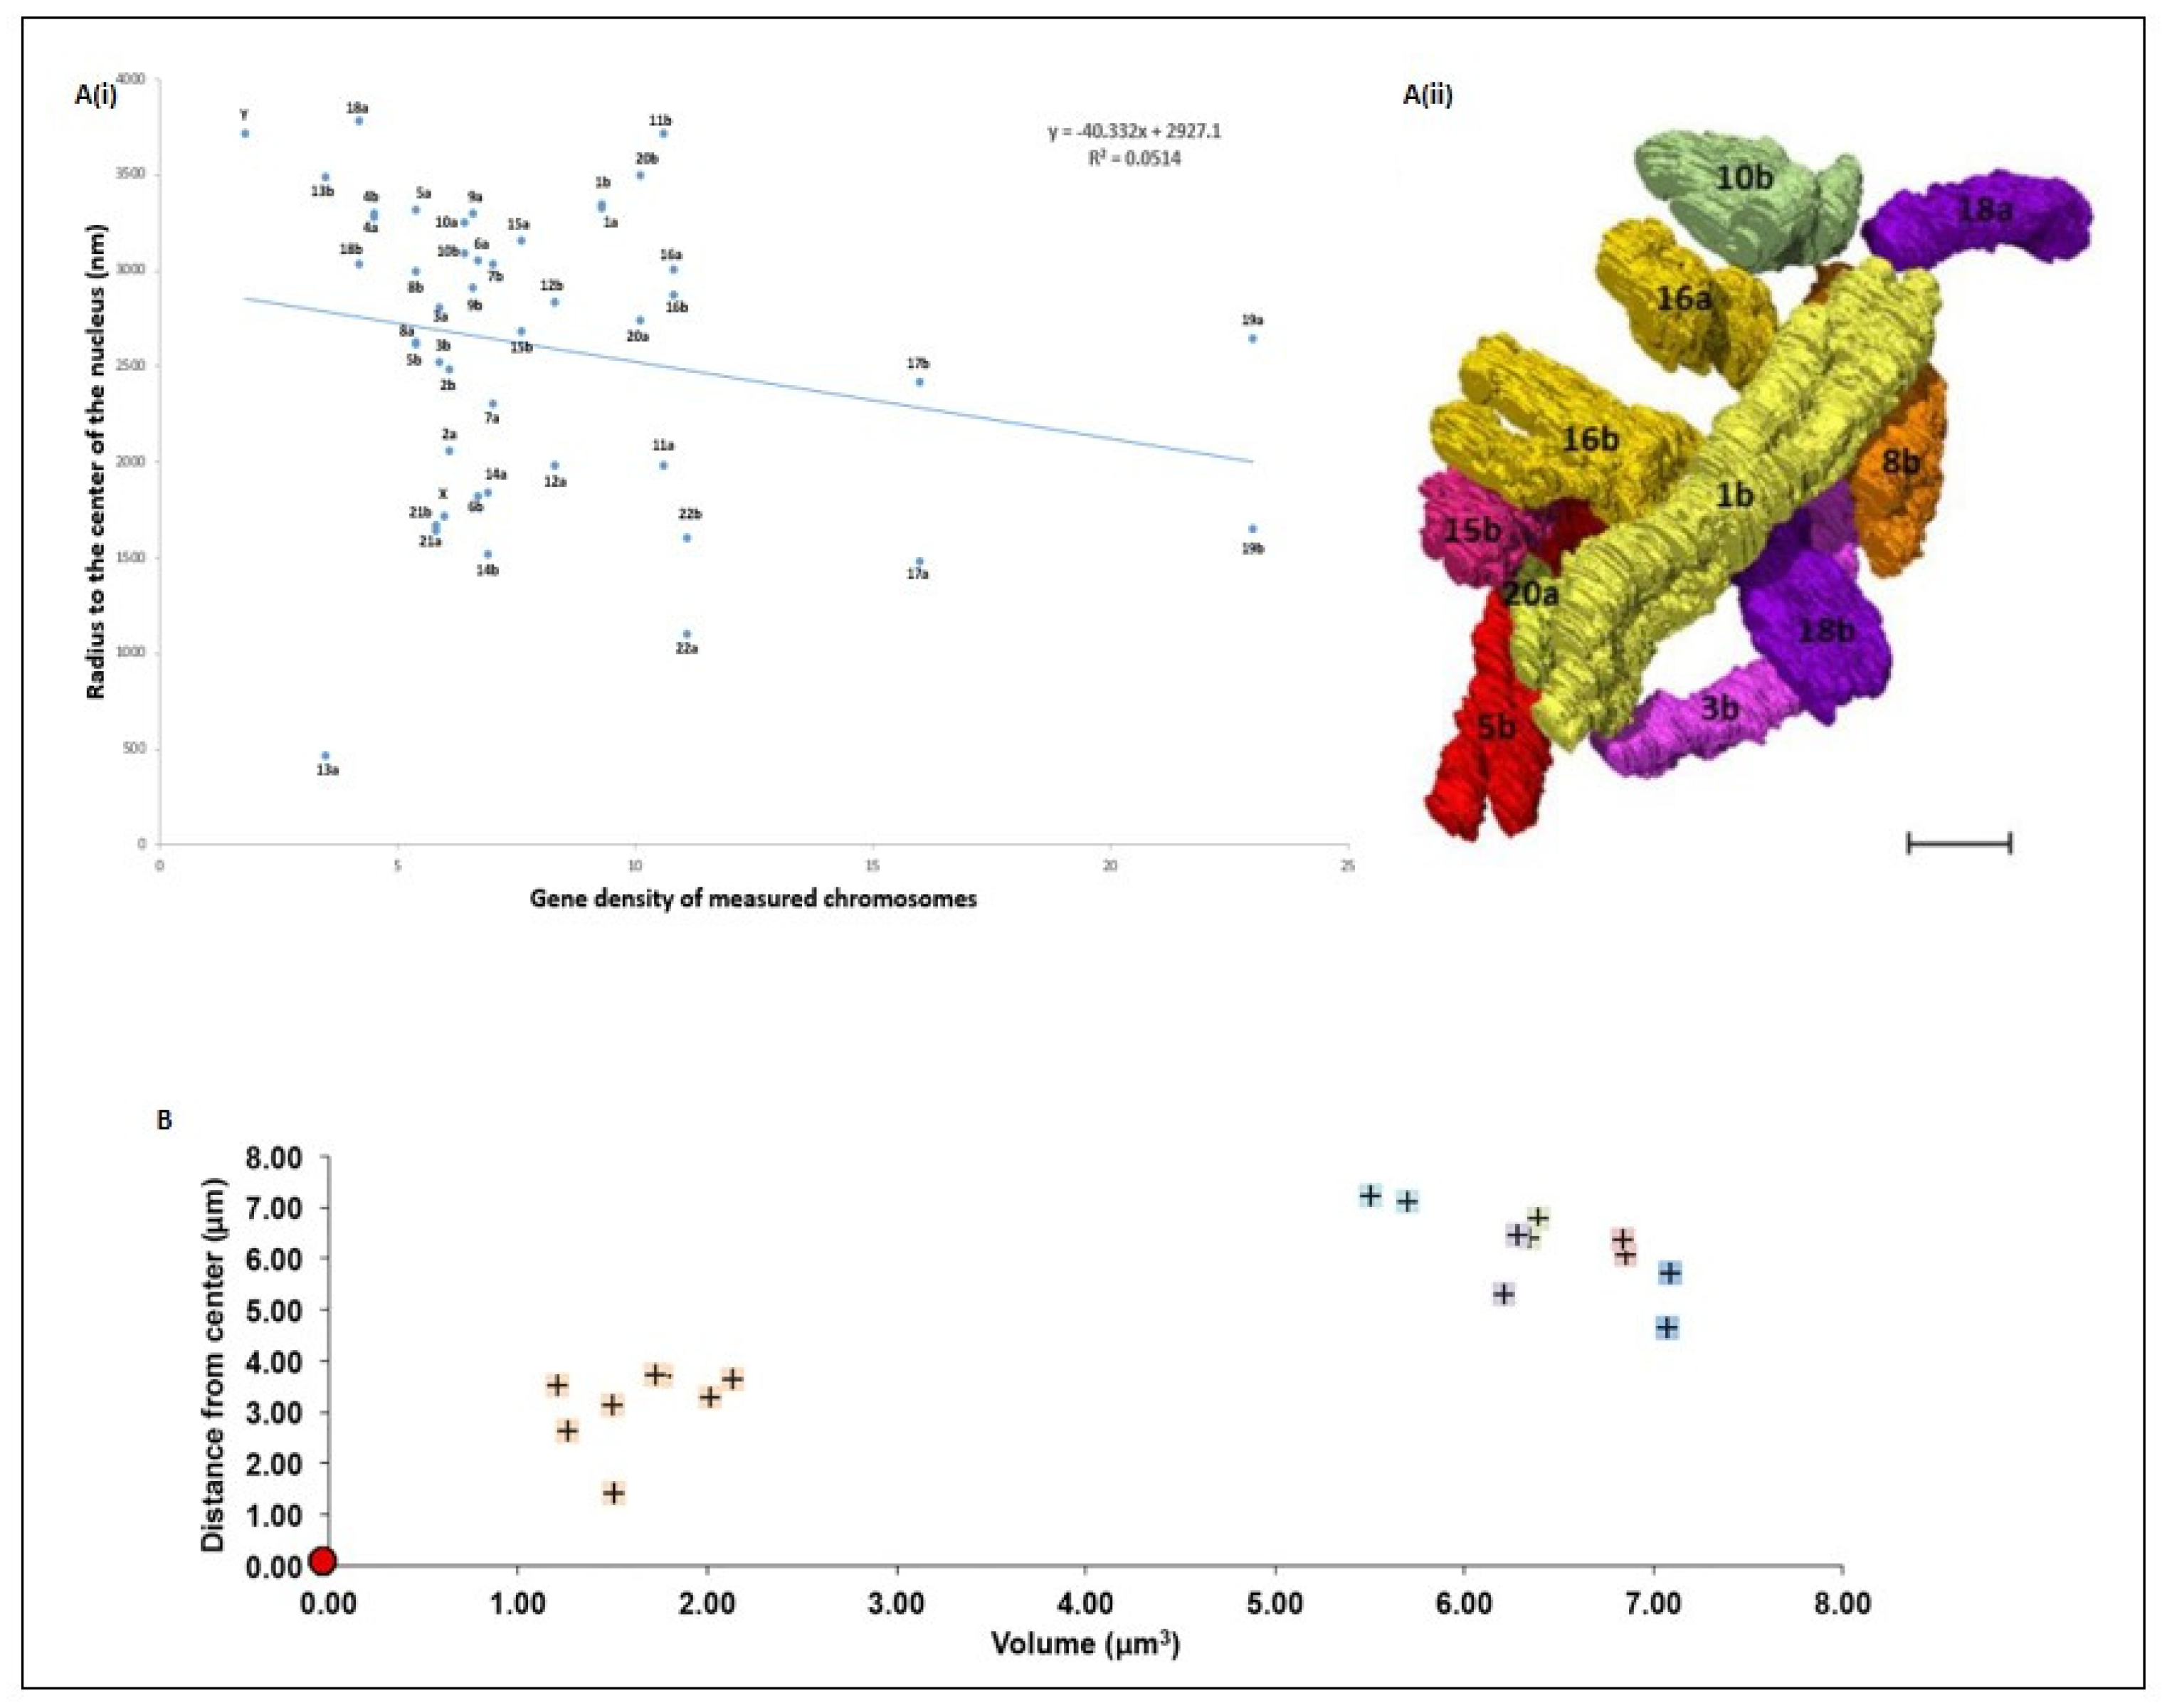
To date, our understanding of the spatial organization of chromosomes remains sparse. SBFSEM has been helpful in providing insights into the 3D spatial organization of chromosomes within the nuclear space at different stages of the cell cycle. At prophase, all 46 lymphocyte chromosomes, segmented and reconstructed from the SBFSEM stack, were identified and analyzed for their radial positioning inside the nucleus. Chromosomes were shown to have gene-density-based correlation with the radius of the nucleus, where gene-poor chromosomes including chromosome y, 18 and a homolog of chromosome 13 were located towards the periphery of the nucleus, whereas gene-rich chromosomes including chromosomes 17, 22 and chromosome 19 occupied more central positions in the nucleus (Figure 4A(i)) [44]. SBFSEM also made possible the visual analysis of neighborhoods for individual chromosomes. Each chromosome and its spatial neighbors in closer proximity were identified. An example of a neighborhood cluster for chromosome 1b (‘1b’ is a representative of one of the two chromosome homologs) is shown in Figure 4A(ii) [44]. Radial organization of larger metaphase chromosomes from groups A and B and smaller metaphase chromosomes from groups E, F and G in an RPE cell was determined using SBFSEM. Larger chromosomes were present on the periphery, and smaller chromosomes were located towards the center of the nucleus (Figure 4B) [54]. These observations further attest to the importance of SBFSEM in providing information regarding the structure and the overall architecture of the chromosomes from different cell types and stages of the cell cycle.

6. Way Forward

We have just started witnessing the application of SBFSEM to the study of chromosomes. To date there have been a limited number of studies on chromosomes. However, application of SBFSEM has demonstrated its utility and increased our knowledge and understanding of chromosome ultra-structure and their spatial positioning at different cell cycle stages. This is due to the automated registration of images allowing access to comprehensive 3D information. This is an important milestone, and the journey has just begun.
Sample preparation procedures for imaging chromosomes/chromatin using SBFSEM have been performed from tissues [53], cells [54,56], nuclei [44,49] and isolated chromosomes [55]. Sample preparation must be considered; for example, the penetration of heavy metal stains, sample density and fixatives can impact the experimental observations. This, in part, has been ameliorated by the development of staining methods integrated with correlative microscopy, such as CLEM for protein and DNA imaging, which has helped unravel the structure–function relationship of proteins and DNA, e.g., during mitosis [54,56]. This is yet to be explored for the large repository of proteins that includes scaffold proteins involved in maintaining the chromosome stability and function [59,60]. Moreover, the effect of other factors such as divalent cations (calcium and magnesium) on the decondensation of chromosomes need to be explored [61,62].
Developing new generation back scattered electron (BSE) detectors would be useful. Improvement in resin strength or sturdiness that can withstand the heat generated during high-resolution imaging would allow a higher resolution to be achieved. Radiation damage or charging of the sample should be carefully considered and should enable a higher resolution to be achieved in all dimensions. As no cryogenic stage for the SBFSEM instrument has yet been developed, biological samples after freeze-substitution and high-pressure freezing would be a suitable way forward and is yet to be explored [63]. For quantitative analysis of chromosome samples, automated segmentation tools need to be developed in the software that will speed the analysis and allow data reproducibility.
This now opens an opportunity to explore SBFSEM for determining the structure and spatial architecture of chromosomes in different tissues and cell types during disease and development. This could provide important clues into the differential proximity patterning of chromosomes during various cell cycle stages, in daughter cells after division, after disease progression such as cancers, and be useful for regenerative medicine and stem cell research.

7. Conclusions

SBFSEM can generate 3D images of the nucleus, chromosomes and chromatin at a nanoscale resolution over large volumes. Indeed, SBFSEM should be considered a valuable tool for solving problems in the chromosome field. Future developments of the instrument, improved sample preparations and staining will be helpful in imaging chromosomes using this approach in 3D. This will enhance our understanding into the subcellular structures and functional processes of chromatin condensation. In the future, technologies such as SBFSEM together with super-resolution microscopy, and parallel sample imaging using transmission electron microscopy and Hi-C, will provide comprehensive insight of the 3D genome maps of single cells.

Author Contributions

Conceptualization, M.Y., A.S., I.K.R. and E.-N.L.; writing—original draft preparation, M.Y. and A.S.; writing—review and editing, M.Y., A.S., I.K.R. and E.-N.L.; supervision, M.Y., I.K.R., E.-N.L., project administration, M.Y. and A.S.; funding acquisition, I.K.R. and E.-N.L. All authors have read and agreed to the published version of the manuscript.

Funding

This study was funded by a start-up grant provided by the Centre for Regenerative Medicine and Stem Cell Research at the Aga Khan University. Work at UCL was supported by BBSRC grant BB/H022597/1 entitled “Diamond Professorial Fellowship for imaging chromosomes by coherent X-ray diffraction”.

Acknowledgments

We thank Aga Khan University and generous donors for providing support.

Conflicts of Interest

The authors declare no conflict of interest.

References

  1. Flemming, W. Zellsubstanz, Kern und Zelltheilung; Vogel: Leipzig, Germany, 1882; pp. 1–472. [Google Scholar]
  2. Antonin, W.; Neumann, H. Chromosome Condensation and Decondensation during Mitosis. Curr. Opin. Cell Biol. 2016, 40, 15–22. [Google Scholar] [CrossRef] [PubMed] [Green Version]
  3. Naumova, N.; Imakaev, M.; Fudenberg, G.; Zhan, Y.; Lajoie, B.R.; Mirny, L.A.; Dekker, J. Organization of the Mitotic Chromosome. Science 2013, 342, 948–953. [Google Scholar] [CrossRef] [Green Version]
  4. Cremer, T.; Cremer, C. Chromosome Territories, Nuclear Architecture and Gene Regulation in Mammalian Cells. Nat. Rev. Genet. 2001, 2, 292–301. [Google Scholar] [CrossRef] [PubMed]
  5. Foster, H.A.; Bridger, J.M. The Genome and the Nucleus: A Marriage Made by Evolution. Genome Organisation and Nuclear Architecture. Chromosoma 2005, 114, 212–229. [Google Scholar] [CrossRef] [PubMed]
  6. Cremer, T.; Cremer, M. Chromosome Territories. Cold Spring Harb. Perspect. Biol. 2010, 2, a003889. [Google Scholar] [CrossRef] [PubMed] [Green Version]
  7. Meaburn, K.J.; Misteli, T. Cell Biology: Chromosome Territories. Nature 2007, 445, 379–781. [Google Scholar] [CrossRef] [PubMed]
  8. Fritz, A.J.; Sehgal, N.; Pliss, A.; Xu, J.; Berezney, R. Chromosome Territories and the Global Regulation of the Genome. Genes Chromosomes Cancer 2019, 58, 407–426. [Google Scholar] [CrossRef] [PubMed] [Green Version]
  9. Belmont, A.S. Nuclear Compartments: An Incomplete Primer to Nuclear Compartments, Bodies, and Genome Organization Relative to Nuclear Architecture. Cold Spring Harb. Perspect. Biol. 2021, a041268. [Google Scholar] [CrossRef]
  10. Mehta, I.S.; Kulashreshtha, M.; Chakraborty, S.; Kolthur-Seetharam, U.; Rao, B.J. Chromosome Territories Reposition during DNA Damage-Repair Response. Genome Biol. 2013, 14, R135. [Google Scholar] [CrossRef] [Green Version]
  11. Branco, M.R.; Pombo, A. Intermingling of Chromosome Territories in Interphase Suggests Role in Translocations and Transcription-Dependent Associations. PLoS Biol. 2006, 4, e138. [Google Scholar] [CrossRef] [PubMed] [Green Version]
  12. Fraser, P.; Bickmore, W. Nuclear Organization of the Genome and the Potential for Gene Regulation. Nature 2007, 447, 413–417. [Google Scholar] [CrossRef]
  13. Cremer, M.; Küpper, K.; Wagler, B.; Wizelman, L.; von Hase, J.; Weiland, Y.; Kreja, L.; Diebold, J.; Speicher, M.R.; Cremer, T. Inheritance of Gene Density-Related Higher Order Chromatin Arrangements in Normal and Tumor Cell Nuclei. J. Cell Biol. 2003, 162, 809–820. [Google Scholar] [CrossRef]
  14. Krietenstein, N.; Rando, O.J. Mesoscale Organization of the Chromatin Fiber. Curr. Opin. Genet. Dev. 2020, 61, 32–36. [Google Scholar] [CrossRef]
  15. Yusuf, M.; Kaneyoshi, K.; Fukui, K.; Robinson, I. Use of 3D Imaging for Providing Insights into High-Order Structure of Mitotic Chromosomes. Chromosoma 2019, 128, 7–13. [Google Scholar] [CrossRef] [Green Version]
  16. Woodcock, C.L.; Ghosh, R.P. Chromatin Higher-Order Structure and Dynamics. Cold Spring Harb. Perspect. Biol. 2010, 2, a000596. [Google Scholar] [CrossRef]
  17. Bendandi, A.; Dante, S.; Zia, S.R.; Diaspro, A.; Rocchia, W. Chromatin Compaction Multiscale Modeling: A Complex Synergy Between Theory, Simulation, and Experiment. Front. Mol. Biosci. 2020, 7, 15. [Google Scholar] [CrossRef] [PubMed] [Green Version]
  18. Paulson, J.R.; Hudson, D.F.; Cisneros-Soberanis, F.; Earnshaw, W.C. Mitotic Chromosomes. Semin. Cell Dev. Biol. 2021, 117, 7–29. [Google Scholar] [CrossRef]
  19. Chen, B.-C.; Legant, W.R.; Wang, K.; Shao, L.; Milkie, D.E.; Davidson, M.W.; Janetopoulos, C.; Wu, X.S.; Hammer, J.A.; Liu, Z.; et al. Lattice Light-Sheet Microscopy: Imaging Molecules to Embryos at High Spatiotemporal Resolution. Science 2014, 346, 1257998. [Google Scholar] [CrossRef] [PubMed] [Green Version]
  20. Yamashita, N.; Morita, M.; Legant, W.R.; Chen, B.-C.; Betzig, E.; Yokota, H.; Mimori-Kiyosue, Y. Three-Dimensional Tracking of plus-Tips by Lattice Light-Sheet Microscopy Permits the Quantification of Microtubule Growth Trajectories within the Mitotic Apparatus. J. Biomed. Opt. 2015, 20, 101206. [Google Scholar] [CrossRef] [PubMed]
  21. Mimori-Kiyosue, Y. Imaging Mitotic Processes in Three Dimensions with Lattice Light-Sheet Microscopy. Chromosome Res. 2021, 29, 37–50. [Google Scholar] [CrossRef]
  22. Abbe, E. Beiträge zur Theorie des Mikroskops und der mikroskopischen Wahrnehmung. Arch. Mikrosk. Anat. 1873, 9, 413–468. [Google Scholar] [CrossRef]
  23. Botchway, S.W.; Farooq, S.; Sajid, A.; Robinson, I.K.; Yusuf, M. Contribution of Advanced Fluorescence Nano Microscopy towards Revealing Mitotic Chromosome Structure. Chromosome Res. 2021, 29, 19–36. [Google Scholar] [CrossRef] [PubMed]
  24. Nishino, Y.; Takahashi, Y.; Imamoto, N.; Ishikawa, T.; Maeshima, K. Three-Dimensional Visualization of a Human Chromosome Using Coherent X-Ray Diffraction. Phys. Rev. Lett. 2009, 102, 018101. [Google Scholar] [CrossRef]
  25. Song, C.; Takagi, M.; Park, J.; Xu, R.; Gallagher-Jones, M.; Imamoto, N.; Ishikawa, T. Analytic 3D Imaging of Mammalian Nucleus at Nanoscale Using Coherent X-Rays and Optical Fluorescence Microscopy. Biophys. J. 2014, 107, 1074–1081. [Google Scholar] [CrossRef] [Green Version]
  26. Nellist, P.D.; Chisholm, M.F.; Dellby, N.; Krivanek, O.L.; Murfitt, M.F.; Szilagyi, Z.S.; Lupini, A.R.; Borisevich, A.; Sides, W.H.; Pennycook, S.J. Direct Sub-Angstrom Imaging of a Crystal Lattice. Science 2004, 305, 1741. [Google Scholar] [CrossRef] [PubMed]
  27. Eltsov, M.; MacLellan, K.M.; Maeshima, K.; Frangakis, A.S.; Dubochet, J. Analysis of Cryo-Electron Microscopy Images Does Not Support the Existence of 30-Nm Chromatin Fibers in Mitotic Chromosomes in Situ. Proc. Natl. Acad. Sci. USA 2008, 105, 19732–19737. [Google Scholar] [CrossRef] [PubMed] [Green Version]
  28. Daban, J.R. Soft-matter properties of multilayer chromosomes. Phys. Biol. 2021, 18, 053001. [Google Scholar] [CrossRef]
  29. Ris, H. Stereoscopic Electron Microscopy of Chromosomes. Methods Cell Biol. 1981, 22, 77–96. [Google Scholar] [CrossRef]
  30. Engelhardt, P. Electron Tomography of Chromosome Structure. In Encyclopedia of Analytical Chemistry; Meyers, R.A., Ed.; John Wiley & Sons, Ltd.: Chichester, UK, 2006; ISBN 978-0-471-97670-7. [Google Scholar]
  31. Adolph, K.W. A Serial Sectioning Study of the Structure of Human Mitotic Chromosomes. Eur. J. Cell Biol. 1981, 24, 146–153. [Google Scholar]
  32. Belmont, A.S.; Sedat, J.W.; Agard, D.A. A Three-Dimensional Approach to Mitotic Chromosome Structure: Evidence for a Complex Hierarchical Organization. J. Cell Biol. 1987, 105, 77–92. [Google Scholar] [CrossRef]
  33. Harauz, G.; Borland, L.; Bahr, G.F.; Zeitler, E.; van Heel, M. Three-Dimensional Reconstruction of a Human Metaphase Chromosome from Electron Micrographs. Chromosoma 1987, 95, 366–374. [Google Scholar] [CrossRef]
  34. Ou, H.D.; Phan, S.; Deerinck, T.J.; Thor, A.; Ellisman, M.H.; O’Shea, C.C. ChromEMT: Visualizing 3D Chromatin Structure and Compaction in Interphase and Mitotic Cells. Science 2017, 357, eaag0025. [Google Scholar] [CrossRef] [Green Version]
  35. Goggin, P.; Ho, E.M.L.; Gnaegi, H.; Searle, S.; Oreffo, R.O.C.; Schneider, P. Development of Protocols for the First Serial Block-Face Scanning Electron Microscopy (SBF SEM) Studies of Bone Tissue. Bone 2020, 131, 115107. [Google Scholar] [CrossRef]
  36. Titze, B.; Genoud, C. Volume Scanning Electron Microscopy for Imaging Biological Ultrastructure. Biol. Cell 2016, 108, 307–323. [Google Scholar] [CrossRef] [PubMed]
  37. Peddie, C.J.; Collinson, L.M. Exploring the Third Dimension: Volume Electron Microscopy Comes of Age. Micron Oxf. Engl. 1993 2014, 61, 9–19. [Google Scholar] [CrossRef] [PubMed]
  38. Yonehara, K.; Baba, N.; Kanaya, K. Application of Ion-Beam Etching Techniques to the Fine Structure of Biological Specimens as Examined with a Field Emission SEM at Low Voltage. J. Electron Microsc. Tech. 1989, 12, 71–77. [Google Scholar] [CrossRef]
  39. Schroeder-Reiter, E.; Pérez-Willard, F.; Zeile, U.; Wanner, G. Focused Ion Beam (FIB) Combined with High Resolution Scanning Electron Microscopy: A Promising Tool for 3D Analysis of Chromosome Architecture. J. Struct. Biol. 2008, 165, 97–106. [Google Scholar] [CrossRef] [PubMed]
  40. Hamano, T.; Dwiranti, A.; Kaneyoshi, K.; Fukuda, S.; Kometani, R.; Nakao, M.; Takata, H.; Uchiyama, S.; Ohmido, N.; Fukui, K. Chromosome Interior Observation by Focused Ion Beam/Scanning Electron Microscopy (FIB/SEM) Using Ionic Liquid Technique. Microsc. Microanal. 2014, 20, 1340–1347. [Google Scholar] [CrossRef] [PubMed]
  41. Poonperm, R.; Takata, H.; Hamano, T.; Matsuda, A.; Uchiyama, S.; Hiraoka, Y.; Fukui, K. Chromosome Scaffold Is a Double-Stranded Assembly of Scaffold Proteins. Sci. Rep. 2015, 5, 11916. [Google Scholar] [CrossRef] [Green Version]
  42. Sasakura, S.; Yoshida, A.; Wako, T.; Kaneyoshi, K.; Poonperm, R.; Ogawa, S.; Kato, J.; Otsuka, Y.; Takata, H.; Uchiyama, S.; et al. Structural Analysis of Human Chromosome by FIB/SEM. Chromosome Sci. 2016, 19, 25–31. [Google Scholar] [CrossRef]
  43. Denk, W.; Horstmann, H. Serial Block-Face Scanning Electron Microscopy to Reconstruct Three-Dimensional Tissue Nanostructure. PLoS Biol. 2004, 2, e329. [Google Scholar] [CrossRef] [PubMed]
  44. Sajid, A.; Lalani, E.-N.; Chen, B.; Hashimoto, T.; Griffin, D.K.; Bhartiya, A.; Thompson, G.; Robinson, I.K.; Yusuf, M. Ultra-Structural Imaging Provides 3D Organization of 46 Chromosomes of a Human Lymphocyte Prophase Nucleus. Int. J. Mol. Sci. 2021, 22, 5987. [Google Scholar] [CrossRef] [PubMed]
  45. Leighton, S.B. SEM Images of Block Faces, Cut by a Miniature Microtome within the SEM—A Technical Note. Scan. Electron Microsc. 1981, Pt 2, 73–76. [Google Scholar]
  46. Zankel, A.; Kraus, B.; Poelt, P.; Schaffer, M.; Ingolic, E. Ultramicrotomy in the ESEM, a Versatile Method for Materials and Life Sciences. J. Microsc. 2009, 233, 140–148. [Google Scholar] [CrossRef] [PubMed]
  47. Ronchi, P.; Mizzon, G.; Machado, P.; D’Imprima, E.; Best, B.T.; Cassella, L.; Schnorrenberg, S.; Montero, M.G.; Jechlinger, M.; Ephrussi, A.; et al. High-Precision Targeting Workflow for Volume Electron Microscopy. J. Cell Biol. 2021, 220, e202104069. [Google Scholar] [CrossRef] [PubMed]
  48. Hashimoto, T.; Thompson, G.E.; Curioni, M.; Zhou, X.R.; Skeldon, P. Three Dimensional Imaging of Light Metals Using Serial Block Face Scanning Electron Microscopy (SBFSEM). Mater. Sci. Forum 2013, 765, 501–505. [Google Scholar] [CrossRef]
  49. Chen, B.; Yusuf, M.; Hashimoto, T.; Estandarte, A.K.; Thompson, G.; Robinson, I. Three-Dimensional Positioning and Structure of Chromosomes in a Human Prophase Nucleus. Sci. Adv. 2017. [Google Scholar] [CrossRef] [Green Version]
  50. He, Q.; Hsueh, M.; Zhang, G.; Joy, D.C.; Leapman, R.D. Biological Serial Block Face Scanning Electron Microscopy at Improved Z-Resolution Based on Monte Carlo Model. Sci. Rep. 2018, 8, 12985. [Google Scholar] [CrossRef] [PubMed] [Green Version]
  51. Lipke, E.; Hörnschemeyer, T.; Pakzad, A.; Booth, C.R.; Michalik, P. Serial Block-Face Imaging and Its Potential for Reconstructing Diminutive Cell Systems: A Case Study from Arthropods. Microsc. Microanal. Off. J. Microsc. Soc. Am. Microbeam Anal. Soc. Microsc. Soc. Can. 2014, 20, 946–955. [Google Scholar] [CrossRef]
  52. Hennig, P.; Denk, W. Point-Spread Functions for Backscattered Imaging in the Scanning Electron Microscope. J. Appl. Phys. 2007, 102, 123101. [Google Scholar] [CrossRef] [Green Version]
  53. Rouquette, J.; Genoud, C.; Vazquez-Nin, G.H.; Kraus, B.; Cremer, T.; Fakan, S. Revealing the High-Resolution Three-Dimensional Network of Chromatin and Interchromatin Space: A Novel Electron-Microscopic Approach to Reconstructing Nuclear Architecture. Chromosome Res. Int. J. Mol. Supramol. Evol. Asp. Chromosome Biol. 2009, 17, 801–810. [Google Scholar] [CrossRef] [PubMed]
  54. Booth, D.G.; Beckett, A.J.; Molina, O.; Samejima, I.; Masumoto, H.; Kouprina, N.; Larionov, V.; Prior, I.A.; Earnshaw, W.C. 3D-CLEM Reveals That a Major Portion of Mitotic Chromosomes Is Not Chromatin. Mol. Cell 2016, 64, 790–802. [Google Scholar] [CrossRef] [PubMed]
  55. Yusuf, M.; Chen, B.; Hashimoto, T.; Estandarte, A.K.; Thompson, G.; Robinson, I. Staining and Embedding of Human Chromosomes for 3-d Serial Block-Face Scanning Electron Microscopy. BioTechniques 2014, 57, 302–307. [Google Scholar] [CrossRef] [PubMed]
  56. Samejima, K.; Booth, D.G.; Ogawa, H.; Paulson, J.R.; Xie, L.; Watson, C.A.; Platani, M.; Kanemaki, M.T.; Earnshaw, W.C. Functional Analysis after Rapid Degradation of Condensins and 3D-EM Reveals Chromatin Volume Is Uncoupled from Chromosome Architecture in Mitosis. J. Cell Sci. 2018, 131, jcs210187. [Google Scholar] [CrossRef] [Green Version]
  57. Trzaskoma, P.; Ruszczycki, B.; Lee, B.; Pels, K.K.; Krawczyk, K.; Bokota, G.; Szczepankiewicz, A.A.; Aaron, J.; Walczak, A.; Śliwińska, M.A.; et al. Ultrastructural Visualization of 3D Chromatin Folding Using Volume Electron Microscopy and DNA in Situ Hybridization. Nat. Commun. 2020, 11, 2120. [Google Scholar] [CrossRef] [PubMed]
  58. Polishchuk, E.V.; Polishchuk, R.S.; Luini, A. Correlative Light-Electron Microscopy as a Tool to Study in Vivo Dynamics and Ultrastructure of Intracellular Structures. Methods Mol. Biol. Clifton NJ 2013, 931, 413–422. [Google Scholar] [CrossRef]
  59. Uchiyama, S.; Kobayashi, S.; Takata, H.; Ishihara, T.; Hori, N.; Higashi, T.; Hayashihara, K.; Sone, T.; Higo, D.; Nirasawa, T.; et al. Proteome Analysis of Human Metaphase Chromosomes. J. Biol. Chem. 2005, 280, 16994–17004. [Google Scholar] [CrossRef] [Green Version]
  60. Ohta, S.; Bukowski-Wills, J.-C.; Sanchez-Pulido, L.; de Lima Alves, F.; Wood, L.; Chen, Z.A.; Platani, M.; Fischer, L.; Hudson, D.F.; Ponting, C.P.; et al. The Protein Composition of Mitotic Chromosomes Determined Using Multiclassifier Combinatorial Proteomics. Cell 2010, 142, 810–821. [Google Scholar] [CrossRef] [Green Version]
  61. Phengchat, R.; Takata, H.; Morii, K.; Inada, N.; Murakoshi, H.; Uchiyama, S.; Fukui, K. Calcium Ions Function as a Booster of Chromosome Condensation. Sci. Rep. 2016, 6, 38281. [Google Scholar] [CrossRef] [Green Version]
  62. Dwiranti, A.; Takata, H.; Fukui, K. Reversible Changes of Chromosome Structure upon Different Concentrations of Divalent Cations. Microsc. Microanal. Off. J. Microsc. Soc. Am. Microbeam Anal. Soc. Microsc. Soc. Can. 2019, 25, 817–821. [Google Scholar] [CrossRef] [Green Version]
  63. Yusuf, M.; Farooq, S.; Robinson, I.; Lalani, E.-N. Cryo-Nanoscale Chromosome Imaging—Future Prospects. Biophys. Rev. 2020, 12, 1257–1263. [Google Scholar] [CrossRef] [PubMed]
Figure 1. Principle of SBFSEM and a 3D model of a single chromosome. (A) Showing basic workflow of SBFSEM volume imaging; (B) different slices from an SBFSEM data stack showing segmentation (i–iii) and (iv) a 3D modelled X-shaped chromosome; scale bar—0.5 µM [44].
Dna 02 00003 g001
Figure 2. SBFSEM examination of chromosomes at different mitotic stages. (A(i)) A 2D orthoslice of a prophase nucleus from the acquired SBFSEM stack showing chromosomes in contrast (white); (A(ii)) 3D reconstruction of all 46 chromosomes from a prophase nucleus (red); (A(iii)) 3D cluster of all 46 modelled and identified chromosomes. Each of the 23 pairs are labelled in different colors. Scale bar—2 µm [44]. (B(i)) A 2D orthoslice of a metaphase cell from the acquired SBFSEM images; (B(ii)) 3D segmentation of a chromosome complement consisting of 46 metaphase chromosomes (red); (B(iii)) 3D reconstructions of 46 metaphase chromosomes labelled in different colors. Scale bar—10 µm [54]. Average diameters during different stages of mitosis were examined by measuring chromosomes imaged using SBFSEM. At early prophase, they measured 0.64 µm [54], 1.53 µm (765 nm for each chromatid) [49], and 1.06 µm [44] at late prophase and 1.15 µm in metaphase [54]. These studies performed on different cell lines provide preliminary data on the 3D gradual chromosome condensation process during mitosis but requires further examination from the same cell line.
Dna 02 00003 g002
Figure 3. Determination of chromatin and chromosome structure using SBFSEM. (A(i)) An orthoslice showing a single polyamine prepared mitotic chromosome appearing as a dark blob; (A(ii)) 3D reconstruction of an X-shaped mitotic chromosome from the same stack as (A(i)). Length of chromosome is 2.09 microns. Diameter of q arm chromatid is 0.53 microns and p arm is 0.41. Bounding box size: 4.253 × 3.741 × 1.6 µm [55]. (B(i)) An orthoslice from the stack showing a methanol acetic acid prepared prophase chromosome with a network of cavities on the chromatids; (B(ii)) 3D reconstruction of the prophase chromosome from (B(i)). Cavities present on each chromatid are labelled in blue, green and light green color. Scale bar—2 µm [49]. (C) A 3D reconstruction of Ki-67-depleted mitotic chromosomes from an orthoslice showing chromosome clumps rather than 46 discrete units. Scale bar—5 µm [54]. (D) A 3D reconstruction of SMC2-depleted mitotic chromosomes from an orthoslice showing disorganization of the chromatin. Scale bar—4 µm [56]. (E(i)) A 3D-EMISH image showing a chromatin folding structure having three distinctive domains in xy. Red dots represent the calculated center points of each domain; (E(ii)) 3D visualization of the three distinctive chromatin folding domains from (E(i)) in different colors magenta, green and cyan. Scale bar—500 nm [57].
Dna 02 00003 g003
Figure 4. Spatial chromosome organization using SBFSEM. (A(i)) A 2D scatter diagram showing the radial organization of 46 chromosomes within a prophase nucleus. These chromosomes have a gene-density-based correlation with the radius of the nucleus. (A(ii)) A reconstructed 3D neighborhood cluster of prophase chromosomes (prepared from lymphocytes), showing 10 chromosomes that are in close proximity to chromosome 1 (1b) Scale bar—1 µm [44]. (B) A 2D scatter diagram showing the radial organization of largest (1–5) and smallest (19–22) metaphase chromosomes within an RPE cell. The chromosomes followed a volume-based correlation [54].
Dna 02 00003 g004
Publisher’s Note: MDPI stays neutral with regard to jurisdictional claims in published maps and institutional affiliations.