Abstract
The coffee cherry processing produces various waste products, such as coffee husks, which are a valuable source of pectin and phenolic acids that can be used as high-value biomolecules in human and animal food, cosmetics, and pharmaceutical production chains. This study aims to optimize the eco-friendly extraction of polysaccharides, as pectin, and phenolic compounds from coffee peel using response surface methodology (RSM). This model was used to evaluate the extraction variables (temperature, time, pH, ionic strength, ultrasonic frequency, particle size, and solid/liquid ratio in water) to identify the critical factors. All responses were fitted to the RSM model, which revealed high estimation capabilities. Ionic strength and temperature were found to be critical process variables for pectin extraction, while the main factors responsible for phenolic extraction were ultrasonic frequency, pH, and solid/liquid ratio. Therefore, the operating conditions to optimize the extraction of both pectin and phenolic compounds were 80 °C, ultrasonic frequency 60 kHz, solid/liquid ratio 1:20, using pH 2 or 12 in the case of pectin or polyphenols, respectively. Direct Analysis in Real Time Mass Spectrometry (DART-MS) and Fourier-Transform Infrared Spectroscopy–Attenuated Total Reflectance (FTIR-ATR) analyses were performed to evaluate the chemical profile of the extracts and pectin. The recycling of coffee husk waste into bioproducts in view of the circular economy contributes to minimizing the impact on the environment and to generating additional income for coffee growers.
1. Introduction
Drinking coffee and socializing in spaces designated for its consumption is a social phenomenon that has stimulated its production in different parts of the world. Coffee is grown in at least 80 countries within the so-called green coffee belt, between the Tropics of Cancer and Capricorn. However, only green coffee is exported at an early stage of the value chain, providing little added value in producing countries [1]. Considering the volatility of international coffee prices, the valorization and trade of the coffee cherry by-products and waste could be beneficial for coffee-producing families, the global coffee industry, and the environment. In that sense, the European Sustainable Development Goals promote the efficient use of natural resources and the circular economy, and coffee is the second most traded product after oil. Coffee is a versatile product and consumed in various forms, from traditional hot infusions such as espresso, to modern cold styles such as cold brew [2], coffee frappes, beverages, and nowadays, tea-like infusions.
Although the World Coffee Research’s white paper [3] recently referred to a yearly increasing cost of combating climate change effects, coffee remains an essential crop for rural economies of developing countries and livelihoods of farming families [4]. According to the International Coffee Organization [5], there are about 25 million coffee farmers worldwide, with coffee being the primary source of income for 12.5 million of these farmers. The demand for coffee is projected to continue growing over the next two decades (growth +2.0–2.5% year). Thus, the world coffee production increased to 178.0 million bags, with the Arabicas’ output rising to 102.2 million bags and the Robustas’ increasing to 75.8 million bags (year 2023/24). Unfortunately, the coffee industry has an environmental impact, affecting various aspects such as deforestation, loss of biodiversity, high carbon footprints, consumption of water resources, overproduction driven by unsustainable consumption, exploitation and social and economic inequality, poor waste management, and inefficient use of by-products and waste from processing and consumption [1,6].
The industrial coffee cherry production, including dry or wet processing, generates by-products and post-harvest waste such as hull, pulp, parchment, and silverskin [7], which represent approximately 50% of the fruit’s dry weight. Recent studies toward improving the sustainability of coffee cultivation consider by-product management systems a challenge for the biorefinery, food, and pharmaceutical industries [8]. Indeed, these by-products have a negative economic, social, ecological, and environmental impact if they are discarded directly or dumped without pretreatment. The presence of toxic compounds such as caffeine and some phenols in coffee processing waste causes serious disposal problems in countries of origin [9]. Proper disposal of these processing by-products represents not only an environmental issue but also an economic cost for producers. In 2023/2024, around 840.16 million bags/60 kg of by-products and waste were estimated in producing and consuming countries due to global coffee production [10]. Therefore, the development of value-added products from coffee waste represents an effective green strategy to boost the sustainability and resilience of the crop. Coffee by-products and waste have considerable economic potential due to their composition, which includes valuable compounds such as fatty acids, polysaccharides, polyphenols, and minerals. Unfortunately, research on coffee by-products and the extraction of bioactive compounds and macromolecules, such as pectin, unlike in Brazil, remains limited in producing countries, where their main uses are for animal feed, poultry bedding, fertilizers, or compost [2,10].
Green extraction techniques play a crucial role in extracting biomolecules from agro-industrial by-products using environmentally friendly methods [11]. Antioxidant compounds, particularly polyphenols such as chlorogenic acids and flavonoids, and the alkaloid caffeine, are of particular interest due to their health-promoting properties. These are abundant in the husk, pulp, and green coffee. Other relevant compounds are carbohydrates such as cellulose, pectin, and soluble sugars. Recently, Navajas-Porras et al. [2] reported at least 72 scientific publications specifically dedicated to coffee and its by-products as biomass for the extraction of bioactive compounds using green methods. These methods, including ultrasound-assisted extraction (UAE), enable the efficient and sustainable extraction of bioactive compounds and polymers, which have potential applications in agriculture, biofuels and bioenergy, biochemicals and biomaterials, food ingredients, cosmetics, and nutraceuticals [12].
Coffee cascara is rich in polyphenols, carotenoids, organic acids, alkaloids, amino acids, sugars, vitamins, terpenes, phospholipids, fatty acids, and minerals [10]. Pectin is one of the important substances that could be obtained from the coffee pulp, being mainly used as a gelling agent and stabilizer in food products [13,14] with beneficial effects on human health when applied in pharmaceutical and cosmetic sectors [15]. Polysaccharides such as pectin are the least studied biomolecules with green extraction techniques by coffee by-products [2,16]. Drying and grinding are some of the pretreatment processes to which raw materials are subjected when attempting to extract pectin and other polysaccharides from fruit and vegetable by-products [11]. Furthermore, many bioactive compounds in plant tissues are often difficult to extract without resorting to hydrolytic processes. This is the case of pectin, which is a structural component of the plant cell wall, or the case of some polyphenols when linked to the lignin fraction by covalent bonds. In this regard, UAE was considered a promising, simple, fast, low-cost, and effective technique to increase the yield of these compounds from coffee waste [17]. UAE techniques produce a substantial improvement in total phenol content and antioxidant activity compared to conventional extraction methods. Regarding the type of solvent used, the most commonly used are water and natural eutectic solvents [11,18]. Quispe Solano et al. [19] reported interesting results of UAE used to recover polyphenols from coffee pulp, showing successful applications of the same methods to extract antioxidants also from grape, mango peel, pomegranate peel, passion fruit bark, pitahaya peel, and lemon.
Recently, organic and inorganic bioactive compounds were identified from coffee by-products grown in traditional agroforestry in the Sierra de Zongolica, demonstrating the relevance of cultivation practices and geographical location to the metabolomic profile of the analyzed waste material. The most abundant polar and semipolar compounds in the dried husk were caffeine, chlorogenic acids (caffeoylquinic acids), quinic acid, sugars, and catechin [10]. Therefore, the RSM approach was used, which involves the application of multivariate techniques on the extraction parameters, following three steps: (1) the study of the effects of temperature, time, pH, ionic strength, ultrasonic frequency, particle size, and solid/liquid ratio on the yield of pectin and phenolic compounds from cascara using aqueous solvent and UAE; (2) the application of response surface methodology and Plackett–Burman design [20] to identify the critical factors and optimize the extraction procedure; (3) the chemical characterization of the extracts using FTIR-ATR and DART-MS.
Our study highlights the potential of dried coffee husks as an extraction matrix and ultrasound-assisted aqueous extraction as a process, where the identification of critical factors enhances the efficient extraction of pectin, sugars such as glucose, and polyphenols to generate high-value products that benefit small coffee producers.
2. Materials and Methods
2.1. Material Sample Preparation and Chemicals
The coffee husk or dry cascara (the Spanish name for husk) was obtained from the wet processing of Arabica coffee cherries (Costa Rica 95 and Garnica varieties) by families of the Nahuatl population of Tlecuaxco, located in the great mountains of the Sierra de Zongolica, in Tequila, Veracruz, Mexico. Wet processing coffee cherries and sun drying of the pulping by-product (mesocarp and exocarp) were described in our previous study [10]. Damian Xotlanihua-Flores, a researcher and coffee producer in Sierra Zongolica, supplied this dry cascara.
The coffee husk is a representative blend of the Costa Rica and Garnica varieties, and from this mix of Arabica coffees, samples were characterized by two particle sizes (with an order of magnitude of millimeters and micrometers). Briefly, the dry husk (blend) was ground in an industrial blender (Oster, Veracruz Mexico) until obtaining a particle size of less than 2.0 mm to 0.045 mm (Sieve Shaker AS 200 Control, Retsch, Germany). Then, this dried husk with millimetric size was ground in a Retsch MM400 zirconium bead micromill (Retsch GmbH, Haan, Germany) at a frequency of 22.0 s−1 for 9 min, and a sample characterized by particle micro sizes (≥65 µm) was obtained. The milled coffee husk samples were stored separately in closed and sealed plastic bags and preserved in dark and dry conditions to avoid oxidation until further extraction and analysis. Both samples of different particle sizes were used for aqueous extractions and quantitative and qualitative chemical analysis.
Chemicals: Folin–Ciocalteu, 2,2-Diphenyl-1-picrylhydrazyl (free radical), 95% Trolox, calcium carbonate anhydrous reagents, and all standards (gibberellic acid, sugar glucose, caffeine, and chlorogenic acid) were purchased from Sigma-Aldrich (20149 Milano Italy).
2.2. Extraction Conditions
Each extraction was carried out in closed bottles (50 mL) in a temperature-controlled water ultrasonic bath (FALC LBS 2, Treviglio, Italy) of 2–4.5 L with heating, multi-frequency, direct mode, and adjustable power. According to the experimental design and critical factors described for the extraction of bioactive molecules in coffee pulp [18], the milled coffee samples were extracted at various temperatures, times, ultrasonic frequencies, ionic strengths, particle sizes, and solid-to-liquid ratio conditions as described in Table 1. Each experiment was replicated four times. Once the extraction processes were finished, we carried out the analysis following the scheme reported in Figure 1. The liquid fraction with the solubilized phytochemicals was separated from coffee sample residues (CHR) by gravimetric filtration using filter paper (Whatman N° 1). The CHR were then dried at room temperature, while the liquid extracts were supplemented with ethanol (99%, 1:1 v/v) and conserved at 5 °C for 48 h to favor crude pectin precipitation. The precipitates were therefore separated by gravimetric filtration using filter paper (Whatman N° 1) and weighed before (fresh) and after drying at room temperature for 72 h. The recovered liquid fraction (water: ethanol 1:1) was centrifuged for 10 min at 16,500× g, filtered with a 0.22 µm cellulose acetate filter, and stored at −20 °C until analysis. The recovered liquid fractions (LQ) were used for total polyphenol content (TPC) and antioxidant activity (AC) assessments. Coffee sample residues (CHR) from the eight extractions were dried at room temperature, and after a second extraction with 70% HPLC-grade MeOH (Sigma-Aldrich, 20149 Milano, Italy), were analyzed for TPC and AC to assess the effectiveness of each extraction process.

Table 1.
Model and experimental conditions (independent variables) of extracts and their corresponding responses (mean values (4 n) ± standard error) according to Plackett–Burman design. S/L = ratio solid-to-liquid ratio; UF = ultrasound frequency; TPC = total polyphenol content; DW = dry weight; GAE = Gallic acid equivalent.
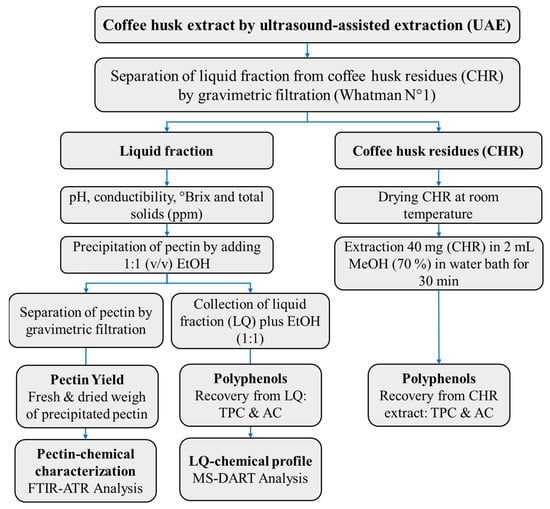
Figure 1.
Scheme of methods of pretreatments, extraction, and analysis of coffee husk samples. The method, extracts, residues, and products are highlighted in bold.
2.3. Chemical Analysis
The pectin yield (%) was calculated according to Equation (1) described in [21]:
The Folin–Ciocalteu [22] method with slight modifications was used to quantify total polyphenol content. Briefly, an aliquot of 200 µL of each extract was mixed with 1.5 mL of 0.2 N Folin–Ciocalteu reagent (Sigma-Aldrich, 20149 Milano, Italy). A blank sample was prepared by adding 200 µL of 50% EtOH or 70% MeOH. Each sample was then stirred in a bench Vortex mixer and allowed to stand for 5 min in the dark. After this time 1.5 mL of anhydrous sodium carbonate (60 g L−1) (Sigma-Aldrich, Italy) was added to the reaction mixture. Finally, the samples were allowed to stand in the dark for about 30 min until the end of the reaction. The resulting sample’s absorbance (Abs) was read at 765 nm using a UV/Visible spectrophotometer (Lambda 950—Perkin Elmer, Shelton, CT 06484-4794 U USA). All the measurements were carried out in triplicate, and the results were expressed as milligrams equivalents of gallic acid for g dry weight (mgGAE g−1 DW). A first-order calibration curve (Abs = 0.0031C − 0.0338; r2 0.9981) was obtained with four standard solutions of gallic acid (≥99% Sigma-Aldrich, Italy) in methanol (MeOH) at four known concentrations (100, 250, 500, 750 mg L−1).
Total antioxidant activity was carried out by the Blois [23] method with modifications [24]. Briefly, 100 µL of extract was added to 2.9 mL of 60 µM DPPH (Sigma-Aldrich, 20149 Milano, Italy) solution. The samples were shaken in a Vortex mixer and kept in the dark until the end of the reaction after 60 min. Absorbance was read at 517 nm using a UV/Visible spectrometer (Lambda 950—Perkin Elmer, Shelton, CT 06484-4794 U USA). The control sample was a DPPH 60 µM solution. A blank was prepared by adding 100 µL of 50% EtOH or 70% MeOH to 2.9 mL of DPPH 60 µM. The % inhibition of the radical DPPH was obtained by interpolation of the first order calibration curve (Abs = 0.3466C + 2.0431; r2 0.9999) obtained by plotting the absorbance as a function of the concentration of the reference standard Trolox (6-hydroxy-2,5,7,8-tetramethylchroman-2-carboxylic acid) (Sigma-Aldrich, Italy). A series of four standard solutions in a concentration range of 50, 100, 250, and 500 mM was prepared, for each of which the % inhibition was calculated. By interpolation of the calibration curve (A vs. µM Trolox), the % inhibition was calculated as follows with Equation (2):
- Ac = Control absorbance (DPPH 60 µM);
- As = Absorbance of the sample;
- Ab = Absorbance of the blank.
The results were expressed as µmol of Trolox equivalent (or µmol TE g−1 DW, see Supplemental Materials). All the measurements were carried out in triplicate.
2.4. Chemometric Analysis
The process for the extraction of pectin and phenolic compounds from coffee husk waste is affected by various experimental conditions, including ratio of biomass/water, ultrasound frequency, time of extraction, temperature, pH, ionic strength, and particle sizes [2,8,11,14,17,18,19]. Although all the experimental conditions indicated can influence the yield because their combination determines the extraction environment, altering both kinetic and thermodynamic parameters of the process, only some can have a significant effect. For this reason, the first objective was to identify which factors had a significant influence on the yield of the extraction process.
To define and compare the significance of the effects of each factor on the extraction yield, a series of experiments was planned according to the Screening Design proposed by R. L. Plackett and J. P. Burman [20]. In our case, the Plackett–Burman design involves only two levels, coded +1 and −1, to define only the main effects of each factor, neglecting the interaction terms and quadratic terms. The Plackett–Burman design is a useful screening design to select the most important factors affecting the process, providing data with high accuracy because it follows a combinatorial approach, where each factor with a specific level is replicated the same number of times and each pair of factors with a specific combination of levels appears the same number of times [19]. Due to the defined combinatorics conditions, considering two levels, 4k experiments are performed for 4k-1 factors, where k is an integer value. In other words, it is possible to define a Plackett–Burman design only for a defined number of factors, such as 3 (k = 1), 7 (k = 2), 11 (k = 3), and 15 (k = 4). In our case, the studied factors are 7 and, consequently, the number of planned experiments is 8. To investigate the effect of variation in each factor near typical operating conditions, the range of parameters includes the values commonly used in extraction processes.
The Plackett–Burman design is shown in Table 1, which includes the model matrix with the coded values of each factor, the experimental matrix with the real values.
The experimental data were fitted to the following polynomial model equation, which describes the relations between the response and significant independent variables with Equation (3).
Y is the experimental response, Xi is the coded factor related to the independent variable, b0 is a mathematical constant and bi is the coefficient defining the effect of the independent variable on the experimental response, and n is the number of significant variables defined by the Plackett–Burman design.
An ANOVA analysis evaluated independent variables’ relevance, influence, and interactions (p < 0.05) with the software MATLAB (R2022b, MathWorks). The variables were selected to optimize the extraction process in relation to the results.
After evaluating the significance of each coefficient, the most impactful factors can be identified and incorporated into the Full Factorial Design, from which a predictive mathematical model can be developed. To obtain a predictive model as an effective practical tool, the parameter ranges were the same as those used in the Plackett–Burman design. Since the goal of Full Factorial Design is to obtain a predictive mathematical model that is also able to identify both the direct and indirect effects of each factor on the extraction process, it is necessary to develop a polynomial function, including both the main and interaction terms, as shown in Equation (4).
where b0 is a constant, bi are the coefficients related to the main effects of the factors Xi, and bij are the coefficients related to the mutual interaction effects of the factors Xi and Xj.
This polynomial function is a useful tool for predicting extraction yields under various operating conditions and for providing a practical graphical representation that highlights the experimental conditions leading to optimal yields [19,20].
2.5. DART Mass Spectrometry of Aqueous Extractions of Dried Husk
Real-time environmental spectrometry analysis (DART) was used for the characterization of the chemical profile of the ex4 extraction according to the Plackett–Burman design and critical factors (Table 1). DART mass analysis was carried out on a JMS-T100LP AccuTOF LC-PLUS spectrometer (JEOL, Tokyo, Japan) with a DART SVP100 ion source (Ionsense, Saugus, MA, USA) as described in [10]. The DART ion source was operated with helium for analysis and nitrogen for standard mode. The gas temperature was 300 °C, the inlet pressure was 0.55 MPa, and the voltage was ±600 V in standard mode with positive and negative ions. The instrument was calibrated with a solution of PEG-600 in methanol (HPLC-grade MeOH, Sigma Aldrich, St. Louis, MO 63178 USA). The DART-MS analysis was performed by immersing a borosilicate capillary tube in the dried husk aqueous extract (ex4); subsequently, the capillary tube was located at a distance ≥ 1 cm between the helium stream of the DART ionization source and the vacuum interface for ionization and subsequent determination of m/z molecular ions in the AccuTOF detector. The acquisition of mass spectra was recorded with Mass Center System Software Version 1.5.0k, setting a mass range of m/z 50–1000 Daltons (Da). The sample was detected at least three to five times for 2–5 min.
The m/z spectra, data on molecular ions m/z, intensity, and relative abundance were obtained with the Mass Center System Version 1.5.0k software. For the identification of metabolites in aqueous extract, a comparison was made with sugar glucose (180.16 g mol−1), caffeine (194.19 g mol−1), and chlorogenic acid (354.32 g mol−1) standards. Standards were examined in the positive and negative modes, under the same conditions used for the aqueous extract. All the standards were prepared at 1 mg mL−1 in HPLC-grade water (Sigma Aldrich, St. Louis, MO 63178 USA). The major molecular precursor ions (m/z) and fragmentation of glucose [25,26], caffeine, and chlorogenic acid (standards) by DART-MS are presented in Supplementary Table S1.
2.6. FTIR-ATR Characterization of Pectin of Coffee Husk
Infrared transmittance spectra (T) were measured with a Spectrum 100 Perkin Elmer spectrometer (Santa Clara, CA, USA), in the spectral range between 500 and 4000 cm−1, with 4 cm−1 of spectral resolution, and in attenuated total reflection mode (ATR) using a multipass KRS5 crystal. Absorbance spectra were calculated (5) from transmittance as
and reported after baseline subtraction.
2.7. Statistical Analysis
The fresh pectin content (g g−1 FW), crude pectin (mg g−1 DW), total polyphenols (mgGAE g−1), and antioxidant activity (µmol TE g−1) were evaluated by one-way variance analysis (Sigma Plot ver. 12.0, Software). The means of each experiment (ex1–ex8) were compared with Tukey’s multiple range test. The results are shown in Table 1 as means with standard error.
3. Results
3.1. Factors with a Significant Impact on Ultrasound-Assisted Extraction
Table 1 reports the response variables determined as a function of the experimental conditions. All the response variables varied in different responses as a function of the extracted parameters. The p-values were used to evaluate the significance of each coefficient. p-values below p < 0.05, p < 0.01, or p < 0.001 indicated that the model terms were significant, high, or remarkably significant, respectively, and p-values greater than p > 0.05 were considered not significant.
The precipitated polysaccharidic fraction (crude pectin) ranged from 39.90 ± 0.18 to 10.77 ± 1.12 mg g−1 DW, the range of fresh pectin was between 1.525 ± 0.06 to 0.235 ± 0.02 g g−1 FW, and the percentage pectin yield (%) varied from 3.99 to 1.07% (Table 1). The highest content of precipitates was obtained at the extraction conditions of 1:20 w/v S/L ratio, US frequency of 60 kHz, temperature of 80 °C, extraction time 3 h, in acid water (pH 2), ionic strength 0.1 mM NaCl, and the highest sample particle size (mm). In contrast, although the frequency and the extraction time were the same, the differences in temperature (20 °C), ionic strength (100 mM NaCl), and solvent pH (strong basic water at pH 12) reduced the extraction efficiency in ex7 (−73%). The highest pectin extraction occurred under conditions of ex4 and ex5, with non-significant values for fresh weight (FW) and dry weight (DW) of the polysaccharide. Conditions of ex4 and ex5 share the same factors, namely temperature (80 °C), ionic strength (0.1 mM NaCl), and extraction time (3 h).
The bar charts in Figure 2 show the values of every coefficient obtained from the regression, highlighting both the standard deviation and the level of significance. The results indicate that both temperature (b4) and ionic strength (b6) significantly (p < 0.05 and p < 0.01, respectively) influenced the pectin recovery in ex4 and ex5. In particular, the temperature has a direct positive effect on the extraction process because it promotes kinetics and the thermodynamic factors related to the extraction processes due to its effect on both the dissolution rate and the solubility constant.
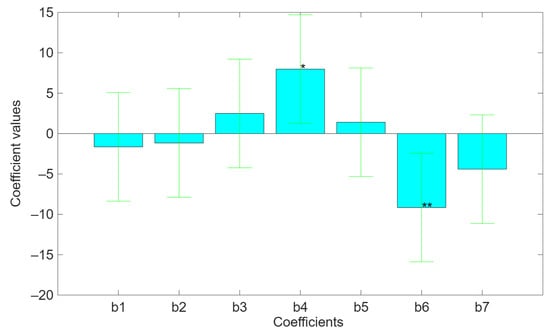
Figure 2.
Bar charts related to the values of the b-coefficients of the mathematical model describing the direct and indirect effects of independent variables on pectin recovery. In addition, it shows the standard deviation and the statistical significance for every coefficient. The bars statistically significant are b4 (* p < 0.05) and b6 (** p < 0.01).
On the other hand, the ionic strength has a negative effect on the pectin’s extraction due to the salting-out effect, which promotes the precipitation of the polysaccharide by disrupting the hydration shell around the pectin molecules. It is known that the ionic force promotes the gelling of pectin, and then it separates from the solution in the form of gel by reducing the electrostatic repulsions between the ionized carboxylate groups of the uronic acids along the pectin chains, especially at alkaline pH. The latter also promotes gelation by means of hydrogen bonds between the OH groups of the monosaccharides that make up the chains. This determining effect of the ionic force is evidenced by comparison between experiments 4, 5, and 7, in which a low ionic force has no great influence on the extraction yield of pectin at extreme pH values. On the other hand, while even at a strong alkaline pH, which strongly inhibits gelation, a drastic increase in the ionic strength causes a considerable decrease in the extraction yield. Moreover, the precipitation out of solution and the gelation make the pectin less soluble in water because it remains entrapped in the plant material.
The TPC varied from 155.81 ± 6.62 to 70.95 ± 5.15 mgGAE g−1 (Table 1). We found the best TPC concentration when the extraction conditions were biomass/water 1:20 w/v, US frequency 60 HKz, extraction temperature 80 °C, extraction time 1 h, alkaline water pH 12, ionic strength 100 mM NaCl, and the smallest particle size sample (µg). A very close amount (153.82 ± 5.98 mgGAE g−1) to the highest (−1%) was obtained with a decreased temperature (20 °C), an ultrasound frequency of 40 kHz, and an increment of extraction time (3 h). In this case, while the biomass/water ratio, water pH (12), and ionic strength (100 mM NaCl) were the same, the particle size of the sample was the greatest (order of magnitude of mg instead of µg). The bar charts in Figure 3 show the values of every coefficient obtained from the regression, highlighting both the standard deviation and the level of significance. The results indicate that three factors, biomass/water ratio (b1), ultrasound frequency (b2), and pH (b5), significantly affected (p < 0.001, p < 0.05, and p < 0.05, respectively) the polyphenol extraction. In particular, the biomass/water ratio has a negative effect on the extraction yield, since the lower the biomass/water ratio, the less solvent is available to dissolve all available polyphenols and, consequently, the extraction is incomplete. Also, ultrasound frequency has a direct effect on the extraction yield. Indeed, ultrasound creates acoustic cavitation that causes microscopic bubbles to form, grow, and collapse in the liquid. Then, when bubbles collapse near the plant cell wall, they create microjets and shock waves that destroy it, promoting the release of polyphenols. Frequency determines the energy released by the collapsed microbubbles and, therefore, higher frequency, smaller bubbles, weaker cavitation, and less mechanical disruption of the cell wall result in a lower release of polyphenols. On the contrary, pH has a positive effect on extraction processes. This is because polyphenols are weak acids, with phenolic hydroxyl groups that can lose protons. In alkaline conditions, the hydroxyl groups ionize, promoting the dissolution of polyphenols in water and, consequently, the extraction is facilitated [2,11,17].
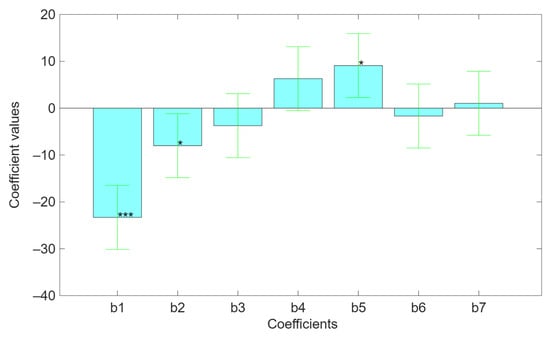
Figure 3.
Bar charts related to the values of the b-coefficients of the mathematical model describing the direct and indirect effects of independent variables on polyphenols recovery. In addition, it shows the standard deviation and the statistical significance for every coefficient. The statistically significant bars are b1 (*** p < 0.001), b2 (* p < 0.05), and b5 (p < 0.05).
We evaluated the CHR polyphenol content using a suitable polar solvent such as methanol (MeOH) to ensure that most of the antioxidants were removed. The CHR polyphenol content in the samples after the ultrasound process ranged from 21.30 to 2.29 mgGAE g−1 at ex8 and ex2, respectively (see Supplementary Materials Figure S1). Therefore, considering 168.19 mgGAE g−1 at experimental conditions ex7, which was assumed to be the process with the highest polyphenol recovery, processes with satisfactory efficiency were also observed at the conditions of ex6 and ex8 (Figure 4), where the lost polyphenols were 2.24 and 2.68 mgGAE g−1 (Figure S1). At the experimental condition of ex3, the amount of not-recovered polyphenols was −72.64%.
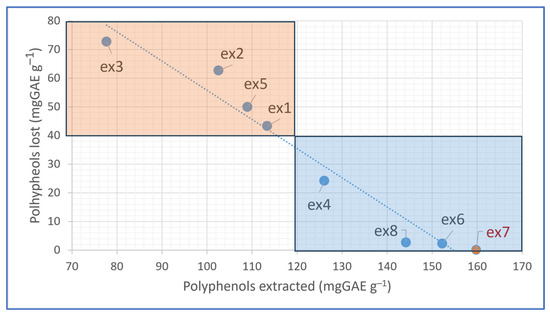
Figure 4.
Decision-making plot: the selection of the best operating condition is achieved by balancing the positive and negative effects, then plotting the amount of lost polyphenols versus extracted.
The extracts from the ultrasound experiments deprived of the saccharide fractions were evaluated by their antioxidant potential using DPPH radical as substrate. This step is needed to assess the functionality of the biomolecules extracted. As reported in Figure 5, the antioxidant activity ranged from 503.8 to 184.9 μmolTE g−1, and at ex8 conditions, we found the highest antioxidant capability (see also antioxidant activity in CHR reported in Figure S2).
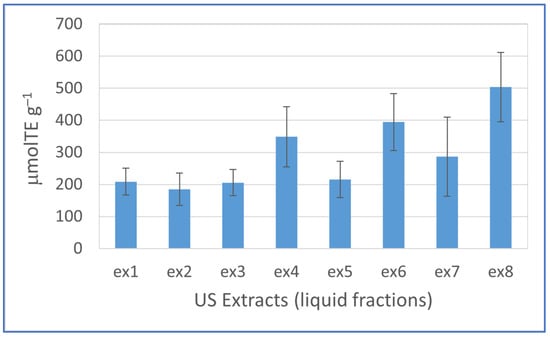
Figure 5.
Antioxidant activity of samples from experimental Plackett–Burman design. Mean values of 4 n ± standard error. TE = trolox equivalent.
3.2. Predictive Mathematical Model and Validation for Optimal Extraction Conditions
Since the goal of the experimental design is to develop a predictive mathematical model, it has been performed a multiple regression analysis was performed according to a Full Factorial Design at two levels, using only the factors that were found to significantly affect the extraction process in the Plackett–Burman analysis. Therefore, all the selected factors show a significant effect on the extraction process (p < 0.05).
Based on the regression results, predictive mathematical models were developed for both pectin and polyphenol extraction. The mathematical model for predicting the amount of dried pectin is as follows:
where b0 is a constant; b1 and b2 are the coefficients related to the main effects of the factors X1 and X2; representing the temperature and the ionic strength, respectively; and b12 is the coefficient related to the mutual interaction between factors.
Comparing the coefficients, Figure 6, it is possible to see the significant effects of both direct and indirect effects of temperature and ionic strength. As already discussed, temperature has a positive effect because it promotes the extraction, and the ionic strength has a negative effect because it inhibits the extraction. However, since the coefficient related to the mutual interaction shows a significant negative value, the inhibitory effect of ionic strength is amplified as temperature increases. When both temperature and ionic strength increase simultaneously, the negative impact of ionic strength becomes even more pronounced at higher temperatures, resulting in a greater reduction in the response than would be expected from their individual effects. This negative interaction can be explained by the fact that increasing temperature may alter system properties such as solubility, ion mobility, or solvent structure, thereby intensifying the inhibitory influence of ionic strength. This behavior likely reflects a thermodynamic or kinetic interplay between temperature and ionic strength that enhances the suppressive effect of the latter.
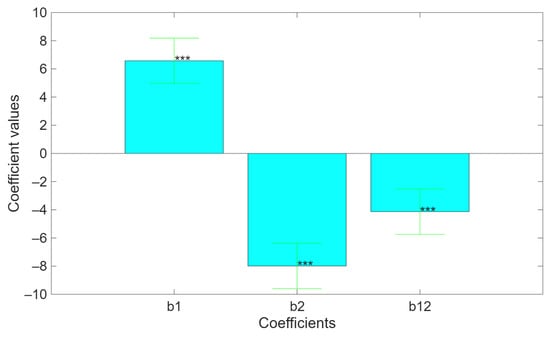
Figure 6.
Coefficient of the mathematical model related to the pectin extraction (*** p < 0.001).
In Figure 7, the three-dimensional response surface (A) and the corresponding contour plot (B) indicate the trend of pectin recovery as a function of ionic strength and temperature conditions. In the level curves of the contour plot, the effect of two independent variables on pectin extraction results is more understandable.
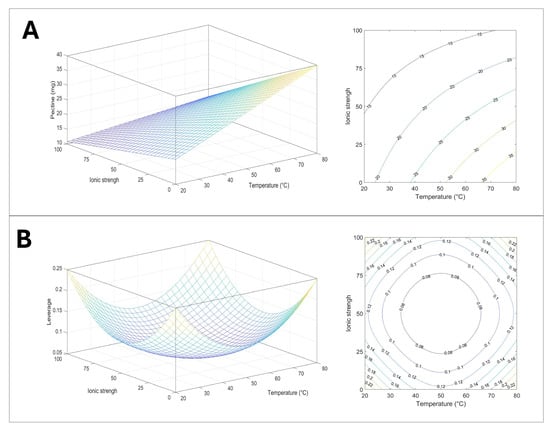
Figure 7.
Graphical representation of the model: (A) response surface and counter plot describing the effect of ionic strength and temperature on pectin extractions, 3D and 2D; (B) plot of leverage 3D and 2D.
From the cross-validation process, it is possible to assess the model’s performance. The Root Mean Square Error of Cross-Validation (RMSECV) is 3.4118, indicating that the predicted values deviate by approximately 3.41 units from the actual values, which reflects a high level of accuracy and strong generalization ability on unseen data. The explained variance in cross-validation is 91.65%, meaning that the model explains about 91.65% of the total variability in the target variable during validation. This demonstrates excellent predictive capability, with only a small portion of variance left unexplained. The standard deviation of the coefficients based on resampling is 0.8809, showing a low degree of variability in the model’s parameters across different samples. This indicates high stability and robustness of the model’s estimates.
The mathematical model for predicting the amount of polyphenols is as follows:
where b0 is a constant; b1, b2, and b3 are the coefficients related to the main effects of the factors X1, X2, and X3, representing the biomass-to-water ratio, the frequence of the ultrasonic bath, and the pH, respectively; and b12, b13, and b23 are the coefficients related to the mutual interaction between factors.
The value of each coefficient is shown in Figure 8. As already discussed, biomass-to-water ratio and frequency of the ultrasonic bath have a negative direct effect because they inhibit the extraction of polyphenols, while the solution basicity promotes the extraction. Figure 8 shows that the mutual interactions among the three factors are not significant. However, the interaction between biomass-to-water ratio and frequency of the ultrasonic bath can be assumed to be significant. Its negative value is justified thanks to compensatory interaction. When the biomass/water ratio and the ultrasound frequency increase simultaneously, the overall negative effect on polyphenol extraction, calculated from b1 × 1 + b2 × 2 + b12 × 1 × 2, results in a more severe effect than what would be expected from the sum of their individual effects, calculated from b1 × 1 + b2 × 2. In other words, there is a synergic interaction between the two factors, meaning that the ultrasound frequency may promote the negative effect against the extraction process caused by a high biomass/water ratio, or vice versa. This synergistic effect could be explained by the enhanced mechanical or cavitational action of ultrasound at higher frequencies, which may promote better mass transfer and facilitate compound release even under suboptimal solvent conditions. The graphical representations of the model are in Figure 9 and Figure 10.
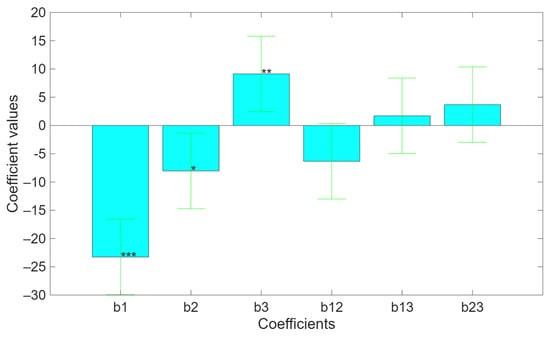
Figure 8.
Coefficient of the mathematical model related to the polyphenol’s extraction. (* p < 0.05; ** p < 0.01; *** p < 0.001).
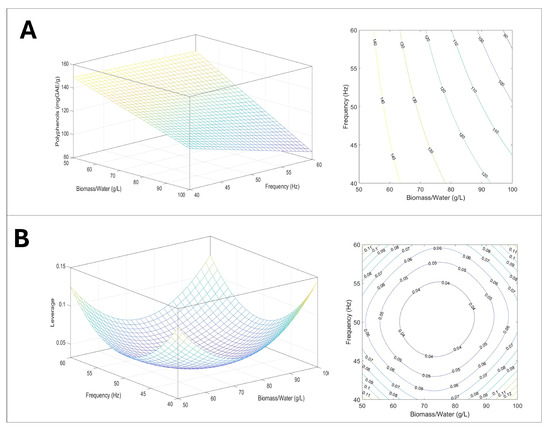
Figure 9.
Graphical representation of the model: (A) response surface and counter plot describing the effect of biomass/water and frequency on polyphenol extractions, 3D and 2D; (B) plot of leverage 3D and 2D.
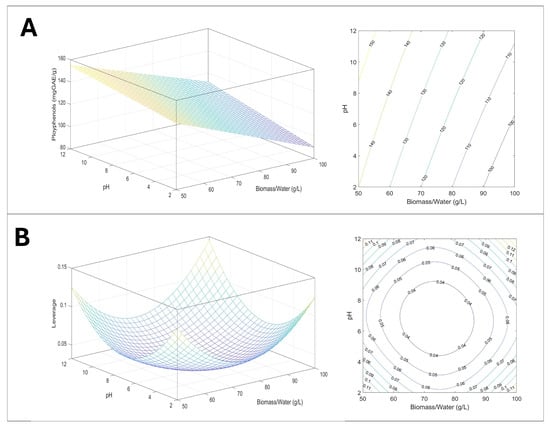
Figure 10.
Graphical representation of the model: (A) response surface and counter plot describing the effect of biomass/water and pH on polyphenol extractions, 3D and 2D; (B) plot of leverage 3D and 2D.
From the cross-validation process, it is possible to assess the model’s performance. The Root Mean Square Error of Cross-Validation (RMSECV) is 20.6606, indicating that the predicted values deviate by approximately 20.66 units from the actual values. This provides a reasonably accurate estimate of the model’s generalization ability on unseen data. The explained variance in cross-validation is 59.47%, meaning that the model accounts for about 59.47% of the total variability in the target variable during validation. While this reflects a moderately good predictive capability, it also implies that roughly 40% of the variance remains unexplained—possibly due to noise, missing variables, or inherent model limitations. The standard deviation of the coefficients, based on resampling, is 4.0235, suggesting a moderate degree of variability in the model’s coefficients across different samples. This indicates a decent level of robustness and stability in the model’s estimations.
3.3. FTIR-ATR and DART-MS Analyses
In our study, we analyzed dry pectin and the soluble fraction of the ex4 extraction using spectroscopy (FTIR-ATR) and spectrometry (DART-MS) methods, respectively. The ex4 extraction was chosen due to its positive b-coefficient value for pectin extraction (fresh and dry weight) and TPC (Table 1). The extraction conditions in ex4 were of biomass/water 1:20 (w/v), 60 kHz, 80 °C, extraction time 3 h, acid water (pH 2), ionic strength 0.1 mM NaCl, and mm size.
The FTIR spectra of pectin from coffee husk, reported in Figure 11, exhibit typical functional group bands characteristic of that type of polysaccharides [27,28]. The large intense band between 3500 and 3200 cm−1 is attributed to the stretching vibrations of the O-H group; the latter is present in carbohydrates, but it is not a diagnostic peak since it is strongly influenced by the hydration condition of the sample. The absorption peaks between 2950 and 2800 cm−1 are attributed to the C-H stretching vibrations modes, from CH, CH2, and CH3 [21] groups in the carbohydrate backbone. In the so-called fingerprint spectral region, between 1500 cm−1 and 800 cm−1, the relative intensities and the positions of the peaks, which are attributed to C-O-C stretching, O-H bending, and CH3 deformation modes, are univocally related to a specific compound [28]. The bands centered around 1600 cm−1 and 1740 cm−1 are attributed to the esterified and free carboxylic groups, respectively. Therefore, these bands are valuable to estimate the DE and % MeO of pectin [13,29]; according to the literature, the degree of esterification (DE) after the subtraction of a background was calculated by the areas of the peaks and the obtained values used in Equation
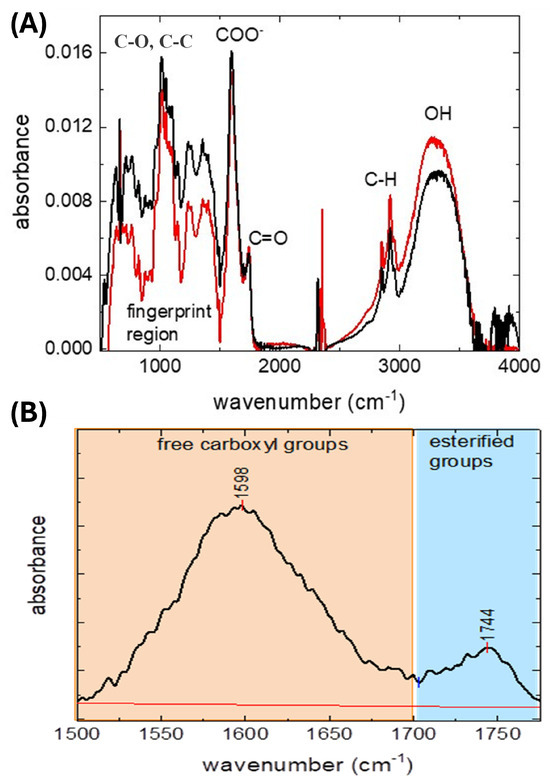
Figure 11.
FTIR analysis of pectin obtained from coffee dried husk by experimentation ex4: (A) FTIR spectrum of coffee husk pectin. Two replicas are presented. (B) Peaks and area in the zone close to 1600 cm−1 and −1740 cm−1 that correspond to the free carboxyl and esterified groups of husk pectin, respectively.
From the obtained values of DE, the percentage of methoxylation (% MeO) was then calculated using Equation (9), originally proposed in [27] and used in [21] to characterize pectin decomposition products:
Values of 18% for DE and 2.94% MeO (Supplementary Materials Table S2) were obtained for the pectin extracted from dried coffee husks.
Direct analysis in real time (DART) AccuTOF LC Plus allows the rapid evaluation of principal bioactive compounds in the coffee husk extract ex4. DART-MS analysis showed a chemical profile with molecular ions and characteristic adducts of glucose, caffeine, chlorogenic acid, and quinic acid (Figure 12). In positive mode, glucose-ammonia adducts (198 m/z) type [M+NH4]+ are observed, as well as water desorptions from sugar [M+NH4-nH2O]+ and other molecular ions such as 242 m/z and 225 m/z. Caffeine is observed as the molecular ion at 195 m/z type [M+H]+. Different m/z ions of caffeine (212 m/z, * in blue) and chlorogenic acids (191, 181, and 171 m/z, * in black) are observed in the DART-MS spectrum (Figure 12A). The molecular ion 183 m/z can be related to an organic acid, quinic acid, as a [M+H]+ type adduct.
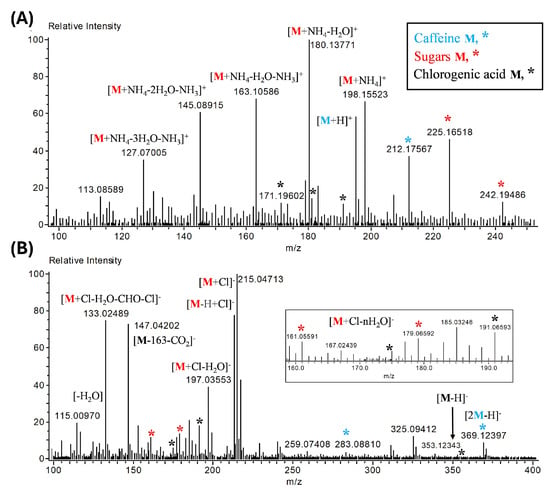
Figure 12.
DART mass spectra of coffee dried husk extract (ex4). The analysis was performed with a heated argon gas temperature of 300 ˚C in the positive (A) and negative (B) ion mode. The major molecular ions for caffeine (M in blue), sugars or glucose (M in red), and chlorogenic acid (M in black) molecules are represented as positive and negative adducts, or reported fragments (*). Positive adducts: [M+H]+, [M+NH4]+, and water and ammonium desorptions [M-nH2O-NH3]. Negative adducts: [M-H]−, [M-H+Cl]−, [M+Cl]−, desorptions [M-nH2O]−, and fragmentations [-CHO-Cl-CO2]−. The mass to charge ratio (m/z) of each ion is represented by the value of the peaks (see also Table S1 in Supplementary Materials).
DART mass spectrum of the ex4 extract in negative ion mode is shown in Figure 12B. The glucose adduct 215 m/z, due to the addition of a chlorine molecule [M+Cl]−, was the most abundant molecular ion, in addition to the 133 m/z adduct related to sugars. This sugar adduct 133 m/z is suggested to be of the [M+Cl-H2O-CHO-Cl]− type. Other glucose adducts due to the loss of water molecules [-nH2O] are observed in negative mode. Molecular ions related to chlorogenic acids and caffeine are also observed. In negative mode, it is favorable to observe ions related to chlorogenic acids, such as caffeolquinic acids (191, 175, 147 m/z), compared to caffeine (369 and 283 m/z). Also, catechin (290.27 g mol−1) can be represented by the molecular ions 325 m/z [30] and 229 m/z, which correspond to [M+Cl]− and [M+Cl-catechol]− type adducts, respectively, and an unknown adduct, 185 m/z, with good intensity is also present in the ex4 extract (Figure 12B).
4. Discussion
Dried coffee husk (cascara) is an abundant and underutilized biomass residue originating from the wet processing of coffee cherries (it accounts for about 45–50% w/w of the coffee cherry). It comprises skin, pulp, and parts of parchment. In our previous work [10], we identified organic and inorganic bioactive compounds of coffee by-products, reporting the metabolomic profile by HPLC-ESI-HRMS of the aqueous extract of the dried coffee husk, which highlighted 93 non-volatile molecules (peel and pulp). Therefore, the recovery of this by-product rich in bioactive compounds is proposed as a sustainable alternative to valorize waste materials through the recovery of high-value biomolecules while reducing the environmental impact and the cost of disposal. Here, we applied ultrasound-assisted extraction (UAE) for its effectiveness, low cost, and reproducibility of using water as a solvent, unlike conventional extraction processes. This advantage increases the sustainability of the process as it fits within the scope of the use of green technologies [31,32]. Therefore, we exploited the capability of ultrasound-assisted extraction to greatly increase the recovery of two target products: polyphenols and pectin.
Carbohydrates are one of the main constituents of coffee husk, being in significant quantities in pulp within this product [17,33]. Li et al. [34] reported structural characteristics of pectin in coffee husk as an amorphous low-methoxyl pectin mainly composed of rhamnose (2.55%), galacturonic acid (45.01%), β-N-acetyl glucosamine (5.17%), glucose (32.29%), galactose (6.80%), xylose (0.76%), and arabinose (7.42%). A previous work reported the predominance of galacturonic acid followed by galactose, maltose, arabinose, and glucose in coffee pulp [14]. In our study, the pectin from coffee husk is low in methoxyl (2.94%) and low in esterification (18% DE) when compared to pectin obtained from coffee pulp and mucilage, and the peel of other agro-industrial wastes [16,21,35,36,37] (see also Table S1). However, these values agreed with the results reported by [35] of pectin extracted from dried coffee pulp (solid) and mucilage in aqueous solution and acidic pH. Low-methoxyl (LM) pectin forms gels in the presence of calcium ions (Ca2+) without high sugar content, and often at pH 2.0–6.0 [38]. Thus, this compound has a great relevance because it could be successfully applied in the food industry due to low sugar; low calories; and its suitable performances, for instance in jam, drinks, ice creams, and breads; and in the cosmetic sector for their various beneficial properties, including moisturizing, anti-aging, and wound healing. Furthermore, plant polysaccharides are increasingly utilized in the pharmaceutical industry as excipients, drug delivery vehicles, and for their therapeutic properties [38,39,40].
When ultrasound waves are applied to such complex material as coffee husk in water, the formation of microbubbles creates cavitation in the liquid medium, providing a high shear force that promotes the contact between solid and liquid, causing erosion, fragmentation, capillary actions, and tissue disruption, which accelerates cell destruction and mass transfer [39,40]. Therefore, the derived extract usually occurs as a combination of various types of bioactive compounds or phytochemicals with different polarities, also affected by the parameters of the extraction process. In this case, the isolation of bio-active target compounds from crude extract requires some preparative techniques (i.e., solid-phase extraction) and the application of separation techniques, including HPLC or the combination of HPLC and MS.
From our statistical elaboration, the critical factors that affected pectin recovery are temperature and ionic strength (p < 0.05 and p < 0.01, respectively). The increment of temperature leads to an increase in the mass transfer coefficient, because of the higher molecule’s kinetic energy, which promotes their more rapid diffusion in the extraction liquid. In addition to this, solubility in the solvent also increases [41]. In this sense, [42] found that an increased extraction temperature enhances the UAE efficiency due to the increase in porosity of the material and a more significant solvation. This results in a more effective mass transfer, leading to increased release of bioactive compounds in solution [43]. Recently, Vallejos-Jiménez et al. [37] reported similar results from dried coffee pulp using response surface methodology, where extraction temperature (90 °C) and time (35 min) were the most important critical factors. A previous work [44] accounted for a pectin yield of 4.99% from Robusta coffee pulp, comparable with the yield at ex4 and ex5 conditions (Table 1). However, excessive temperature could negatively influence the properties of extracts by contributing to the hydrolysis of polysaccharides, as occurred in Opuntia ficus-indica mucilage [26,45].
As part of the multifactorial experiment we developed, the best yield of pectin (39.90 ± 11.40–37.55 ± 0.36 mg g−1 DW) was achieved when we extracted 1 g of dry coffee husk at the conditions of ex4 and ex5, respectively. This result is also confirmed by proximal analysis (see Table S3, Supplementary Materials); the sugar content (°Brix) of ex5 was higher than the others (2.52 ± 0.92). Therefore, considering that this fraction contains impurities such as pigments and protein, the decolorization and the deproteinization treatments allow obtaining a fraction of purified pectin yield that amounts to about 20% w/w dry matter as reported by [34].
Pectins are polyelectrolytes whose gelation behavior and interactions with ions are affected by the solution’s ionic strength [46]. The presence of 0.1 mM NaCl enhances the recovery of mucilage from coffee husk, higher temperatures promote the extraction yield of pectin more than the frequency of ultrasound and pH. It is noted that even the low ionic force favors the extraction yield. Applying the highest temperature and the lowest ionic strength, the yield is boosted by a strong acid and a strong alkaline pH. This could be explained by the fact that in a strongly alkaline environment, practically all the carboxylic groups of the uronic acids, which make up pectin, are ionized. This results in a higher repulsion between them, so that the polysaccharide molecules tend to take on a less compact structure, which facilitates their solubilisation by water. Probably a higher concentration of Na ions (greater ionic strength) tends to partially attenuate this phenomenon due to the interaction of ionized groups with Na ions, and this could explain the increased solubility of pectin at low ionic strength [45,47].
The TPC varied from 155.81 ± 6.62 to 70.95 ± 5.15 mg GAE g−1. Using UAE, [19] found a content of polyphenols ranging from 27.09 to 41.16 mg GAE g−1 in the extract from skin and pulp of coffee. As reported by Rebollo-Hernanz et al. [48], the TPC varied from 3.28 to 5.93 mgGAE g−1 in samples of coffee husk applying heat-assisted extraction. In their review, Lestari et al. [49] asserted that the aqueous extract is the most common process method used to recover biomolecules from various coffee by-products; however, certain factors such as the coffee variety, the kind of by-product, and the process techniques can affect the results, making them not comparable (see also [18]). We found that S/L ratio, US frequency, and pH were among the factors that significantly affect the polyphenols recovery. Rebollo-Hernanz et al. [48] applied the response methodology surface and found that the ratio of solid to solvent and acidity are two critical parameters of TPC extraction from coffee husk. They reported that a decrease in the S/L ratio enhances the extraction of phenolic compounds from plant matrices by reducing the saturation effects due to the concentration of phenolic compounds.
Our results agree with other authors [50,51,52] that the extraction yield increased with decreasing S/L ratio because of a larger concentration gradient during diffusion from the solid into the solution. It is known, in fact, that the decrease in the S/L ratio implies a greater availability of the solvent volume around the biomass particles. The steeper gradient thus generated at the solid/liquid interface promotes faster and greater dissolution of the molecules (higher distribution coefficient). Furthermore, the phenolic stability of the extract is influenced by the pH of the sample; therefore, Nardini et al. [53] showed that the acidity of the eluent was associated with the increased stability of catechins and their isomers in comparison with alkaline conditions. We obtained the best polyphenols yield at ex6 and ex7, where the initial pH of the solvent-water was 12; however, the extracts after the sonication process showed a pH of 4.28 ± 0.02 and 4.34 ± 0.03, respectively (see Table S3). As Peng et al. [54] demonstrated, raising the pH could lead to the deprotonation of phenolic hydroxyl groups, increasing hydrophilicity and water solubility. Furthermore, recent studies confirmed that an increase in pH increases the antiradical activity of polyphenols [55]. In our study, we confirmed that the high content of phenolic compounds from coffee husk at UAE-assisted was reflected in an enhanced variable antioxidant activity, which ranged from 503.8 to 184.9 μmolTE g−1. As reported by Tran et al. [56], the extraction conditions influenced the bioactive properties of the target compounds. The same conclusion was reported by Silva et al. [57], who indicated how the interaction between process and raw material, process and solvent, and raw material and solvent had a significant effect on the antioxidant activity. However, a limitation of our work in this aspect is the lack of complementary tests to assess radical scavenging ability. As suggested by Hu et al. [58], after gathering the results of many researchers on several extraction techniques, the use of other tests, such as ABTS (2,2-azino-bis-3-ethylbenzothiazoline-6-sulphonic acid) methodology, is critical to analyze complex coffee by-product-based matrices.
Chemical profiling by DART-MS under ex4 conditions showed the presence of sugars, caffeine, chlorogenic acids such as caffeoylquinic acid (CQA), quinic acid, and catechin in the soluble fraction. These bioactive compounds present in ex4 are markers of coffee cherries and beans’ ripeness [58], target molecules in our study, and could correlate with the local practices of manual and selective harvesting of ripe coffee berries in our previous study [10]. The polyphenols observed in DART-MS were related to the high TPC value (135.61 ± 17.55 mgGAE g−1) observed for ex4 conditions, which are characterized by pH 2, S/L 1:20 (w/v), US frequency of 60 kHz, milli granulometry (mm), 0.1 mM NaCl, 3 h of extraction, and temperature of 80 °C. The relative intensity of the molecular ions (m/z) related to sugars, in positive and negative modes, indicates their abundance in coffee husk extracts. This abundance of glucose in the aqueous extraction ex4 can be attributed to the breakdown of major sugars due to the influence of high temperature (80 °C), as mentioned by Bacchetta et al. [45], although the highest pectin yields (4%) were also recovered in ex4 in this study. Likewise, the ultrasound-assisted extraction itself seems to be responsible for the abundance of glucose in the soluble fraction. Finally, our results demonstrate the importance of response surface methodology and ultrasound-assisted extraction for the simultaneous extraction of pectin, glucose, caffeine, chlorogenic acids (CQA), quinic acid, and catechin.
In the present work, we also found the frequency of the US wave among the critical factors, which significantly affect the extraction process. As the ultrasonic frequency declines, the rise in oscillation cycle of cavitation bubbles results in an intensification of cavitation activity with positive effects on the extraction process [17]. Nevertheless, the bioactive compounds may degrade if the ultrasonic frequency is too high [32]. This could explain the loss in polyphenols, particularly at the ex2 and ex3 conditions, where the ultrasound frequency was the highest. However, limited extraction efficiency and selectivity, together with the eventual depletion of bioactive compounds due to hydrolysis and oxidation during extraction, are the main drawbacks widely perceived in this kind of extraction process [18].
5. Conclusions
In conclusion, the combination of UAE with various other process parameters using the statistical method of the response surface methodology helps us to better clarify the impact of different extraction parameters on the extractive efficiency of valuable added compounds contained in the complex coffee husk matrix. The identification of statistically significant factors for pectin and polyphenol extraction leads to an improvement in the extraction process. Ionic strength and temperature were found to be critical process variables for crude pectin extraction, while the main factors responsible for phenolic extraction were ultrasonic frequency, pH, and solid/liquid ratio. Therefore, the operating conditions to optimize the extraction of both pectin and phenolic compounds were an extraction temperature of 80 °C, ultrasonic frequency of 60 kHz, a solid/liquid ratio of 1:20 w/v, and a solvent pH of 2 or 12, respectively, for polysaccharides or polyphenols. Further studies on green-assisted extraction tools and their effects in terms of quality of extracts are required to obtain high-added-value co-products. Specific research activities should also be undertaken to render the extraction process from coffee by-products less technically challenging and more inexpensive to avoid possible critical barriers to their commercial-scale applications.
Supplementary Materials
The following supporting information can be downloaded at https://www.mdpi.com/article/10.3390/biomass5030053/s1. Table S1. Adducts in the positive ion mode (A) and the negative ion mode (B) for glucose, caffeine, and chlorogenic acid standards in MS-DART (300 °C); Table S2. Characterization of pectin extracted from dried coffee husk; Table S3. Proximal compositions (pH, conductivity, °Brix, total solids) of extracts according to multifactorial experimental design. Mean values ± standard error; Figure S1. Total polyphenol contents of 1 g coffee husk extracted in water by multifactorial experiments (TPC1) and residual polyphenol contents of the same samples extracted a second time by the conventional method (TPC2). Mean value of 4 n ± standard error; Figure S2. Antioxidant activity of extracts from the CHR samples.
Author Contributions
Conceptualization, B.L., B.-Q.E., and M.O.; methodology, Z.F., B.L., and M.O.; software, Z.F.; validation, Z.F., B.L., and M.O.; formal analysis, P.S., G.S., and B.-Q.E.; investigation, M.O., B.L., and B.-Q.E.; data curation, Z.F., and B.-Q.E.; writing—original draft preparation, B.L.; writing—review and editing, B.L., B.-Q.E., M.O., and Z.F.; visualization, B.-Q.E.; supervision, B.L. All authors have read and agreed to the published version of the manuscript.
Funding
IILA: International Italian–Latin American Organization supported an international fellowship (https://iila.org/es/, accessed on 13 June 2025).
Data Availability Statement
Data is contained within the article/supplementary material.
Acknowledgments
The authors thank QFB. Luis Miguel Rojas Abarca from the Laboratorio de Análisis y Diagnóstico del Patrimonio (LADiPA), El Colegio de Michoacán, for the DART-MS mass spectrometry analysis. In addition, the authors acknowledge Damian Xotlanihua Flores, Tlecuaxco Collective, and coffee producers from Sierra de Zongolica, Veracruz, in Mexico. The authors also thank El Colegio de Michoacán and ENEA Casaccia for providing infrastructure and equipment.
Conflicts of Interest
All the authors declare no conflicts of interest.
Correction Statement
This article has been republished with a minor correction to the Data Availability Statement. This change does not affect the scientific content of the article.
References
- Xotlanihua-Flores, D.; Crespo-Stupková, L. Exportaciones del café mexicano a los mercados estadounidense y alemán. Rev. Iberoam. Vitic. Agroind. Ruralidad 2024, 11, 150–169. [Google Scholar] [CrossRef]
- Navajas-Porras, B.; Castillo-Correa, M.; Navarro-Hortal, M.D.; Montalbán-Hernández, C.; Peña-Guzmán, D.; Hinojosa-Nogueira, D.; Romero-Márquez, J.M. The Valorization of Coffee By-Products and Waste Through the Use of Green Extraction Techniques: A Bibliometric Analysis. Appl. Sci. 2025, 15, 1505. [Google Scholar] [CrossRef]
- Maredia, M.; Martínez, J.M. Coffee’s Innovation Crisis: Determining the Size of the Agricultural R&D Investment Gap for Coffee Amid Growing Consumer Demand and the Climate Crisis. World Coffee Research 2023. Available online: https://worldcoffeeresearch.org/resources/coffees-innovation-crisis (accessed on 13 June 2025).
- Poncet, V.; van Asten, P.; Millet, C.P.; Vaast, P.; Allinne, C. Which diversification trajectories make coffee farming more sustainable? Curr. Opin. Environ. Sustain. 2024, 68, 101432. [Google Scholar] [CrossRef]
- International Coffee Organization. Sustainability and Resilience of Global Coffee Value Chain. 2024. Available online: www.icocoffee.org/documents/cy2023-24/report-global-coffee-funding-mechanisms-june-2024-e.pdf (accessed on 13 June 2024).
- Barreto Peixoto, J.A.; Silva, J.F.; Oliveira, M.B.P.P.; Alves, R.C. Sustainability Issues along the Coffee Chain: From the Field to the Cup. Comp. Rev. Food Sci. Food Saf. 2023, 22, 287–332. [Google Scholar] [CrossRef]
- Klingel, T.; Kremer, J.I.; Gottstein, V.; de Rezende, T.R.; Schwarz, S.; Lachenmeier, D.W. A review of coffee by-products including leaf, flower, cherry, husk, silver skin, and spent grounds as novel foods within the European Union. Foods 2020, 9, 665. [Google Scholar] [CrossRef] [PubMed]
- Bondam, A.F.; Diolinda da Silveira, D.; Pozzada dos Santos, J.; Hoffmann, J.F. Phenolic compounds from coffee by-products: Extraction and application in the food and pharmaceutical industries. Trends Food Sci. Technol. 2022, 123, 172–186. [Google Scholar] [CrossRef]
- Kumar, S.S.; Swapna, T.S.; Sabu, A. Coffee Husk: A Potential Agro-Industrial Residue for Bioprocess. In Waste to Wealth. Energy, Environment, and Sustainability; Singhania, R., Agarwal, R., Kumar, R., Sukumaran, R., Eds.; Springer: Singapore, 2018; pp. 97–109. [Google Scholar] [CrossRef]
- Bojórquez-Quintal, E.; Xotlanihua-Flores, D.; Bacchetta, L.; Diretto, G.; Maccioni, O.; Frusciante, S.; Rojas-Abarca, L.M.; Sánchez Rodríguez, E. Bioactive Compounds and Valorization of Coffee By-Products from the Origin: A Circular Economy Model from Local Practices in Zongolica, Mexico. Plants 2024, 13, 2741. [Google Scholar] [CrossRef] [PubMed]
- Usman, M.; Nakagawa, M.; Cheng, S. Emerging Trends in Green Extraction Techniques for Bioactive Natural Products. Processes 2023, 11, 3444. [Google Scholar] [CrossRef]
- Pongsiriyakul, K.; Wongsurakul, P.; Kiatkittipong, W.; Premashthira, A.; Kuldilok, K.; Najdanovic-Visak, V.; Adhikari, S.; Cognet, P.; Kida, T.; Assabumrungrat, S. Upcycling Coffee Waste: Key Industrial Activities for Advancing Circular Economy and Overcoming Commercialization Challenges. Processes 2024, 12, 2851. [Google Scholar] [CrossRef]
- Urias-Orona, V.; Rascón-Chu, A.; Lizardi-Mendoza, J.; Carvajal-Millán, E.; Gardea, A.A.; Ramírez-Wong, B. A Novel Pectin Material: Extraction, Characterization and Gelling Properties. Int. J. Mol. Sci. 2010, 11, 3686–3695. [Google Scholar] [CrossRef]
- Manasa, V.; Padmanabhan, A.; Anu Appaiah, K.A. Utilization of coffee pulp waste for rapid recovery of pectin and polyphenols for sustainable material recycle. Waste Manag. 2021, 120, 762–771. [Google Scholar] [CrossRef]
- Novosel’skaya, I.L.; Voropaeva, N.L.; Semenova, L.N.; Rashidova, S.S. Trends in the science and applications of pectins. Chem. Nat. Comp. 2000, 36, 1–10. [Google Scholar] [CrossRef]
- Biratu, G.; Woldemichael Woldemariam, H.; Girma Gonfa, G. Optimization of pectin yield extracted from coffee Arabica pulp using response surface methodology. Heliyon 2024, 10, e29636. [Google Scholar] [CrossRef] [PubMed]
- Özdemir, M.; Yildirim, R.; Yurttaş, R.; Başargan, D.; Hakci, M.B. A Review of ultrasound-assisted extraction of bioactive compounds from coffee waste. Derleme Gida 2025, 50, 56–73. [Google Scholar] [CrossRef]
- Hu, S.; Gil-Ramírez, A.; Martín-Trueba, M.; Benítez, V.; Aguilera, Y.; Martín-Cabrejas, M.A. Valorization of coffee pulp as bioactive food ingredient by sustainable extraction methodologies. Curr. Res. Food Sci. 2023, 6, 100475. [Google Scholar] [CrossRef] [PubMed]
- Quispe Solano, M.A.; Corilla Flores, D.D.; Chuquilín-Goicochea, R.; Espinoza Silva, C.R.; Camayo Lapa, B.F.; Huamán De La Cruz, A.R.; Manyary Cervantes, G.M. Optimization of ultrasound-assisted extraction of polyphenols from coffee (Coffea arabica L.) shell and pulp using response surface methodology. J. Southwest Jiaotong Univ. 2022, 57, 600–616. [Google Scholar] [CrossRef]
- Analytical Methods Committee AMCTB. Experimental design and optimisation (4): Plackett–Burman designs. Anal. Methods 2013, 5, 1901–1903. [Google Scholar] [CrossRef] [PubMed]
- López-Mercado, J.; Nambo, A.; Toribio-Nava, M.E.; Melgoza-Sevilla, O.; Cázarez-Barragán, L.; Cajero-Zul, L.; Guerrero-Ramírez, L.-G.; Handy, B.E.; Cardenas-Galindo, M.-G. High and low esterification degree pectins decomposition by hydrolysis and modified Maillard reactions for furfural production. Clean. Technol. Environ. Policy 2018, 20, 1413–1422. [Google Scholar] [CrossRef]
- Singleton, V.L.; Orthofer, R.; Lamuela-Raventós, R.M. Analysis of total phenols and other oxidation substrates and antioxi-dants by means of Folin-Ciocalteu reagent. Methods Enzymol. 1999, 299, 152–178. [Google Scholar] [CrossRef]
- Blois, M. Antioxidant Determinations by the Use of a Stable Free Radical. Nature 1958, 181, 1199–1200. [Google Scholar] [CrossRef]
- Bacchetta, L.; Canditelli, M.; Platamone, G.; Procacci, S.; Di Palma, P.R.; Maccioni, O.; Montereali, M.R.; Alisi, C.; Forni, C. Use of cactus pear pruning waste to improve soil properties and to produce high-quality compost. Org. Agr. 2024, 14, 263–275. [Google Scholar] [CrossRef]
- Wang, Y.; Liu, L.; Ma, L.; Liu, S. Identification of saccharides by using direct analysis in real time (DART) mass spectrometry. Int. J. Mass Spectrom. 2014, 357, 51–57. [Google Scholar] [CrossRef]
- Procacci, S.; Bojórquez-Quintal, E.; Platamone, G.; Maccioni, O.; Lo Vecchio, V.; Morreale, V.; Alisi, C. Opuntia ficus-indica Pruning Waste Recycling: Recovery and Characterization of Mucilage from Cladodes. Nat. Resour. 2021, 12, 91–107. Available online: https://www.scirp.org/html/2-2001000_108538.htm (accessed on 20 April 2021). [CrossRef]
- Zouambia, Y.; Ettoumi, K.Y.; Krea, M.; Moulai-Mostefa, N. A new approach for pectin extraction: Electromagnetic induction heating. Arab. J. Chem. 2017, 10, 480–487. [Google Scholar] [CrossRef]
- Kozioł, A.; Sroda-Pomianek, K.; Górniak, A.; Wikiera, A.; Cyprych, K.; Malik, M. Structural Determination of Pectins by Spectroscopy Methods. Coatings 2022, 12, 546. [Google Scholar] [CrossRef]
- Lira-Ortiz, A.L.; Reséndiz-Vega, F.; Ríos-Leal, E.; Contreras-Esquivel, J.C.; Chavarría-Hernández, N.; Vargas-Torres, A.; Rodríguez-Hernández, A.I. Pectins from waste of prickly pear fruits (Opuntia albicarpa Scheinvar ‘Reyna’): Chemical and rheological properties. Food Hydrocoll. 2014, 37, 93–99. [Google Scholar] [CrossRef]
- Choudhary, D.K.; Chaturvedi, N.; Singh, A.; Mishra, A. Characterization, inhibitory activity and mechanism of polyphenols from faba bean (gallic-acid and catechin) on a-glucosidase: Insights from molecular docking and simulation study. Prep. Biochem. Biotechnol. 2019, 50, 123–132. [Google Scholar] [CrossRef]
- Carreira-Casais, A.; Carpena, M.; Pereira, A.G.; Chamorro, F.; Soria-Lopez, A.; Perez, P.G.; Otero, P.; Cao, H.; Xiao, J.; Simal-Gandara, J.; et al. Critical variables influencing the ultrasound-assisted extraction of bioactive compounds—A review. Chem. Proc. 2021, 5, 50. [Google Scholar] [CrossRef]
- Beaudor, M.; Vauchel, P.; Pradal, D.; Aljawish, A.; Phalip, V. Comparing the efficiency of extracting antioxidant polyphenols from spent coffee grounds using an innovative ultrasound assisted extraction equipment versus conventional method. Chem. Eng. Process 2023, 188, 109358. [Google Scholar] [CrossRef]
- Hoseini, M.; Cocco, S.; Casucci, C.; Cardelli, V.; Corti, G. Coffee by-products derived resources—A review. Biomass Bioenergy 2021, 148, 106009. [Google Scholar] [CrossRef]
- Li, Z.; Zhou, B.; Zheng, T.; Zhao, C.; Gao, Y.; Wu, W.; Fan, Y.; Wang, X.; Qiu, M.; Fan, J. Structural characteristics, rheological properties, and antioxidant and anti-glycosylation activities of pectin polysaccharides from Arabica coffee husks. Foods 2023, 12, 423. [Google Scholar] [CrossRef] [PubMed]
- Garcia, R.; Arriola, D.; de Arriola, M.C.; de Porres, E.; Rolz, C. Characterization of coffee pectin. LWT Food Sci. Technol. 1991, 129, 125–129. [Google Scholar]
- Reichembach, L.H.; de Oliveira Petkowicz, C.L. Extraction and characterization of a pectin from coffee (Coffea arabica L.) pulp with gelling properties. Carbohydr. Polym. 2020, 245, 116473. [Google Scholar] [CrossRef]
- Vallejos-Jiménez, A.; Cadena-Chamorro, E.M.; Santa, J.F.; Buitrago-Sierra, R.; Dugmore, T.I.J.; Bose, S.; Matharu, A.S. Development of novel pectin-based films from coffee waste: Mucilage and pulp. Waste Biomass Valori 2025, 16, 1–16. [Google Scholar] [CrossRef]
- Chandel, V.; Biswas, D.; Roy, S.; Vaidya, D.; Verma, A.; Gupta, A. Current advancements in pectin: Extraction, properties and multifunctional applications. Foods 2022, 11, 2683. [Google Scholar] [CrossRef] [PubMed]
- Kumar, K.; Srivastav, S.; Sharanagat, V.S. Ultrasound assisted extraction (UAE) of bioactive compounds from fruit and vegetable processing by-products: A review. Ultrason. Sonochem 2021, 70, 105325. [Google Scholar] [CrossRef]
- Singh, N.; Yadav, S.S. A review on health benefits of phenolics derived from dietary spices. Curr. Res. Food Sci. 2022, 5, 1508–1523. [Google Scholar] [CrossRef]
- Hammann, W.; Ross, A.; Seames, W. Sequential extraction of carbohydrates and lipids from Chlorella vulgaris using combined physical and chemical pretreatments. Chem. Eng. 2024, 8, 11. [Google Scholar] [CrossRef]
- Tran, T.M.K.; Akanbi, T.; Kirkman, T.; Nguyen, M.H.; Vuong, Q.V. Optimal aqueous extraction conditions as a green technique for recovery of phenolic antioxidants from Robusta dried coffee pulp. Eur. J. Eng. Technol. Res. 2020, 5, 1069–1074. [Google Scholar] [CrossRef]
- Maran, J.P.; Priya, B.; Al-Dhabi, N.A.; Ponmurugan, K.; Moorthy, I.G.; Sivarajasekar, N. Ultrasound assisted citric acid mediated pectin extraction from industrial waste of Musa balbisiana. Ultrason. Sonochem 2017, 35, 204–209. [Google Scholar] [CrossRef]
- Serrat-Díaz, M.; De la Fé-Isaac, Á.D.; De la Fé-Isaac, J.A.; Montero-Cabrales, C. Extracción y caracterización de pectina de pulpa de café de la variedad Robusta. Rev. Cuba. Química 2018, 30, 522–538. [Google Scholar]
- Bacchetta, L.; Maccioni, O.; Martina, V.; Bojorquez-Quintal, E.; Persia, F.; Procacci, S.; Zaza, F. Quality by design approach to optimize cladodes soluble fiber processing extraction in Opuntia ficus indica (L.) Miller. J. Food Sci. Technol. 2019, 56, 3627–3634. [Google Scholar] [CrossRef] [PubMed]
- Tibbits, C.W.; MacDougall, A.J.; Ring, S.G. Calcium binding and swelling behaviour of a high methoxyl pectin gel. Carbohydr. Res. 1998, 310, 101–107. [Google Scholar] [CrossRef]
- Flutto, L. determination. In Encyclopedia of Food Sciences and Nutrition, 2nd ed.; Caballero, B., Ed.; Academic Press: San Diego, CA, USA, 2003; pp. 4440–4449. [Google Scholar]
- Rebollo-Hernanz, M.; Cañas, S.; Taladrid, D.; Benítez, V.; Bartolomé, B.; Aguilera, Y.; Martín-Cabrejas, M.A. Revalorization of coffee husk: Modelling and optimizing the green sustainable extraction of phenolic compounds. Foods 2021, 10, 653. [Google Scholar] [CrossRef] [PubMed]
- Lestari, W.; Hasballah, K.; Listiawan, M.Y.; Sofia, S. Coffee by-products as the source of antioxidants: A systematic review. F1000Research 2022, 11, 220. [Google Scholar] [CrossRef]
- Mourtzinos, I.; Menexis, N.; Iakovidis, D.; Makris, D.P.; Goula, A. A Green extraction process to recover polyphenols from byproducts of hemp oil processing. Recycling 2018, 3, 15. [Google Scholar] [CrossRef]
- Wang, L.; Zhou, Y.; Wang, Y.; Qin, Y.; Liu, B.; Bai, M. Two green approaches for extraction of dihydromyricetin from chinese vine tea using β-cyclodextrin-based and ionic liquid-based ultrasonic-assisted extraction methods. Food Bioprod. Process 2019, 116, 1–9. [Google Scholar] [CrossRef]
- Loukri, A.; Tsitlakidou, P.; Goula, A.; Assimopoulou, A.N.; Kontogiannopoulos, K.N.; Mourtzinos, I. Green extracts from coffee pulp and their application in the development of innovative brews. Appl. Sci. 2020, 10, 6982. [Google Scholar] [CrossRef]
- Nardini, M.; Cirillo, E.; Natella, F.; Mencarelli, D.; Comisso, A.; Scaccini, C. Detection of bound phenolic acids: Prevention by ascorbic acid and ethylenediaminetetraacetic acid of degradation of phenolic acids during alkaline hydrolysis. Food Chem. 2002, 79, 119–124. [Google Scholar] [CrossRef]
- Peng, S.; Zou, L.; Zhou, W.; Liu, W.; Liu, C.; McClements, D.J. Encapsulation of lipophilic polyphenols into nanoliposomes using pH-driven method: Advantages and disadvantages. J. Agric. Food Chem. 2019, 67, 7506–7511. [Google Scholar] [CrossRef]
- Spiegel, M.; Cel, K.; Sroka, Z. The mechanistic insights into the role of pH and solvent on antiradical and prooxidant properties of polyphenols—Nine compounds case study. Food Chem. 2023, 407, 134677. [Google Scholar] [CrossRef] [PubMed]
- Tran, T.M.K.; Akanbi, T.; Kirkman, T.; Nguyen, M.; Vuong, Q.V. Maximising recovery of bioactive compounds from coffee pulp waste using microwave-assisted extraction. Eur. J. Eng. Technol. Res. 2022, 7, 2812. [Google Scholar] [CrossRef]
- Silva, M.d.O.; Honfoga, J.N.B.; Medeiros, L.L.D.; Madruga, M.S.; Bezerra, T.K.A. Obtaining bioactive compounds from the coffee husk (Coffea arabica L.) using different extraction methods. Molecules 2021, 26, 46. [Google Scholar] [CrossRef]
- Hu, G.; Penga, X.; Wang, X.; Li, X.; Li, X.; Qiu, M. Excavation of coffee maturity markers and further research on their changes in coffee cherries of different maturity. Food Res. Int. 2020, 132, 109121. [Google Scholar] [CrossRef] [PubMed]
Disclaimer/Publisher’s Note: The statements, opinions and data contained in all publications are solely those of the individual author(s) and contributor(s) and not of MDPI and/or the editor(s). MDPI and/or the editor(s) disclaim responsibility for any injury to people or property resulting from any ideas, methods, instructions or products referred to in the content. |
© 2025 by the authors. Licensee MDPI, Basel, Switzerland. This article is an open access article distributed under the terms and conditions of the Creative Commons Attribution (CC BY) license (https://creativecommons.org/licenses/by/4.0/).