1. Introduction
As the global demand for sustainable energy and environmental management grows, biomass-based materials have gained significant attention as a renewable resource. Lignocellulosic biomass, derived from agricultural, industrial, and forest residues, offers a promising pathway for producing biofuels and other value-added products [
1]. Among the various biomass sources available, rice straw residue is one of the most abundant agricultural wastes worldwide. However, the efficient utilization of this biomass remains a challenge due to its complex structure and the need for suitable conversion technologies [
2].
One of the most effective ways to utilize rice straw residue is through pyrolysis [
3]. This thermochemical decomposition process converts biomass into bio-oil, gas, and solid char under an oxygen-limited environment [
4]. The solid by-product, biochar, holds significant potential for various applications, particularly in carbon sequestration, soil amendment, and adsorption processes. However, the properties of biochar depend on multiple factors, including the composition of the feedstock and the pyrolysis conditions.
Lignocellulosic biomass consists primarily of cellulose, hemicellulose, and lignin, with lignin being the most resistant to thermal degradation. The variation in lignocellulosic composition among different feedstocks influences the efficiency and kinetics of pyrolysis. Previous studies have shown that the activation energy required for pyrolysis depends on the specific composition of the biomass. Understanding these parameters is essential for optimizing pyrolysis conditions and enhancing the economic viability of biochar production.
TGA is commonly used to evaluate the thermal degradation of biomass and assess the kinetics of pyrolysis. Several models, such as the Kissinger, Flynn–Wall–Ozawa, and Kissinger–Akihira–Sunose isoconventional models, have been employed to calculate the energy and reaction mechanisms of pyrolysis. These models help us understand the fundamental decomposition behavior of different lignocellulosic feedstocks, which is crucial for designing efficient biomass conversion processes.
Carbonization plays a crucial role in determining the physical and chemical properties of biochar. Beyond its application in soil amendment, biochar can be further processed into activated carbon through chemical activation using agents such as potassium hydroxide (KOH) and sodium hydroxide (NaOH). Activation enhances biochar’s surface area and pore structure, making it suitable for adsorption applications. Activated biochar is widely used in wastewater treatment to remove pollutants, such as methylene blue and methyl orange, which are common contaminants in industrial effluents. By optimizing the activation process, it is possible to produce activated carbon with a high adsorption capacity, thereby increasing its commercial value [
5].
This study’s motivation stems from developing an effective utilization strategy for rice straw residue, a widely available but underutilized biomass resource. While pyrolysis has been extensively studied for bio-oil production, less attention has been given to the characterization and enhancement of biochar for adsorption applications. Understanding the kinetics of pyrolysis, the influence of feedstock composition, and the activation mechanism of biochar is crucial for improving the efficiency and economic viability of this process [
6].
This study aimed to comprehensively analyze the characterization, pyrolysis kinetics, and adsorption properties of biochar derived from rice straw residue and related lignocellulosic materials. The research characterized different feedstock types, including rice straw residue (brown solid), isolated lignin, and commercial TCI dealkaline lignin. These methods provide crucial insights into the structural and thermal properties of the biomass, which are essential for optimizing pyrolysis conditions. Another key objective of this study was to investigate the pyrolysis kinetics of these feedstocks by employing isoconventional models to determine the activation energy and reaction mechanisms governing the thermal degradation process. Kinetic parameters enable better control of pyrolysis for producing high-quality biochar.
Furthermore, this research sought to enhance the adsorption properties of biochar by optimizing its activation process using KOH and NaOH in various ratios. The activation process aims to improve biochar’s surface area and porosity, thereby increasing its adsorption capacity. To assess the effectiveness of this modification, the study evaluated the adsorption performance of activated biochar in removing methylene blue and methyl orange, two common industrial dyes. These findings will provide valuable insights into the potential application of biochar as an environmentally friendly and cost-effective material for wastewater treatment.
In this study, rice straw residue was selected as the raw material due to its abundance, low cost, and underutilization in high-value applications. It was first characterized and subjected to alkaline pretreatment to isolate lignin, which was analyzed alongside the untreated material and commercial lignin to determine their thermal behavior. Pyrolysis was then conducted at 450 °C and 550 °C to produce biochar, followed by chemical activation using KOH and NaOH at varying ratios to optimize porosity and surface area. The resulting activated carbons were evaluated through proximate analysis, BET surface area measurements, SEM imaging, and thermogravimetric analysis. Finally, the adsorption performance of the activated carbon was tested using methyl orange (MO) and methylene blue (MB) dyes, with isotherm, kinetic, and thermodynamic models applied to understand the adsorption mechanisms. This integrated approach aimed to valorize agricultural waste into functional adsorbents for wastewater treatment.
2. Materials and Methods
This research included rice straw residue, which the Far Eastern Research and Development Center in Taiwan obtained from acidified hydrolysis in a cellulose ethanol process. This residue (120–200 mesh) is called brown solid. The commercial lignin of TCI dealkaline lignin (L0045, CAS: 9005-53-2, USA) was purchased from TCI America (Portland, OR, USA), and used without any pretreatment. Methyl orange, methylene blue, and potassium hydroxide were purchased from Fisher Scientific in Waltham, MA, USA. Commercial activated carbon was acquired from First Chemical in New Taipei City, Taiwan; D-chloroform from Across Organic in Bern, Switzerland; sodium hydroxide from Riedel-de Hein in Seelze, Germany; 2-chloro-4,4,5,5-tetramethyl-1,3,2-dioxaphospholane and N-hydroxy-5-norbornene-2,3-dicarboximide from Aldrich Chemical in St. Louis, MO, USA; and dimethyl sulfoxide-d6 from Sigma Aldrich in St. Louis, MO, USA. All reagents were used as received.
2.1. Fiber and Lignin Analysis
Fiber analysis applies the gravimetric method to determine the composition of ligno-cellulosic biomass, including an assessment of the feedstocks [
7]. This analysis was performed to estimate extracts, cellulose, hemicellulose, lignin, and ash. The sample size was reduced and sieved into 200 mesh for effective milling. The biomass sample was air-dried at 60 °C in an oven for 24 h. The extractive content was determined by loading 2.5 g of dried sample into the cellulose thimble. A Soxhlet extractor was assembled, using 150 mL of acetone as the solvent for extraction. Residence times of 25 min between the boiling and rising stages were conducted on the heating mantle, which was then carefully adjusted to 70 °C for 4 h. After extraction, the sample was air-dried at room temperature for 10 min. The extracted material was dried in a convection oven at 60 °C for approximately 24 h. The extracted content was calculated as the difference in weight between the raw extractive-laden and the extractive-free biomass.
To measure the hemicellulose content, 1 g of extracted dried biomass was transferred into a 250 mL Erlenmeyer flask, and then 150 mL of 0.5 mol/L NaOH was added. The mixture was boiled for 3.5 h. After cooling, it was filtered through vacuum filtration and washed until it had a neutral pH. The residue was dried to a constant weight at 60 °C in a convection oven. The difference between the sample weight before and after this treatment is the dry biomass’s hemicellulose content (%w/w).
Lignin content determination was performed by weighing 0.3 g of dried extracts of raw biomass in glass test tubes and adding 3 mL of 72% H2SO4. The sample was kept at room temperature for 2 h and stirred for 30 min using a stirring rod to reach complete hydrolysis. After this hydrolysis, 84 mL of distilled water was added. The second hydrolysis step was made in an autoclave at 121 °C for 60 min. The slurry was then cooled to room temperature. Hydrolysates were filtered under vacuum using a filtering crucible. The acid-insoluble lignin was determined by drying the residues at 105 °C and accounting for ash by incinerating the hydrolyzed samples at 575 °C in a muffle furnace. The acid-soluble lignin fraction was determined by measuring the absorbance of the acid-hydrolyzed samples at 320 nm. The lignin content was calculated as the summation of acid-insoluble lignin and acid-soluble lignin. The cellulose content (%w/w) was calculated by difference, assuming that extracts, hemicellulose, lignin, ash, and cellulose are the only components of the entire biomass.
2.2. Proximate Analysis Using Thermogravimetric Analysis
The proximate analysis of biomass raw materials and pyrolytic products was conducted using thermogravimetric analysis (TGA, TA Q50, York, PA, USA) to evaluate the composition and thermal behavior of the samples. The biomass was first ground and sieved to a particle size of 200–250 mesh to ensure consistency. The analysis was performed under a nitrogen atmosphere at a controlled heating rate of 10 °C/min over a temperature range of 30–600 °C. The moisture content was assessed by measuring the weight loss after heating the sample to 110 °C, while volatile matter was determined based on weight reduction between 110 and 600 °C under nitrogen. The fixed carbon content was calculated from the mass loss between 600 and 900 °C in an air atmosphere, with the final residue at 900 °C representing the ash content. This comprehensive analysis provided valuable insights into the composition of the biomass and the transformation of its constituents during pyrolysis, aiding in the optimization of conversion processes.
2.3. Thermal Kinetic Analysis Using Isoconventional Method
TGA was performed to assess the thermal behavior of the brown solid and pyrolytic products. A sample weighing 5–10 mg was placed in a platinum plate, which was then positioned inside the TGA chamber. Initially, the sample was heated from 30 to 100 °C at a rate of 10 °C/min under a nitrogen flow of 60 mL/min and held at this temperature for 10 min to ensure the removal of moisture content. Following this, the heating process continued up to 900 °C under the same nitrogen flow, at varied heating rates of 2, 5, 10, or 20 °C/min. This controlled thermal treatment allowed for a detailed examination of the decomposition characteristics and stability of the biomass and its pyrolysis products.
2.4. Hydroxyl Group Analysis of Lignin Using P31NMR
The P
31 nuclear magnetic resonance (NMR) experiment was conducted following the method outlined by Meng et al. [
8] to analyze the hydroxyl functional groups in lignin. The lignin sample was dried at 60 °C for 12 h to remove residual moisture. A 50 mL solvent solution was prepared by mixing pyridine and deuterated chloroform at a 1.6:1 (
v/
v) ratio. From this solution, 25 mL was used to dissolve hydroxy-5-norbornene-2,3-dicarboximide as an internal standard and chromium (III) acetylacetonate as a relaxation agent.
A 20–25 mg portion of the dried lignin sample was dissolved in 400 µL of the solvent solution and combined with 150 µL of the prepared mixture. The solution was stirred using a spin bar for 5 min to ensure proper mixing. Subsequently, 70 µL of 2-Chloro-4,4,5,5-tetramethyl-1,3,2-dioxaphospholane reagent was added, and the mixture was stirred for 2 min at room temperature for complete dissolution. The solution was then filtered using a centrifuge for 20 s to separate any undissolved lignin. Finally, the purified sample was transferred into an NMR tube for analysis.
The P31 NMR analysis was conducted at the Chemistry Laboratory, National Central University, Taiwan. Each NMR acquisition was performed with a 25 s delay between 90° pulses. The spectral range was set between 100 and 200 ppm, with a 62 ppm sweep width (TD = 32,768) and a 4 Hz line broadening. The acquisitions were conducted at room temperature to ensure accurate and consistent results.
2.5. Determination of Water Content
The sample’s water content (10 g) was dried in an EYELA natural oven (NDO-450ND Tokyo Rikakikai Co., Ltd., Bunkyo-ku, Japan) at 60 °C for 12 h. The procedure was carried out by weighing every sample at 3 h intervals until the result was obtained with an accuracy within 5%. The water content can be calculated as follows:
in which W
C, W
W, and W
d denote the weight of the water content, wet sample, and dry sample, respectively.
2.6. Isolation of Lignin from Brown Solid
This study utilized an atmospheric microwave reaction system, specifically the Flexi Wave model (Milestone in Sorisole, Bergamo, Italy), for lignin isolation. The process involved suspending 10 g of brown solid sample in 100 mL of either 2%m/V or 3%m/V NaOH solution within a 500 mL flask, which was then positioned on a circular plastic support in the microwave system. The reaction was conducted at 95 °C for 90 min to facilitate lignin extraction.
Following the reaction, the mixture was filtered using Advantech No.4 filter paper (Advantec Co., Ltd. in Tokyo, Japan) to separate the solid and liquid phases. The black liquor, containing dissolved cellulose and hemicellulose, was precipitated at pH 7 using HCl. Further acidification to pH 2 precipitated lignin. The solid lignin was subsequently washed with distilled water under vacuum filtration until the pH reached neutrality (pH 7) and then dried at 60 °C for 12 h.
The black liquor was further processed by centrifugation to separate the solid and liquid fractions. The solid fraction was then filtered again using Advantech No.4 filter paper under vacuum filtration, washed with distilled water to pH 7, and dried at 60 °C for 12 h. The yield of the extracted lignin (Y) was calculated using Equation (2):
where Y represents the lignin yield, W
I is the weight of the isolated product (g), and W
T is the amount of lignin in the brown solid obtained using the TAPPI T222 method, which was determined to be 31% in this study.
The purity of the isolated lignin (P) was determined using Equation (3):
where P is the lignin purity, W
L is the weight of lignin analyzed using the TAPPI T222 method in the isolated product (g), and W
I is the weight of the isolated product (g).
Finally, the recovery of lignin (R) from brown solid was calculated using Equation (4):
where R represents the recovery efficiency of the isolation process, W
L is the weight of lignin analyzed by the TAPPI T222 method in the isolated product (g), and W
T is the total lignin content in the brown solid as determined by the TAPPI T222 method.
2.7. Pyrolysis of Brown Solid
The pyrolysis process was carried out in a fixed-bed reactor under a nitrogen atmosphere with a controlled flow rate of 150 mL/min and a heating rate of 20 °C/min, as reported in our previous study [
9,
10]. Before pyrolysis, the brown solid feedstock underwent a pretreatment process, where it was washed with distilled water at 60 °C while being stirred at 30 rpm for 12 h. This washing procedure was repeated three times to ensure the removal of impurities. After washing, the solid was oven-dried until a constant weight was achieved, ensuring moisture removal and consistency in the pyrolysis process.
Once prepared, 300 g of the washed brown solid was loaded into the reactor. The pyrolysis process was conducted at final temperatures ranging from 300 to 500 °C, with a holding time of 30 min at each target temperature. This controlled thermal treatment enabled the study of pyrolysis behavior under various conditions, influencing the yield and characteristics of the resulting biochar, bio-oil, and gaseous products.
2.8. Hydrothermal Method
The hydrothermal carbonization process was conducted using a microwave system equipped with a high-pressure vial to convert the brown solid into biochar. In this process, 5 g of washed brown solid was placed into a high-pressure vial and mixed with 50 mL of deionized water to create a reaction medium. The carbonization process was carried out at temperatures ranging from 220 to 240 °C, with a holding time of 1 to 4 h under 300 watts of microwave power.
2.9. Physical and Chemical Activation
Activated carbons were produced using physical or chemical methods. The physical method involved heating only at high temperatures in a muffle furnace. Measures of 15 g of biochar were placed in the crucibles and put in the furnace. The activation temperature was 800 or 850 °C under a nitrogen atmosphere. The flow rate was 1000 mL/min. After activation, the carbon was cooled to room temperature under a nitrogen atmosphere.
Chemical activation was carried out by treating the biochar with chemical activation agents to enhance its porosity and adsorption properties. In this process, 15 g of biochar was mixed with the activation agent (NaOH or KOH) at different weight ratios of biochar to the activation agent, ranging from 1:4 to 1:0.5. The mixture was stirred continuously for 10 h using a magnetic stirrer to ensure thorough interaction between the biochar and the activation agent.
Following the stirring process, the mixture underwent sonication for 2 h to further enhance the dispersion of chemicals within the biochar matrix. After sonication, the sample was dried in an oven to remove excess moisture before being placed into a crucible and activated in a muffle furnace at the same temperature.
After activation, the activated carbon was treated with 1 M HCl to remove residual K+ and Na+ ions. The carbon was then separated from the liquid phase and thoroughly washed with reverse osmosis water until it reached a neutral pH. Finally, the purified activated carbon was dried in an oven to achieve a stable form.
2.10. Surface Area Analysis
The surface area and porosity of activated carbons were assessed by nitrogen adsorption–desorption isotherm using volumetric adsorption analysis (Micrometrics ASAP, 2010, Micromeritics Instrument Corporation in Norcross, GA, USA) in the instrument laboratory of Yuan Ze University, Taiwan. The samples were degassed under vacuum (10 mmHg) at 150 °C for 12 h. The specific surface area was calculated using the Brunauer–Emmett–Teller (BET) method.
2.11. Dye Adsorption and Desorption
A stock solution of 600 mg/L was prepared by dissolving precise amounts of methyl orange (MO) and methylene blue (MB) in 1000 mL of distilled water. The stock solution was diluted with distilled water as needed to achieve the desired concentrations (pH 7) for the study.
The batch adsorption experiment was conducted in 250 mL flasks containing 100 mL of MO or MB solution. The initial dye concentration was varied between 100 and 600 mg/L, while the adsorbent amount ranged from 0.05 to 5 g. The adsorption time was adjusted between 0 and 160 min to examine the adsorption dynamics. The flasks were placed in an orbital shaker at a constant speed of 150 rpm to ensure uniform mixing. After the adsorption process, the adsorbent was separated from the solution using a ceramic filter through vacuum filtration, and the concentrations of MO and MB were determined using a UV spectrophotometer (SP-880, Metertech, Taipei, Taiwan) at 467 nm for MO and 661 nm for MB.
The desorption study was conducted using 50% (v/v) ethanol as the desorption agent in a batch system. Before desorption, the adsorbent-loaded MB or MO obtained from the adsorption experiment was oven-dried for 6 h. The dried adsorbent (0.1 g) was then mixed and stirred with 100 mL of desorption agent at 30 °C for 6 h to release the adsorbed dyes. After the desorption process, the adsorbent was separated from the filtrate by vacuum filtration, washed with distilled water to pH 7, and oven-dried for 6 h before being reused in three adsorption–desorption cycles. The final concentration of MB or MO in the filtrate was again measured using the UV spectrophotometer to assess the efficiency of the desorption process.
3. Results and Discussion
This study examined the properties, carbonization behavior, and adsorption potential of biochar produced from brown solid extracted from rice straw residue. It also explored cost-effective activation strategies using KOH and NaOH to enhance the biochar’s ability to obtain the activated carbon. Furthermore, the research evaluated the effectiveness of activated carbon in adsorbing two representative dyes: MB and MO.
3.1. Composition of Brown Solid by Fiber and Lignin Analysis
Bioethanol production from biomass occurs through enzymatic hydrolysis, which converts the complex carbohydrates in lignocellulosic materials into simple chemical forms. The lignocellulosic material commonly used is rice straw.
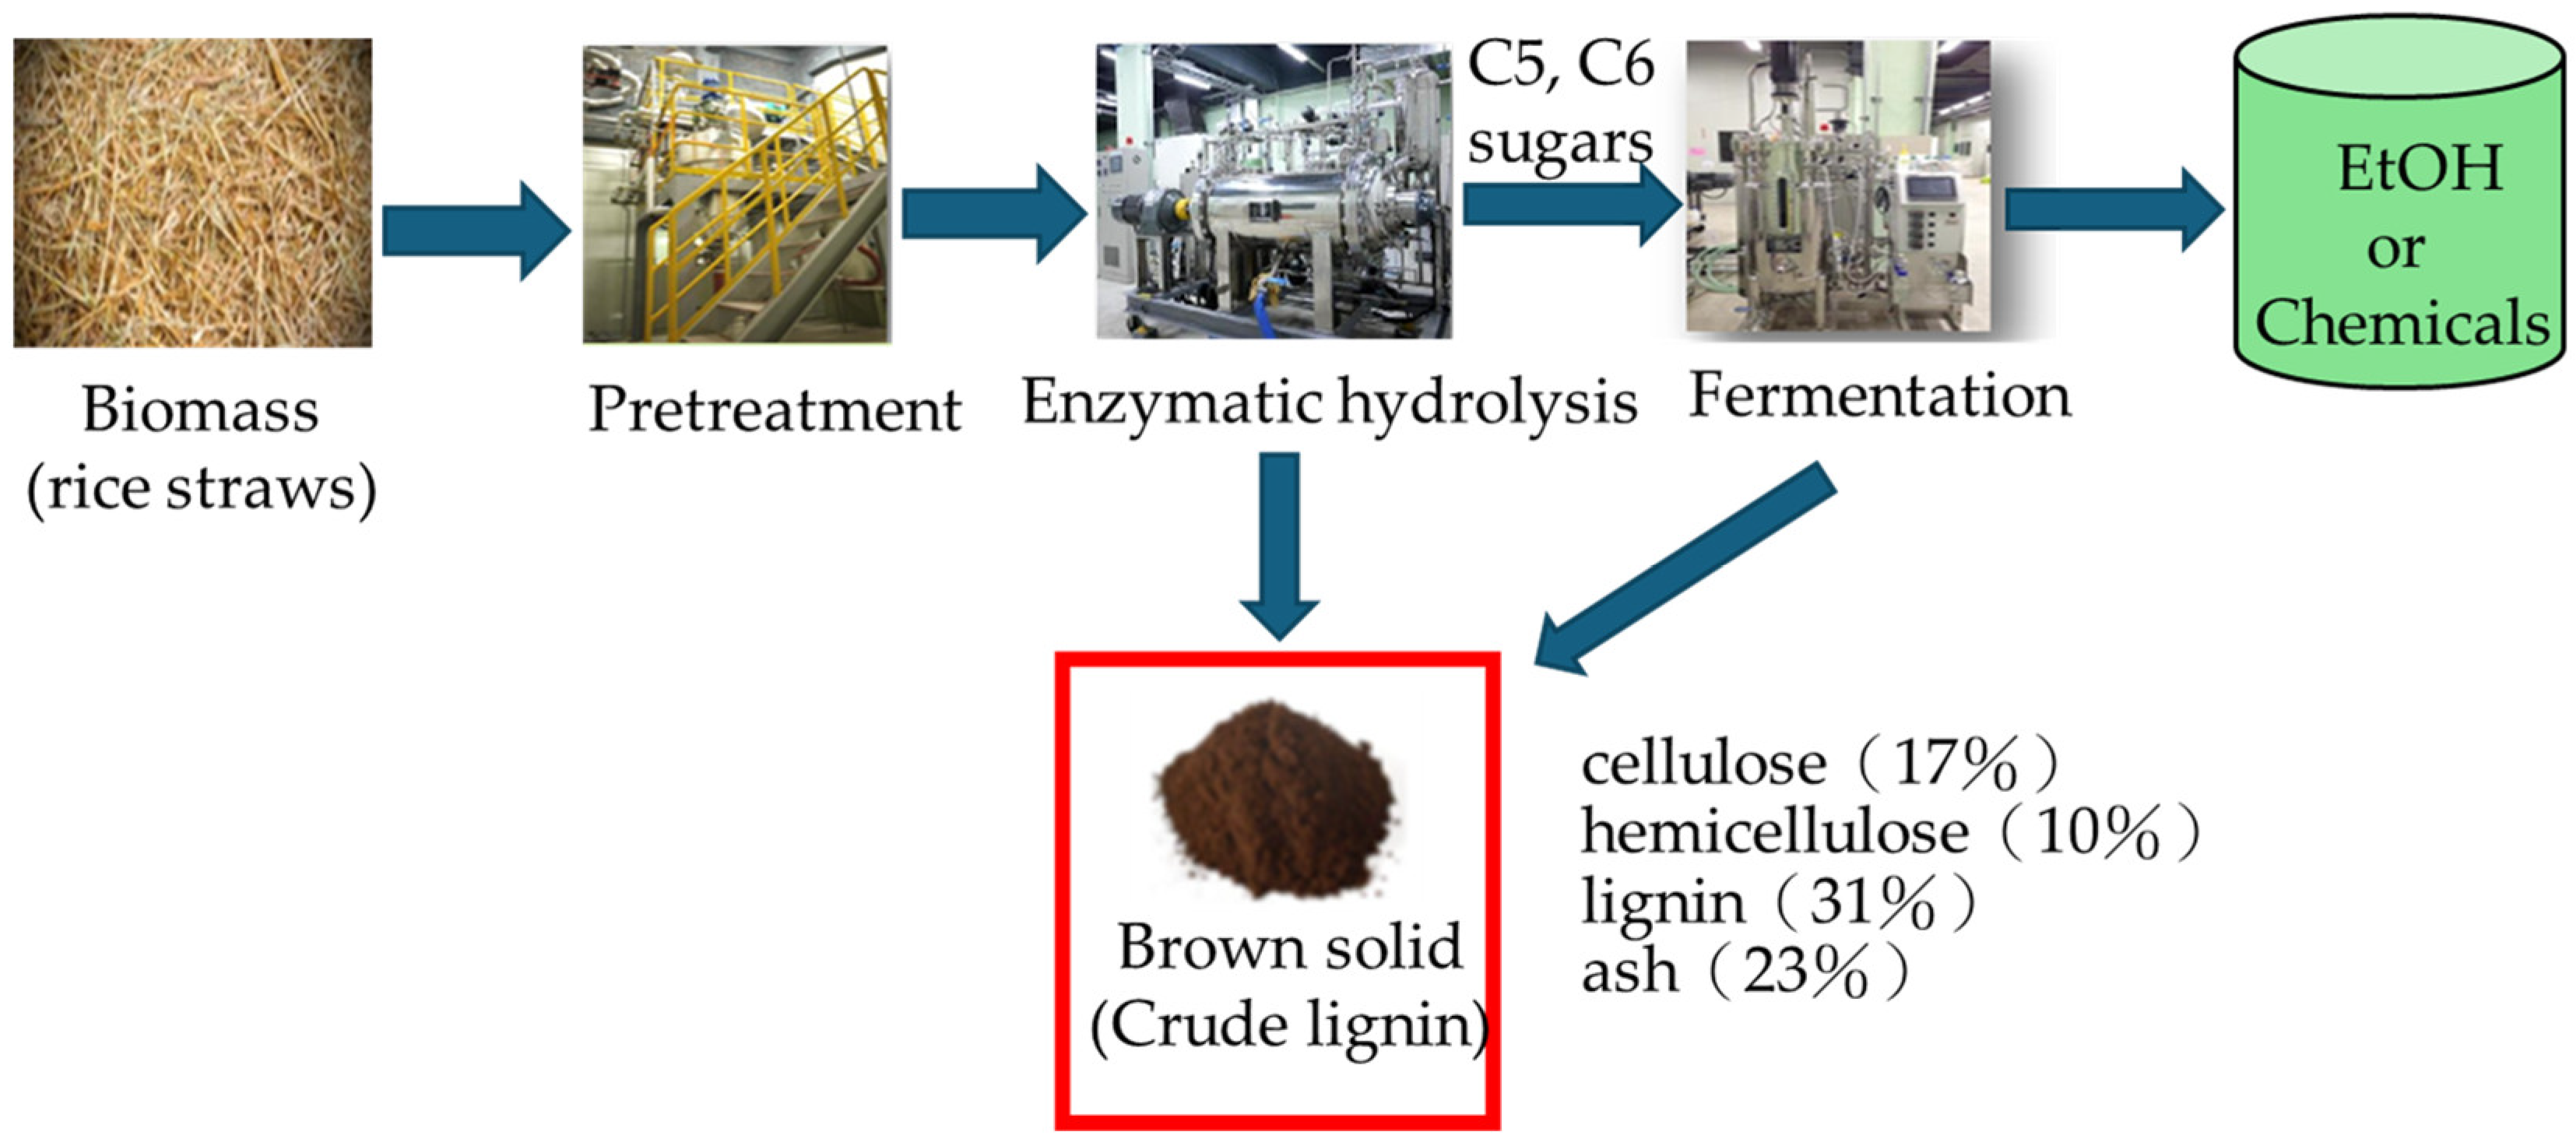
Figure 1 presents a process diagram of the bioethanol plant from rice straw at the Far Eastern Research and Development Center in Taiwan. The process consists of five main steps: (i) For pre-hydrolysis, rice straw is shredded to a size of 2 mm. (ii) A pretreatment step employs hydrothermal treatment technology. (iii) Enzymatic hydrolysis (enzymatic saccharification). (iv) Co-fermentation of C5 and C6 sugars into ethanol using recombinant yeast. (v) Distillation of the fermentation broth containing ethanol. The residue from steps 3 and 4 is known as the brown solid.
The fiber and lignin analysis were conducted to determine the lignocellulosic composition of the brown solid. The experimental results showed that the brown solid contained low amounts of cellulose (17%) and hemicellulose (10%). This low content is likely due to the enzymatic hydrolysis and saccharification process, which breaks cellulose into monosaccharides, followed by co-fermentation, where C5 and C6 sugars are converted into ethanol. C5 and C6 sugars are essential components of hemicellulose in biomass, and their conversion into ethanol significantly reduces the hemicellulose and cellulose content in the brown solid. In contrast, lignin remained in the brown solid at a concentration of 31%, making it suitable for lignin isolation applications. However, the brown solid’s ash content was relatively high (23%), indicating the need for water and HCl washing pretreatment before preparing activated carbon. These pretreatments help remove water-soluble impurities and inorganic matter, improving the quality of the final activated carbon product.
3.2. Proximate Analysis of Feedstocks
Three kinds of feedstocks—brown solid, TCI dealkaline lignin, and isolated lignin—were used in this study. TCI dealkaline lignin, a commercially available standard lignin, was used for comparison. The proximate analysis of the feedstocks is detailed in
Table 1. The isolated lignin was extracted from the brown solid using microwave heating in a 2% NaOH solution at 95 °C for 90 min. Following the isolation process, the ash content in the isolated lignin was significantly reduced to 3%.
Table 1 shows the proximate composition (moisture, volatile matter, fixed carbon, and ash). The brown solid contains high volatile matter (45.5%) and ash content (28.9%), with a relatively low fixed carbon content (23.2%). This reflects its origin as a bioethanol process residue, rich in inorganic and thermally unstable components. TCI dealkaline lignin has a more balanced profile with higher fixed carbon (40.3%) and lower ash (17.5%), suggesting better thermal stability. In contrast, isolated lignin exhibits the highest fixed carbon content (69.7%) and the lowest ash content (3.64%), indicating superior carbon richness and purity, making it the most suitable for pyrolysis-based applications.
Several studies have indicated that different biomass types can be distinguished based on their three primary lignin monomers: syringyl (S), guaiacyl (G), and p-hydroxyphenyl (H) [
11,
12,
13]. Softwood biomass is typically guaiacyl-dominant, while hardwood biomass contains both syringyl and guaiacyl as the primary components. In contrast, non-wood biomass, such as grass and straw, generally has a more balanced composition of syringyl, guaiacyl, and p-hydroxyphenyl units.
Table 2 presents the hydroxyl group content (mmol/g) in different lignin samples, including aliphatic OH, syringyl, guaiacyl, p-hydroxyphenyl, and carboxylic acid groups. The isolated lignin has the highest total hydroxyl content, especially in syringyl (0.79) and guaiacyl (0.34) units, due to the alkaline extraction method. The brown solid contains moderate levels, dominated by aliphatic OH (0.73), while TCI dealkaline lignin shows the lowest overall hydroxyl content. These differences affect reactivity and thermal decomposition behavior, with isolated lignin being more chemically active and thermally favorable. The results indicate that aliphatic hydroxyl (OH) groups dominate the brown solid. This finding indicates that isolated lignin exhibits the most desirable properties for carbonization, whereas the brown solid requires pretreatment to reduce ash and improve its performance.
3.3. Thermal Behavior of Feedstock and Pyrolytic Products
The TGA results presented in
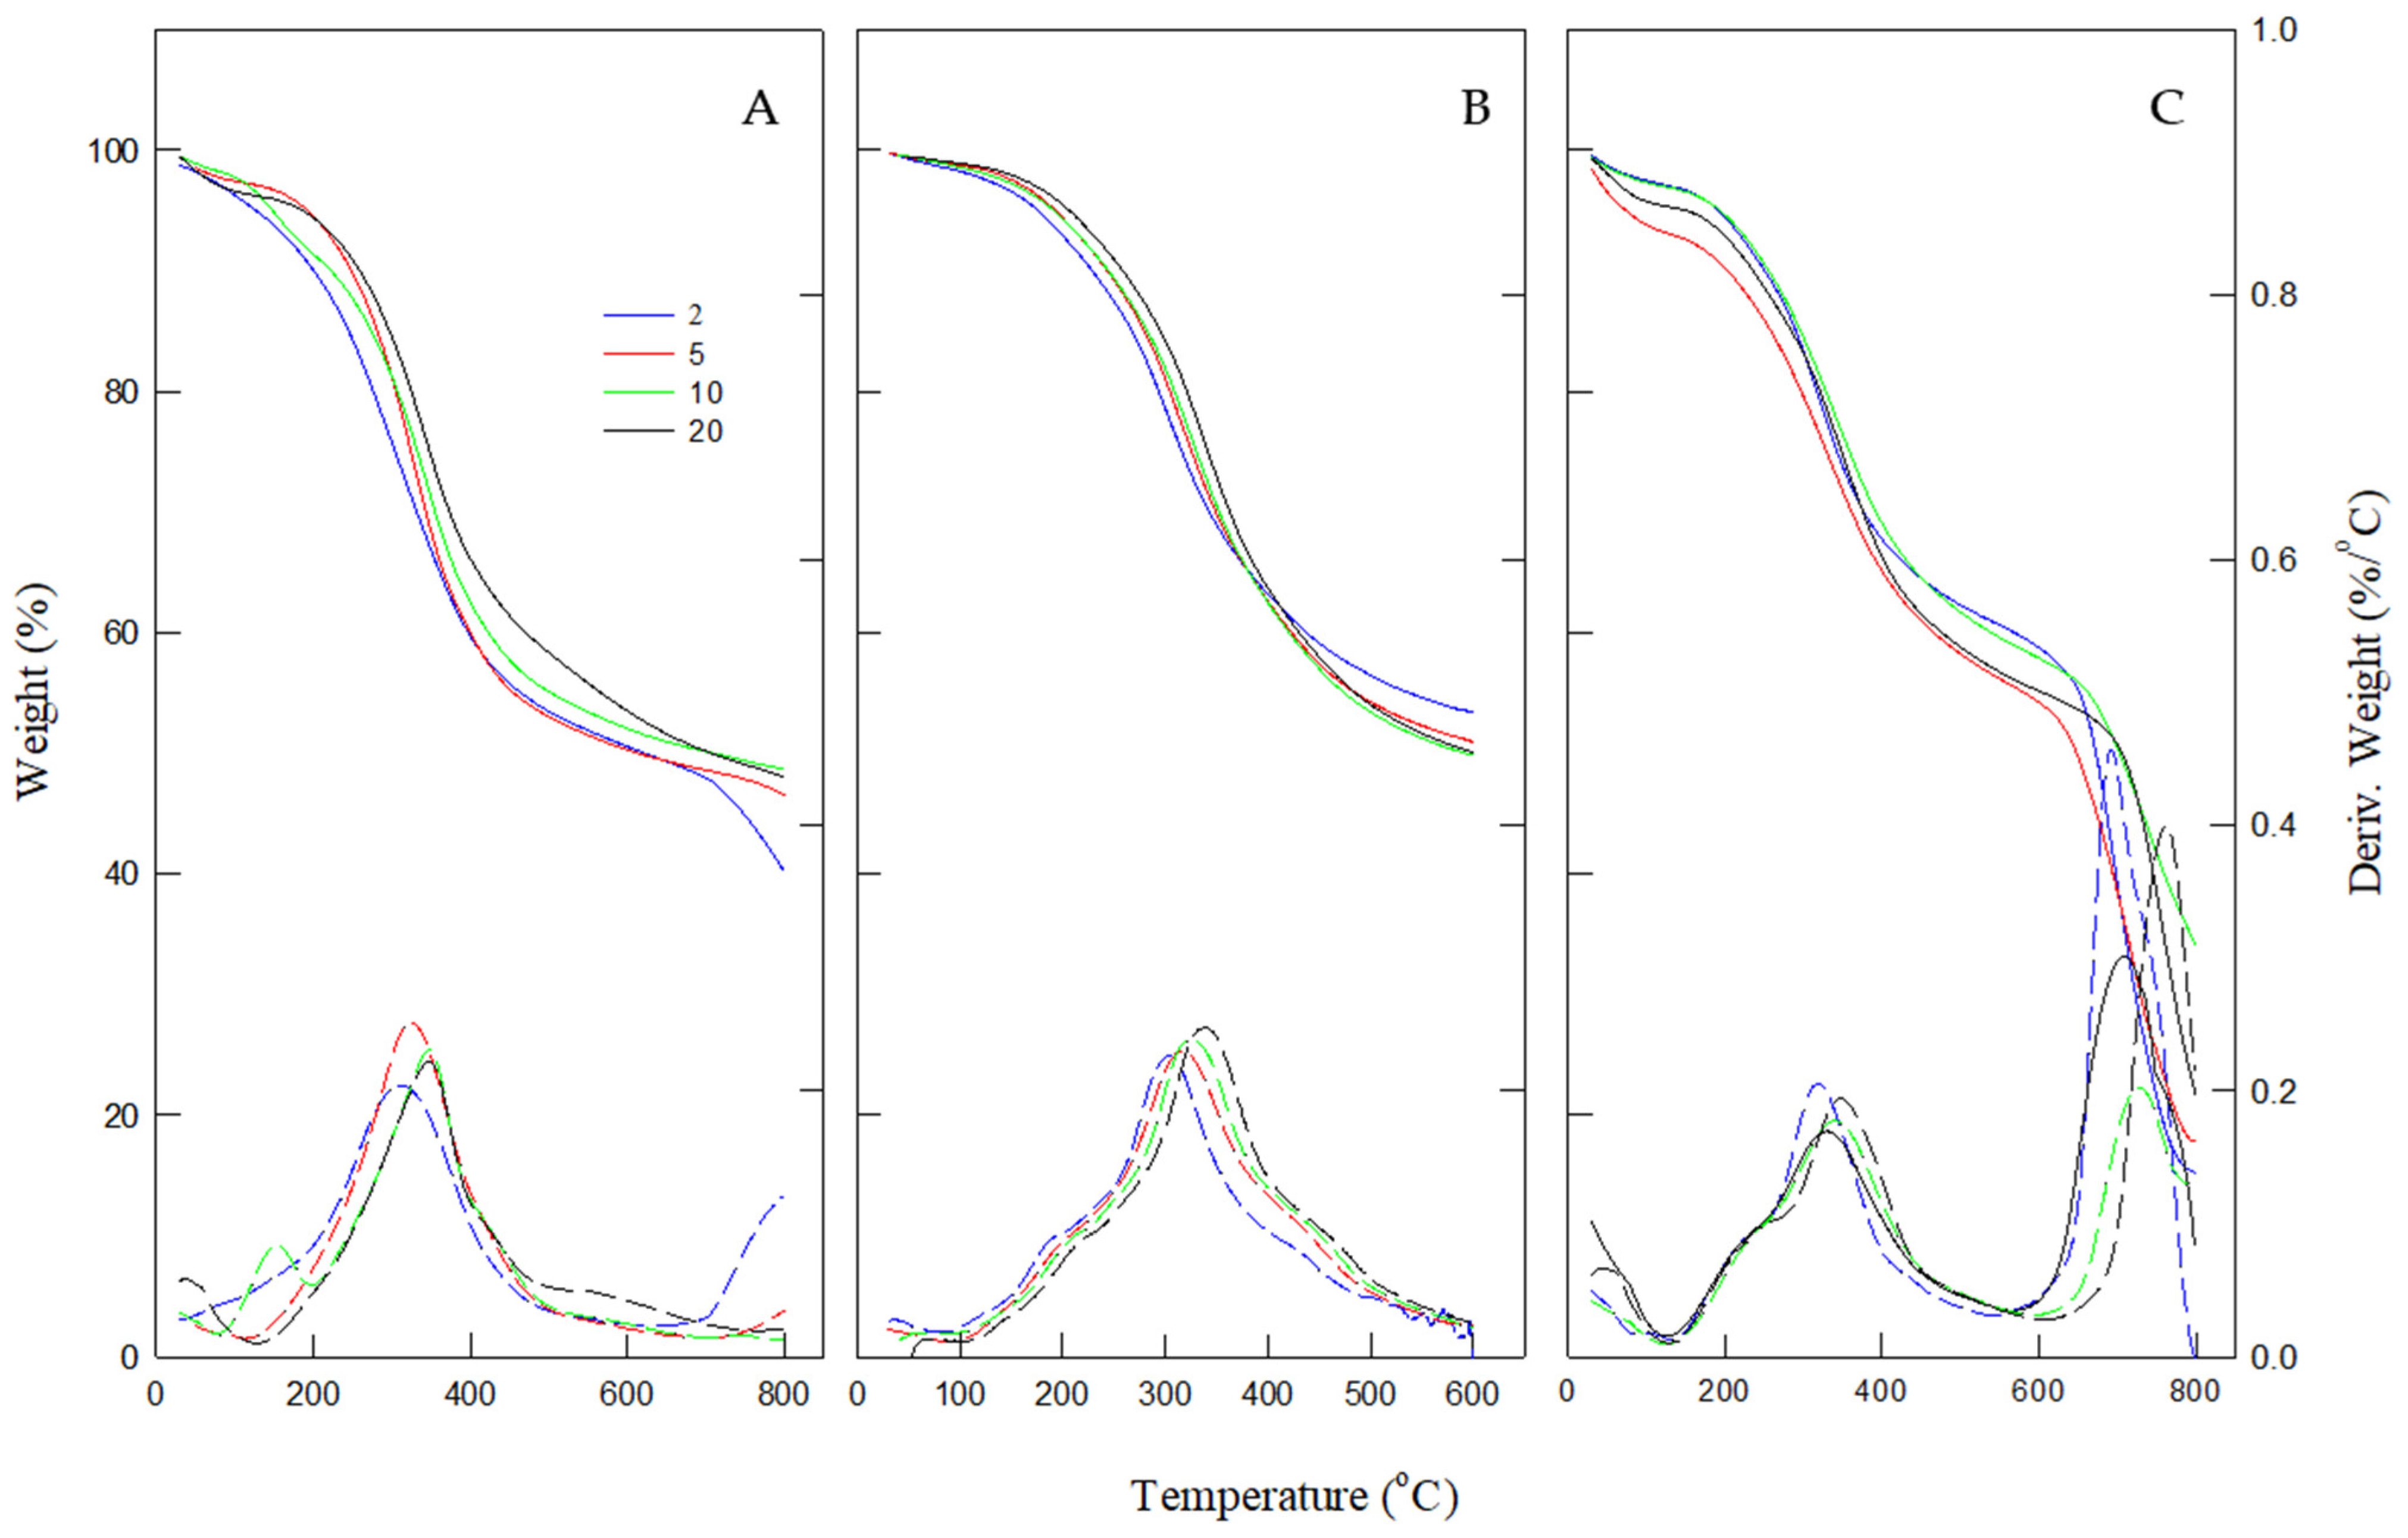
Figure 2 indicate that the pyrolysis process occurs in three distinct stages, each characterized by specific weight loss trends. The first stage corresponds to the release of water, occurring below 150 °C, resulting in an initial weight reduction. The second stage, active pyrolysis, occurs between 150 and 500 °C and is marked by the most significant weight loss, approximately 35–40%. During this stage, hemicellulose (150–500 °C) and cellulose (250–500 °C) decompose, while lignin undergoes gradual degradation over a broader range (150–900 °C) without distinct peaks [
14]. This phase is also associated with the release of various gas compounds, including CO
2, CO, CH
4, and H
2O.
The final stage, occurring at temperatures above 500 °C, is passive pyrolysis. This phase is characterized by slower weight loss, leading to the formation of residual char. The final residue can range from 20% to 40% of the initial mass, depending on the feedstock composition and heating rate. The extent of decomposition in this stage depends on the thermal stability of the feedstock components [
14]. The maximum weight loss observed during active pyrolysis is represented by the DTG curve peaks for each type of feedstock (
Figure 2), occurring within the 150–500 °C range. Lignin, a complex polymer composed of benzene ring structures, exhibits higher thermal stability than hemicellulose and cellulose. Its strong aromatic structure slows its decomposition rate, making it more resistant to thermal degradation.
The TGA curves (
Figure 2) demonstrate a rightward shift as the heating rate increases, corresponding to a reduction in the overall weight loss rate. Additionally, the maximum rate peaks in the derivative thermogravimetry (DTG) curves shift toward higher temperatures, primarily due to the effect of heat transfer limitations. Thermal energy is gradually supplied at lower heating rates, enabling better heat conduction and a prolonged reaction time. Consequently, decomposition occurs at lower temperatures [
14], emphasizing the influence of heating rate on the thermal behavior of biomass during pyrolysis.
Figure 2 illustrates the TGA curves of three lignocellulosic feedstocks: TCI dealkaline lignin, brown solid, and isolated lignin from brown solid. A key observation is that TCI dealkaline lignin exhibits significantly higher weight loss at temperatures above 500 °C, indicating a markedly different thermal decomposition trend compared to the other two materials.
This elevated weight loss suggests that TCI dealkaline lignin contains a higher proportion of thermally labile compounds. As shown in
Table 1, it has a relatively high volatile matter content (39.3%) and a lower fixed carbon content (40.3%). In contrast, isolated lignin has a significantly higher fixed carbon content (69.7%), which contributes to its superior thermal stability. These differences reflect the impact of chemical structure and processing methods.
TCI lignin, being a commercial product, may include low-molecular-weight fragments or processing residues that decompose readily at elevated temperatures. In comparison, the isolated lignin underwent alkaline microwave-assisted extraction, resulting in a purer and more thermally stable material. Additionally, brown solid retains significant ash content, which may provide thermal resistance and reduce the rate of degradation.
The pyrolysis of the brown solid was carried out in a batch pyrolysis reactor under a nitrogen flow rate of 150 mL/min at 450 °C and 550 °C, resulting in solid residues: biochar 450 and biochar 550, respectively. The TGA curves of the biochars followed a distinct trend compared to the feedstock, as shown in
Figure 3, indicating improved thermal stability.
Table 1 indicates that pyrolysis decreased the volatile components in the brown solid, thereby increasing the carbon content. While the brown solid began decomposing at 150 °C, both biochars remained stable up to 200 °C. Furthermore, biochar produced at 550 °C exhibited greater thermal stability than biochar obtained at 450 °C, likely due to the more complete carbonization process at higher temperatures. These findings align with previous studies suggesting that higher pyrolysis temperatures enhance the thermal stability of biochar [
15].
TGA conducted under nitrogen and oxygen environments can also be used to estimate the proximate composition of the pyrolytic products. As shown in
Table 1, the pyrolysis process significantly reduced the volatile content in the brown solid, leading to an increase in the carbon content of the resulting biochar. Since char activation requires a high-carbon-content precursor, this transformation is essential for producing high-quality activated carbon.
3.4. Kinetic Study of Pyrolysis Using TGA
3.4.1. Activation Energy Calculation and Kinetic Analysis
The activation energy (E
a) and pre-exponential factors of feedstock pyrolysis were determined using three kinetic models: the Kissinger method, the Flynn–Wall–Ozawa (FWO) method, and the Kissinger–Akahira–Sunose (KAS) method [
14].
This method evaluates the kinetics without calculating the activation energy in every conversion value [
16]. The equation is based on the following:
where A and E
a are the frequency factor and activation energy, respectively. The activation energy is obtained by plotting ln(β/
) against 1000/T
m at different heating rates (β), where T
m is the maximum temperature of the DTG curve peak. The activation energy results from the slope of the plot, which is equal to −E
a/R.
- 2.
Flynn–Wall–Ozawa method (FWO)
This method enables the calculation of the activation energy and the pre-exponential factor without requiring information about the reaction mechanism, which can only be achieved for one-step reaction calculations [
17,
18].
where
g(α) is constant at a given conversion value. The activation energy is calculated by plotting ln β
i against 1000/T
αi, where β
i and α represent the heating rate and conversion value, respectively. The activation energy is derived from the slope of the plot, which is equal to −1.052 E
α/R. α is defined as the conversion based on the weight loss of decomposed biomass.
where m
i is the initial mass, m
a is the actual mass, and m
f is the mass after pyrolysis of the sample.
- 3.
Kissinger–Akihira–Sunose (KAS)
The KAS method is based on the following expression [
19]:
The activation energy can be obtained by plotting ln() against 1000/Tαi for a given value of conversion. The activation energy is calculated by the slope of the plot, which is equal to −Eα/R.
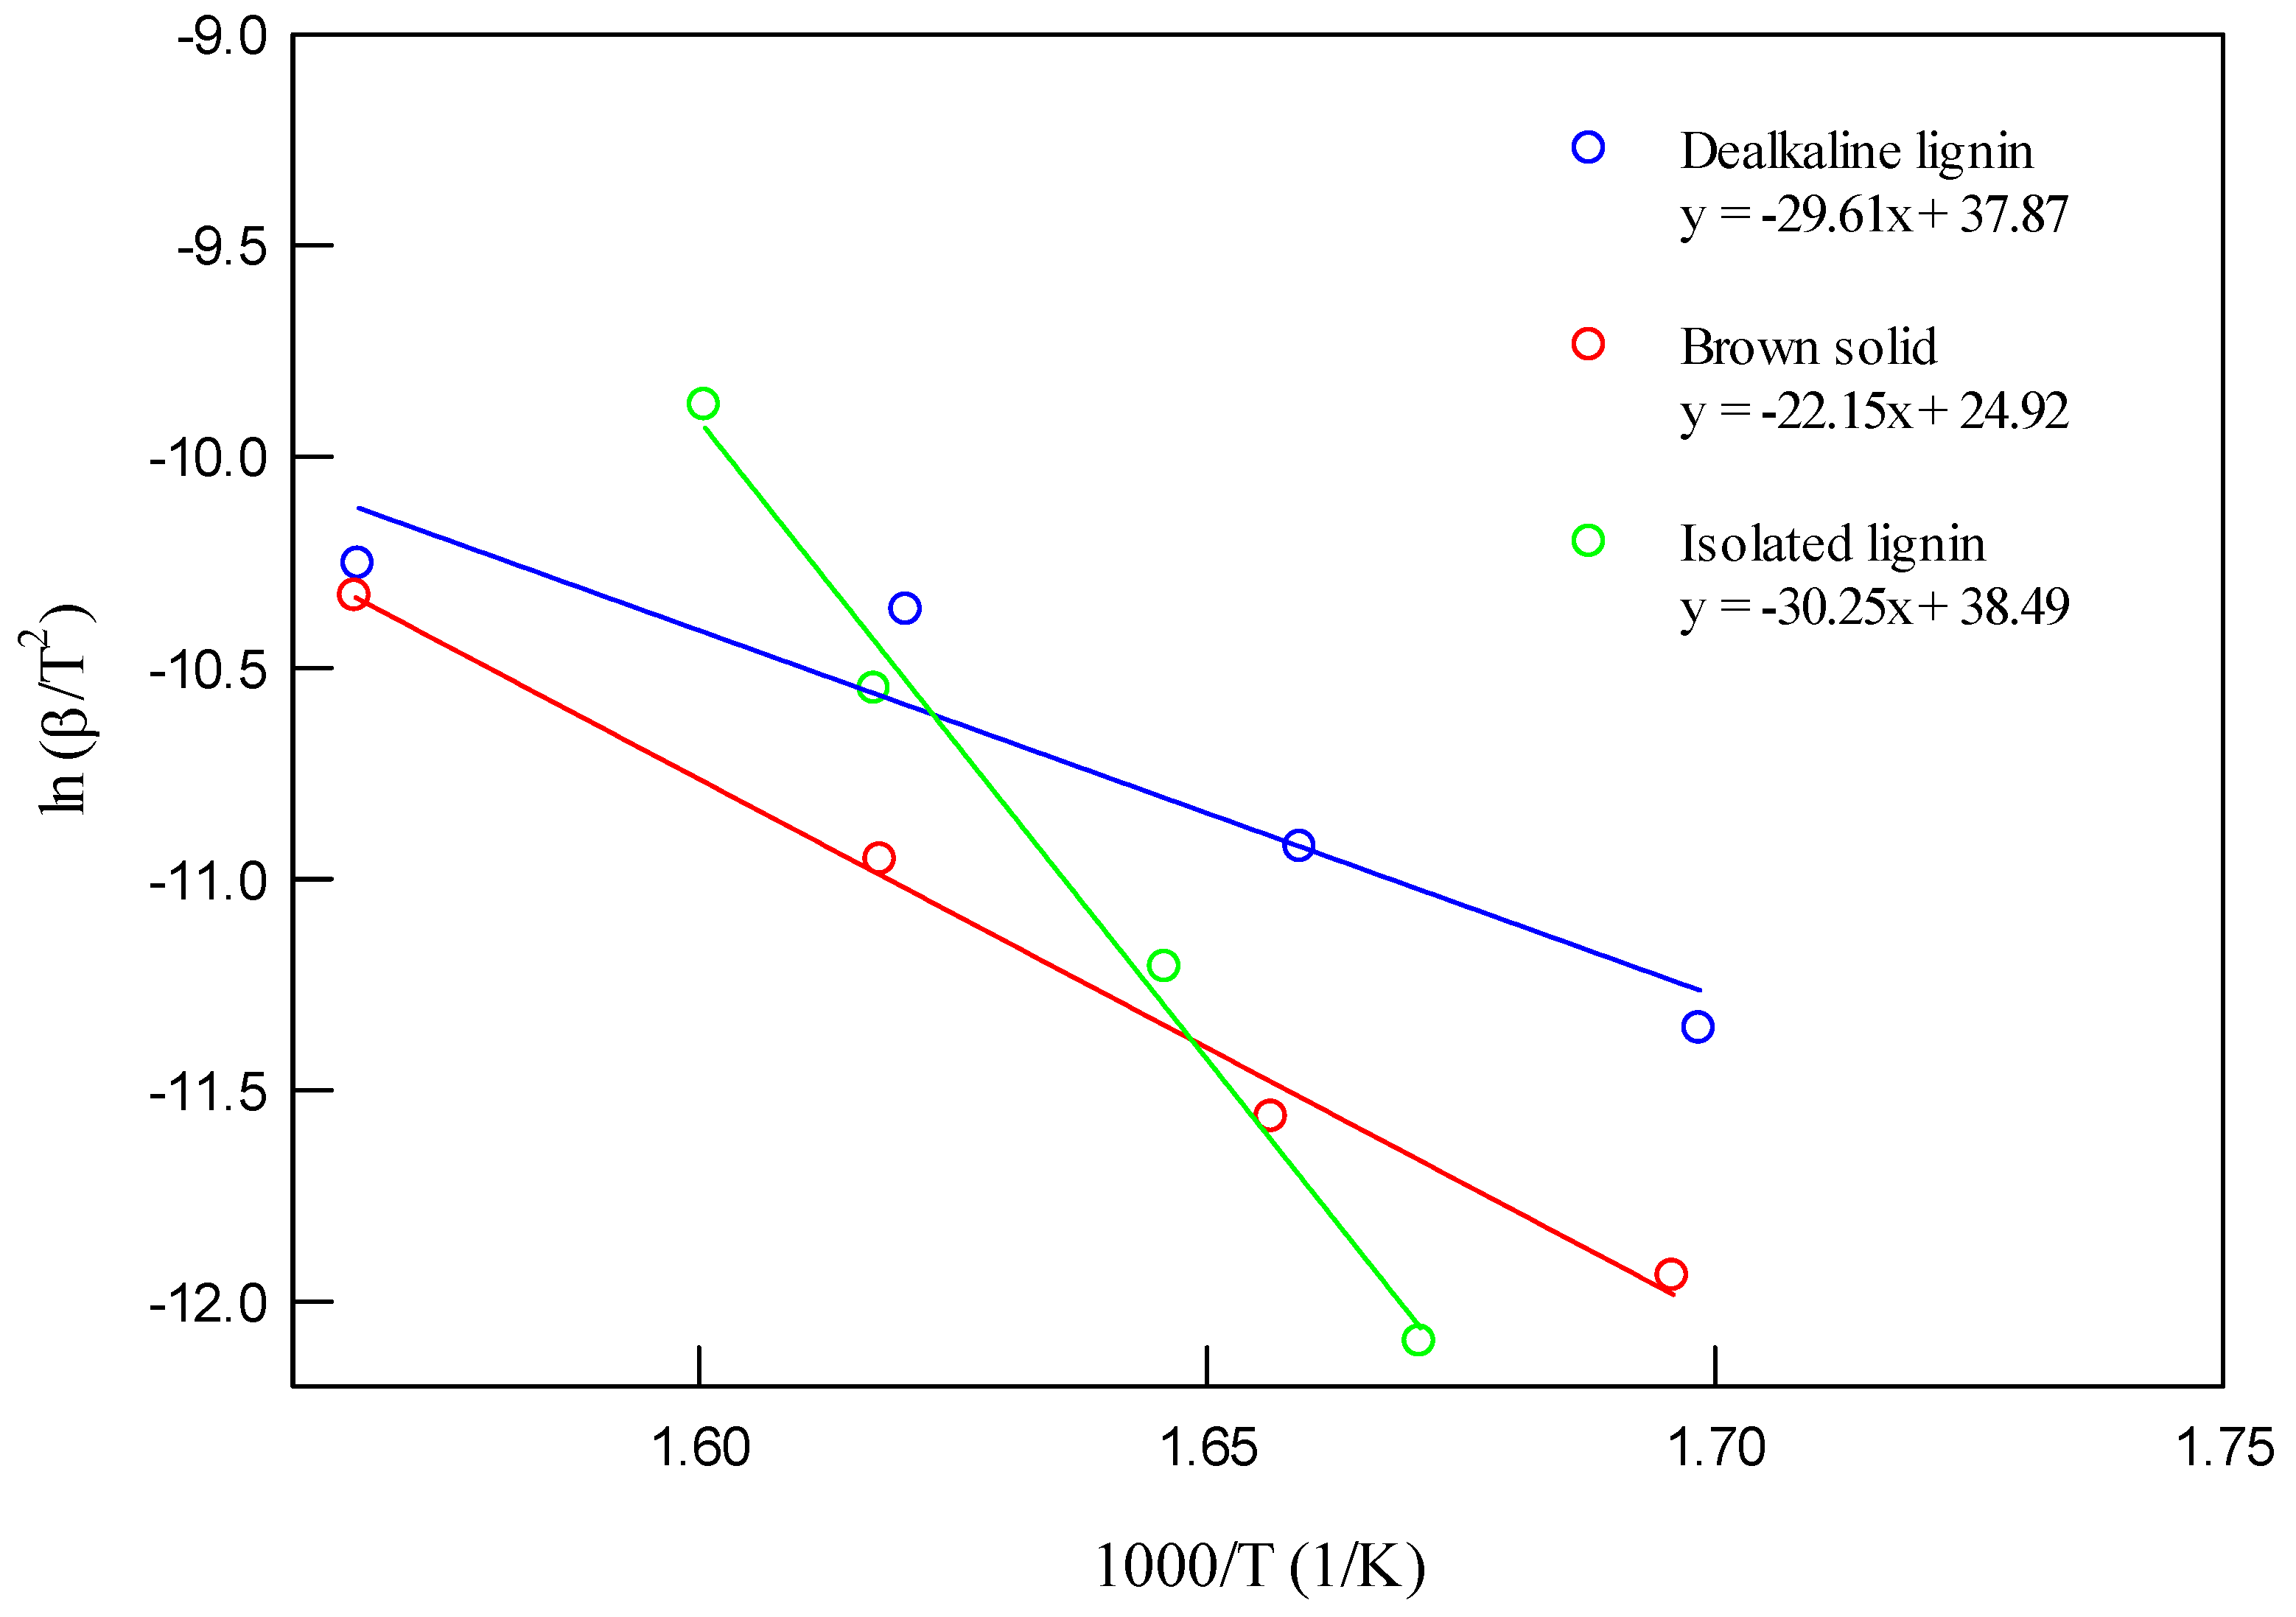
The first approach involved calculating the activation energy using the Kissinger method. The Kissinger plots of ln(β/
) versus 1000/T for different decomposition processes and feedstocks are illustrated in
Figure 4.
Figure 4 shows the Kissinger plots used to calculate the apparent activation energy (E
α) for each material. TCI dealkaline lignin and isolated lignin exhibit higher slopes, corresponding to higher activation energies (around 247 and 264 kJ/mol), compared to the brown solid. This indicates that lignin-rich samples, especially in their commercial or extracted forms, require more energy to initiate decomposition, reflecting their condensed aromatic structures and high thermal stability.
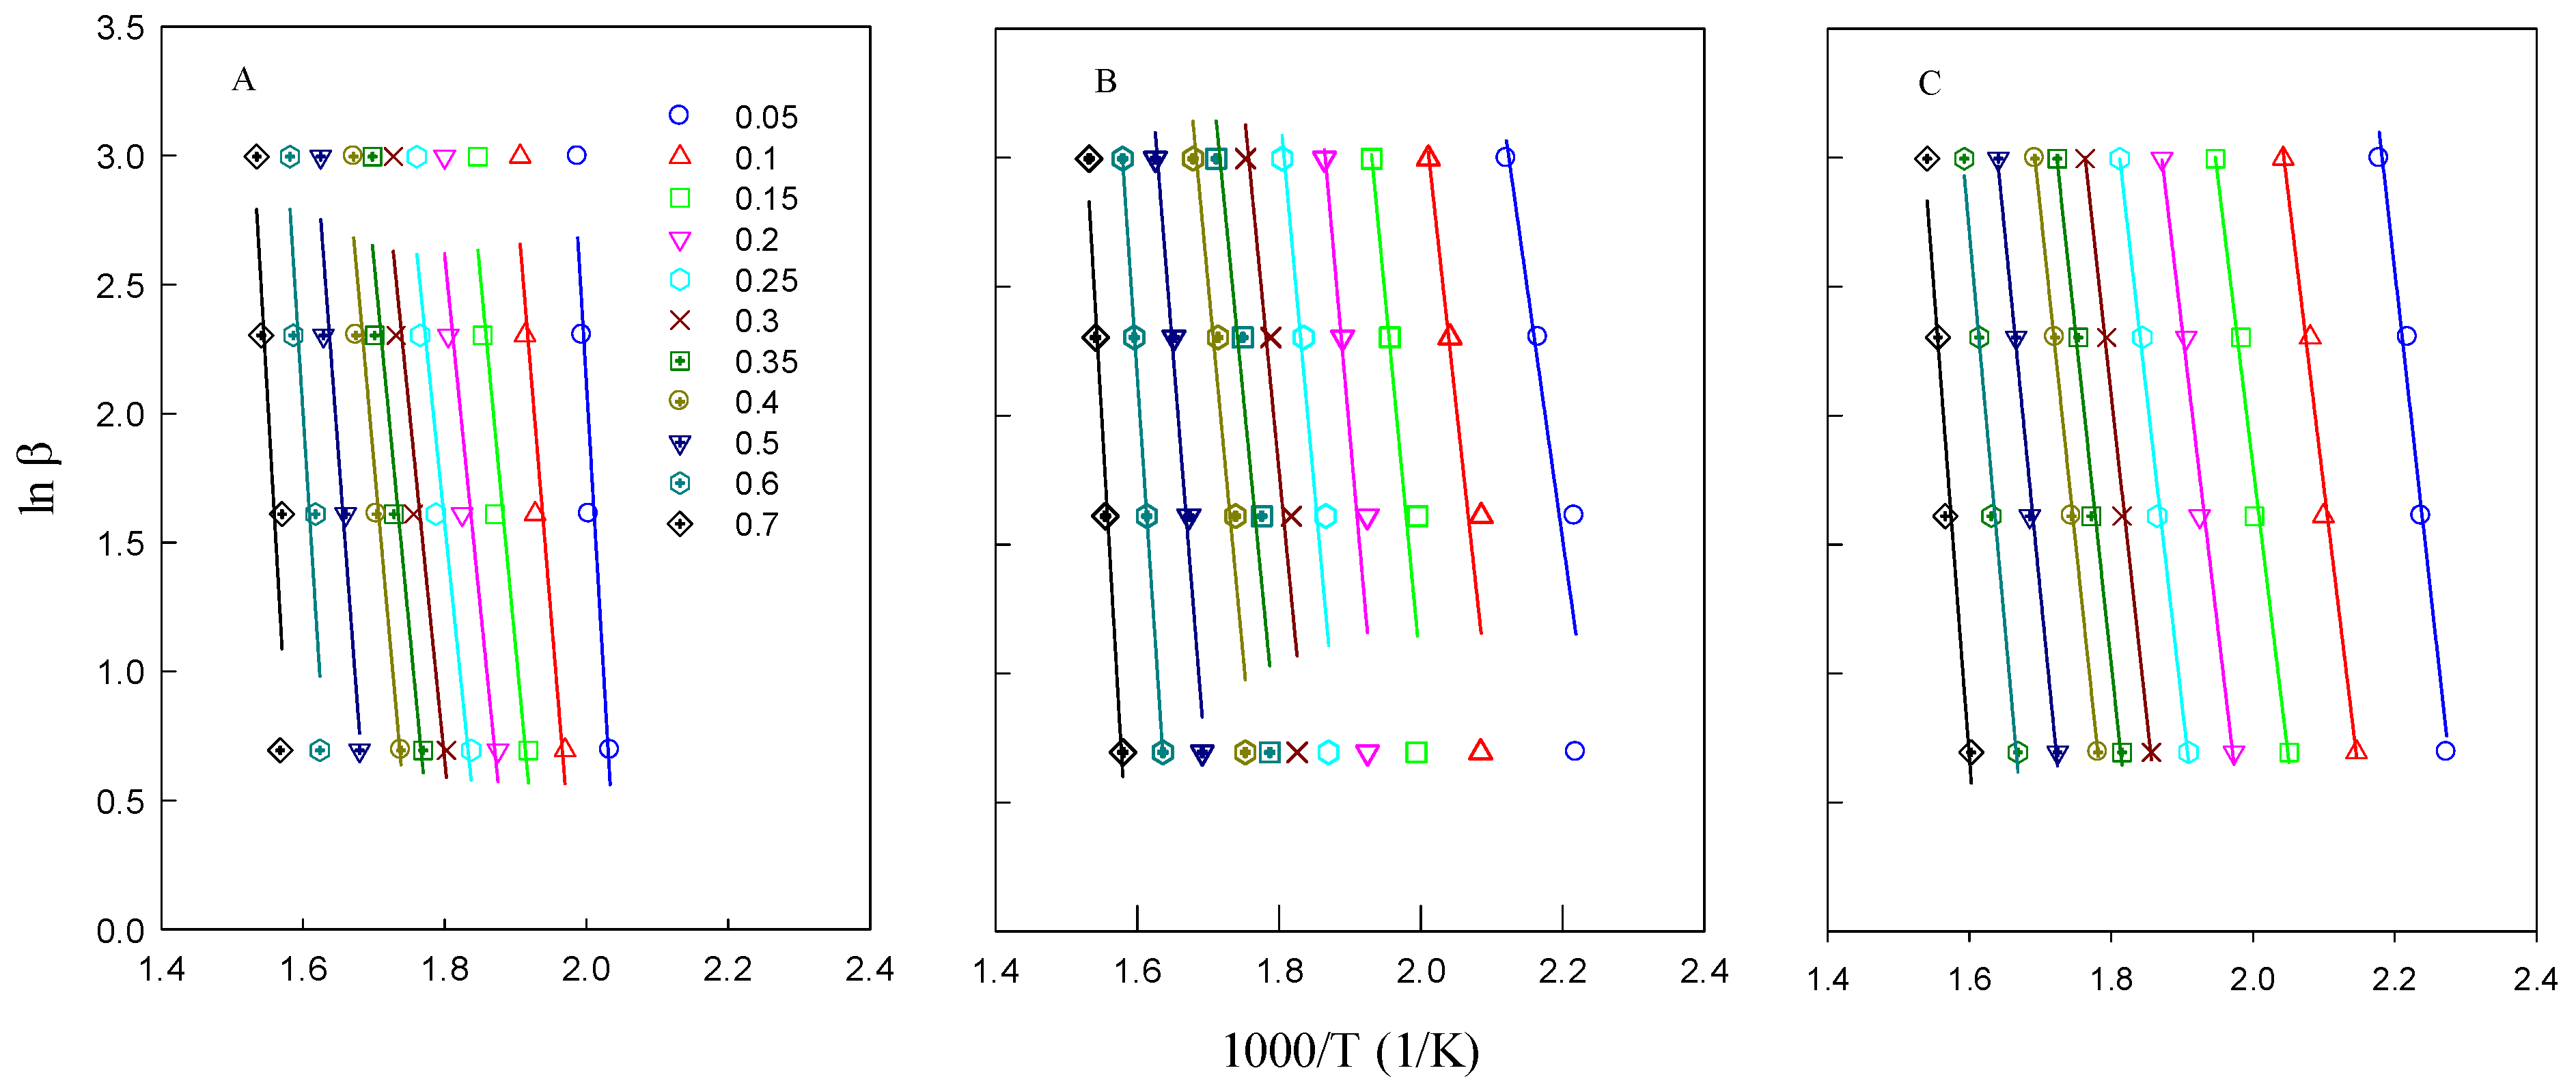
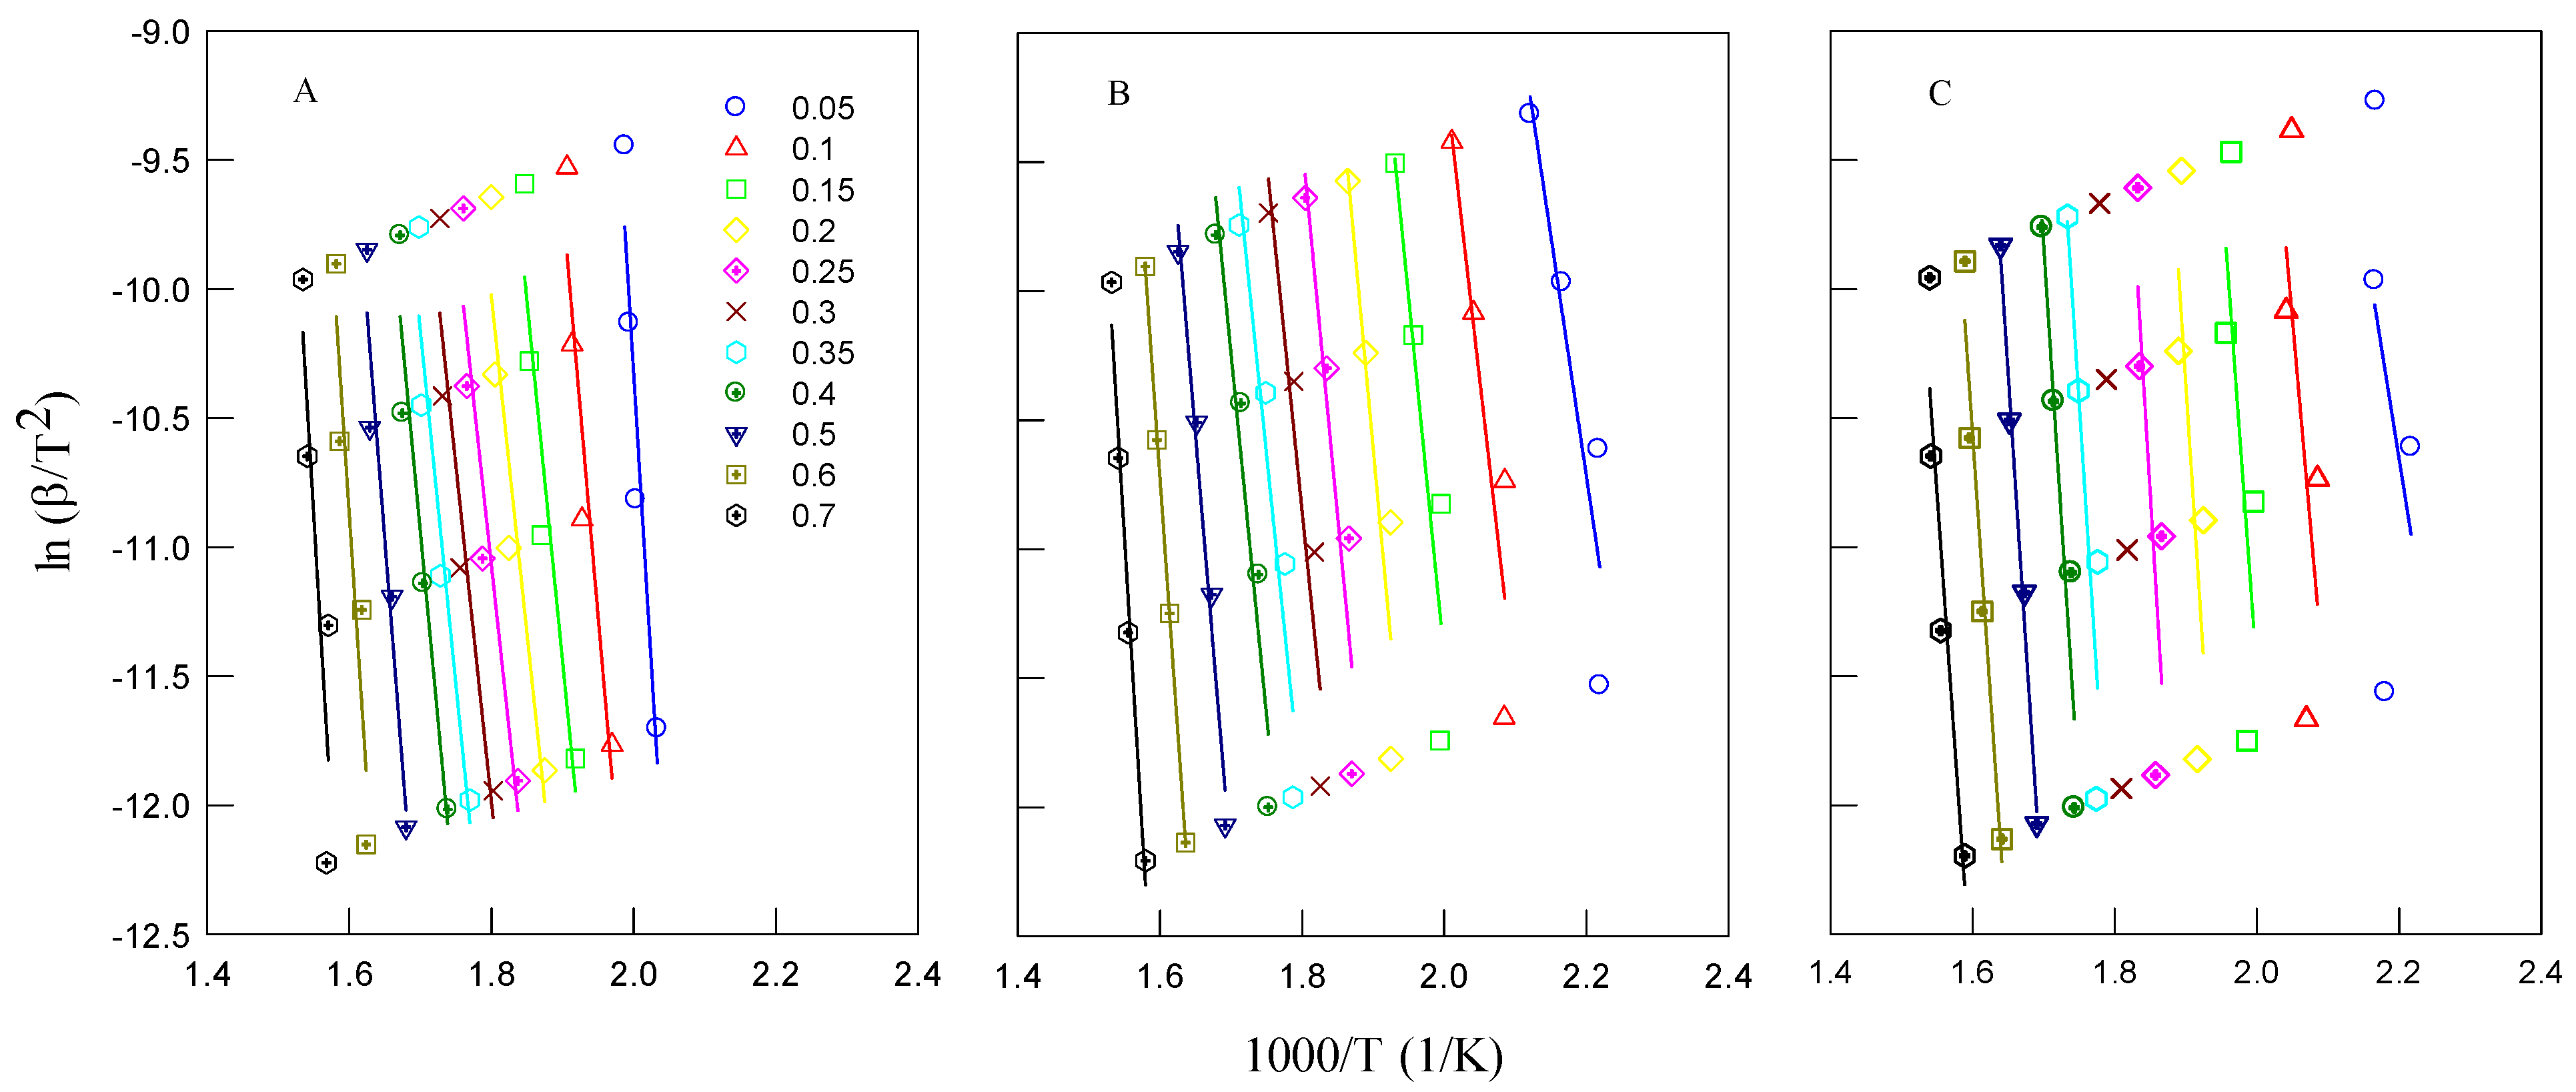
The kinetic parameters were further calculated using the FWO and KAS methods. The activation energies obtained by the FWO method were determined from the slope of the ln(β
i) versus 1000/T
ai plots (
Figure 5), while the KAS method calculated activation energy from the slope of the ln(β/T
ai2) versus 1000/T
ai plots (
Figure 6). The results indicate that the activation energy of isolated lignin is lower than that of the brown solid, suggesting that lignin decomposes more easily compared to untreated biomass. The activation energy values for all studied feedstocks ranged from 200 to 274 kJ/mol. It was observed that the activation energy values varied slightly with different heating rates for each type of biomass. As the heating rate increased, the heat effect also increased, leading to changes in the reaction kinetics [
14].
Activation energy represents the minimum energy required for a reaction to initiate, meaning that a higher activation energy corresponds to a slower reaction rate and greater difficulty initiating the reaction. The activation energies derived from the Kissinger method represent the actual kinetic values for the entire pyrolysis process. In contrast, the FWO and KAS methods provide the apparent activation energy, as they account for contributions from both physical and chemical reaction mechanisms that occur during pyrolysis. The results obtained from these three methods were consistent, with the FWO and KAS methods proving more efficient in describing the degradation process, as they allowed for activation energy calculations at different conversion levels.
3.4.2. Dependence of Activation Energy on Conversion
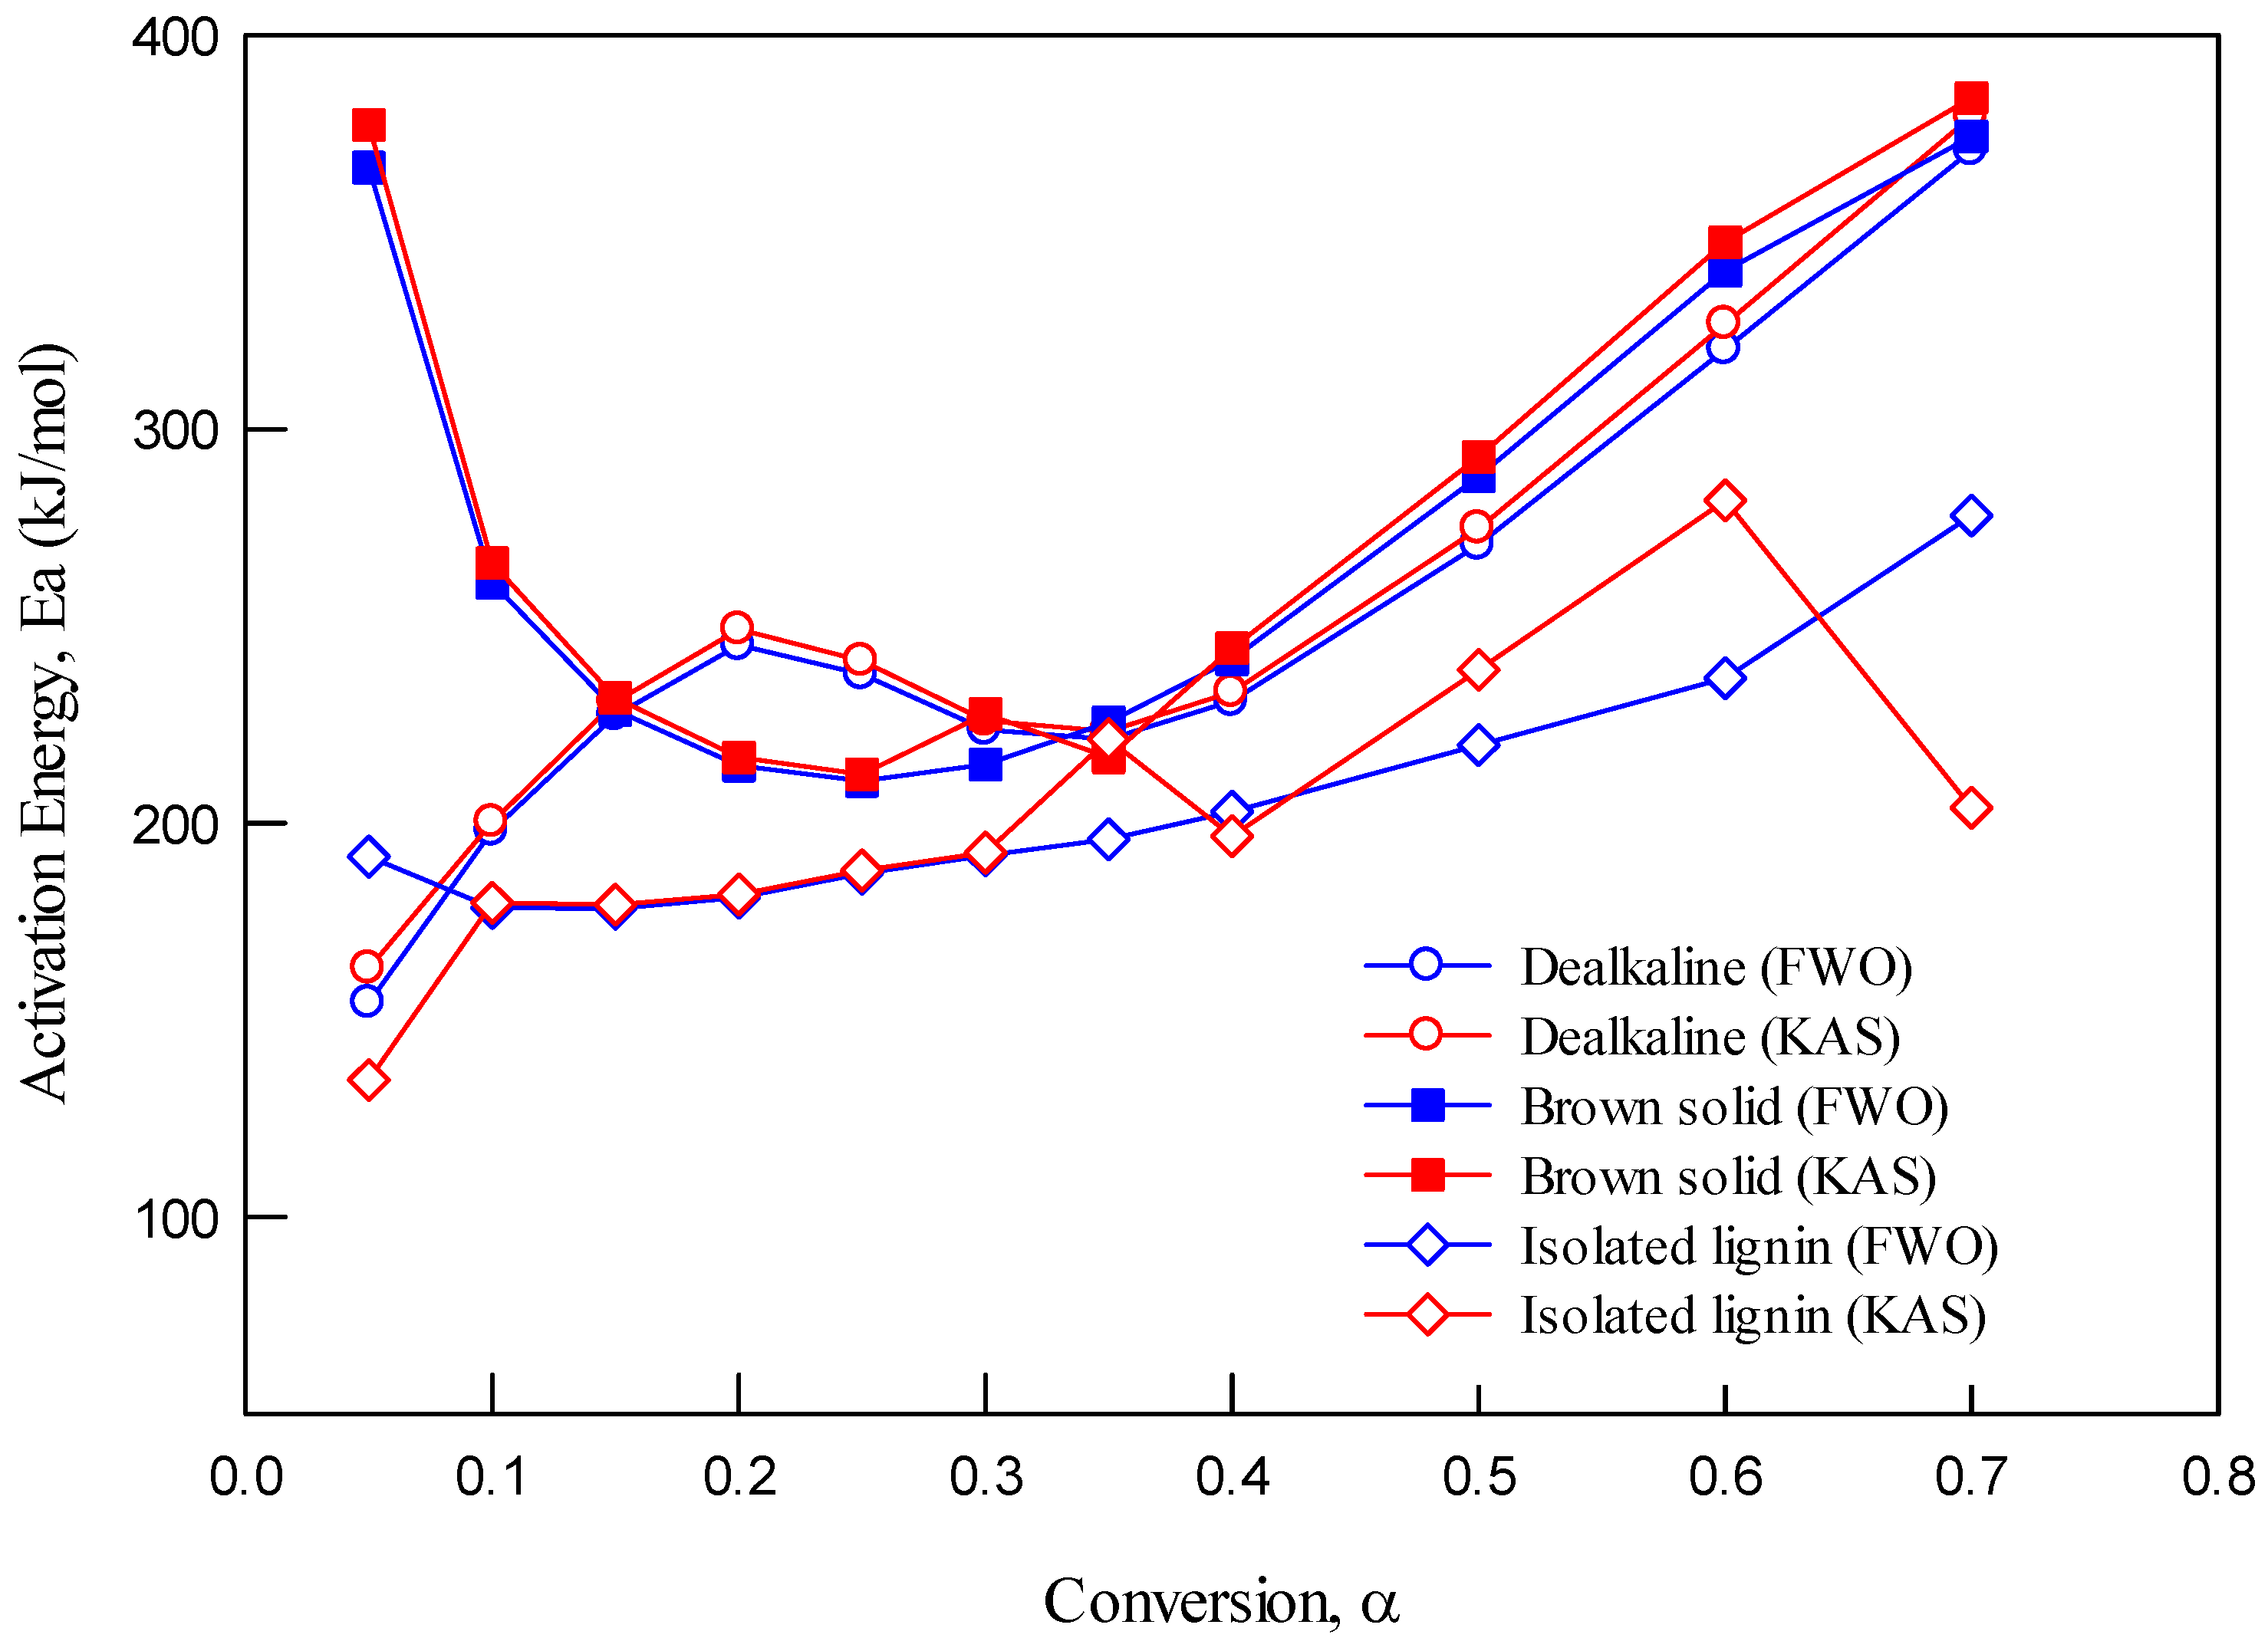
The analysis in
Figure 7 demonstrates that activation energy varies with conversion. The non-linear variation across all feedstocks confirms that pyrolysis is a multi-step process, not governed by a single reaction mechanism. For isolated lignin, the relatively consistent E
a at low conversion values suggests a uniform degradation phase, likely due to fewer impurities and higher purity. In contrast, the brown solid shows more fluctuation, indicating overlapping degradation of hemicellulose, cellulose, and residual organics.
The apparent activation energy values differed for each feedstock type, suggesting that the reaction mechanism changes at different stages of decomposition. This observation aligns with previous findings by Damayanti and Wu [
9], who used Friedman’s isoconventional method to determine activation energy as a function of conversion. Damayanti and Wu’s study divided the degradation process into four distinct stages, each characterized by different activation energy values, further supporting the idea that biomass pyrolysis involves multiple overlapping reactions with varying kinetic parameters.
3.5. Carbonization
The biochars obtained from the pyrolysis of brown solid under different conditions were subjected to physical and chemical activation. Physical carbonization was carried out by heating the biochar in a furnace at 800 °C for 1 h without any chemical additives. In contrast, chemical activation involved pretreatment with chemical reagents before heating. KOH was selected as the primary chemical activation agent, as it is widely recognized for producing porous carbon structures with a high specific surface area. Additionally, NaOH was used for comparison, as it functions similarly to KOH by creating pores through Na intercalation between the carbon lattices.
Figure 8 illustrates the impact of different activating agents (KOH, NaOH, K
2CO
3, and Na
2CO
3) and their char-to-agent ratios on the yield of AC derived from biochar. Across all activating agents, a clear trend emerges: the AC yield decreases as the amount of activating agent increases (i.e., lower char/agent ratio). This is because a higher chemical dosage leads to more-intense etching of the carbon matrix, resulting in a more porous structure but also greater mass loss due to the removal of volatile components and partial carbon burn-off. Comparing the agents, KOH does not provide the highest yields. Conversely, carbonates (K
2CO
3 and Na
2CO
3) yield more carbon, indicating milder activation effects.
Notably, all agents show a distinct dip in yield at the 2:1 ratio, which deviates from the otherwise gradual trend. The 2:1 ratio represents a critical threshold where partial activation occurs without sufficient chemical interaction. At this intermediate level, there may be enough activating agent to initiate pore development, but not enough to complete the formation of a well-structured porous network. This results in the excessive burn-off of volatile components without the structural benefits seen at higher ratios, such as 1:3, thus reducing overall AC yield.
3.5.1. Proximate Analysis of Activated Carbon
Table 3 presents the proximate analysis of activated carbons derived from brown solid biochar under different activation conditions, highlighting critical differences based on activation agents, ratios, and post-treatment methods. The table compares the moisture (volatile matter), fixed carbon, ash content, residue percentage, and initial degradation temperature (Ti) for various samples, revealing valuable insights into the quality and thermal stability of the activated carbons.
The first part of
Table 3 focuses on unwashed KOH-activated carbon at different char-to-agent ratios (1:1, 1:2, and 1:3). It is clear that as the proportion of KOH relative to char increases, the volatile matter decreases from 9.20% to 7.00–7.20%. The fixed carbon content increases significantly, reaching up to 54.7% at a 1:3 ratio. This trend indicates that a higher KOH content enhances the devolatilization and carbonization processes, thereby enriching the carbon structure. However, the ash content, although initially high at 16.5% for 1:1, decreases moderately to 10.3–11.4% for higher KOH ratios, indicating that a more thorough chemical activation with KOH promotes carbon formation and reduces the amount of inorganic residue.
A similar pattern is observed for unwashed NaOH-activated carbon. Although the fixed carbon contents (around 52.8–58.2%) are comparable to KOH activation, the ash contents are considerably lower, especially for the 1:2 and 1:3 NaOH-AC samples (2.1% and 4.8%, respectively). This suggests that NaOH is more effective in removing inorganic impurities during activation. The initial decomposition temperatures (Ti) also vary: NaOH-activated carbons exhibit lower Ti values (110–202 °C) compared to KOH-activated samples (156–237 °C), implying that NaOH-activated carbons may be less thermally stable initially, although they maintain high carbon contents.
The impact of washing KOH-activated carbon is substantial. For the 1:3 KOH-AC sample, washing reduces volatile matter to 6.80% and ash content to 44.7%, while maintaining a high fixed carbon level of 44.4%. This indicates that washing effectively removes residual chemicals and ash-forming impurities, enhancing the carbon’s purity. Additionally, the initial decomposition temperature (Ti) using TGA increases to 377 °C, significantly higher than that of unwashed samples, demonstrating improved thermal stability and structural integrity.
From a comparative standpoint, KOH activation appears more effective at producing activated carbons with high carbon content, but at the cost of higher ash residues if not washed. NaOH activation produces lower ash content even without washing but might result in slightly less thermally stable carbons. Washing is thus a critical step, especially for KOH-activated samples, as it ensures a high fixed carbon content, low ash content, and enhanced thermal resistance, making the activated carbon more suitable for high-temperature applications, such as environmental remediation or industrial adsorption processes.
Additionally, the trend that higher agent-to-char ratios (up to 1:3) yield higher fixed carbon and better activation quality suggests that optimizing the chemical activation ratio is vital. However, beyond 1:3, excessive chemical amounts might damage the pore structure, so the 1:3 ratio seems to represent an optimal balance between sufficient activation and structural preservation.
Overall, the findings in
Table 3 provide crucial evidence that the activation conditions and chemical type have a profound impact on the physical and chemical properties of the resulting activated carbon. A carefully controlled activation, particularly using KOH at a 1:3 ratio followed by proper washing, yields the best balance of high fixed carbon, low ash, and low volatile matter, along with excellent thermal stability, thus offering superior material for applications requiring efficient adsorption capacity and durability.
3.5.2. Surface Area and Morphology Analysis
The surface area of activated carbon is significantly influenced by the amount of activating agent used during the chemical activation process. As presented in
Table 4, the specific surface area generally increases as the amount of activation agent increases. However, the surface area decreases when using KOH at a char-to-agent ratio of 1:4. This reduction is likely to be due to the destruction of micropores and their subsequent conversion into mesopores. While the total pore volume increases, the micropore volume decreases compared to the 1:3 char-to-KOH ratio. This observation aligns with Fu et al., who stated that KOH intercalates into the carbon lattice, forming pores [
20]. Under moderate conditions (i.e., lower activation temperatures and an optimal KOH amount), the rate of pore formation surpasses the rate of deformation, leading to an increased specific surface area.
Specific surface area generally increases with higher activation temperatures and increased KOH dosage. However, when the pore formation and deformation rates reach equilibrium, the surface area stabilizes and reaches its maximum value. Under extreme conditions (i.e., high temperature and excessive KOH amounts), pore widening occurs, and many micropores collapse, transforming into mesopores and macropores. This results in a decrease in specific surface area.
3.5.3. Effect of Pyrolysis Temperature on Surface Area
As shown in
Table 5, the pyrolysis temperature significantly influences the surface area of activated char. A higher carbonization temperature increases surface area, primarily due to the removal of volatile matter and organic compounds, which facilitates the development of a well-structured pore network. The ASAP analysis also allowed for nitrogen adsorption isotherms for the activated char to be determined. These isotherms indicate the type of adsorption behavior, which is essential for understanding the adsorption capacity and performance of the activated carbon.
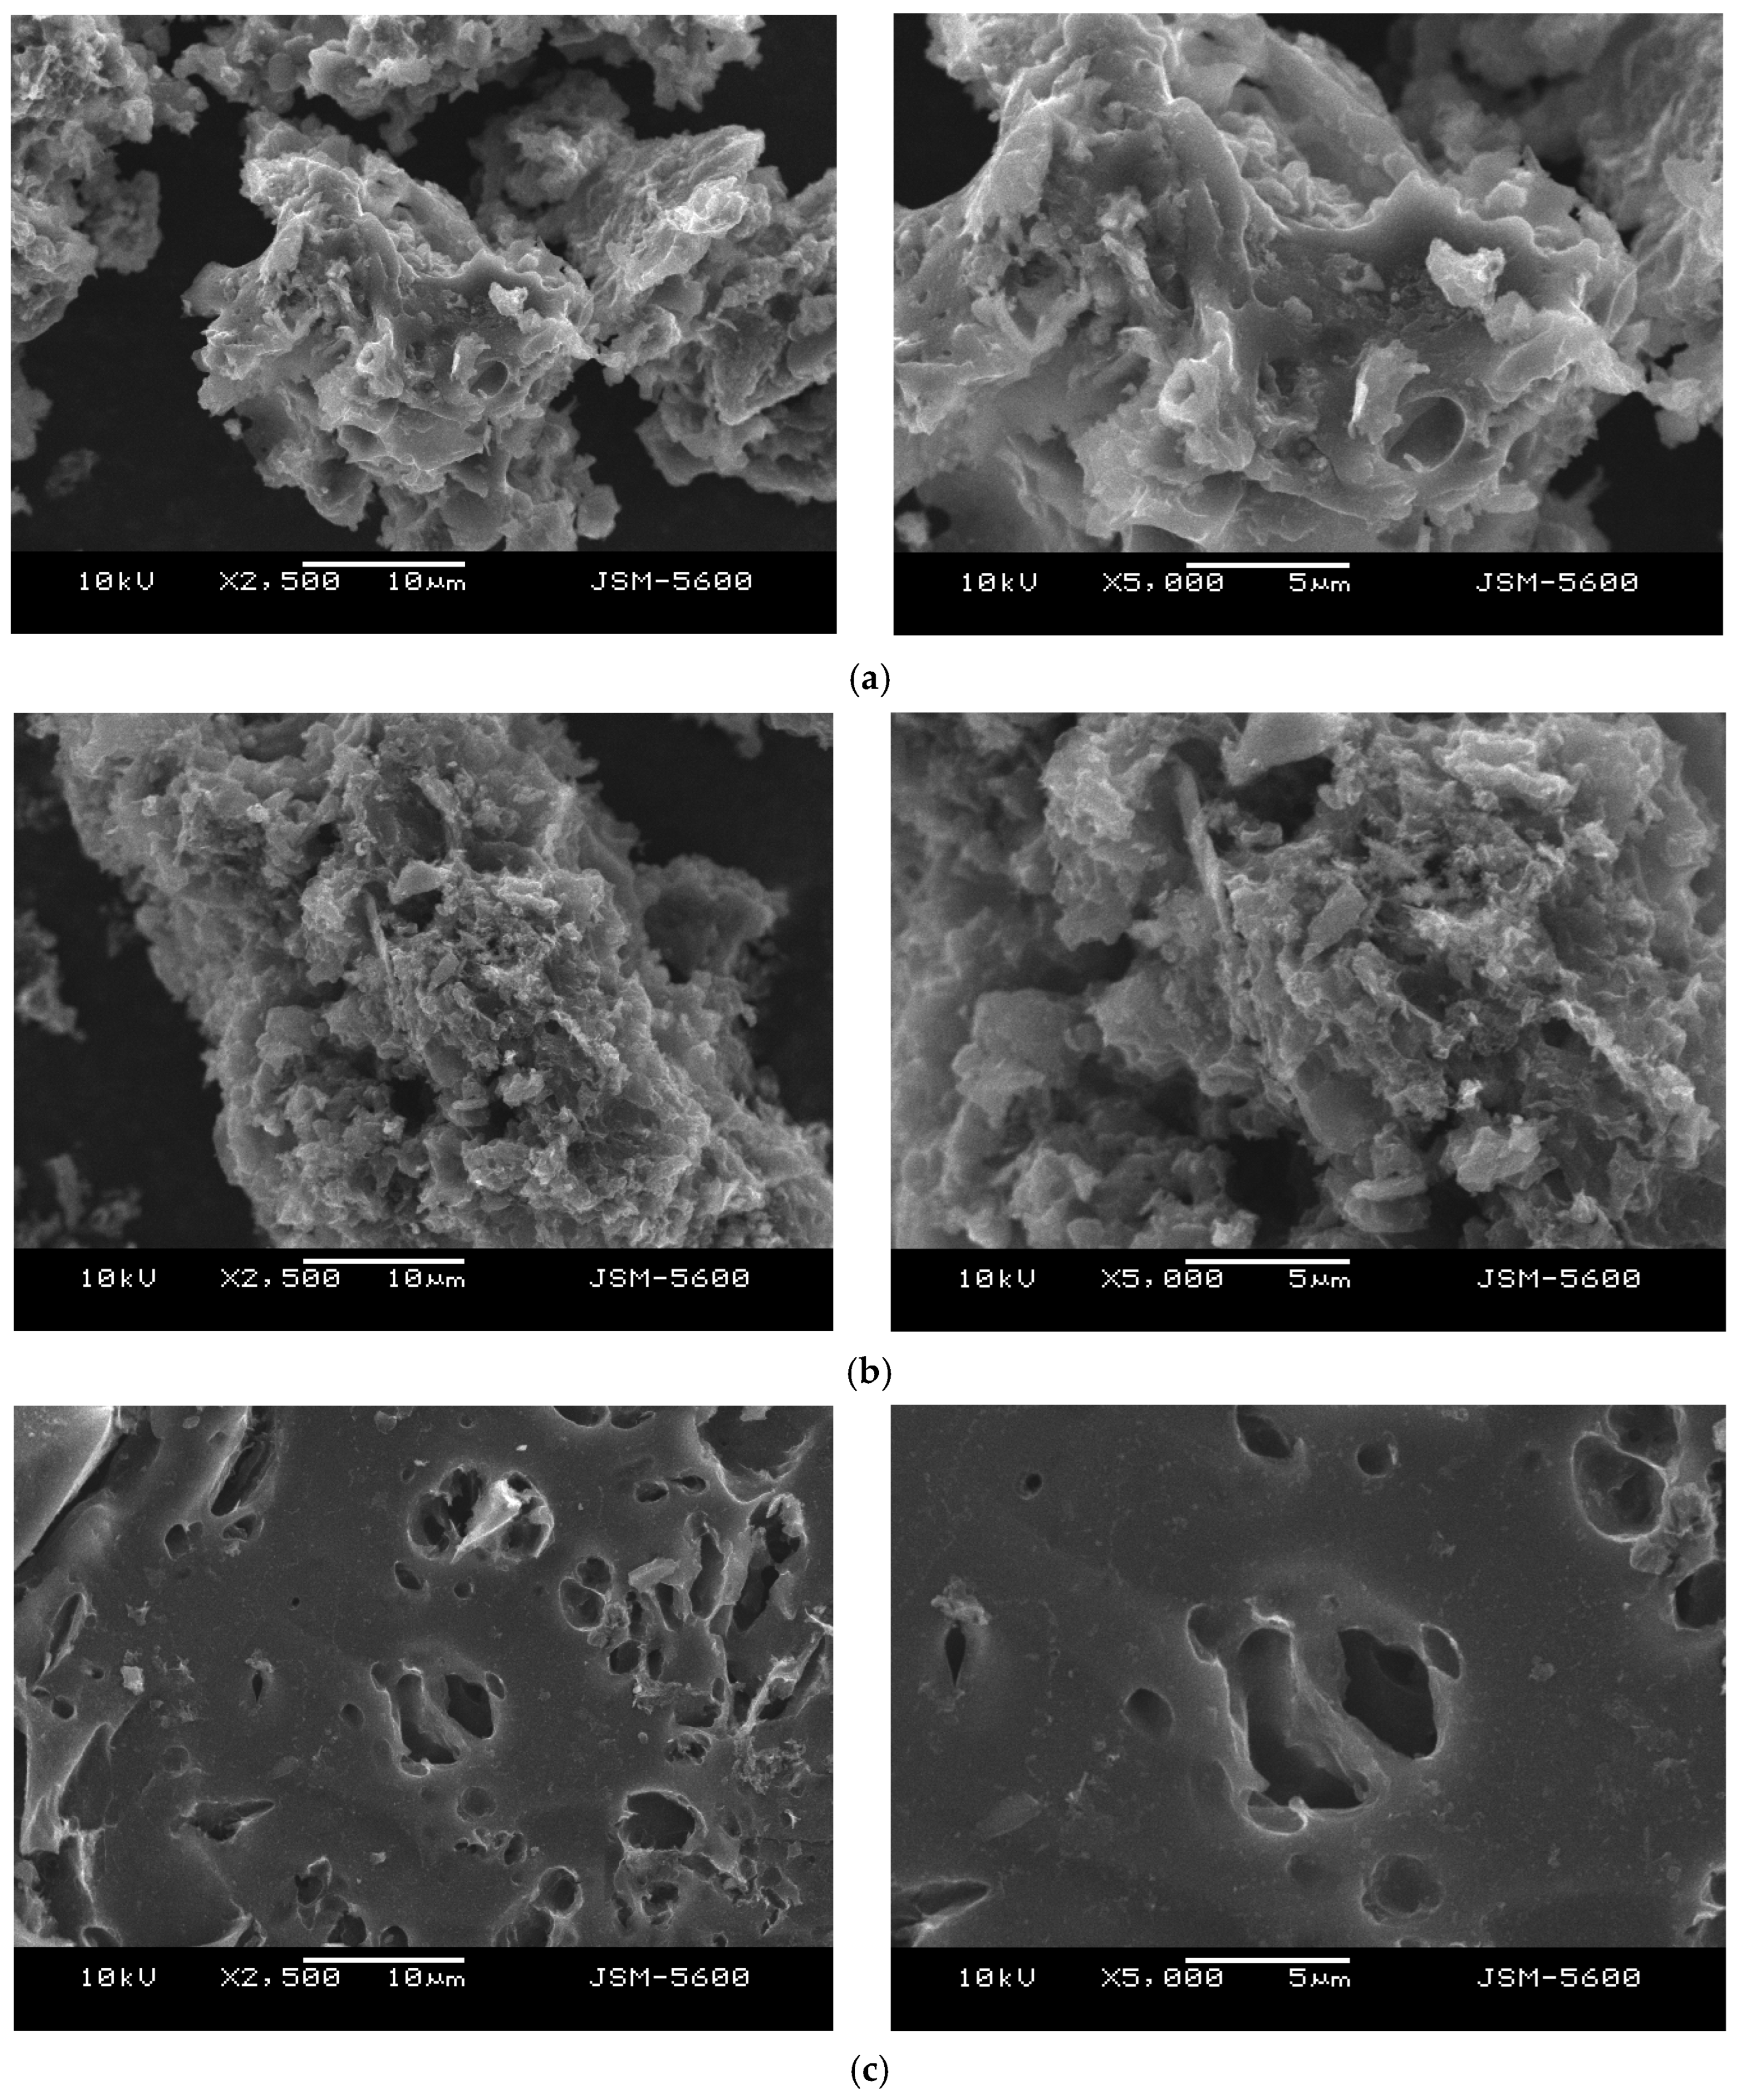
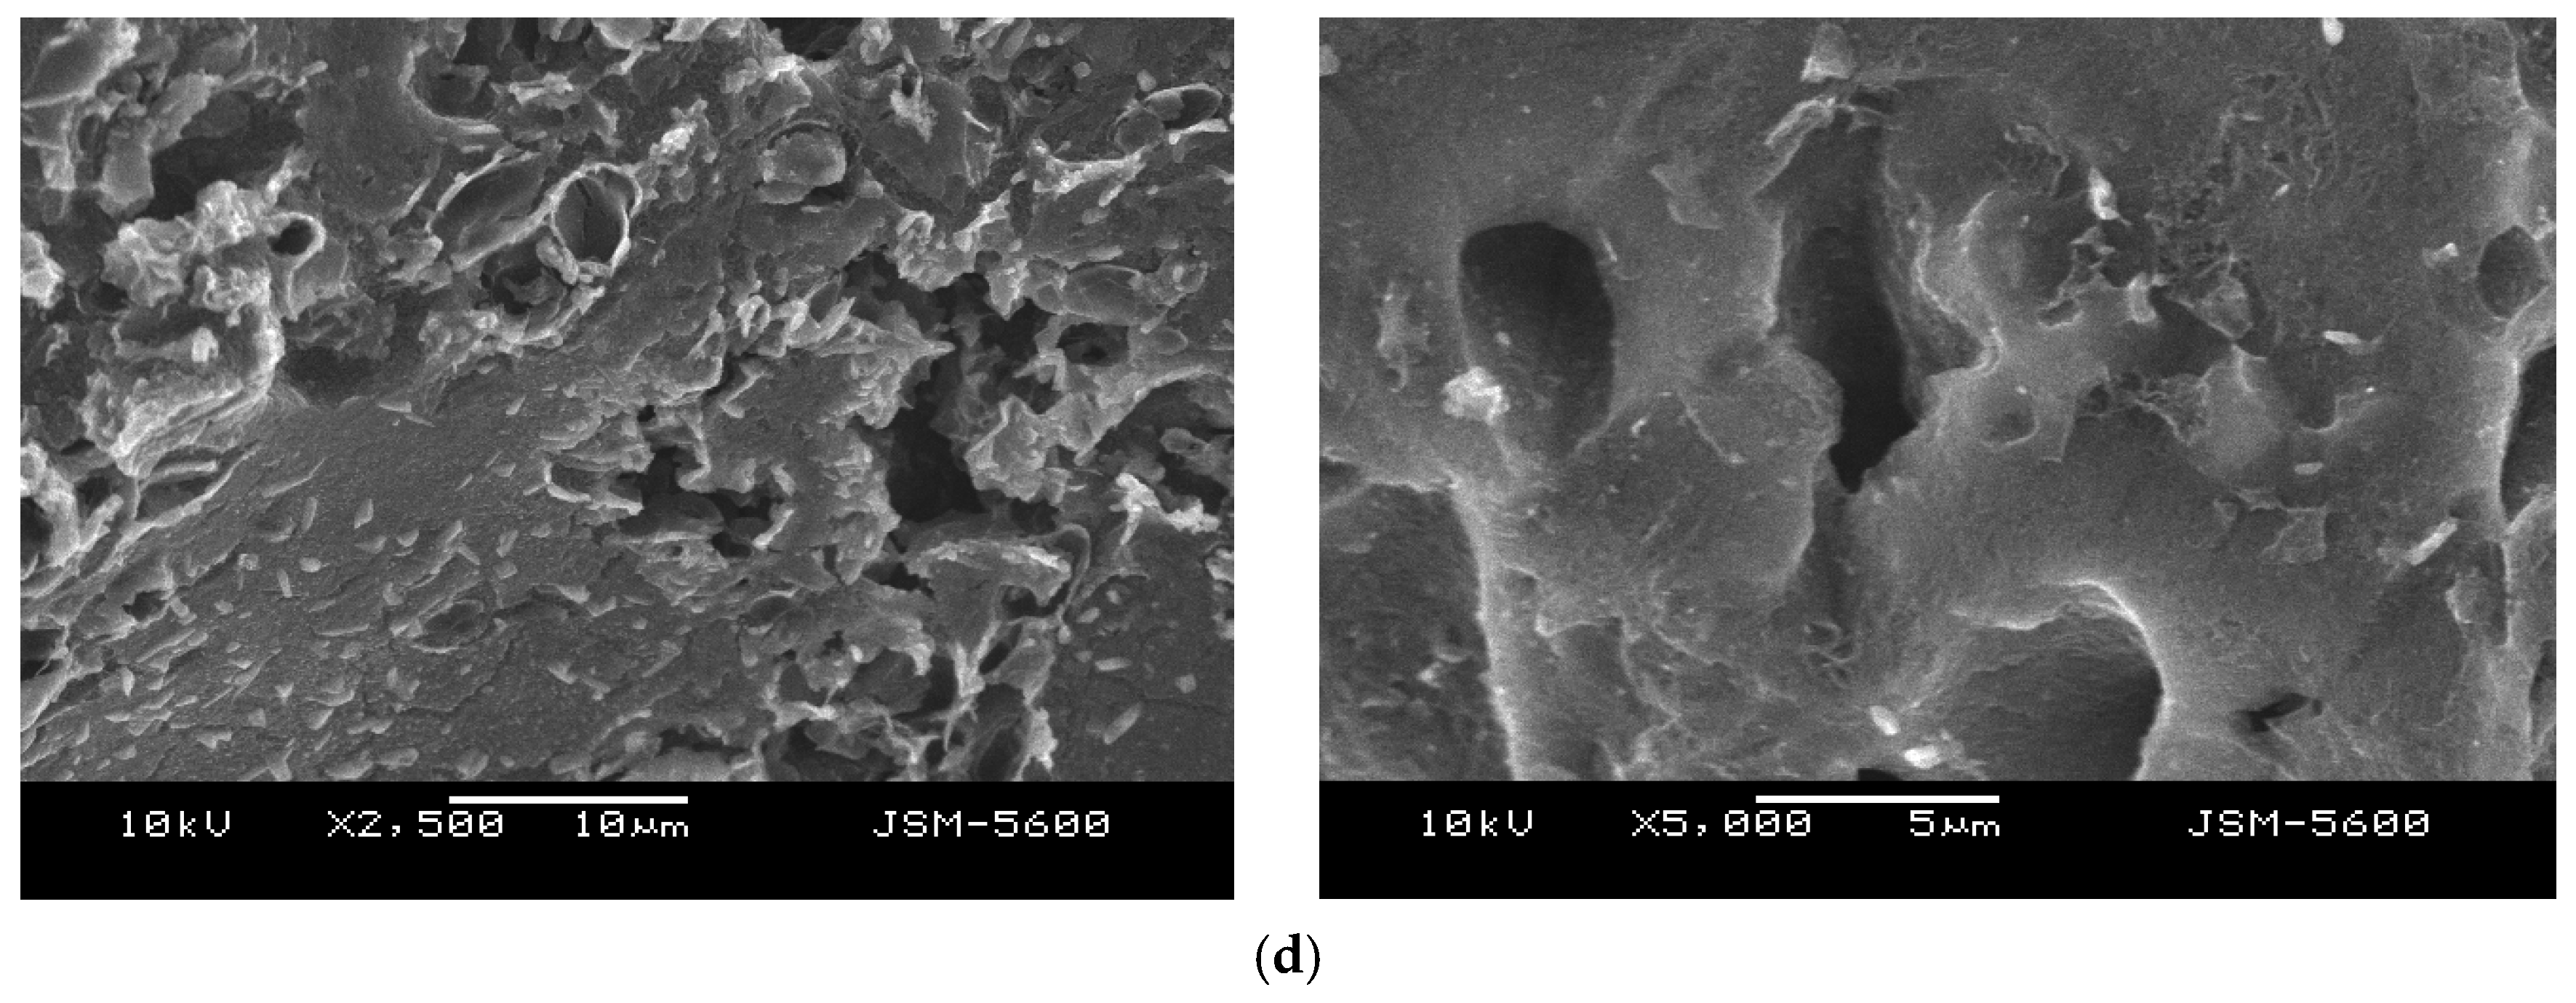
To investigate the surface morphology of activated carbon obtained from different activation agents, scanning electron microscopy (SEM) analysis was conducted.
Figure 9a,b illustrate that the surface morphology of biochar-550-based activated carbon contains small and large pores of varying shapes, which contribute to its higher BET surface area. Conversely,
Figure 9c,d depict alkaline lignin-derived activated carbon, which exhibits a denser surface with fewer pores.
The KOH-activated biochar (
Figure 9a) exhibits a highly porous and rough surface, with numerous interconnected pores of various sizes. This structure reflects the strong chemical etching and intercalation effect of KOH, which effectively develops a wide range of micro- and mesopores during activation. This enhanced porosity is consistent with the high surface area and adsorption performance reported in the study.
When comparing biochar-derived activated carbon to dealkaline-lignin-derived activated carbon, the differences are also pronounced. The dealkaline lignin samples (
Figure 9c,d) display a denser, more compact surface morphology with minimal visible porosity, regardless of the activating agent used. The lack of pore formation suggests that the lignin structure, even after activation, is less responsive to chemical etching, possibly due to its inherent aromatic rigidity and low ash content.
3.5.4. Elemental Analysis of Activated Carbon
The elemental analysis aimed to determine the ratio of weight loss of specific elements in char during activation, based on the weight content of the element in char (X
char). This calculation follows the methodology outlined by Tseng (2007) [
21].
where X
char represents the element X’s weight content in the char, X
AC represents the element X’s weight content in the activated carbon, and element X can be C, H, or O. During heat treatment in an oxygen-free environment, H and O are more easily lost compared to C due to the thermal decomposition of organic matter. The elemental composition of the samples was determined using elemental analysis, with the results presented in
Table 6.
The carbon loss ratio increases with the amount of activation agent, suggesting that as the KOH concentration increases, more carbon reacts during activation. However, due to the water–gas reaction, the formation of CO gas reduces the solid-phase carbon yield, which is consistent with previous findings by Tseng et al. (2007) [
21]. H loss increases with increasing NaOH concentration, but the H loss ratio in this study remains constant as KOH concentration increases. The H loss ratio reaches equilibrium at a 1:1 char-to-KOH ratio, suggesting that beyond this point, further KOH addition does not significantly affect hydrogen depletion. Conversely, the O loss ratio decreases with increasing KOH concentration, implying that oxygen retention is enhanced under high KOH concentrations.
3.6. Dye Adsorption Study
Adsorption isotherm models are essential for understanding the distribution of adsorbates between the solid phase (activated carbon) and liquid phase (dye solution) and for evaluating the adsorbate–adsorbent interaction. The models have been described in our previous study [
22]. The KOH-activated carbon (1:3 ratio), especially after washing, exhibits the highest surface area (835.2 m
2/g).
Table 7 and
Figure 10 collectively present the equilibrium adsorption results of MB and MO on activated carbon (AC) prepared from brown solid. The AC was produced through KOH activation at a 1:3 char-to-agent ratio under 800 °C, which, as previously established, yielded a high surface area and a well-developed pore structure ideal for adsorption applications.
The equilibrium data were analyzed using three commonly applied isotherm models: the Langmuir, Freundlich, and Temkin models. Among them, the Langmuir model provided the best fit, as indicated by the high correlation coefficients (R2), particularly for MB (R2 = 0.997–0.998) and MO (R2 = 0.998–0.999) across temperatures of 303 K to 323 K. This model assumes monolayer adsorption on a homogeneous surface with identical sites, implying that the activated carbon displays uniform adsorption behavior.
The maximum monolayer adsorption capacities (
qm) derived from the Langmuir model were 222 mg/g for MB and 244 mg/g for MO at 303 K. These values increased to 250 mg/g for MB and 333 mg/g for MO at higher temperatures (313 K and 323 K), indicating a positive temperature dependence and suggesting that the adsorption process is endothermic. The results also show that MO has a slightly higher affinity and adsorption capacity on AC than MB, possibly due to differences in molecular structure and interaction mechanisms with the AC surface. This finding corresponds to the report by Gong et al. [
23] showing that MO exhibits a higher adsorption affinity due to its molecular size and functional groups.
The Freundlich model, which accounts for surface heterogeneity and multilayer adsorption, also fits reasonably well, though with lower R2 values than the Langmuir model. The Freundlich n values were consistently greater than 2, confirming favorable adsorption conditions for both dyes. The Temkin model, which assumes that the heat of adsorption decreases linearly with surface coverage, showed relatively lower R2 values compared to Langmuir and Freundlich, indicating its limited applicability to this system.
Figure 11 visually illustrates the Langmuir, Freundlich, and Temkin isotherm plots for both dyes. The linearity of the Langmuir plots further supports the superior applicability of this model in modeling the adsorption behavior of MB and MO onto KOH-activated carbon. The adsorption mechanism of MO and MB onto activated carbon is attributed to π–π stacking interactions between the aromatic rings of the dye molecules and the hexagonal carbon structure of activated carbon. Depending on the solution pH, MO exists in either a quinone or azo structure, with the azo structure exhibiting a stronger π-conjugated system. However, additional factors, such as molecular charge and particle size, may also influence adsorption efficiency.
3.6.1. Kinetics of MB and MO Adsorption
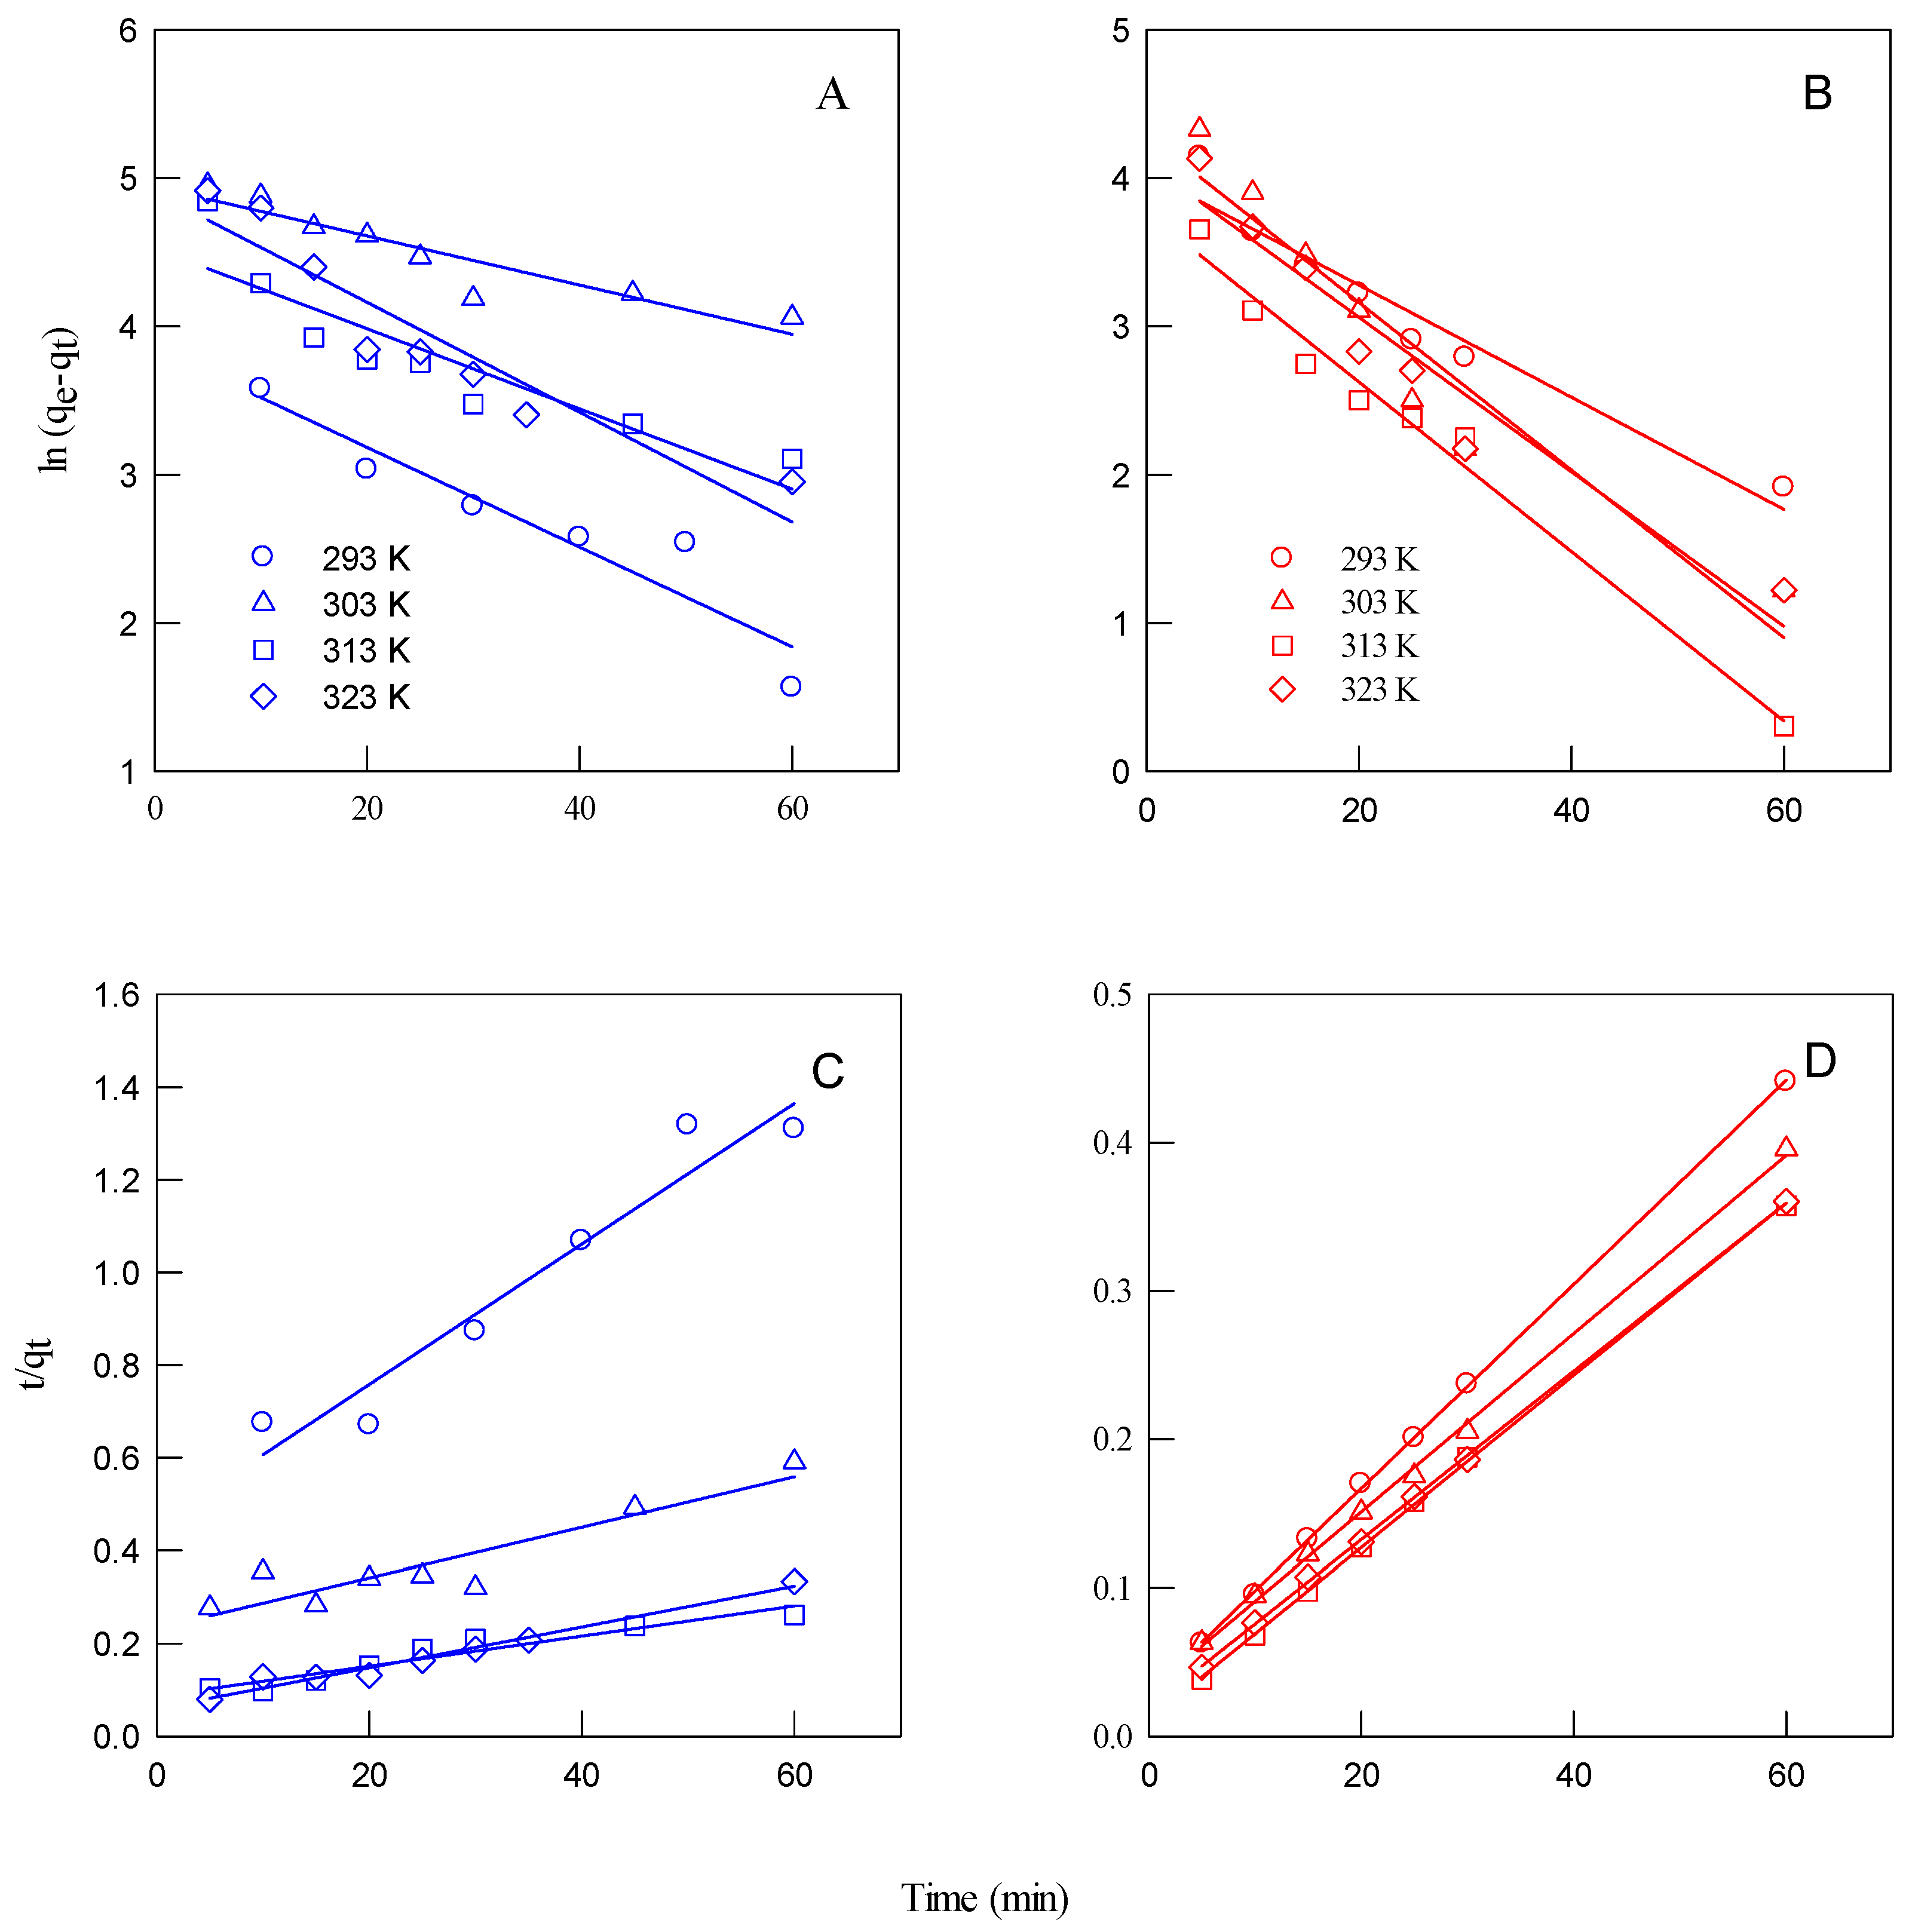
Kinetic modeling is crucial for understanding the mechanism and rate-controlling steps of MB and MO adsorption onto activated carbon. To analyze adsorption kinetics, pseudo-first-order and pseudo-second-order models were applied.
(i) Pseudo-first-order (PFO) model
In 1898, Lagergren proposed a pseudo-first-order model to describe a liquid–solid-phase adsorption system, which demonstrated that the adsorption rate is based on the adsorption capacity [
24]. The nonlinear form can be expressed as follows:
where k
pf is the adsorption rate constant (min
−1), q
e is the equilibrium adsorption capacity (mg g
−1), and q
t is the adsorption capacity (mg g
−1) at time t (min). The log rate (q
e − q
t) vs. t can be plotted to calculate the adsorption rate constant [
25].
(ii) Pseudo-second-order (PSO) model
In 1995, Ho established a pseudo-second-order model in a batch reactor system [
26]. The differential form is as follows:
where k
ps is the adsorption rate constant (g mg
−1 min
−1).
Table 8 presents the kinetic parameters for the adsorption of MB and MO onto KOH-activated carbon at different temperatures (20 °C to 50 °C). The results are analyzed using PFO and PSO kinetic models. The PFO model assumes that adsorption occurs in proportion to the number of available adsorption sites, making it suitable for physical adsorption (physisorption) [
27].
The PSO model has been widely used to describe the adsorption of dye molecules from aqueous solutions [
28]. This model provides a better agreement between the calculated adsorption capacity (q
cal) and equilibrium adsorption data (q
m), making it a reliable predictor of adsorption behavior. Additionally, the rate coefficients (K
2) at different temperatures, derived from this model, were used to calculate the thermodynamic parameters governing the adsorption process.
For both dyes, the PSO model fits the experimental data better, as indicated by consistently higher correlation coefficients (R
2 > 0.99), compared to the PFO (R
2 values ranging from ~0.85 to 0.98). This suggests that the adsorption process is likely controlled by chemisorption, involving electron sharing or exchange between the dye molecules and the active sites on the activated carbon. This finding aligns with experimental results from Gong et al. [
23], which also suggested that MO and MB adsorption followed a pseudo-second-order kinetic model, indicating that adsorption is predominantly controlled by chemical interactions (chemisorption) rather than simple physical attraction.
The calculated adsorption capacities (qe) under the PSO model are significantly higher and closely match experimental observations—200 mg/g for MB and up to 167–200 mg/g for MO, depending on temperature. In contrast, the qe values under the PFO model are unrealistically low (mostly below 1 mg/g), further supporting the inaccuracy of the first-order assumption.
As shown in
Table 8, the adsorption rate constant (K
2) increases with rising temperature, indicating that higher temperatures facilitate the adsorption process. However, the rate decreases at 50 °C, suggesting that 40 °C is the optimum temperature for MO and MB adsorption. This decline at higher temperatures may be attributed to desorption effects or structural changes in the adsorbent that reduce adsorption efficiency.
3.6.2. Thermodynamic Parameters
The distribution coefficient (K
d) at each temperature was determined to assess the thermodynamic feasibility and nature of adsorption. Using the Van’t Hoff equation, the Gibbs free energy change (ΔG), enthalpy change (ΔH), and entropy change (ΔS) were calculated from the linear plot of K
d versus 1/T (
Figure 12), with the values presented in
Table 9. The ΔG values for MO and MB adsorption were negative, confirming that adsorption is a spontaneous process. However, increasing the temperature makes ΔG less negative, suggesting that adsorption efficiency declines at higher temperatures.
The enthalpy (ΔH) was calculated as 4.4 kJ/mol for MO adsorption and 4.2 kJ/mol for MB adsorption. The positive ΔH values indicate that the adsorption process is endothermic, meaning heat absorption enhances dye adsorption onto activated carbon. This thermodynamic behavior aligns with the observed increase in adsorption capacity with temperature, up to an optimal point.
In summary, the adsorption of MO and MB onto activated carbon follows the Langmuir isotherm model, is best described by pseudo-second-order kinetics, and occurs spontaneously with an endothermic nature. The results confirm that activated carbon derived from KOH activation (1:3) is an effective adsorbent for dye removal, particularly in optimized temperature conditions.
3.6.3. Adsorption Mechanism
The adsorption mechanism of MO and MB onto activated carbon can be classified as either physisorption or chemisorption, depending on the enthalpy change (ΔH) and activation energy (E
a) values. According to Bonilla-Petriciolet et al. (2017) [
28] and Gong et al. (2013) [
23], a ΔH value lower than 20 kJ/mol is indicative of physisorption, which involves weak van der Waals forces and electrostatic interactions between the adsorbent and adsorbate. Physisorption can occur as monolayer or multilayer adsorption, whereas chemisorption consists of the formation of strong chemical bonds between the adsorbate and adsorbent surface.
In this study, both ΔH and Ea values confirm that MO and MB adsorption onto activated carbon followed a physisorption mechanism. The negative entropy change (ΔS) also suggests that randomness at the solid–solution interface decreases during adsorption, indicating a more structured arrangement of dye molecules on the adsorbent surface.
The E
a was also calculated to further confirm the adsorption mechanism. According to Jawad et al. (2016) [
29], an E
a value between 5 and 40 kJ/mol corresponds to physisorption, whereas values in the 40–800 kJ/mol range suggest chemisorption. The results of this study showed that both ΔH and E
a values fall within the range of physisorption, reinforcing the conclusion that MO and MB adsorption onto AC is a physical adsorption process.
3.6.4. Desorption Studies and Adsorbent Reusability
The desorption study assessed the reusability of activated carbon and its potential for use in solid waste management applications. The ability to regenerate and reuse the adsorbent over multiple adsorption–desorption cycles is essential for economic feasibility and sustainability. This study investigated the reusability of brown-solid-derived activated carbon prepared at 550 °C using KOH as an activation agent. Three adsorption–desorption cycles were carried out using 0.1 mg of activated carbon in 100 mL of 50% (
v/
v) ethanol at 30 °C. The adsorption–desorption kinetics for MO and MB were analyzed, and the results are presented in
Table 10.
The kinetic analysis revealed that adsorption and desorption followed the pseudo-second-order model, suggesting that surface interactions dominated the adsorption process, rather than diffusion alone. Interestingly, the desorption rate coefficient (K2) was higher than the adsorption rate coefficient, suggesting that the desorption process occurred more rapidly than adsorption.
Table 10 shows a gradual decline in adsorption capacity across cycles for both dyes. For example, the PSO calculated capacity (q
e) for MO drops from 167 mg/g in the first cycle to 107.5 mg/g by the third. A similar trend is observed for MB, decreasing from 200 mg/g to 84.75 mg/g. A gradual decline in adsorption capacity was observed over successive cycles, indicating that some dye molecules remained bound to the adsorbent and were not fully desorbed. This partial retention of dye molecules suggests that surface modifications, strong interactions, or pore blockage may hinder complete desorption, ultimately reducing the adsorbent’s efficiency after multiple cycles. The cause of the decline is pore blockage. During adsorption, dye molecules can become trapped deep within micropores or form aggregates in the pore structure, which may not be entirely removed during desorption. This reduces the number of accessible adsorption sites in subsequent cycles.
Another factor is surface chemistry alteration. Repeated adsorption–desorption in ethanol and thermal drying may alter the surface functional groups, particularly oxygen-containing groups, which are critical for dye binding. This degradation can reduce the adsorbent’s affinity for the dyes. Additionally, structural degradation of the activated carbon over cycles, especially under mild thermal and chemical stress, can collapse smaller pores or alter pore geometry, thereby affecting dye diffusion and interaction.
The adsorption of MO and MB onto activated carbon in this study primarily followed a physisorption mechanism, as confirmed by the ΔH and Ea values. The desorption study demonstrated that activated carbon can be reused for multiple adsorption–desorption cycles, although its adsorption capacity decreased over time. The incomplete desorption of dyes suggests that further optimization of desorption conditions or surface modifications may be required to improve the long-term reusability of activated carbon for industrial dye removal applications.
4. Conclusions
This study systematically explored the potential of brown solid for biochar and AC production and their subsequent application in dye adsorption. The brown solid, a by-product of bioethanol production, was characterized by low cellulose and hemicellulose content but high lignin and ash content. Through alkaline pretreatment and isolation using 2% NaOH under microwave conditions, lignin with high hydroxyl content, purity, and yield was successfully extracted. P31 NMR confirmed an increase in hydroxyl functionalities, which are critical for enhancing reactivity during carbonization.
Three isoconversional kinetic models (Kissinger, Flynn–Wall–Ozawa, and Kissinger–Akahira–Sunose) were employed to investigate the thermal degradation behavior and calculate the activation energies. Results showed that isolated lignin had a lower activation energy (194 kJ/mol) compared to brown solid (264 kJ/mol) and TCI dealkaline lignin (247 kJ/mol), suggesting that lignin decomposes more readily and is suitable for energy-efficient pyrolysis. The variation in activation energy with conversion confirmed that pyrolysis is a complex, multi-step process.
Biochar was produced from brown solid via pyrolysis at 450 °C and 550 °C. The higher temperature enhanced carbon content and thermal stability, making it more suitable for activation. Activated carbon was obtained using physical and chemical methods, with KOH and NaOH as chemical activating agents. Among the tested conditions, the optimal activation was achieved using KOH at a char-to-agent ratio of 1:3, followed by HCl washing. This condition yielded AC with the highest specific surface area (835.2 m2/g), well-developed porosity, and high fixed carbon (44.4%). SEM analysis confirmed a well-developed pore structure, particularly for biochar-derived AC, in contrast with the denser structure seen in lignin-derived AC.
The resulting ACs were tested for the adsorption of MO and MB. The adsorption followed the Langmuir isotherm model with high capacities, 244 mg/g for MO and 222 mg/g for MB, demonstrating monolayer adsorption on homogeneous surfaces. Kinetic studies indicated that adsorption followed a pseudo-second-order model, suggesting chemisorption behavior. Thermodynamic analyses revealed the process to be spontaneous (negative ΔG) and endothermic (positive ΔH), with physisorption as the dominant mechanism based on activation energy and enthalpy values.
Reusability tests demonstrated that the AC retained a considerable adsorption capacity over three cycles, although a slight decline occurred due to incomplete desorption and potential pore blockage. Desorption followed pseudo-second-order kinetics, with faster rates than adsorption.


