Article

Biochar-Enriched Organic Fertilizers from Sugar Industry Waste: A Sustainable Approach to Soil Fertility and Crop Growth

by
Helitha Nilmalgoda
1,2,3,
Jayashan Bandara
1,
Isuru Wijethunga
1,
Asanga Ampitiyawatta
4 and
Kaveenga Koswattage
2,5,*
1
Department of Biosystems Technology, Faculty of Technology, Sabaragamuwa University of Sri Lanka, Belihuloya 70140, Sri Lanka
2
Centre for Nanodevice Fabrication and Characterization, Faculty of Technology, Sabaragamuwa University of Sri Lanka, Belihuloya 70140, Sri Lanka
3
Faculty of Graduate Studies, Sabaragamuwa University of Sri Lanka, Belihuloya 70140, Sri Lanka
4
Department of Export Agriculture, Faculty of Agricultural Sciences, Sabaragamuwa University of Sri Lanka, Belihuloya 70140, Sri Lanka
5
Department of Engineering Technology, Faculty of Technology, Sabaragamuwa University of Sri Lanka, Belihuloya 70140, Sri Lanka
*
Author to whom correspondence should be addressed.
Biomass 2025, 5(3), 39; https://doi.org/10.3390/biomass5030039
Submission received: 12 April 2025 / Revised: 10 June 2025 / Accepted: 20 June 2025 / Published: 1 July 2025

Abstract

This study investigates biochar-enriched organic fertilizers made from bagasse, ash, spent wash, and cane tops, assessing their impact on corn growth over 45 days. A randomized complete block design with three replicates was used, testing six formulations with biochar levels at 0%, 10%, and 20%, along with soil-only and commercial fertilizer controls. Treatments T5 (bagasse + ash + spent wash + cane tops), T11 (T5 + 10% biochar), and T17 (T5 + 20% biochar) showed the best results for plant height, leaf development, and biomass production, with T17 performing the best for growth, biomass, and girth. The biochar in T17 had a pH of 9.37 ± 0.16, 18.00 ± 1.25% ash content, and a surface area of 144.58 m2/g. Nutrient analysis of the compost showed 2.85% potassium, 1.12% phosphorus, 1.85% nitrogen, 4.1% calcium, 0.23% magnesium, and 130 mg/kg zinc. The elemental composition was 68.50% carbon, 4.50% hydrogen, 6.00% nitrogen, and 25.30% oxygen, with 85.00% total organic carbon (TOC). This study concludes that T17 is the most effective formulation, offering both environmental and financial benefits, with composting potentially generating $11.16 million in profit, compared to the $19.32 million spent annually on waste management in Sri Lanka’s sugar industry.

1. Introduction

Sri Lanka’s major sugar factories, Pelwatta, Sevanagala, Galoya, and Ethimale, have long been central to the country’s sugar industry, reducing dependence on imported sugar [1]. Pelwatta, Sevanagala, and Ethimale, located in the Monaragala district, employ modern production methods and foster local economic development by purchasing sugarcane from nearby farmers. Galoya, situated in the Ampara district, is Sri Lanka’s first large-scale sugar factory. Pelwatta and Galoya are the largest facilities, primarily producing sugar, with electricity and ethanol as valuable by-products.
The sugarcane varieties used in Sri Lanka’s production include CO775, SL121, SL330S, and SL925588, with CO775 yielding the highest sugar content. However, the industry faces several challenges, such as inefficiency, outdated machinery, and fluctuating yields resulting from inconsistent rainfall and poor soil management. Despite these obstacles, the factories have made significant improvements in management and technological practices, enabling continued operations and growth.
The sugar industry generates a variety of waste products, including bagasse from mills, spent wash from distilleries, boiler ash from boilers [2], press mud from processing houses, and cane tops from cultivation. Managing these diverse by-products presents significant challenges, as they are difficult to dispose of properly, often resulting in environmental pollution and high treatment costs [3]. Addressing these issues requires advanced technology and infrastructure to implement efficient waste management strategies, such as bioenergy generation and composting. Notably, these waste materials hold considerable potential for the production of bio-based energy and electricity [4,5].
Proper waste management plays a vital role in the sustainable development of a country by protecting the environment, conserving natural resources, and enhancing public health [6,7]. In contrast, improper waste disposal can lead to serious environmental consequences, such as air, water, and soil pollution, which in turn harm ecosystems and human well-being. Environmentally friendly approaches, including recycling, composting, and waste-to-energy technologies, are essential for effective waste collection, recycling, and disposal. Such methods are crucial not only to reduce landfill accumulation, but also to limit the overuse of natural resources and mitigate greenhouse gas emissions.
Biochar is a carbon-rich material produced through pyrolysis of organic biomass, such as agricultural waste or wood, under low-oxygen conditions. The pyrolysis process can be classified into three main types: slow pyrolysis, fast pyrolysis, and flash pyrolysis [8]. Biochar has a wide range of applications, most notably in agriculture, where it improves soil fertility, structure, and water retention. It provides essential nutrients for plant growth and, when combined with compost, stabilizes nutrients, reduces leaching, and prolongs nutrient availability [9]. Additionally, biochar enhances soil fertility and crop yields while decreasing the need for chemical fertilizers. It also contributes to greenhouse gas reduction by increasing soil organic carbon and promoting carbon sequestration—key components of sustainable agriculture and healthy soil ecosystems [10].
Organic compost is a natural fertilizer derived from decomposed plant and animal matter through microbial activity in the presence of oxygen, heat, and moisture. This process enhances soil structure, water retention, and fertility [11]. Widely used in agriculture and gardening, organic compost supports soil health and plant growth, offering an eco-friendly alternative that aligns with sustainable development goals [12]. Compost made from natural sources supplies essential nutrients such as nitrogen, phosphorus, and potassium, while also improving soil structure and its ability to retain moisture and nutrients—benefits not offered by synthetic fertilizers.
Biochar improves the nutrient retention of compost, promotes microbial activity, and enhances the carbon content of the final product [13]. These effects contribute to improved soil quality, reduced reliance on chemical fertilizers, and increased crop resilience under environmental stresses, such as water scarcity [14]. Furthermore, biochar helps stabilize soil pH, thereby fostering more favorable growing conditions [15].
Sugarcane factories produce substantial amounts of waste daily, and improper disposal can result in severe ecological damage. However, through effective composting, this waste can be transformed into valuable organic matter, improving waste management while preventing environmental pollution [16]. Composting sugar industry by-products—such as bagasse, spent wash, boiler ash, and cane tops—offers a promising solution for both sustainable agriculture and environmental management [17].
Converting organic waste into compost represents a viable strategy for the sugar industry. It can generate additional revenue while reducing dependence on chemical fertilizers. Currently, some compost is produced by combining filter mud with other waste materials in sugar factories. However, a significant amount of bagasse is discarded, especially in facilities like Pelwatta and Galoya, where no effective solution for its reuse has been implemented. There is strong potential to incorporate bagasse into compost production. Moreover, integrating boiler ash and spent wash with bagasse could yield an even richer compost [18]. The addition of nutrient-dense cane tops—often left unused in fields—can further improve compost quality. Producing biochar from bagasse and blending it with compost can result in a highly effective, nutrient-rich organic fertilizer.
Bagasse, being fibrous, improves soil aeration, structure, and water retention when composted, thereby minimizing the risk of groundwater contamination through adsorption of substances such as heavy metals, pesticides, and organic contaminants. [19]. Boiler ash contributes micronutrients that enhance soil fertility. While spent wash is a potentially harmful liquid waste from distilleries, it contains many beneficial micronutrients. Sugarcane tops, though slow to decompose, encourage microbial activity and contribute to organic matter when composted.
Organic fertilizer manufacturing using waste from the sugar industry offers a sustainable waste management approach that significantly reduces environmental pollution and decreases reliance on chemical fertilizers. By converting materials like bagasse, spent wash, boiler ash, and cane tops into nutrient-rich compost, this process improves soil fertility through increased organic content, microbial activity, and nutrient availability. Continued application enhances soil structure, water retention, and long-term agricultural sustainability. Despite the vast volumes of organic waste produced by Sri Lanka’s sugar industry, much of it remains underutilized or improperly disposed of, leading to environmental and soil degradation. Meanwhile, Sri Lanka faces fertilizer shortages and declining soil health, highlighting the urgent need for cost-effective, organic alternatives. This study aims to evaluate the potential of biochar-enriched compost derived from sugar industry by-products as a solution to these challenges. By scientifically assessing the nutrient composition and effectiveness of these organic fertilizers, this research supports the advancement of eco-friendly, high-quality compost and promotes long-term agricultural sustainability.

2. Methodology

2.1. Composting Process

The composting trial evaluated six organic material combinations (T1–T6, Table 1) for organic fertilizer production through aerobic decomposition of bagasse, spent wash, boiler ash, and cane tops under controlled conditions. Composting was conducted in single batches due to practical constraints. Standardized 1 m3 pits were used per formulation with adequate aeration and drainage, where treatment materials were homogenized and layered for uniform decomposition. Throughout the eight-week process, moisture was maintained at 50–60% through periodic watering, while piles were manually turned every 5–7 days to optimize microbial activity. Moisture content was determined using gravimetric analysis with a Humimeter G110 moisture analyzer (Schaller, model G110). The device heats samples in a halogen chamber and measures the weight loss to calculate moisture content. It offers high precision (0.005 g) and a weighing range of 110 g. Measurements were performed at 105 °C and repeated in triplicate for accuracy.
Key parameters, including temperature (measured daily via probe thermometer, with optimal decomposition occurring at 45–55 °C) and pH (monitored weekly), were observed to assess progression. Compost maturity was assessed using a combination of physical, chemical, and biological indicators. The C/N ratio was 15:1, and the pH ranged from 6.5 to 8.0, which are both within the typical range for mature compost. The compost also exhibited a neutral, earthy odor, indicating stability, and a seed germination test showed over 80% germination, confirming biological maturity. These combined factors demonstrated that the compost was mature, stable, and suitable for agricultural use.

2.2. Biochar Preparation and Analysis

Biochar production from paddy husks includes pyrolysis, a thermochemical reaction that takes place under oxygen-deficient conditions. In a laboratory-scale pyrolysis reactor, paddy husks (paddy processing waste) are carbonized at a temperature of 430 °C with a residence time of 40 min. Controlled pyrolysis of organic matter results in biochar, bio-oil, and syngas [20]. The measured physical and chemical properties, instruments, and procedures are shown in Table 1.
Table 1. Measurement of the physical and chemical properties of biochar.
PropertyMeasurement Method
Particle SizeSieve Analysis
Bulk DensityMass/Volume Calculation
PorosityArchimedes Principle
pH1:1 Biochar-to-Water Ratio
Cation Exchange Capacity (CEC)Ammonium Acetate Method
Total Organic Carbon (TOC)Walkley–Black Method
Ash ContentLoss on Ignition
Elemental CompositionEA3100-Series CHNSP-O analyzer (Manufactured by EuroVector Srl in Pavia, Italy) ASTM E1757 [21]
Specific Surface AreaBrunauer–Emmett–Teller (BET) Method
BelSorp Max Analyzer (Manufactured by Bel Japan Inc., Osaka, Japan) ASTM D3663-20 [22]

2.3. Formulation of Organic Fertilizer

  • Biochar-Enriched Compost Preparation:
Three biochar proportions (0%, 10%, and 20% by weight) were blended with six distinct compost mixtures. The resulting biochar–compost blends were homogenized with topsoil (collected from a single field station) at a 1:1 ratio (w/w) to prepare the cultivation media.
  • Experimental Setup:
Growing Medium: Uniform polybags (30 cm height × 15 cm diameter, black polythene) were filled with 50% topsoil and 50% biochar-enriched compost (T7–T18, Table 1).
Replicates and Planting: Twenty treatment compositions (including controls) were prepared, each with three replicates. One commercially sourced maize seed (Jet 999 (NK 7328) by Syngenta) was sown per polybag under standardized conditions. A summary of the treatment compositions is provided in Table 2.

2.4. Greenhouse Experimental Study

The experiment was conducted in a greenhouse (Figure 1) located at the Faculty of Agricultural Sciences, Sabaragamuwa University of Sri Lanka, Belihuloya. The selected experimental design was Randomized Complete Block Design (RCBD). The plants were established as three blocks with respect to the three replicates. The distance between each pair of plants was 30 cm. The plants were grown with a humidity of 70.0% under controlled conditions in the greenhouse. The irrigation water supply was 100 mL per plant per day. Continuous monitoring of the greenhouse micro-climate was implemented, with hourly logging of temperature and relative humidity to minimize uncontrolled growth responses.

2.5. Plant Growth Study

The factors studied were height, girth, number of leaves, and dry matter content. For convenient data acquisition, some data were obtained every other day, and some data were obtained once every several days. The growth of maize plants was studied for a period of 45 days, which corresponds to early vegetative growth of maize [23].
  • Plant Height Measurement: Plant height was measured every 48 h throughout the 45-day study period using a precision graduated scale. Measurements were taken from the soil surface to the apical meristem (highest point of the crown), with an accuracy of ±0.5 mm. This frequent measurement interval was implemented to accurately capture the rapid vertical growth characteristic of maize (Zea mays L.) during early developmental stages. All measurements were conducted at a consistent daylight hour (08:00–10:00) to minimize diurnal variation effects [24].
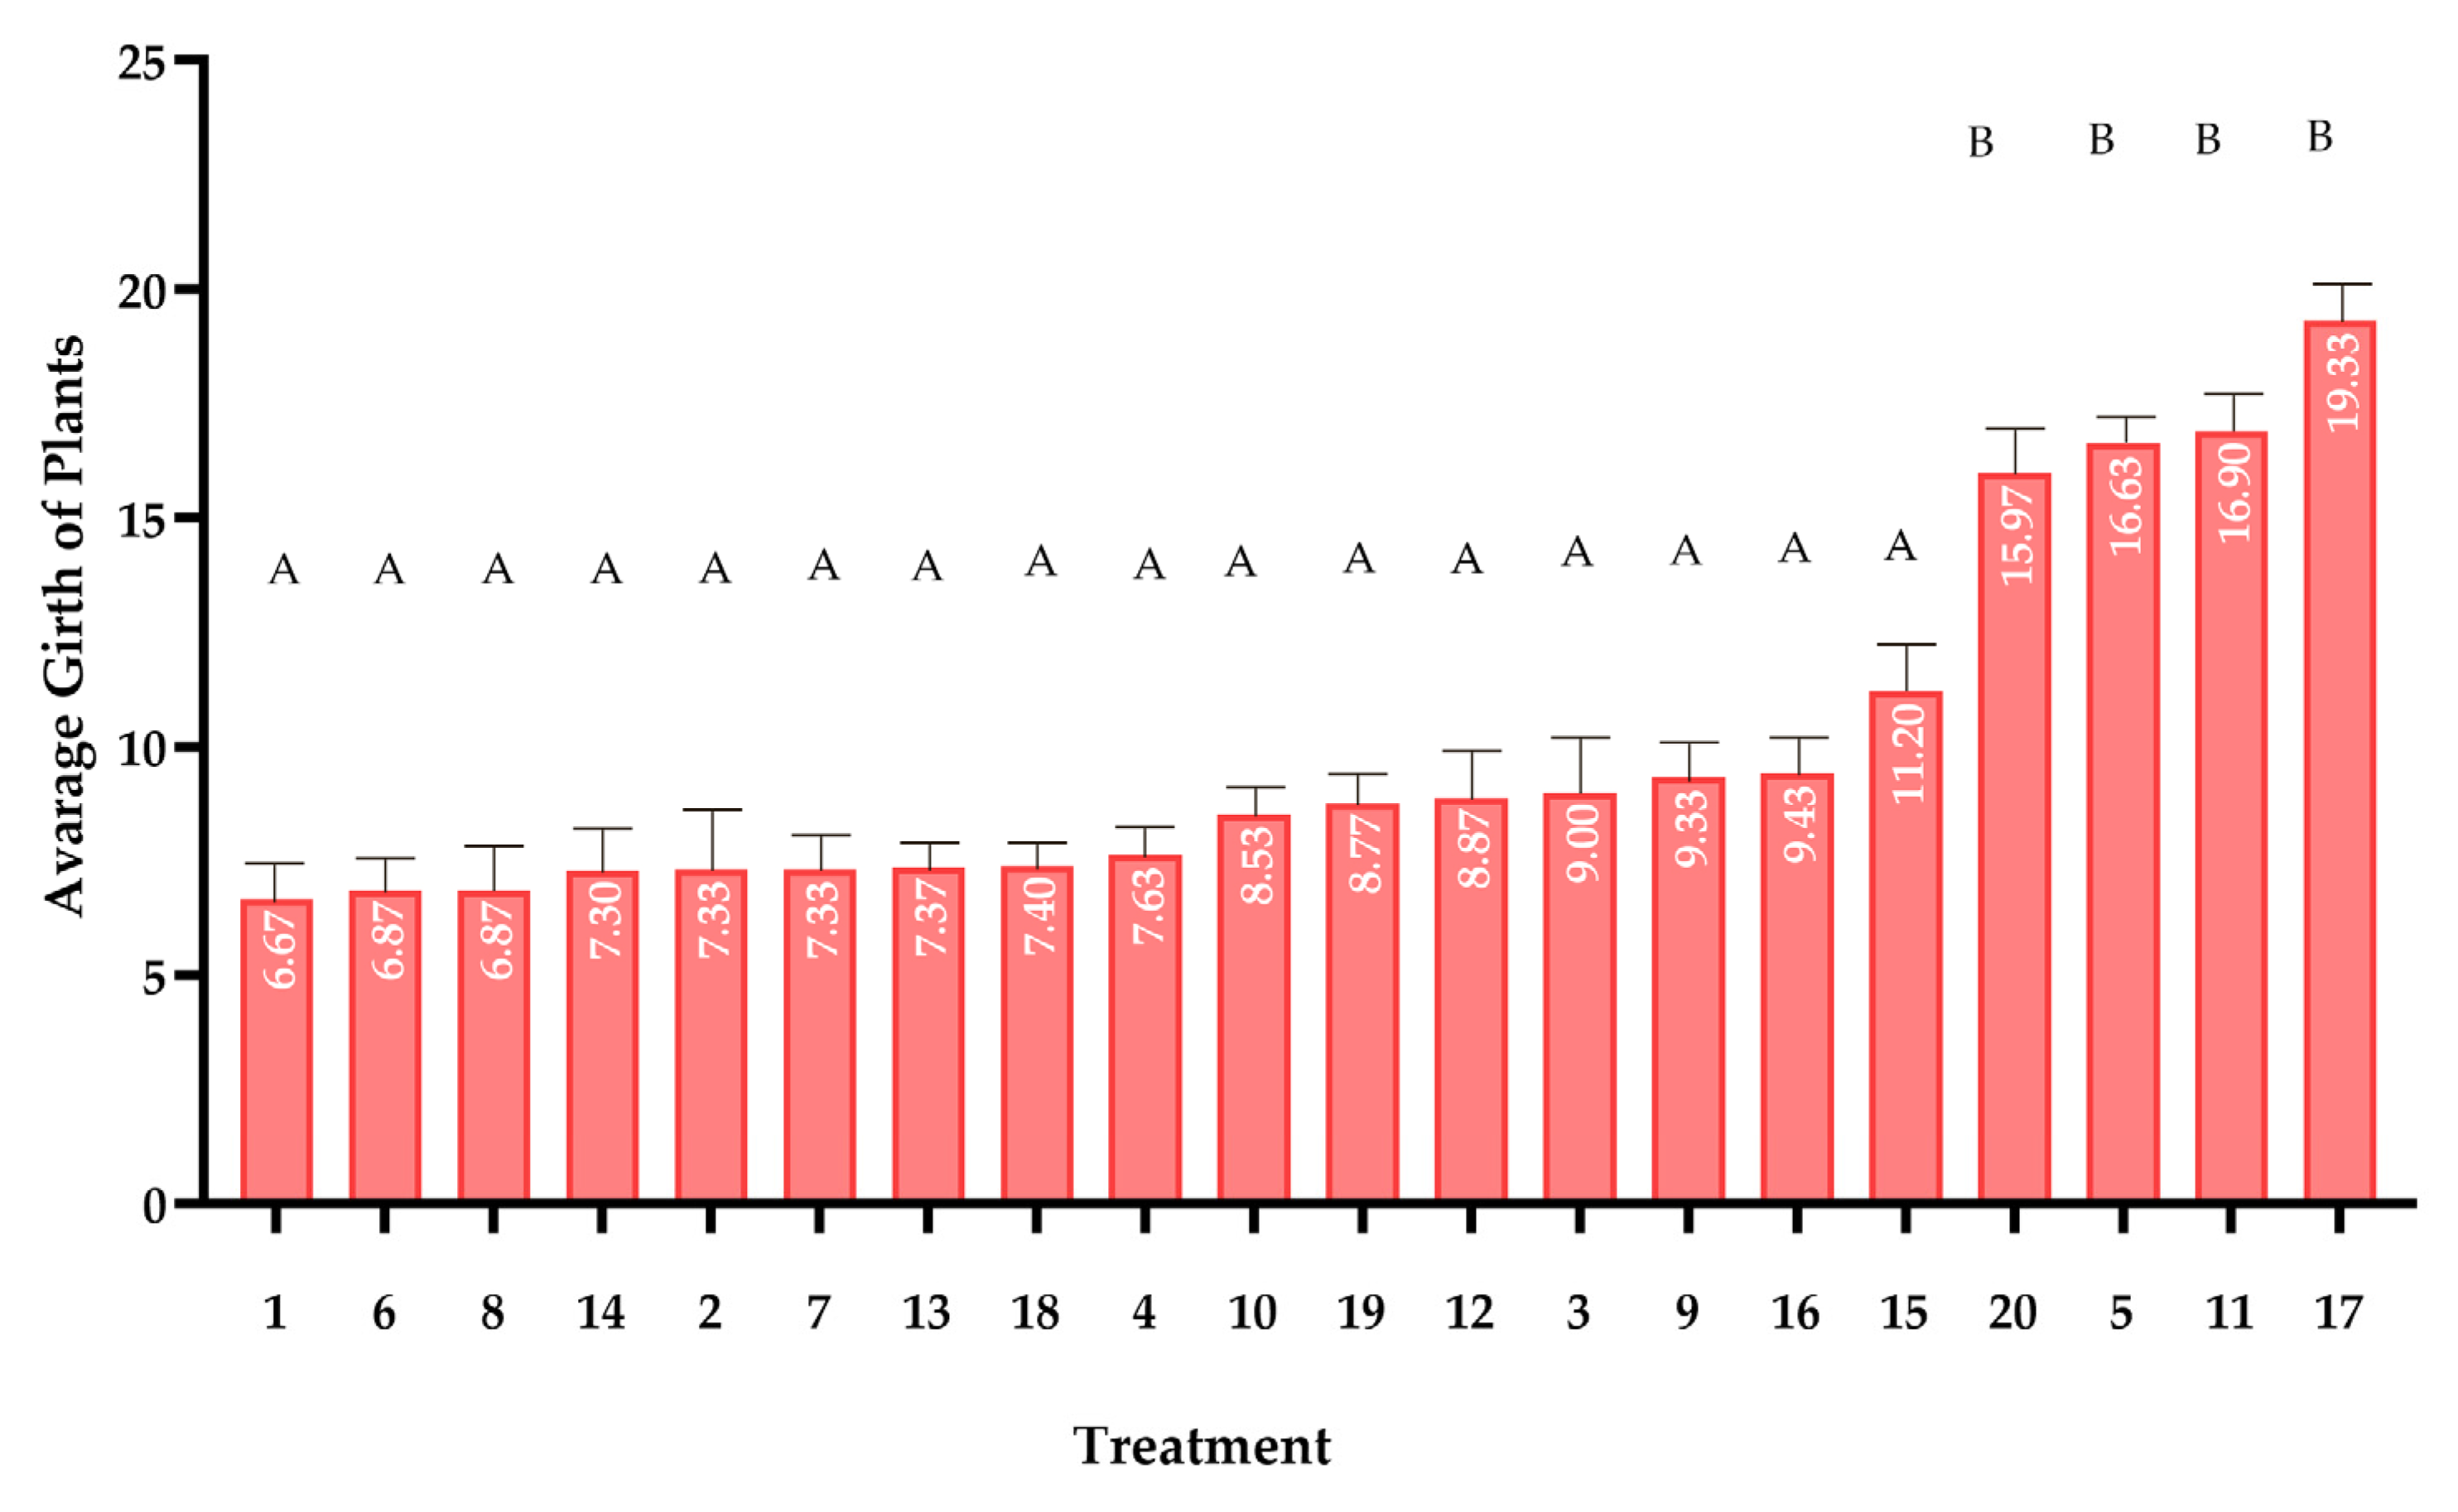
  • Stem Girth Measurement: Stem diameter growth was monitored at 4-day intervals using a digital caliper with 0.01 mm resolution. Circumference measurements were standardized at 2 cm above the soil surface, corresponding to the first visible node position in juvenile plants. The 4-day interval was empirically determined to be optimal for detecting significant diametric growth while minimizing measurement-induced stress. Each measurement was performed by gently wrapping a non-stretchable thread around the stem and subsequently measuring its length against a precision ruler [25].
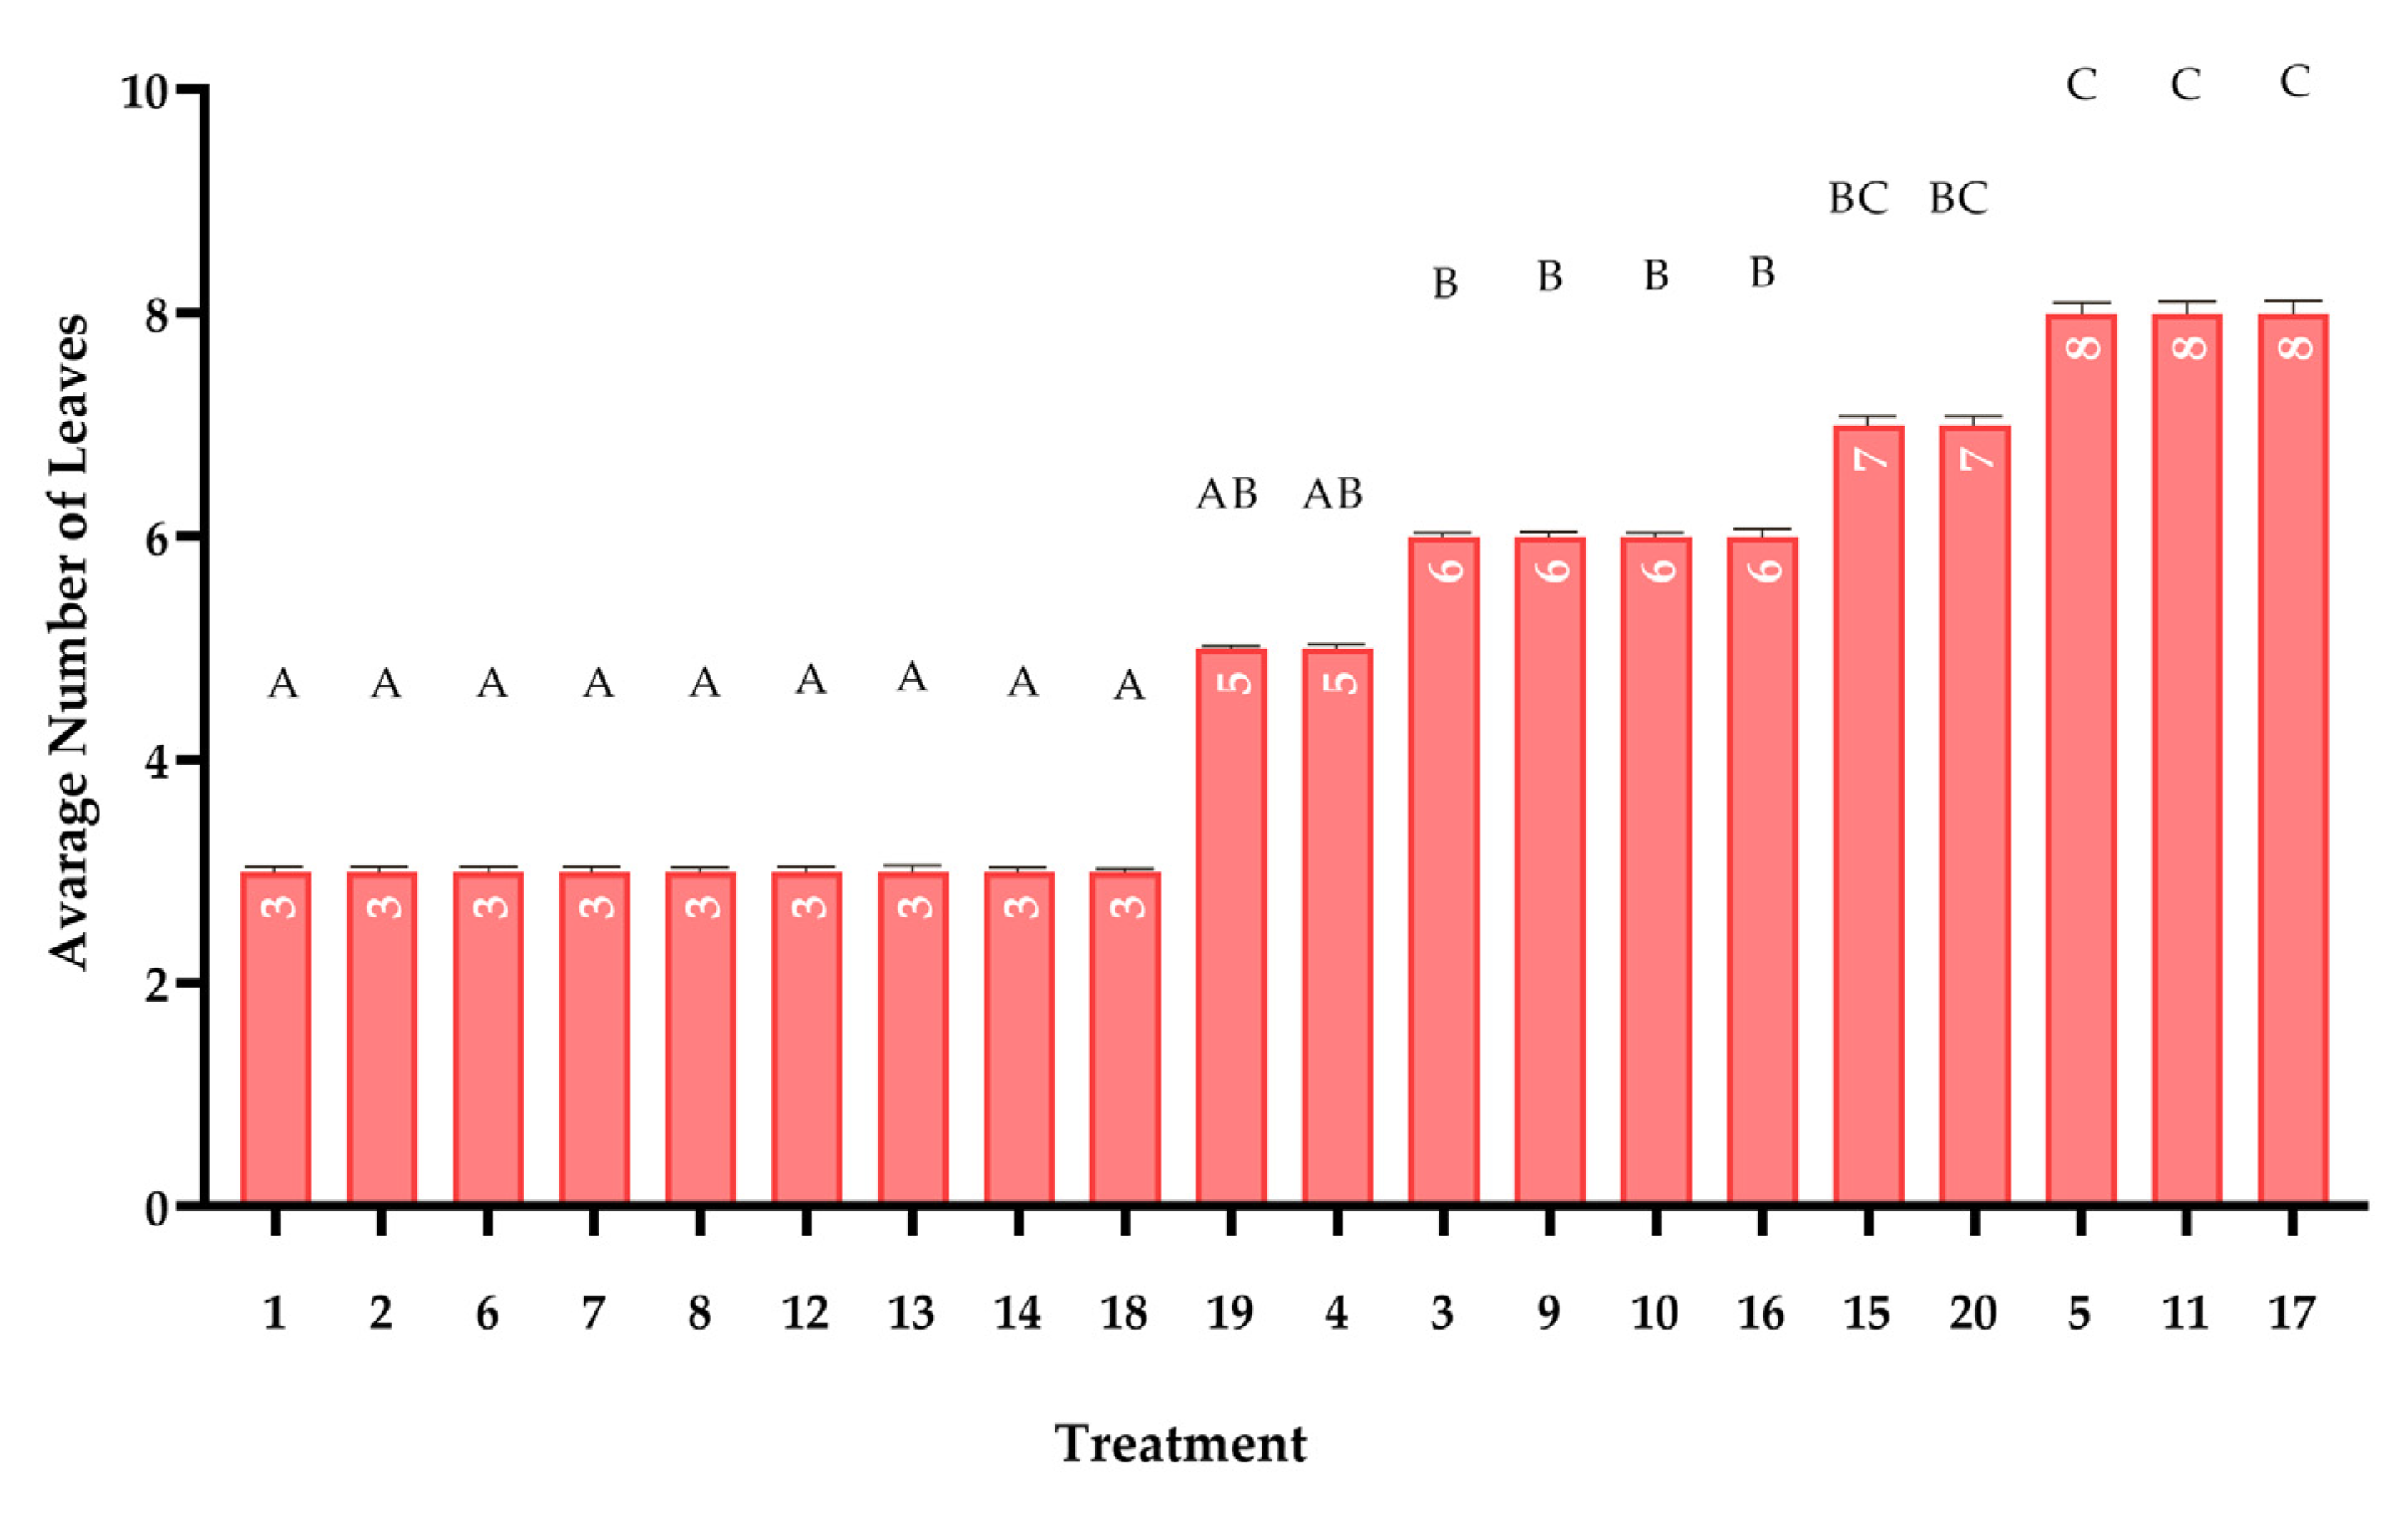
  • Leaf Count Assessment: Leaf emergence was recorded every 72 h following a standardized protocol specific to maize morphology. Only fully emerged leaves (those completely visible above the ligule of the preceding leaf) were counted, excluding any partially unfurled or senescing leaves. This conservative approach accounted for maize’s distinct leaf development pattern, where new leaves emerge from the whorl gradually. Counting was performed during morning hours when leaves were fully turgid and clearly distinguishable [26].
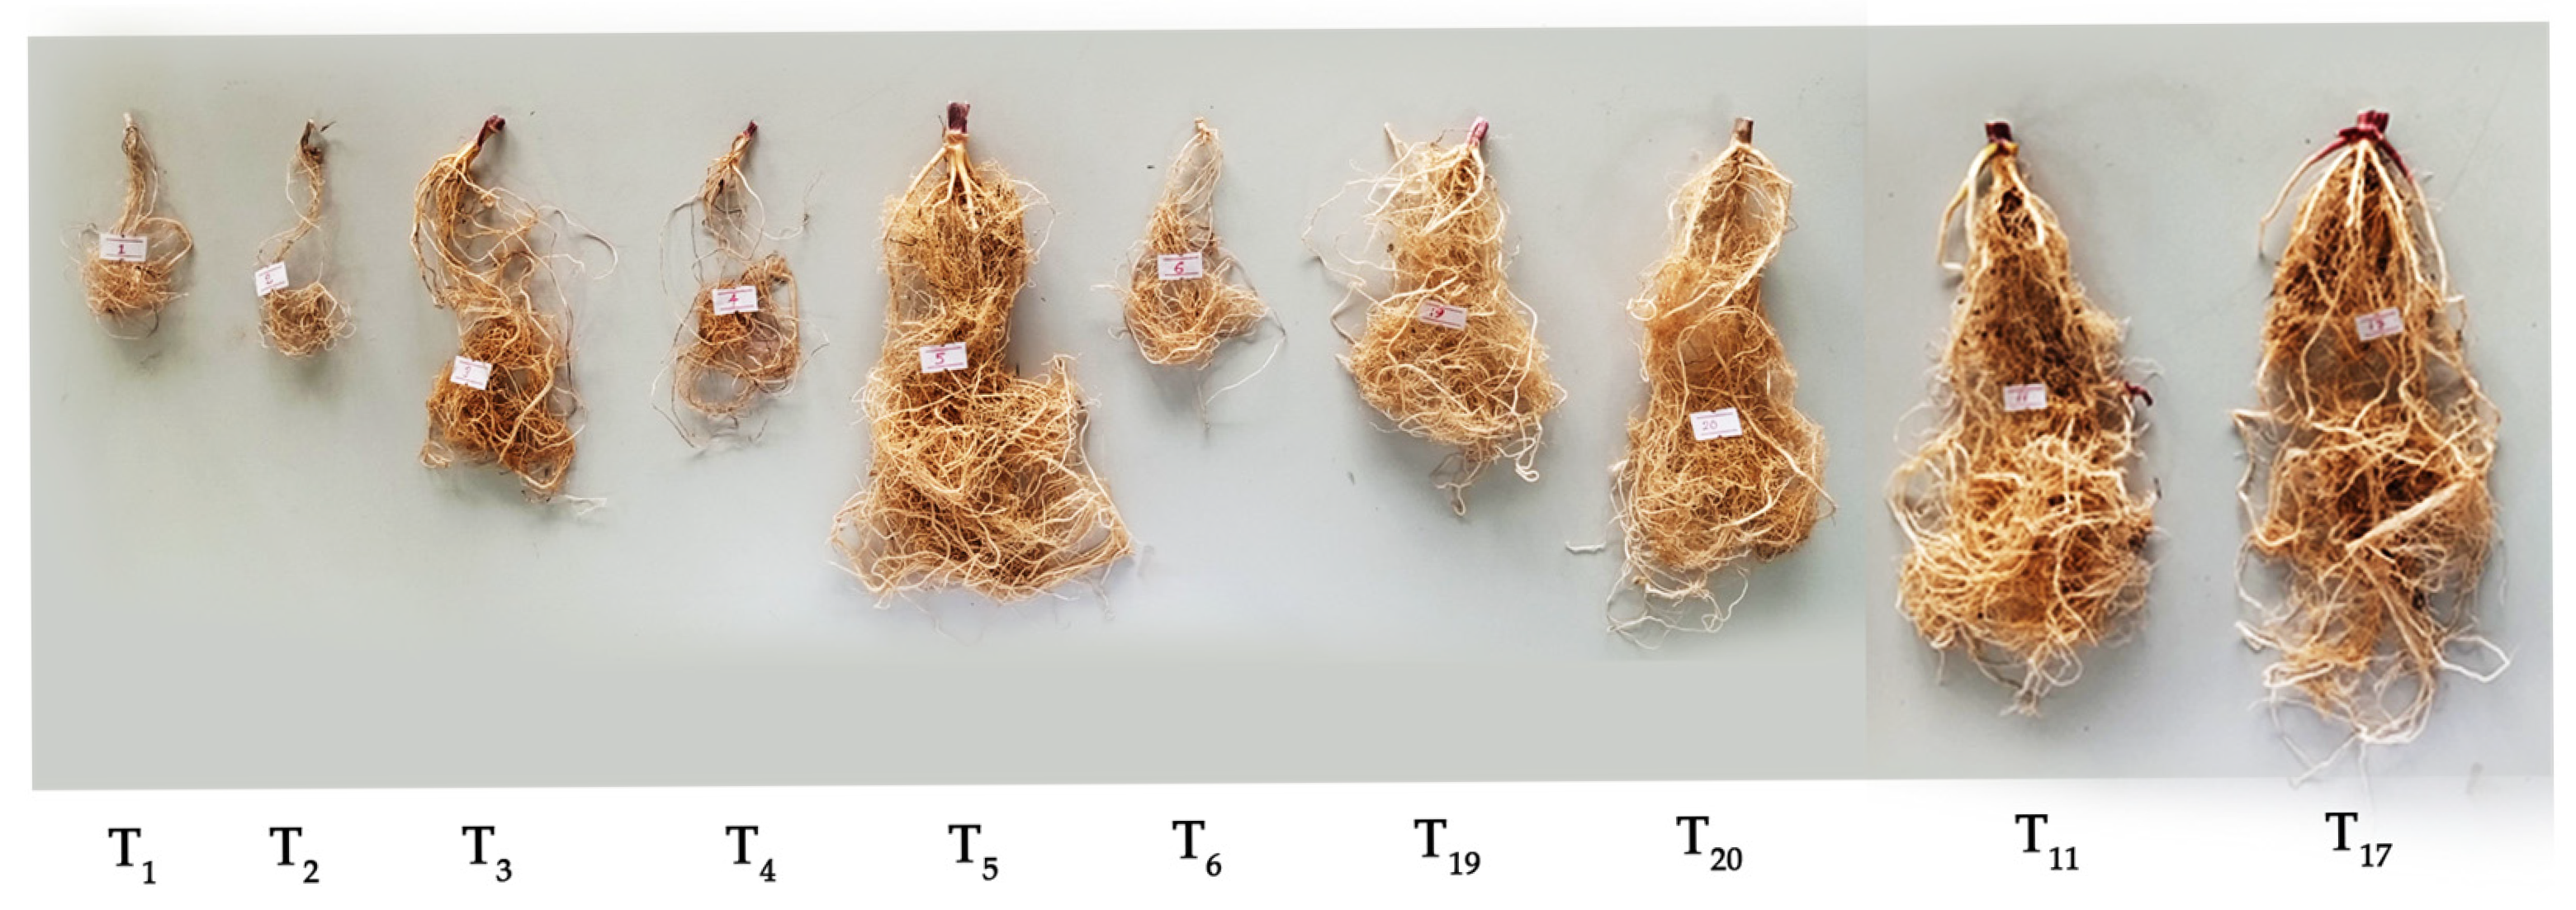
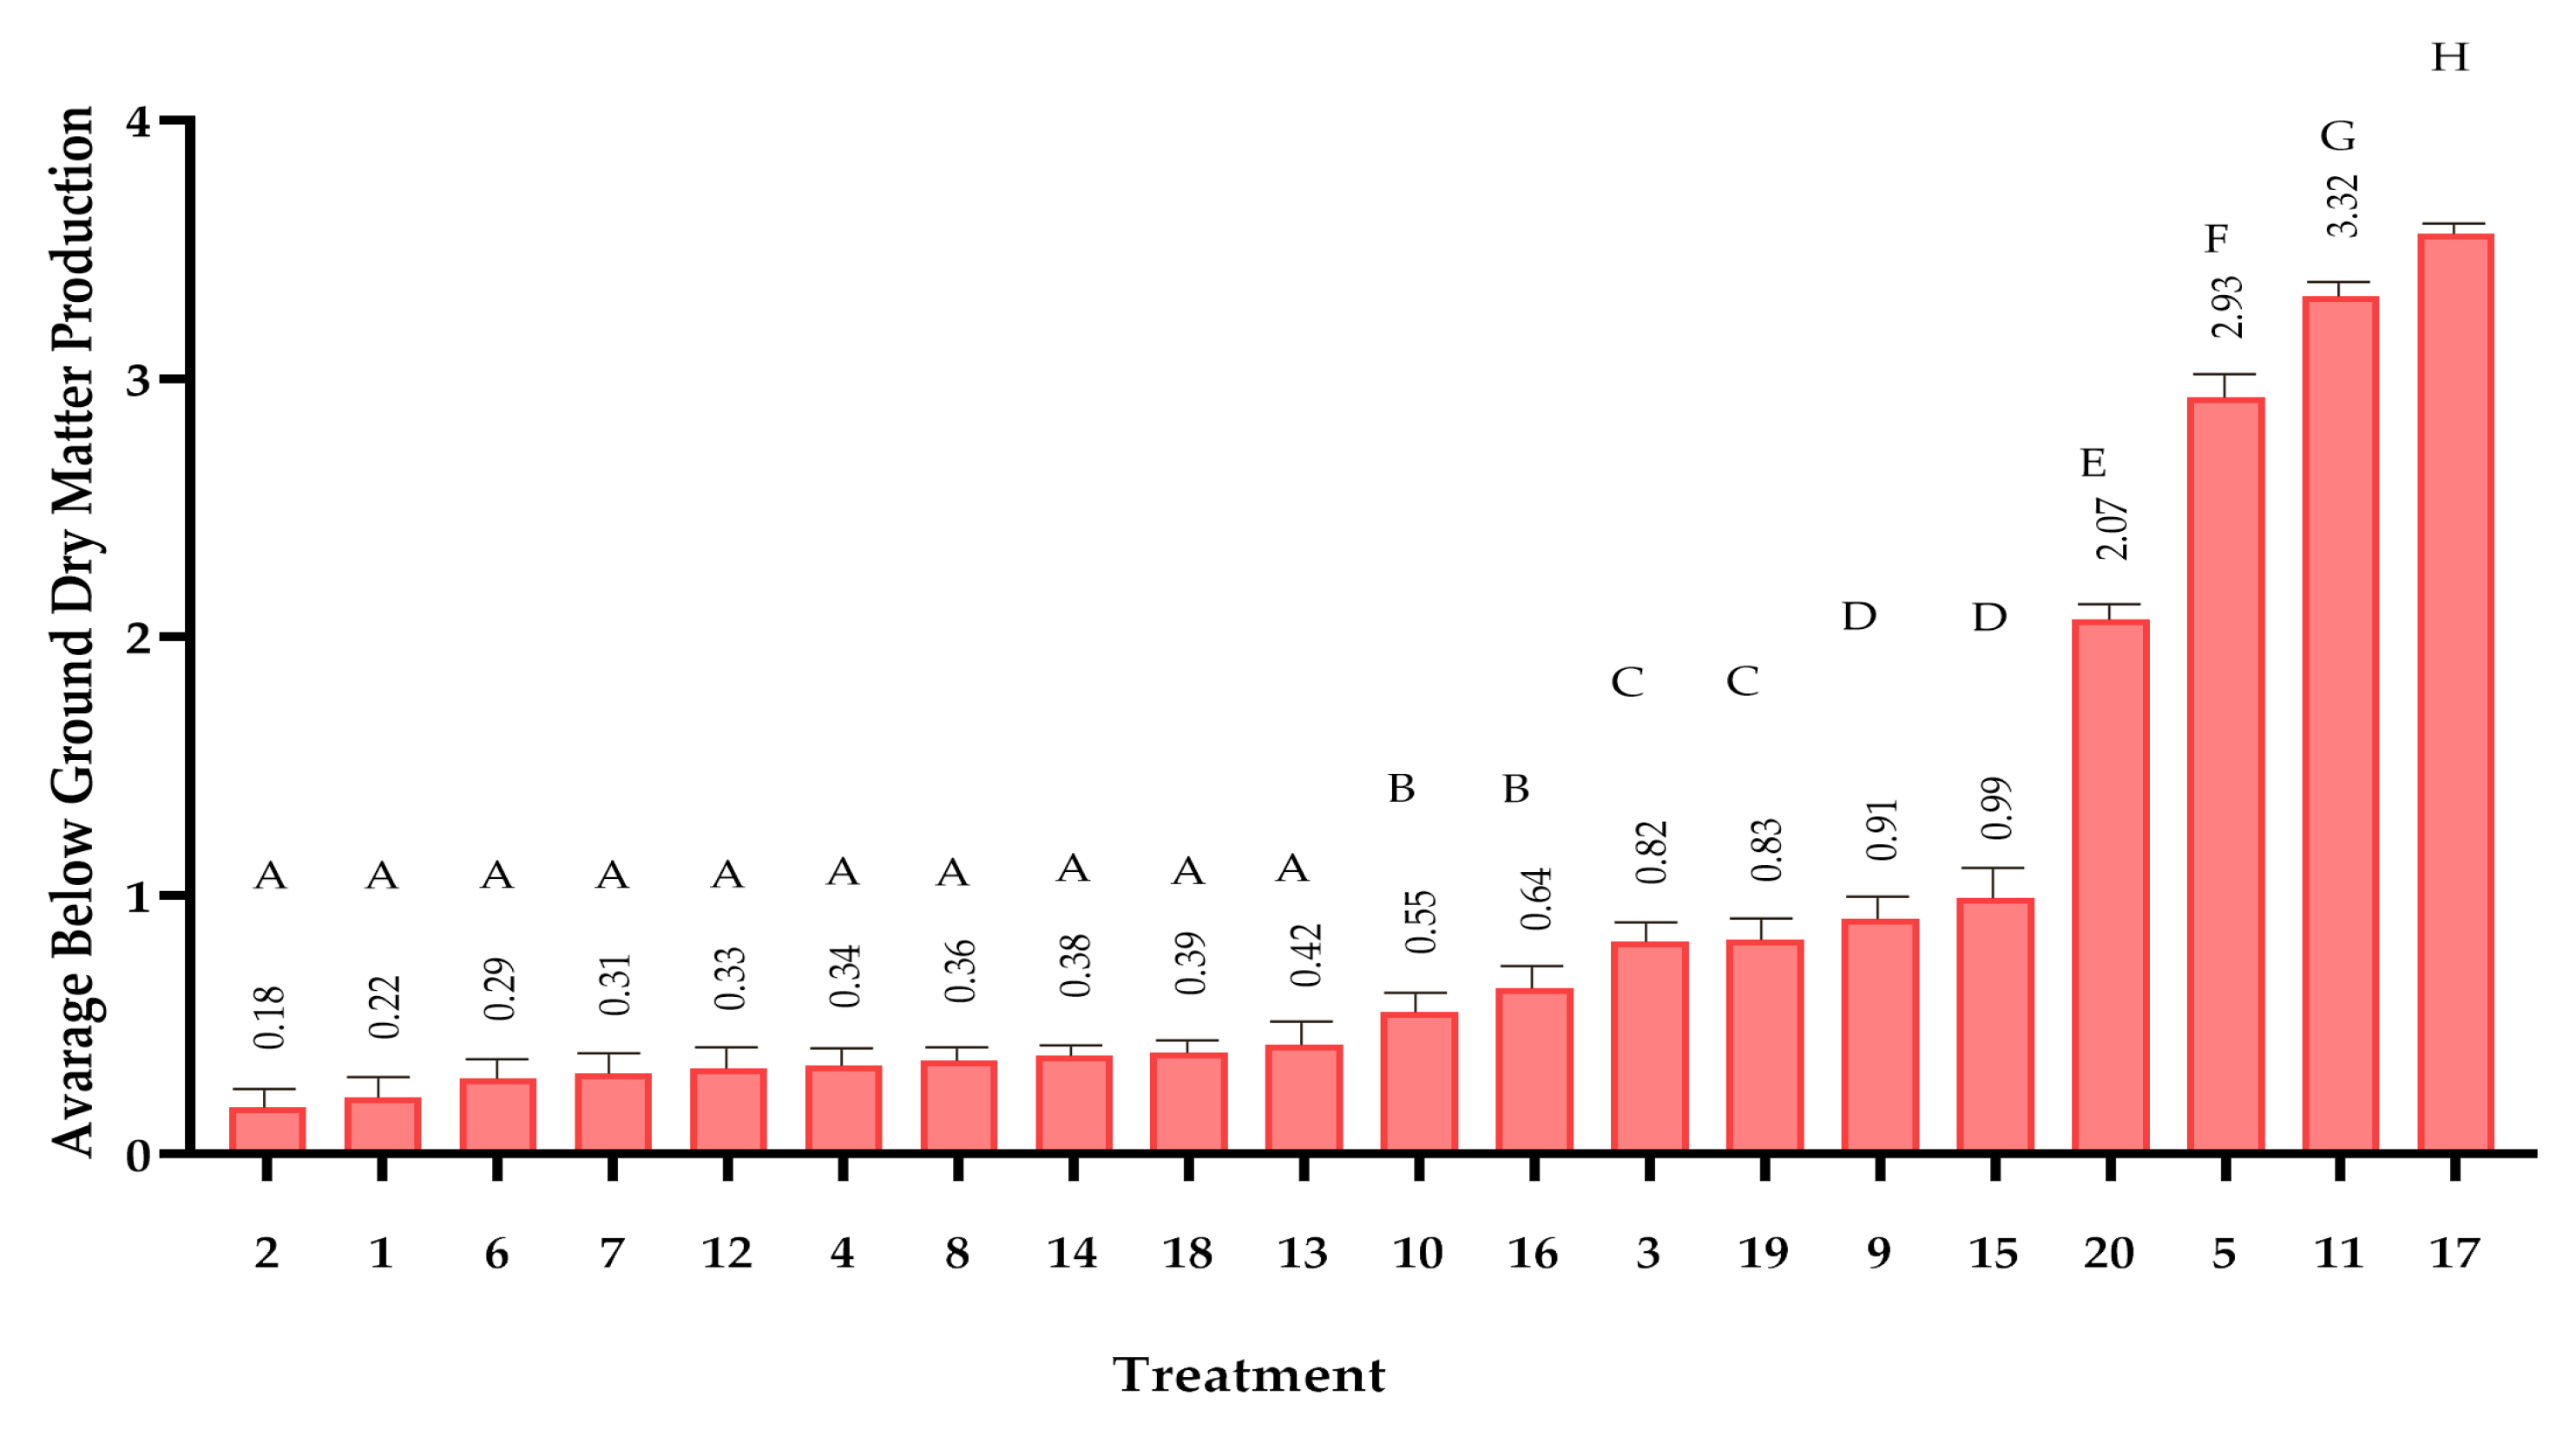
  • Dry Matter Determination: Destructive biomass sampling was conducted at study termination following a 6-hour oven-drying protocol at 105 °C (±2 °C). Entire plants were carefully excavated, with roots gently washed to remove soil particles. After separation into root and shoot components, samples were dried to constant mass (verified by consecutive weighing at 2-hour intervals). Dry weights were measured using an analytical balance (0.0001 g precision) in a temperature-controlled laboratory environment [27].

2.6. Statistical Analysis

In this study, the effects of 20 compost treatments on maize growth were analyzed using Repeated Measures ANOVA, with alpha (α) = 0.05 to determine statistical significance. The analysis considered multiple growth measurements taken overtime. To ensure the validity of the tests, Shapiro–Wilk test was used to check the normality of the data, and Levene’s test was used to assess the homogeneity of variance. If the assumptions were met, Tukey’s HSD test was conducted for pairwise comparisons to identify which compost treatments significantly differed from each other. All analyses were performed using R software (version 4.5.0), ensuring the results were both robust and reproducible.

2.7. Nutrient Composition Assessment

After evaluating maize plant growth, the compost mixture yielding the highest agricultural output was selected, and its nutrient composition was analyzed to assess its suitability for crop production. The analysis included quantification of macro and micronutrients—nitrogen (N), phosphorus (P), potassium (K), calcium (Ca), magnesium (Mg), manganese (Mn), iron (Fe), zinc (Zn), boron (B), and chlorine (Cl)—along with critical chemical properties such as pH, electrical conductivity (EC), and carbon-to-nitrogen (C/N) ratio. The analysis was performed by the Sugarcane Research Institute Main Research Center, Dakunu Ela Road, Uda Walawe (70190), Sri Lanka. To ensure precise results, various laboratory techniques and instruments were used, as mentioned in Table 3.
Soil testing was conducted to assess the nutrient and micronutrient levels before and after the addition of biochar. The soil samples were collected from the experimental field at a depth of 0–20 cm, which is the root zone for most crops. The pH of the soil was measured using a 1:1 soil-to-water ratio with a pH meter to determine the soil’s acidity or alkalinity. Cation exchange capacity (CEC), which indicates the soil’s ability to hold onto essential nutrients, was determined using the ammonium acetate method. Organic carbon content was estimated using the Walkley–Black method, which involves oxidation of organic matter in the soil. For nutrient analysis, the concentrations of nitrogen (N), phosphorus (P), potassium (K), sodium (Na), magnesium (Mg), calcium (Ca), and zinc (Zn) were quantified using Inductively Coupled Plasma (ICP) Spectrometry after digesting the soil samples with nitric acid. This method ensures precise and reliable measurement of nutrient levels in the soil. The data obtained from the pre- and post-biochar soil samples were compared to evaluate the impact of biochar addition on soil fertility.

2.8. Cost–Benefit Analysis of Traditional Waste Management vs. Composting

This study evaluates the economic feasibility of composting with biochar enrichment compared to traditional waste management in the Sri Lankan sugar industry. The methodology consists of data collection, cost analysis, revenue estimation, sensitivity analysis, and return-on-investment (ROI) calculation over a 5-year period. The cost comparison considers collection, transportation, processing, labor, storage, pollution control, and revenue generation.
The ROI analysis uses an 8% annual discount rate, reflecting the industry’s average cost of capital, to account for inflation and opportunity costs. The composting infrastructure’s salvage value is estimated at 10% of its initial cost by Year 5, based on industry-standard depreciation. Sensitivity analysis shows labor costs may vary by ±15%, due to wage changes and operational efficiencies, while compost prices could range from $46 to $108 per ton, reflecting market volatility and demand fluctuations [34].

3. Results and Discussion

3.1. Biochar Property Analysis

Table 4 summarizes the physical and chemical properties of biochar produced from coconut shells at 450 °C with a 1-hour residence time. These properties are crucial in evaluating its suitability for various environmental and agricultural applications, including soil amendment, carbon sequestration, and pollutant adsorption.
The biochar produced from coconut shells at 450 °C demonstrates favorable properties for both environmental and agricultural applications. With a particle size between 1.00 mm and 3.00 mm, it is effective for conditioning soil, enhancing aeration, and retaining water. The low bulk density (0.50 g/cm3) and high porosity (70%) improve water and nutrient retention in soils. Its slightly alkaline pH (9.37 ± 0.16) is beneficial for neutralizing acidic soils and promoting plant growth. A cation exchange capacity (CEC) of 25.00 cmol (+)/kg indicates good nutrient retention, supporting soil fertility.
The specific surface area (SSA) of 144.58 m2/g is suitable for adsorbing nutrients and contaminants and aligns with values seen in previous studies [35,36], making it ideal for water filtration and pollutant adsorption. The biochar is carbon-rich (68.50% C), making it effective for carbon sequestration, with low levels of nitrogen, sulfur, and phosphorus, ensuring it will not disrupt soil balance. The high total organic carbon (TOC) content (85.00%) indicates strong potential for long-term carbon storage, which aids in climate change mitigation.

3.2. Results of the Plant Growth Study

3.2.1. Normality and Variance Homogeneity

Normality and variance homogeneity were assessed prior to Analysis of Variance (ANOVA). Normality was evaluated using the Shapiro–Wilk test (α = 0.05), and variance homogeneity was assessed using Levene’s test (α = 0.05). All measurements in treatments met the assumption of normality (p > 0.05), and variance homogeneity was confirmed (p > 0.05).

3.2.2. Plant Height

One-way ANOVA was conducted to evaluate the effect of different treatments on plant height after 44 days, as shown in Table 5. The results indicated a significant difference among treatments (F (19, 40) = 19.514, p < 0.001), suggesting that at least one treatment resulted in significantly different plant heights. Figure 2 shows the differences in plant height after 44 days.
Tukey’s HSD post hoc test grouped treatments into four distinct categories, as indicated in Figure 3. The highest growth occurred in T11 and T17 (Group D), which differed significantly from all others (p < 0.001). Compared to the control treatment (T20), T11 shows 49.06% and T17 shows 61.18% more plant height.

3.2.3. Number of Leaves

One-way ANOVA showed that treatment had a significant effect on the number of leaves at 20 days (F (19, 40) = 14.505, p < 0.001) as presented in Table 6. The model explained 87.3% of the total variance in leaf count (η2 = 0.873), indicating a strong effect of treatment on leaf development.
Post hoc analysis using Tukey’s HSD test revealed significant differences between multiple treatment groups. Tukey’s HSD post hoc test showed significant differences in the number of leaves at 10 days across treatments (p < 0.05), as indicated in Figure 4. The lowest leaf counts were observed in T1, T2, T6, T7, T8, T12, T13, T14, and T18 (3.00 leaves, Group A). T19 (4.67 leaves) and T4 (5.00 leaves) were not significantly different from Group A, but also showed no significant difference from higher-growth treatments (Group B). T3, T9, T10, and T16 (6.00 leaves) were significantly different from Group A (p < 0.05) but not from T15 and T20 (7.00 leaves). The highest leaf count was observed in T5, T11, and T17 (8.00 leaves, Group C), which were significantly different from all treatments in Group A (p < 0.001).
Tukey’s HSD post hoc test grouped treatments into three distinct categories, as indicated in Figure 4. The highest number of leaves occurred in T5, T11, and T17 (Group C), which differed significantly from all others (p < 0.001). Compared to the control treatment (T20), T11 shows 6.63%, T5 shows 7.24%, and T17 shows 10.66% more leaves.

3.2.4. Plant Girth

One-way ANOVA revealed a significant effect of treatment on plant girth at 44 days (F (19, 40) = 13.378, p < 0.001) as presented in Table 7. The treatment factor explained 86.4% of the variation in plant girth (η2 = 0.864), indicating a strong treatment effect. This suggests that the differences in plant girth are largely attributable to treatment rather than random variation.
Post hoc comparisons using Tukey’s HSD test identified significant differences between multiple treatment groups. Tukey’s HSD post hoc test grouped treatments into two distinct categories, as indicated in Figure 5. The highest girth occurred in T20, T5, T11, and T17 (Group B), which differed significantly from all others (p < 0.001). Compared to the control treatment (T20), T11 shows 5.84%, T5 shows 4.17%, and T17 shows 21.08% increased girth.

3.2.5. Above-Ground Dry Matter (AGDM) Production

One-way ANOVA revealed a significant effect of treatment on AGDM at 44 days (F (19, 40) = 209.57, p < 0.001). The treatment factor explained 99.0% of the variation in AGDM (η2 = 0.990), indicating a strong treatment effect as presented in Table 8. This suggests that differences in AGDM accumulation are largely attributable to treatment rather than random variation.
Post hoc comparisons using Tukey’s HSD test identified significant differences between multiple treatment groups. Tukey’s HSD post hoc test grouped treatments into seven distinct categories, as indicated in Figure 6. The highest AGDM occurred in T20, T5, T11, and T17, which differed significantly from all others (p < 0.001). Compared to the control treatment (T20), T5 shows 71.61%, T11 shows 173.83%, and T17 shows 228.38% increased AGDM.

3.2.6. Below-Ground Dry Matter (BGDM) Production

Different growth statuses are shown in Figure 7. One-way ANOVA revealed a significant effect of treatment on BGDM (Fb (19, 40) = 131.249, p < 0.001). The treatment factor explained 98.4% of the variation in BGDM, indicating a strong treatment effect. This suggests that the differences in BGDM are largely attributable to treatment rather than random variation. The minimal error variance (mean square = 0.026) further supports the model’s effectiveness in explaining the data. These results suggest that treatment plays a substantial role in influencing BGDM, with the model fitting the data well (Table 9).
As observed in Figure 8, root biomass accumulation varied significantly among treatments. Treatments T11 and T17 exhibited the highest root dry matter, likely due to improved nutrient availability and soil conditions. In contrast, T1 and T2 showed minimal root growth, suggesting suboptimal soil conditions or nutrient deficiencies. Similar trends have been reported in studies on compost-based amendments improving root development [37].
Tukey’s HSD post hoc test grouped treatments into eight distinct categories, as indicated in Figure 8. The highest AGDM occurred in Treatments 20, 5, 11, and 17, which differed significantly from all others (p < 0.001). Compared to the control treatment (T20), T5 shows 41.54%, T11 shows 60.38%, and T17 shows 71.98% increased BGDM.

3.3. Nutrient Composition of Organic Fertilizers

Table 10 presents the nutrient composition of selected organic fertilizers, including N, P, K, Na, Mg, Ca, and Zn.
Sugarcane bagasse (T17) demonstrates significant potential as a sustainable organic fertilizer, with its nutrient profile meeting modern agricultural demands. The 1.85% N content provides ~185 mg N plant−1, aligning with improved nitrogen use efficiency strategies for cereals [45]. While sufficient for leafy greens, maize production may require supplemental N to achieve optimal yields [46]. The 1.12% P delivers ~112 mg P plant−1, which is adequate for most crops but potentially needs enhancement for legumes through microbial inoculants [47]. With 2.85% K supplying ~285 mg K plant−1, T17 supports root crops but may require potassium supplementation for high-demand fruits [48]. The fertilizer’s 130 mg kg−1 Zn content (~1.3 mg plant−1) contributes to cereal nutrition while avoiding toxicity risks [49]. Notably, its low Na content (0.20%) makes it particularly valuable for salt-sensitive horticultural crops in the context of increasing soil salinity challenges [50]. The slow-release characteristics of T17, combined with its balanced micronutrient profile, position it as an effective component of circular agricultural systems, particularly when integrated with precision nutrient management approaches [48].

3.4. Nutrient and Chemical Properties Before and After the Addition of T17 to Soil

Table 11 presents the nutrient and micronutrient levels before and after the addition of T17 to the soil. The results reflect the general improvements in nutrient content that biochar can provide for tropical soils, particularly in terms of increasing the availability of key macronutrients (N, P, K) and micronutrients (Zn). These findings are consistent with recent literature on biochar’s positive effects on soil fertility.
The addition of sugarcane bagasse (T17) to the soil resulted in significant improvements in nutrient content, pH, and nutrient retention. Nitrogen levels increased from 0.18% to 0.22%, phosphorus from 0.08% to 0.12%, and potassium from 0.18% to 0.25%, all of which contribute to better plant growth and development. Magnesium, calcium, and zinc levels also increased, enhancing soil fertility and nutrient availability [51]. The soil pH rose from 5.2 to 6.0, indicating a liming effect that made key nutrients like phosphorus, calcium, and magnesium more accessible to plants [52]. Moreover, the Cation Exchange Capacity (CEC) improved from 15.0 cmol/kg to 18.7 cmol/kg, suggesting better nutrient retention and reduced nutrient leaching [53].
These improvements demonstrate that T17 can enhance soil fertility by increasing nutrient availability and improving the soil’s ability to retain essential nutrients. The rise in pH and CEC also indicates that biochar plays a role in promoting healthier soil conditions, which can support sustainable agricultural practices. By improving the soil’s nutrient cycling, T17 reduces the dependency on synthetic fertilizers, making it a promising tool for enhancing soil health and promoting more environmentally friendly farming practices.

3.5. Cost Comparison of Traditional Waste Management vs. Composting

The economic analysis reveals a significant financial advantage in adopting composting over traditional waste management. Table 12 presents the exact cost breakdown for both approaches.
The return-on-investment (ROI) breakdown confirms that composting with biochar enrichment is a financially viable and sustainable alternative to traditional waste management in the sugar industry. The analysis shows that compost price fluctuations have the most significant impact on profitability, with net profits ranging from $2.67 M to $18.62 M per year under current market conditions. In an optimistic scenario, where compost prices rise to $108 per MT and operational efficiencies improve, profits reach $25.5 M annually. Conversely, a pessimistic scenario, with compost prices dropping to $46 per MT and labor costs increasing, could reduce profits to $8.9 M or even lead to slight losses. However, investing in mechanized composting to reduce labor costs by 15% and improve efficiency by 20% could increase profitability by $3 M per year. The ROI analysis over a 5-year period demonstrates that composting reaches its break-even point within the first two years, with cumulative profits ranging from $15.5 M to $105.5 M by Year 5. With an ROI of 77.5% to 527.5%, composting emerges as a high-return investment, particularly when market demand and operational efficiencies are optimized. Given these findings, composting not only reduces environmental harm and waste disposal costs, but also offers significant financial gains, making it a strategic long-term investment for the sugar industry.

4. Conclusions

This study highlights the efficacy of biochar-enriched compost (T17), composed of 40% bagasse, 20% spent wash, 10% boiler ash, 10% cane tops, and 20% biochar, in enhancing corn biomass production. T17 achieved a 35% increase in dry matter yield compared to conventional treatments. The biochar used in T17 exhibited a pH of 9.37 ± 0.16, an ash content of 18.00 ± 1.25%, and a surface area of 144.58 m2/g, making it highly effective for nutrient adsorption and soil fertility improvement. The elemental composition showed 68.50% carbon and 85.00% total organic carbon (TOC), indicating biochar’s potential for long-term carbon sequestration. Nutrient analysis of the compost revealed 2.85% potassium, 1.12% phosphorus, and 1.85% nitrogen, enhancing soil nutrient availability. Additionally, the biochar-enriched compost improved soil pH (from 5.2 to 6.0) and Cation Exchange Capacity (CEC) (from 15.0 cmol/kg to 18.7 cmol/kg), further enhancing nutrient retention. This study demonstrates the economic potential of utilizing sugar industry residues, turning a $19.32 million annual waste management cost into an estimated $11.16 million in revenue. While promising results were observed in greenhouse trials, further field validation and long-term monitoring are necessary to assess scalability. This study lays the foundation for sustainable nutrient recycling in the sugarcane-based agro-industry, highlighting the potential of biochar-enriched compost for improving soil health, agricultural productivity, and waste management in a circular economy.

Author Contributions

Conceptualization, methodology, and formal analysis, H.N. and J.B.; supervision, H.N., A.A. and K.K.; writing–original draft preparation, and validation, H.N. and I.W.; writing–review and editing, H.N., I.W., A.A. and K.K. All authors have read and agreed to the published version of the manuscript.

Funding

This research was supported by the Science and Technology Human Resource Development (STHRD) Project, Ministry of Education, Sri Lanka, funded by the Asian Development Bank (ADB) through Grant No. CRG/R3/SB6.

Institutional Review Board Statement

Not applicable.

Informed Consent Statement

Not applicable.

Data Availability Statement

The original contributions presented in the study are included in the article; further inquiries can be directed to the corresponding author.

Conflicts of Interest

The authors declare no conflicts of interest. The funders had no role in the design of the study.

Abbreviations

The following abbreviations are used in this manuscript:
AASAtomic Absorption Spectrophotometer
AGDMAbove-Ground Dry Matter
ANOVAAnalysis of Variance
ASTMAmerican Society for Testing and Materials
BBoron
BGDMBelow-Ground Dry Matter
C/N RatioCarbon-to-Nitrogen Ratio
CaCalcium
ClChlorine
CECCation Exchange Capacity
ECElectrical Conductivity
FeIron
H2SO4Sulfuric Acid
HSDHonestly Significant Difference (Tukey’s Test)
KPotassium
MgMagnesium
MnManganese
NNitrogen
NaSodium
NaOHSodium Hydroxide
PPhosphorus
RCBDRandomized Complete Block Design
SSSum of Squares (in ANOVA)
T1–T20Different Treatment Compositions in the Study
UVUltraviolet
UVSUltraviolet Spectrophotometer
ZnZinc

References

  1. Keerthipala, A.P. Development of Sugar Industry in Sri Lanka. Sugar Tech 2016, 18, 612–626. [Google Scholar] [CrossRef]
  2. Adnan, M.; Kumar, S.; Garg, N.; Kumar Gupta, K.; Kumar Das, S. Soil Stabilization Using Waste “Bagasse Ash and Lime”: A Review. Mater. Today Proc. 2023, 122, S221478532302641X. [Google Scholar] [CrossRef]
  3. Ungureanu, N.; Vlăduț, V.; Biriș, S.-Ș. Sustainable Valorization of Waste and By-Products from Sugarcane Processing. Sustainability 2022, 14, 11089. [Google Scholar] [CrossRef]
  4. Rojas Flores, S.; Nazario-Naveda, R.; Betines, S.M.; De La Cruz–Noriega, M.; Cabanillas-Chirinos, L.; Valdiviezo-Dominguez, F. Sugar Industry Waste for Bioelectricity Generation. Environ. Res. Eng. Manag. 2021, 77, 15–22. [Google Scholar] [CrossRef]
  5. Gbadeyan, O.J.; Sibiya, L.; Linganiso, L.Z.; Deenadayalu, N. Waste-to-energy: The Recycling and Reuse of Sugar Industry Waste for Different Value-added Products Such as Bioenegy in Selected Countries—A Critical Review. Biofuels Bioprod. Biorefining 2024, 18, 1639–1657. [Google Scholar] [CrossRef]
  6. Kirthiga, R.; Elavenil, S. Potential Utilization of Sugarcane Bagasse Ash in Cementitious Composites for Developing Inorganic Binder. Ain Shams Eng. J. 2023, 14, 102560. [Google Scholar] [CrossRef]
  7. Dhanapala, S.; Nilmalgoda, H.; Gunathilake, M.B.; Rathnayake, U.; Wimalasiri, E.M. Energy Balance Assessment in Agricultural Systems; An Approach to Diversification. AgriEngineering 2023, 5, 950–964. [Google Scholar] [CrossRef]
  8. Tripathi, M.; Sahu, J.N.; Ganesan, P. Effect of Process Parameters on Production of Biochar from Biomass Waste through Pyrolysis: A Review. Renew. Sustain. Energy Rev. 2016, 55, 467–481. [Google Scholar] [CrossRef]
  9. Dai, Y.; Zheng, H.; Jiang, Z.; Xing, B. Combined Effects of Biochar Properties and Soil Conditions on Plant Growth: A Meta-Analysis. Sci. Total Environ. 2020, 713, 136635. [Google Scholar] [CrossRef]
  10. Izilan, N.I.S.; Sari, N.A.; Othman, N.M.I.; Mustaffha, S. The Effects of Biochar-Compost on Soil Properties and Plant Growth Performance Grown in a Sandy-Loam Soil. IOP Conf. Ser. Earth Environ. Sci. 2022, 1059, 012021. [Google Scholar] [CrossRef]
  11. Ho, T.T.K.; Tra, V.T.; Le, T.H.; Nguyen, N.-K.-Q.; Tran, C.-S.; Nguyen, P.-T.; Vo, T.-D.-H.; Thai, V.-N.; Bui, X.-T. Compost to Improve Sustainable Soil Cultivation and Crop Productivity. Case Stud. Chem. Environ. Eng. 2022, 6, 100211. [Google Scholar] [CrossRef]
  12. Nazzal, J.M. Influence of Heating Rate on the Pyrolysis of Jordan Oil Shale. J. Anal. Appl. Pyrolysis 2002, 62, 225–238. [Google Scholar] [CrossRef]
  13. Ighalo, J.O.; Ohoro, C.R.; Ojukwu, V.E.; Oniye, M.; Shaikh, W.A.; Biswas, J.K.; Seth, C.S.; Mohan, G.B.M.; Chandran, S.A.; Rangabhashiyam, S. Biochar for Ameliorating Soil Fertility and Microbial Diversity: From Production to Action of the Black Gold. iScience 2025, 28, 111524. [Google Scholar] [CrossRef]
  14. Wolf, M.K.; Wiesmeier, M.; Macholdt, J. Importance of Soil Fertility for Climate-Resilient Cropping Systems: The Farmer’s Perspective. Soil Secur. 2023, 13, 100119. [Google Scholar] [CrossRef]
  15. Nguyen, M.K.; Lin, C.; Hoang, H.G.; Sanderson, P.; Dang, B.T.; Bui, X.T.; Nguyen, N.S.H.; Vo, D.-V.N.; Tran, H.T. Evaluate the Role of Biochar during the Organic Waste Composting Process: A Critical Review. Chemosphere 2022, 299, 134488. [Google Scholar] [CrossRef]
  16. Yusuf, M.; Sarjiyah, S.; Mulyono, M. Effects of Appropriate Composition of Sugarcane Bagasse Compost and Nitrogen Fertilizer on the Growth and Yield of Soybean (Glycine max L. Merill). In Proceedings of the International Conference on Food, Agriculture and Natural Resources (FANRes 2018), Yogyakarta, Indonesia, 12–14 September 2018; Atlantis Press: Yogyakarta, Indonesia, 2018. [Google Scholar]
  17. Salman, M.; Inamullah; Jamal, A.; Mihoub, A.; Saeed, M.F.; Radicetti, E.; Ahmad, I.; Naeem, A.; Ullah, J.; Pampana, S. Composting Sugarcane Filter Mud with Different Sources Differently Benefits Sweet Maize. Agronomy 2023, 13, 748. [Google Scholar] [CrossRef]
  18. Sajid, U.; Aslam, S.; Hussain, A.; Mumtaz, T.; Kousar, S. Pressmud Compost for Improved Nitrogen and Phosphorus Content Employing Bacillus Strains. Recycling 2024, 9, 104. [Google Scholar] [CrossRef]
  19. Le, D.-H.; Sheen, Y.-N.; Lam, M.N.-T. Potential Utilization of Sugarcane Bagasse Ash for Developing Alkali-Activated Materials. J. Sustain. Cem. Based Mater. 2022, 11, 199–209. [Google Scholar] [CrossRef]
  20. Pathiraja, K.; Nilmalgoda, H.; Wijethunga, I.; Koswattage, K. Sustainable Management of Nitrile Butadiene Rubber Waste Through Pyrolysis. Sustainability 2025, 17, 846. [Google Scholar] [CrossRef]
  21. E48 Committee ASTM International. Practice for Preparation of Biomass for Compositional Analysis; ASTM: West Conshohocken, PA, USA, 2024. [Google Scholar] [CrossRef]
  22. D32 Committee ASTM International. Test Method for Surface Area of Catalysts and Catalyst Carriers; ASTM: West Conshohocken, PA, USA, 2020. [Google Scholar] [CrossRef]
  23. Djaman, K.; Allen, S.; Djaman, D.S.; Koudahe, K.; Irmak, S.; Puppala, N.; Darapuneni, M.K.; Angadi, S.V. Planting Date and Plant Density Effects on Maize Growth, Yield and Water Use Efficiency. Environ. Chall. 2022, 6, 100417. [Google Scholar] [CrossRef]
  24. Hilty, J.; Muller, B.; Pantin, F.; Leuzinger, S. Plant Growth: The What, the How, and the Why. New Phytol. 2021, 232, 25–41. [Google Scholar] [CrossRef] [PubMed]
  25. Wood, A.J.; Roper, J. A Simple & Nondestructive Technique for Measuring Plant Growth & Development. Am. Biol. Teach. 2000, 62, 215–217. [Google Scholar] [CrossRef]
  26. Jamil, N.; Kootstra, G.; Kooistra, L. Evaluation of Individual Plant Growth Estimation in an Intercropping Field with UAV Imagery. Agriculture 2022, 12, 102. [Google Scholar] [CrossRef]
  27. Shipley, B.; Vu, T. Dry Matter Content as a Measure of Dry Matter Concentration in Plants and Their Parts. New Phytol. 2002, 153, 359–364. [Google Scholar] [CrossRef]
  28. D19 Committee ASTM International. Test Methods for pH of Water; ASTM: West Conshohocken, PA, USA, 2018. [Google Scholar] [CrossRef]
  29. D18 Committee ASTM International. Test Methods for Laboratory Determination of Water (Moisture) Content of Soil and Rock by Mass; ASTM: West Conshohocken, PA, USA, 2019. [Google Scholar] [CrossRef]
  30. D18 Committee ASTM International. Test Method for Total Nitrogen in Peat Materials; ASTM: West Conshohocken, PA, USA, 2023. [Google Scholar] [CrossRef]
  31. D19 Committee ASTM International. Specification for Reagent Water; ASTM: West Conshohocken, PA, USA, 2024. [Google Scholar] [CrossRef]
  32. D22 Committee ASTM International. Test Method for Determination of Calcium, Magnesium, Potassium, and Sodium in Atmospheric Wet Deposition by Flame Atomic Absorption Spectrophotometry; ASTM: West Conshohocken, PA, USA, 2024. [Google Scholar] [CrossRef]
  33. D18 Committee ASTM International. Test Method for Diagnostic Soil Test for Plant Growth and Food Chain Protection; ASTM: West Conshohocken, PA, USA, 2013. [Google Scholar] [CrossRef]
  34. Ansar, A.; Du, J.; Javed, Q.; Adnan, M.; Javaid, I. Biodegradable Waste in Compost Production: A Review of Its Economic Potential. Nitrogen 2025, 6, 24. [Google Scholar] [CrossRef]
  35. Samsudin, M.H.; Hassan, M.A.; Idris, J.; Ramli, N.; Mohd Yusoff, M.Z.; Ibrahim, I.; Othman, M.R.; Mohd Ali, A.A.; Shirai, Y. A One-Step Self-Sustained Low Temperature Carbonization of Coconut Shell Biomass Produced a High Specific Surface Area Biochar-Derived Nano-Adsorbent. Waste Manag. Res. 2019, 37, 551–555. [Google Scholar] [CrossRef]
  36. Shaaban, A.; Se, S.-M.; Mitan, N.M.M.; Dimin, M.F. Characterization of Biochar Derived from Rubber Wood Sawdust through Slow Pyrolysis on Surface Porosities and Functional Groups. Procedia Eng. 2013, 68, 365–371. [Google Scholar] [CrossRef]
  37. Li, Y.; Shabir, R.; Rashti, M.R.; Megharaj, M.; Chen, C. Cow Manure Compost-based Products as Alternative Rhizobial Carrier Materials. Land Degrad. Dev. 2023, 34, 4768–4780. [Google Scholar] [CrossRef]
  38. Aji, N.A.S.; Yaser, A.Z.; Lamaming, J.; Aqeela, N.; Ugak, M.A.M.; Saalah, S.; Rajin, M. Production of Food Waste Compost and Its Effect on the Growth of Dwarf Crape Jasmine. J. Kejuruter. 2021, 33, 413–424. [Google Scholar] [CrossRef]
  39. Oyege, I.; Balaji Bhaskar, M.S. Effects of Vermicompost on Soil and Plant Health and Promoting Sustainable Agriculture. Soil Syst. 2023, 7, 101. [Google Scholar] [CrossRef]
  40. Kelley, A.; Wilkie, A.C.; Maltais-Landry, G. Food-Based Composts Provide More Soil Fertility Benefits Than Cow Manure-Based Composts in Sandy Soils. Agriculture 2020, 10, 69. [Google Scholar] [CrossRef]
  41. Zhang, L.; Ren, J.; Bai, W. A Review of Poultry Waste-to-Wealth: Technological Progress, Modeling and Simulation Studies, and Economic- Environmental and Social Sustainability. Sustainability 2023, 15, 5620. [Google Scholar] [CrossRef]
  42. Nogalska, A.; Załuszniewska, A. The Effect of Meat and Bone Meal (MBM) on Crop Yields, Nitrogen Content and Uptake, and Soil Mineral Nitrogen Balance. Agronomy 2021, 11, 2307. [Google Scholar] [CrossRef]
  43. Kusuma, I.D.G.C.; Suriani, N.L.; Ramona, Y. The Use of Fish Waste Based Organic Fertilizer to Improve the Growth of Balinese Red Rice (Oryza Sativa L Cv. Barak Cenana). Asian J. Appl. Res. Community Dev. Empower. 2021, 5, 13–18. [Google Scholar] [CrossRef]
  44. Tangaraj, K.; Jayasri, M.A. Systematic Study on the Effect of Seaweed Fertilizer on the Growth and Yield of Vigna radiata (L.) R. Wilczek (Mung Bean). J. Agric. Food Res. 2023, 14, 100748. [Google Scholar] [CrossRef]
  45. Iqbal, W.; Khan, A.; Jamal, A.; Radicetti, E.; Elsadek, M.F.; Ali, M.A.; Mancinelli, R. Optimizing Maize Productivity and Soil Fertility: Insights from Tillage, Nitrogen Management, and Hydrochar Applications. Land 2024, 13, 1329. [Google Scholar] [CrossRef]
  46. Zhai, J.; Zhang, Y.; Zhang, G.; Xu, W.; Xie, R.; Ming, B.; Hou, P.; Wang, K.; Xue, J.; Li, S. Nitrogen Application and Dense Planting to Obtain High Yields from Maize. Agronomy 2022, 12, 1308. [Google Scholar] [CrossRef]
  47. Zanão, L.A., Jr.; Arf, O.; Reis, R.D.A., Jr.; Pereira, N. Phosphorus Fertilization with Enhanced Efficiency in Soybean and Corn Crops. Aust. J. Crop Sci. 2020, 14, 78–84. [Google Scholar] [CrossRef]
  48. Izydorczyk, G.; Skrzypczak, D.; Mironiuk, M.; Mikula, K.; Samoraj, M.; Gil, F.; Taf, R.; Moustakas, K.; Chojnacka, K. Lignocellulosic Biomass Fertilizers: Production, Characterization, and Agri-Applications. Sci. Total Environ. 2024, 923, 171343. [Google Scholar] [CrossRef]
  49. Sakhong, R.; Kehokhunu; Kacho, N.F.; Pande, K.K.; Solanki, P.; Kumari, S. Agronomic Bio-Fortification of Cereals with Zinc to Overcome the Malnutrition from Indian Population. Agric. Arch. 2024, 3, 30–34. [Google Scholar] [CrossRef]
  50. Mirfattahi, Z.; Eshghi, S. Inducing Salt Tolerance in Strawberry (Fragaria × Ananassa Duch) Plants by Acetate Application. J. Plant Nutr. 2020, 43, 1780–1793. [Google Scholar] [CrossRef]
  51. Bekchanova, M.; Campion, L.; Bruns, S.; Kuppens, T.; Lehmann, J.; Jozefczak, M.; Cuypers, A.; Malina, R. Biochar Improves the Nutrient Cycle in Sandy-Textured Soils and Increases Crop Yield: A Systematic Review. Environ. Evid. 2024, 13, 3. [Google Scholar] [CrossRef] [PubMed]
  52. Zhang, N.; Xing, J.; Wei, L.; Liu, C.; Zhao, W.; Liu, Z.; Wang, Y.; Liu, E.; Ren, X.; Jia, Z.; et al. The Potential of Biochar to Mitigate Soil Acidification: A Global Meta-Analysis. Biochar 2025, 7, 49. [Google Scholar] [CrossRef]
  53. Xu, L.; Wu, K.-C.; Deng, Z.-N.; Huang, C.-M.; Verma, K.K.; Pang, T.; Huang, H.-R. Biochar and Its Impact on Soil Profile and Plant Development. J. Plant Interact. 2024, 19, 2401356. [Google Scholar] [CrossRef]
  54. Bridhikitti, A.; Kaewsuk, J.; Karaket, N.; Friend, R.; Sallach, B.; Chong, J.P.J.; Redeker, K.R. Balancing Agriculture and Industry through Waste Utilization for Sugarcane Sustainability. Sustainability 2023, 15, 14711. [Google Scholar] [CrossRef]
  55. Bano, S.; Singh, K.; Chaudhary, A.; Chandra, R. Innovative Methods for the Valorisation of Solid Wastes from Sugar Mill and Refineries for Sustainable Development: A Review. Clean. Waste Syst. 2025, 10, 100230. [Google Scholar] [CrossRef]
  56. Zainudin, M.H.M.; Zulkarnain, A.; Azmi, A.S.; Muniandy, S.; Sakai, K.; Shirai, Y.; Hassan, M.A. Enhancement of Agro-Industrial Waste Composting Process via the Microbial Inoculation: A Brief Review. Agronomy 2022, 12, 198. [Google Scholar] [CrossRef]
  57. Lansakara, M. Labour Migration Research on Sri Lanka: What Do We Know? What Don’t We Know? 1st ed.; ILO: Colombo, Sri Lanka, 2022; ISBN 978-92-2-037692-8. [Google Scholar]
  58. Dharmasiri, L.M. Waste Management in Sri Lanka: Challenges and Opportunities. Sri Lanka J. Adv. Soc. Stud. 2019, 9, 72. [Google Scholar] [CrossRef]
Figure 1. RCBD method implementation in the greenhouse.
Biomass 05 00039 g001
Figure 2. Different plant heights according to the treatments (T1 (far left) to T20 (far right)).
Biomass 05 00039 g002
Figure 3. Effect of the growing media on maize plant height (A, B, C, D—Tukey grouping; error bars indicate standard error).
Biomass 05 00039 g003
Figure 4. Effect of the growing media on the average number of leaves. (A, B, C—Tukey grouping; error bars indicate standard error).
Biomass 05 00039 g004
Figure 5. Effect of the growing media on the average girth of plants. (A, B—Tukey grouping; error bars indicate standard error).
Biomass 05 00039 g005
Figure 6. Effect of the growing media on maize plant average AGDM. (A, B, C, D, E, F, and G—Tukey grouping; error bars indicate standard error).
Biomass 05 00039 g006
Figure 7. Different dry matter accumulation in root systems.
Biomass 05 00039 g007
Figure 8. Effect of the growing media on maize plant average BGDM. (A, B, C, D, E, F, G, and H—Tukey grouping; error bars indicate standard error).
Biomass 05 00039 g008
Table 2. Treatment compositions with biochar incorporation.
TreatmentComposition
T1Bagasse
T2Bagasse + Boiler Ash (1:1)
T3Bagasse + Boiler Ash + Spent Wash (2:1:1)
T4Bagasse + Cane Tops (1:1)
T5Bagasse + Boiler Ash + Spent Wash + Cane Tops (3:1:1:1)
T6Bagasse + Spent Wash (1:1)
T7T1 + 10% Biochar
T8T2 + 10% Biochar
T9T3 + 10% Biochar
T10T4 + 10% Biochar
T11T5 + 10% Biochar
T12T6 + 10% Biochar
T13T1 + 20% Biochar
T14T2 + 20% Biochar
T15T3 + 20% Biochar
T16T4 + 20% Biochar
T17T5 + 20% Biochar
T18T6 + 20% Biochar
T19 (Control 1)Commercial Organic Fertilizer + Topsoil (1:1)
T20 (Control 2)Topsoil
Table 3. Parameters analyzed, instruments used, and standard methods for calibration.
ParameterInstrumentStandard MethodDetection Limit
pHpH meterASTM D1293-12 [28]0.1 pH unit
EC levelEC meterASTM D1293-12 [28]0.01 dS/m
Moisture contentOven, Weighting balanceASTM D2216-10 [29]0.01%
C/N ratioKjeldahl apparatus, Muffle furnace, Analytical balance
Macronutrient (N)Kjeldahl apparatusASTM D2973-23 [30]0.05%
Macronutrient (P)SpectrophotometerASTM D1193-91 [31]0.02%
Macronutrient (K)SpectrophotometerASTM D5086-20 [32]0.01%
Micronutrients (Zn)SpectrophotometerASTM D5435-13 [33]5 mg/kg
Table 4. Physical and chemical properties of biochar produced from coconut shells at 450 °C.
PropertyResult
Particle Size1.00 mm to 3.00 mm (majority)
Bulk Density0.50 g/cm3
Porosity70.00%
pH9.37 ± 0.16
Cation Exchange Capacity (CEC)25.00 cmol (+)/kg
Ash Content18.00 ± 1.25%
Surface Area144.58 m2/g
Elemental Composition (%)
Carbon (C)68.50
Hydrogen (H)4.50
Nitrogen (N)6.00
Oxygen (O)25.30
Sulfur (S)0.20
Phosphorus (P)0.10
Total Organic Carbon (TOC)85.00
Table 5. ANOVA for plant height at 44 days.
SourceType III SSdfMean SquareFp (Sig.)
Treatment23,469.55191235.2419.514<0.001
Error2532.004063.3
Total107,292.75060
Corrected Total26,001.5559
Table 6. ANOVA for number of leaves at 20 days.
SourceType III SSdfMS (Mean Square)Fp (Sig.)
Treatment225.0671911.84614.505<0.001
Error32.667400.817
Total171860
Corrected Total257.73359
Table 7. ANOVA for plant girth at 44 days.
SourceType III Sum of SquaresdfMS (Mean Square)Fp (Sig.)
Intercept59,242.41159,242.411707.52<0.001
Treatment8818.7919464.14713.378<0.001
Error1387.804034.695
Table 8. ANOVA for AGDM production at 44 days.
SourceType III Sum of SquaresdfMean SquareFp-Value
Intercept488.7721488.7721977.57<0.001
Treatment984.1331951.796209.57<0.001
Error9.886400.247
Total1482.79160
Table 9. ANOVA for BGDM production in 44 days.
SourceType III Sum of SquaresdfMean SquareFSig.
Intercept59.141159.1412251.449<0.001
Treatment65.505193.448131.249<0.001
Error1.051400.026
Total125.69660
Table 10. Nutrient composition of T17 and other organic fertilizers.
Organic Fertilizer OriginN (%)P (%)K (%)Na (%)Mg (%)Ca (%)Zn (mg/kg)Reference
Sugarcane Bagasse (T17)1.85 ± 0.15 (CV 8%)1.12 ± 0.09 (CV 8%)2.85 ± 0.23 (CV 8%)0.20 ± 0.02 (CV 12%)0.27 ± 0.03 (CV 12%)0.23 ± 0.03 (CV 12%)130 ± 13 (CV 10%)Current Study
Food Waste Compost2.100.851.750.350.503.0090.00[38]
Vermicompost2.401.502.000.450.754.20120.00[39]
Cow Manure1.751.001.800.300.603.5075.00[40]
Chicken Manure3.502.251.750.750.854.80180.00[41]
Bone Meal3.5011.000.750.200.3520.0055.00[42]
Fish Emulsion4.502.502.000.550.802.50110.00[43]
Seaweed Fertilizer2.001.754.002.251.402.75150.00[44]
CV = coefficient of variation.
Table 11. Nutrient and micronutrient levels before and after the addition of T17 to the soil.
NutrientBefore T17 AdditionAfter T17 Addition
Nitrogen (N)0.18%0.22%
Phosphorus (P)0.08%0.12%
Potassium (K)0.18%0.25%
Sodium (Na)0.03%0.07%
Magnesium (Mg)0.08%0.12%
Calcium (Ca)0.15%0.23%
Zinc (Zn)35 mg/kg75 mg/kg
pH5.26.00%
CEC15.0 cmol/kg18.7 cmol/kg
Table 12. Cost comparison of traditional waste management vs. composting with biochar enrichment in sugar industry.
CategoryTraditional MethodCompostingReference
Total Raw Material Used (MT/year)1.75 M MT1.75 M MT[54]
Collection and Transportation Cost (USD/year)$4.15 M$2.77 M[55]
Processing Cost (USD/year)$6.23 M$11.08 M[56]
Labor Cost (USD/year)$3.54 M$6.15 M[57]
Storage and Handling Cost (USD/year)$2.35 M$3.46 M[56]
Pollution Control and Compliance (USD/year)$3.05 MMinimal[58]
Total Cost (USD/year)$19.32 M$23.46 M
Revenue from Product Sales (USD/year)$0$34.62 M
Net Profit/(Loss) (USD/year)(−$19.32 M)—Loss+$11.16 M—Profit
Outcomes
Environmental ImpactHigh (Air, soil, and water pollution, CO2 emissions)Low (Carbon sequestration, soil improvement, reduced waste)[56]
Nutrient RecyclingMinimal (Nutrients lost in waste disposal)High (N, P, K, Ca, Zn recycled into soil)[55,58]
Soil Fertility ImpactNegative (Leads to degradation, loss of organic matter)Positive (Enhances soil structure, water retention, and microbial activity)[54]
SustainabilityUnsustainable (Wastes resources, requires continuous disposal costs)Highly sustainable (Circular economy model, reduces dependence on chemical fertilizers)[58]
USD = 325 LKR.
Disclaimer/Publisher’s Note: The statements, opinions and data contained in all publications are solely those of the individual author(s) and contributor(s) and not of MDPI and/or the editor(s). MDPI and/or the editor(s) disclaim responsibility for any injury to people or property resulting from any ideas, methods, instructions or products referred to in the content.

